Modeling of Inclusion Capture in a Steel Slab Caster with Vertical Section and Bending


Abstract
1. Introduction
2. Computational Modeling
2.1. Turbulent Molten-Steel Flow: RANS Standard k-ɛ Model
2.2. Inclusion Particle Transport: DPM Model
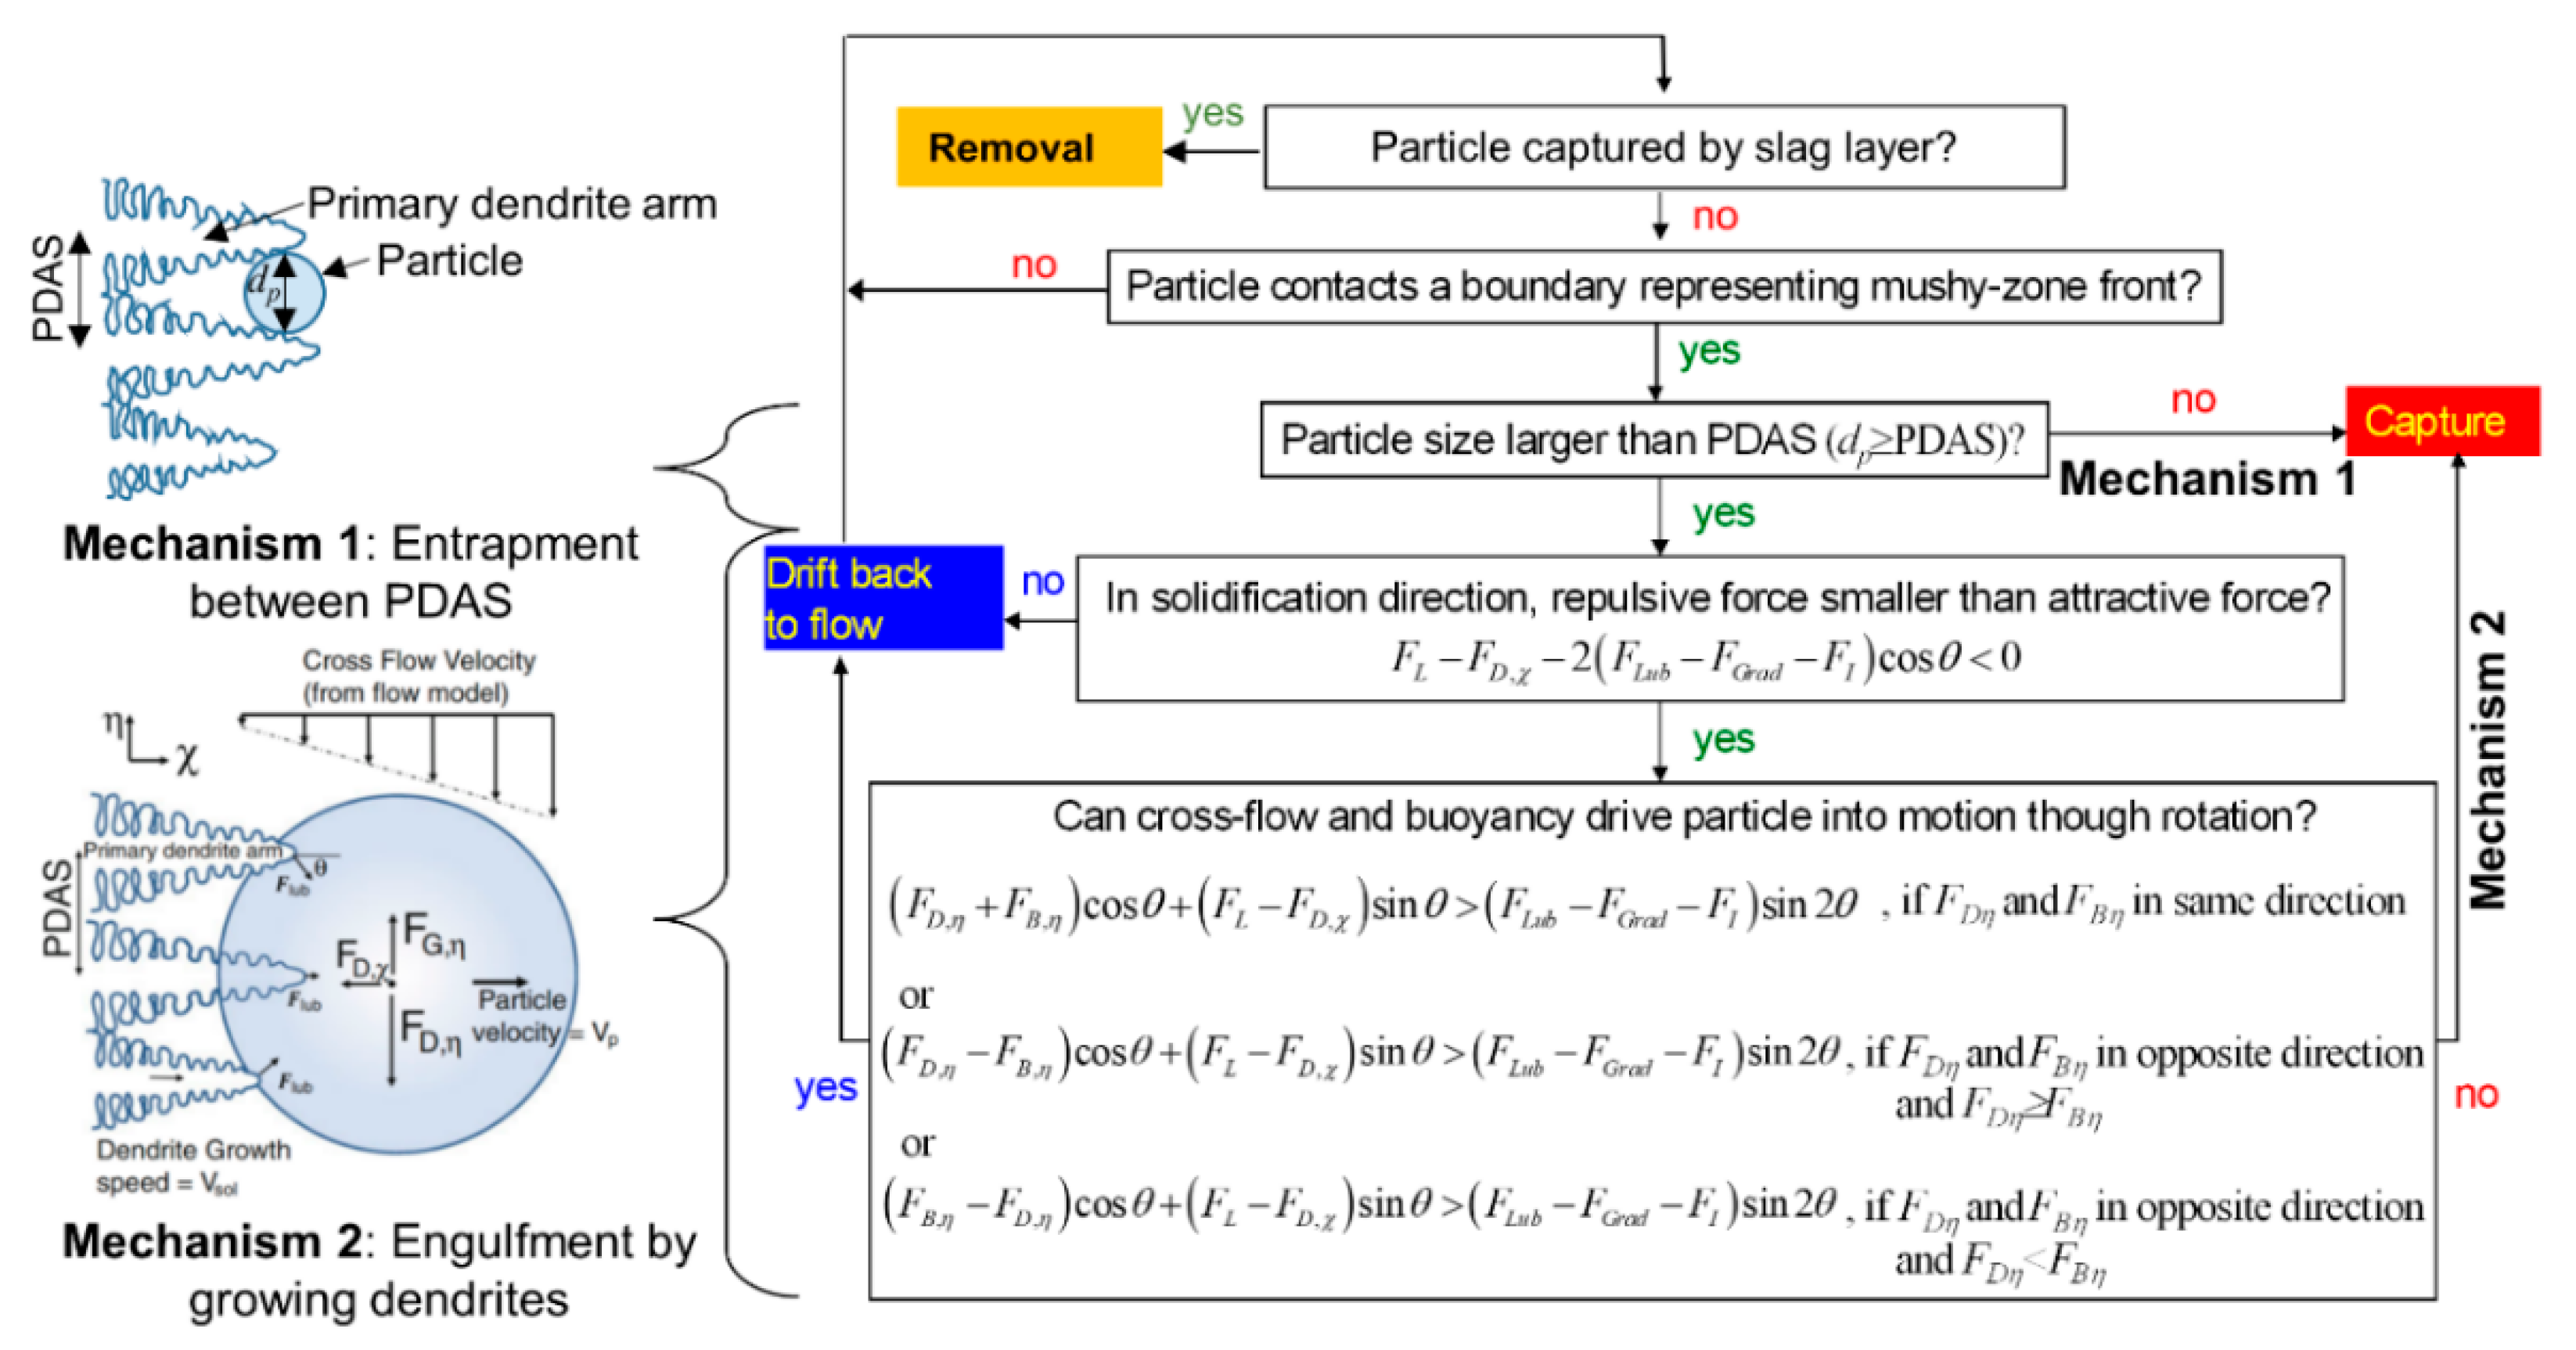
2.3. Inclusion Particle Capture: Advanced Capture Criterion
2.4. Numerical Details
2.5. Postprocessing of Capture Model Results: Capture Rates in Slab Product
3. Plant Measurements of Particle Capture: Ultrasonic Testing
4. Results and Discussion
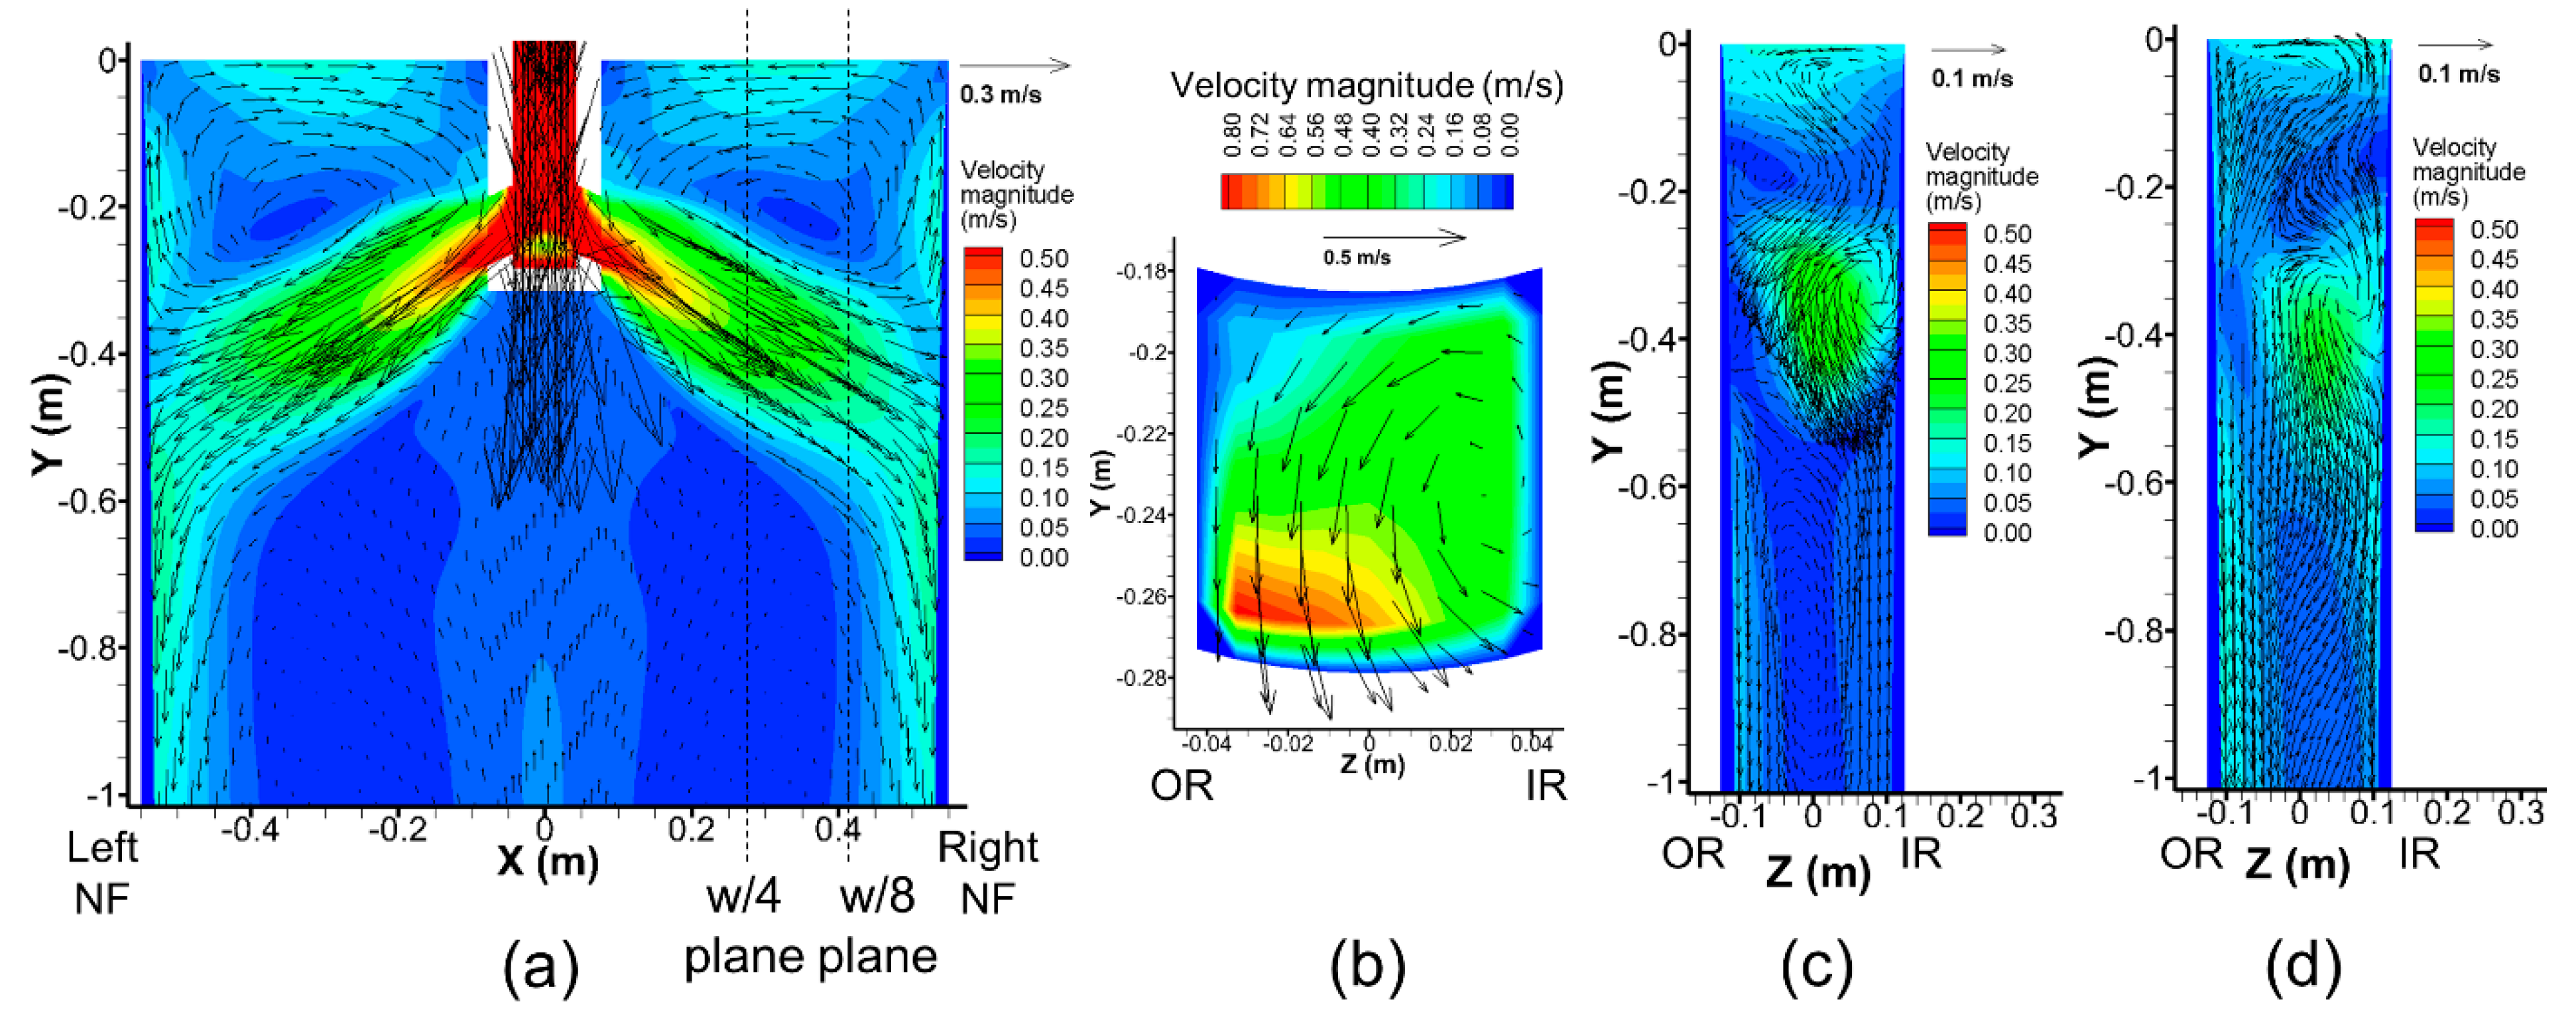
4.1. Molten-Steel Flow in Mold and Strand
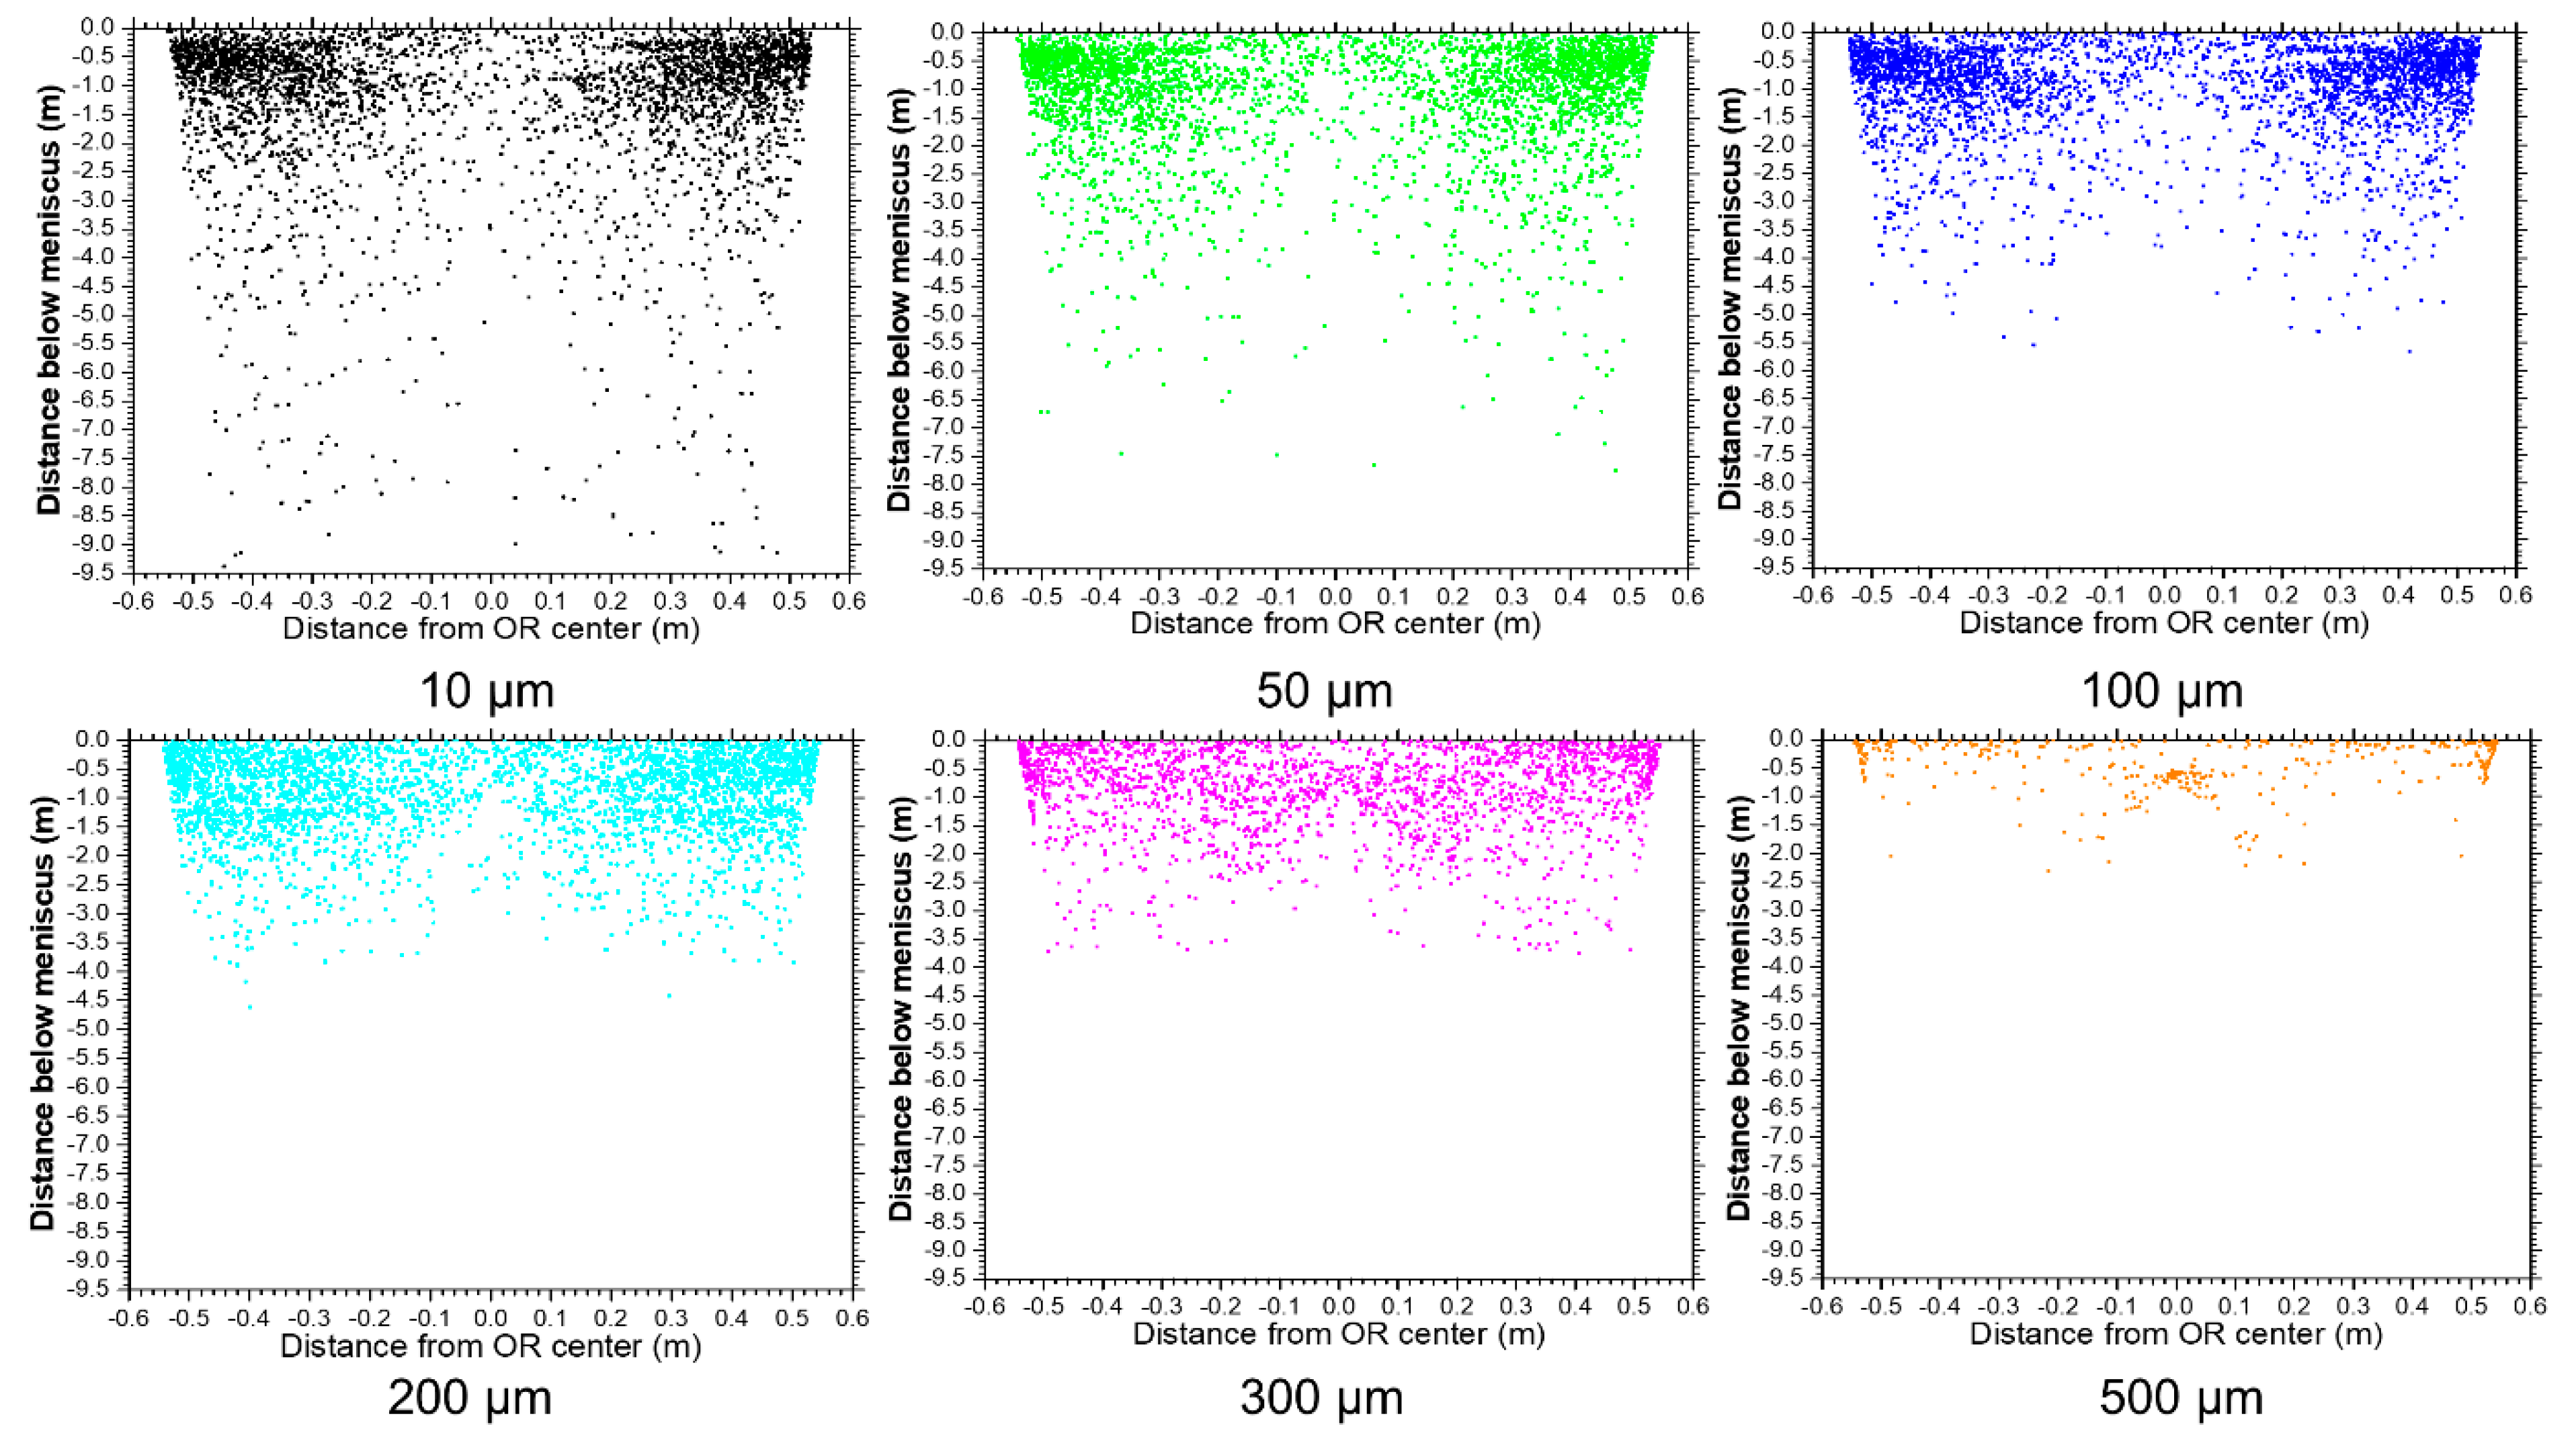
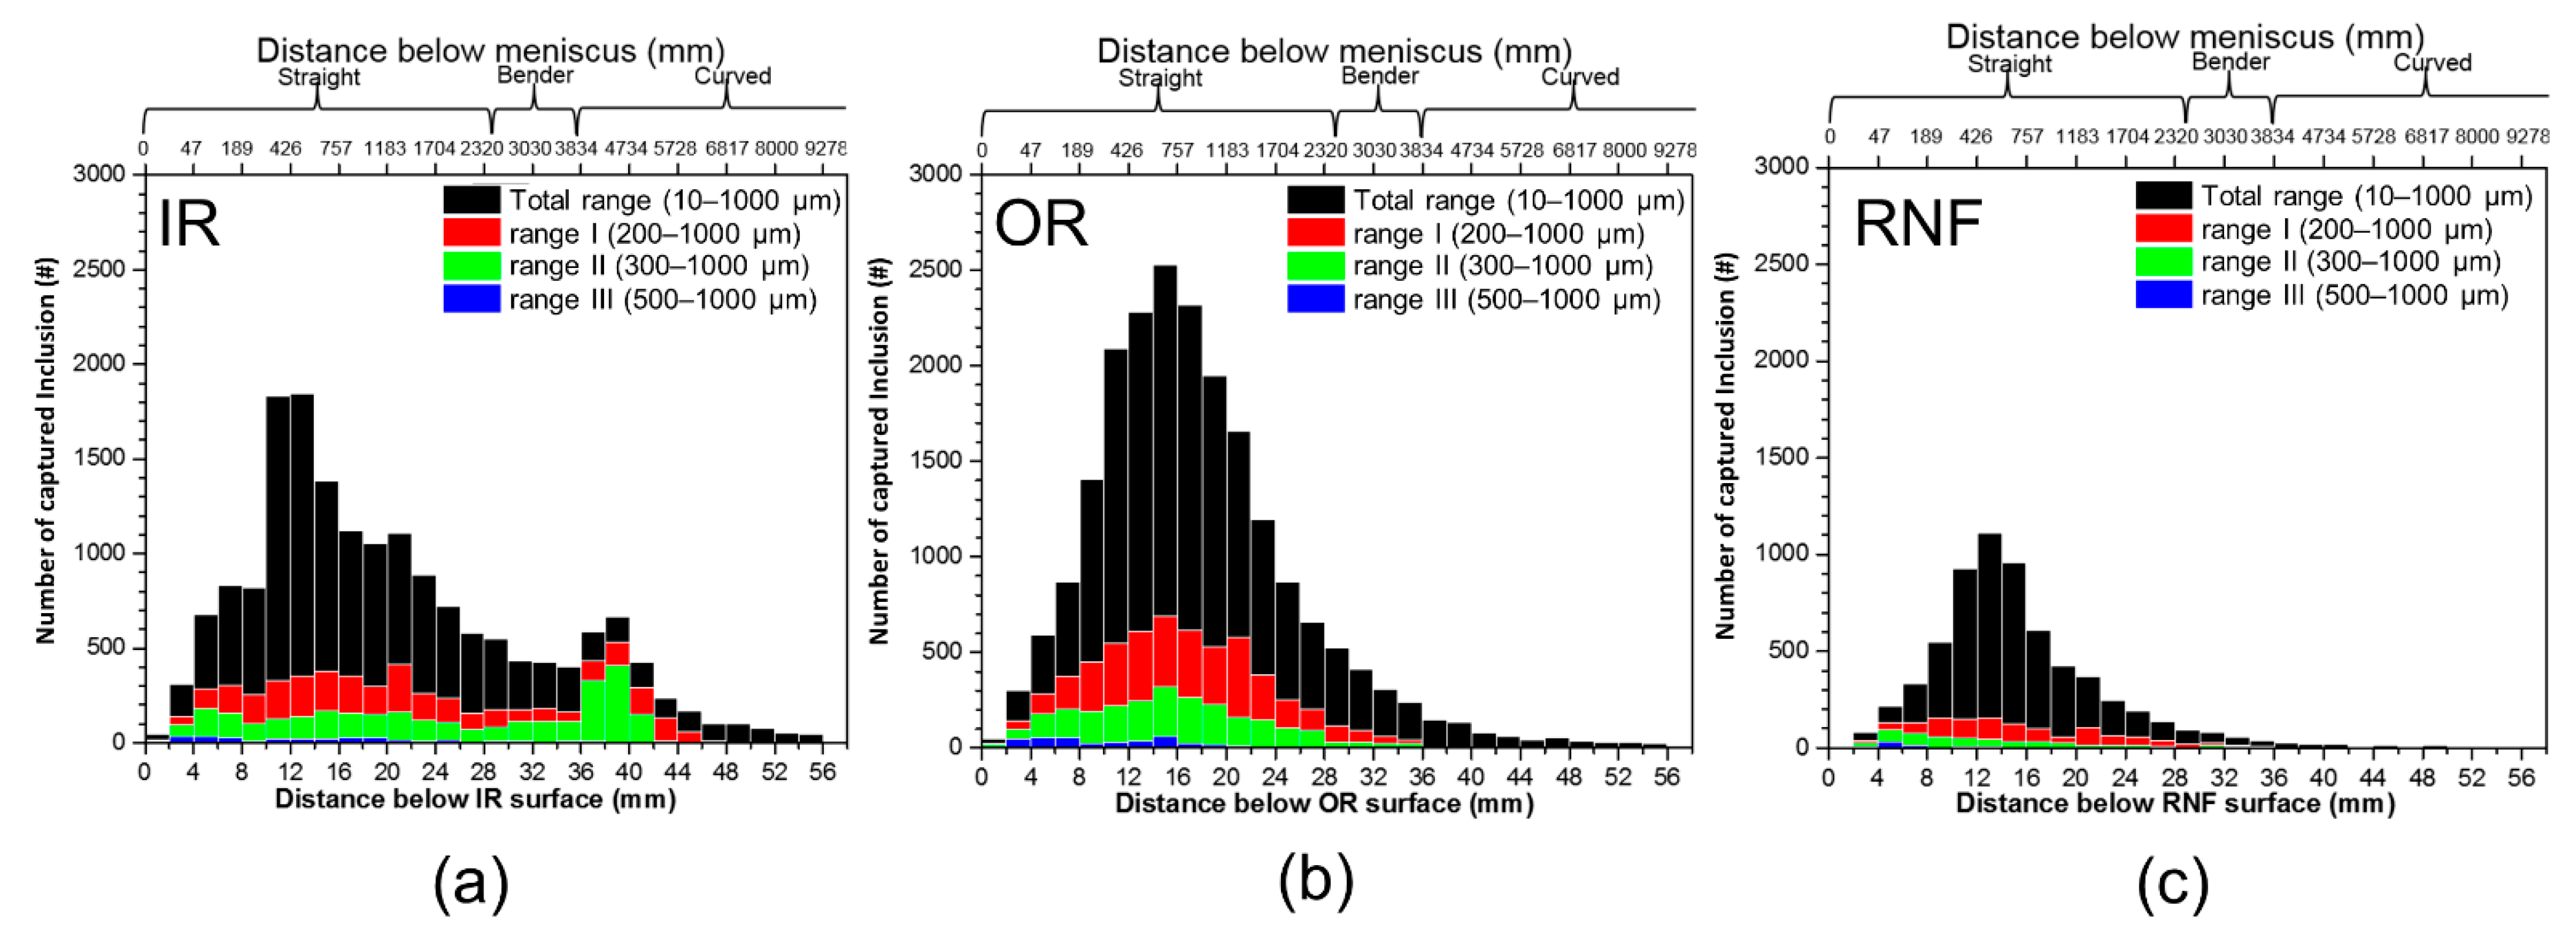
4.2. Distribution of Captured Inclusions
4.3. Model Validation with Plant Measurements of Captured Inclusions
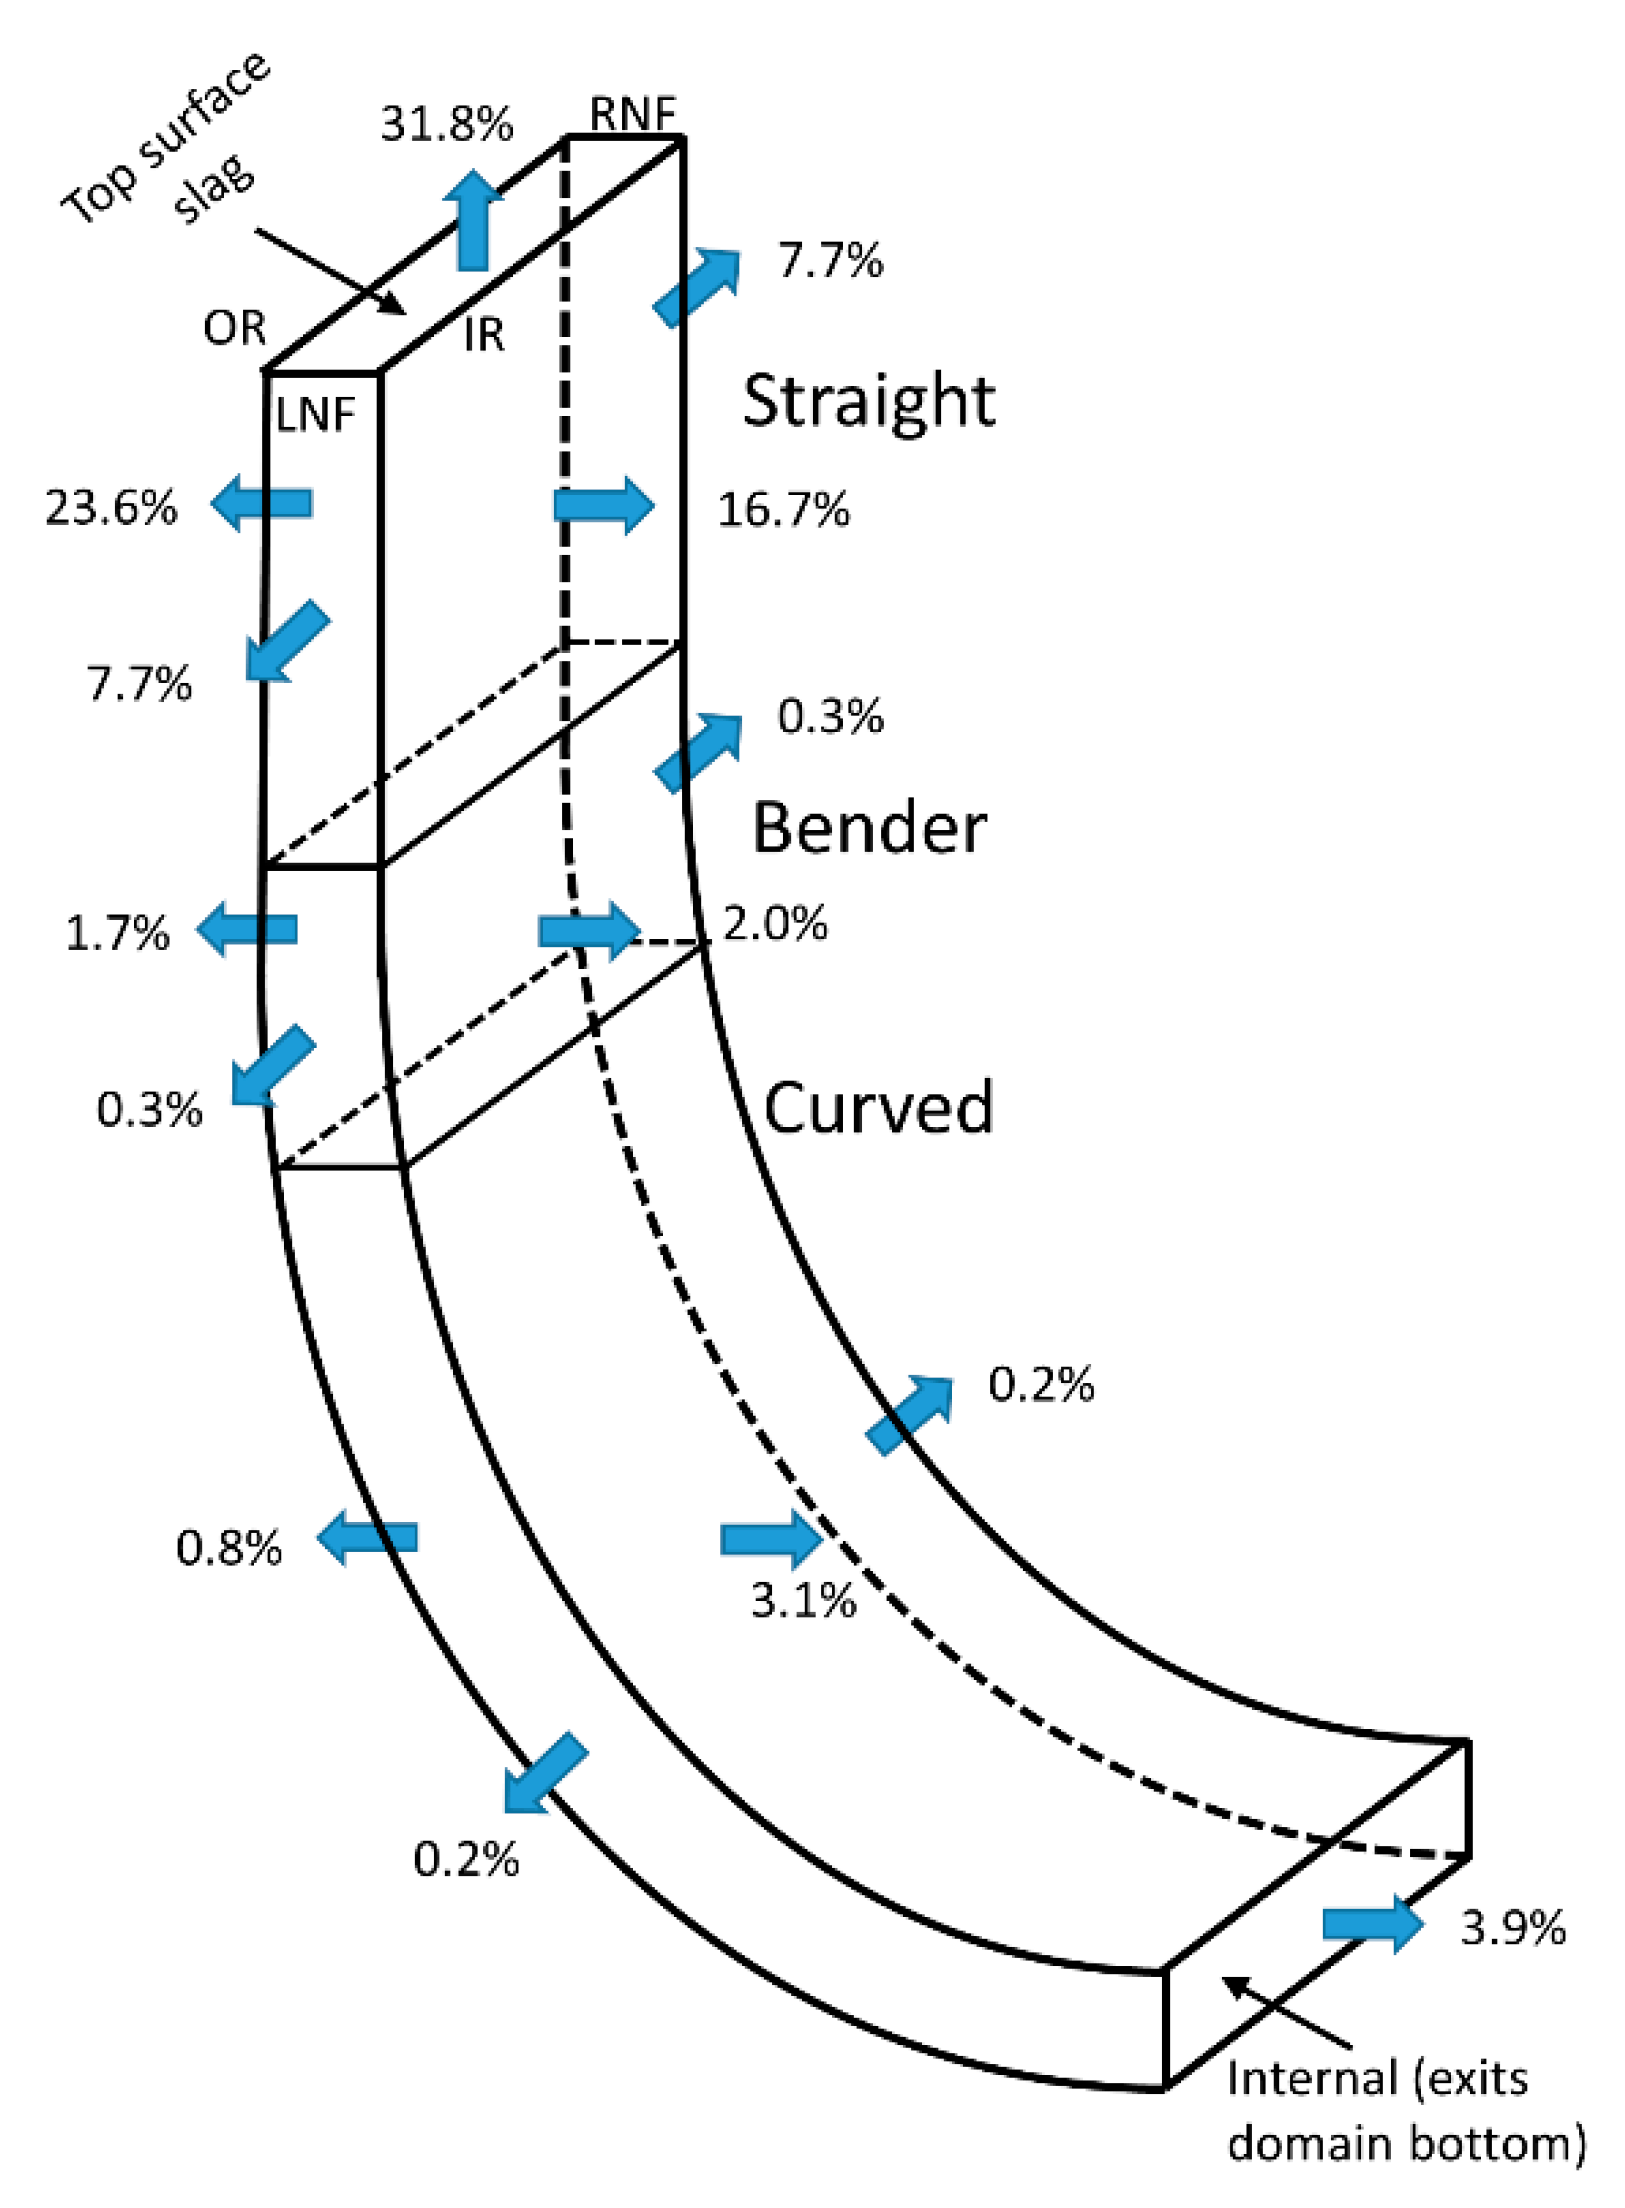
4.4. Inclusion Capture Fractions
4.5. Inclusion Capture Mechanisms
4.6. Future Work
5. Conclusions
- The advanced capture criterion including particle capture mechanisms due to both (1) entrapment between Primary Dendrite Arm Spacing (PDAS) and (2) engulfment by growing dendrites, is capable of accurately predicting the locations and size distributions of inclusion particles captured into the steel shell during continuous casting, including the important capture of large inclusions deep into the strand.
- A new methodology of postprocessing the predicted particle capture results has been developed to enable quantitative, accurate calculation of actual capture rates in the steel slab, based on statistically-reliable numbers of inclusions with reasonable computational burden.
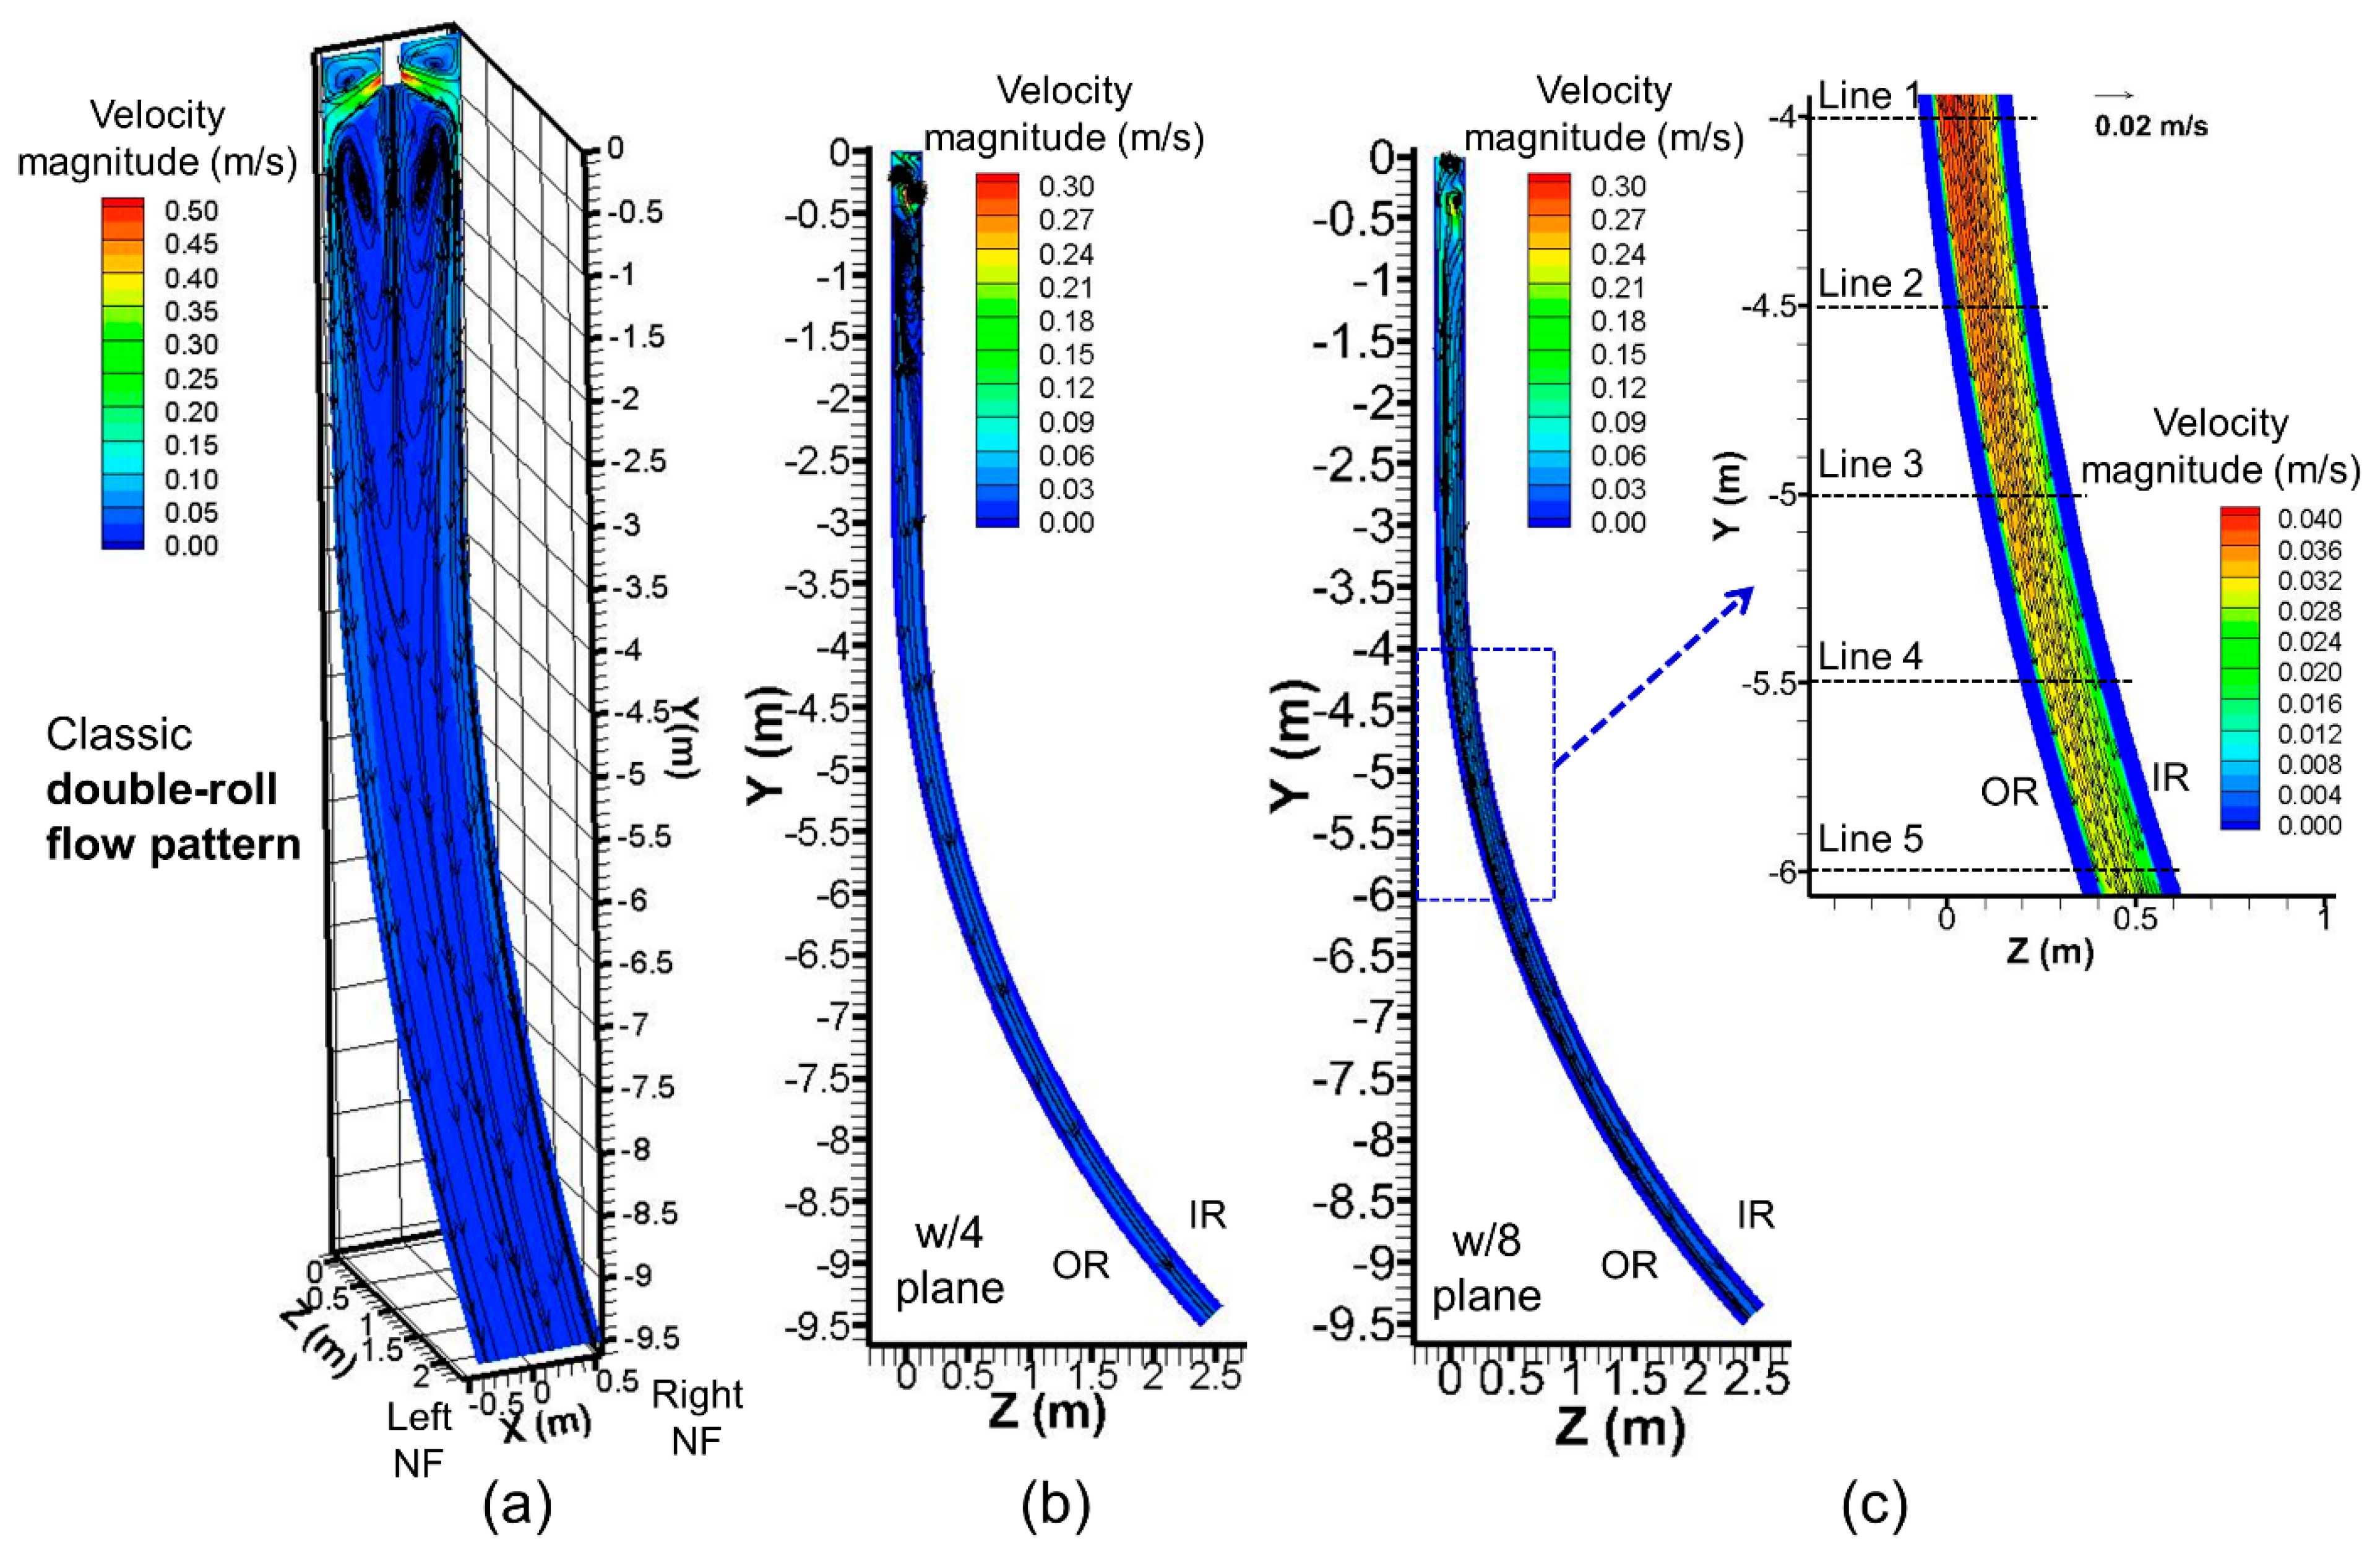
- The straight-curved strand casting of steel slabs produces a classic double-roll flow pattern with a maximum surface velocity (~0.2 m/s) almost within the safe operation window, and strong flow (~0.3 m/s) down the narrow faces in the mold region.
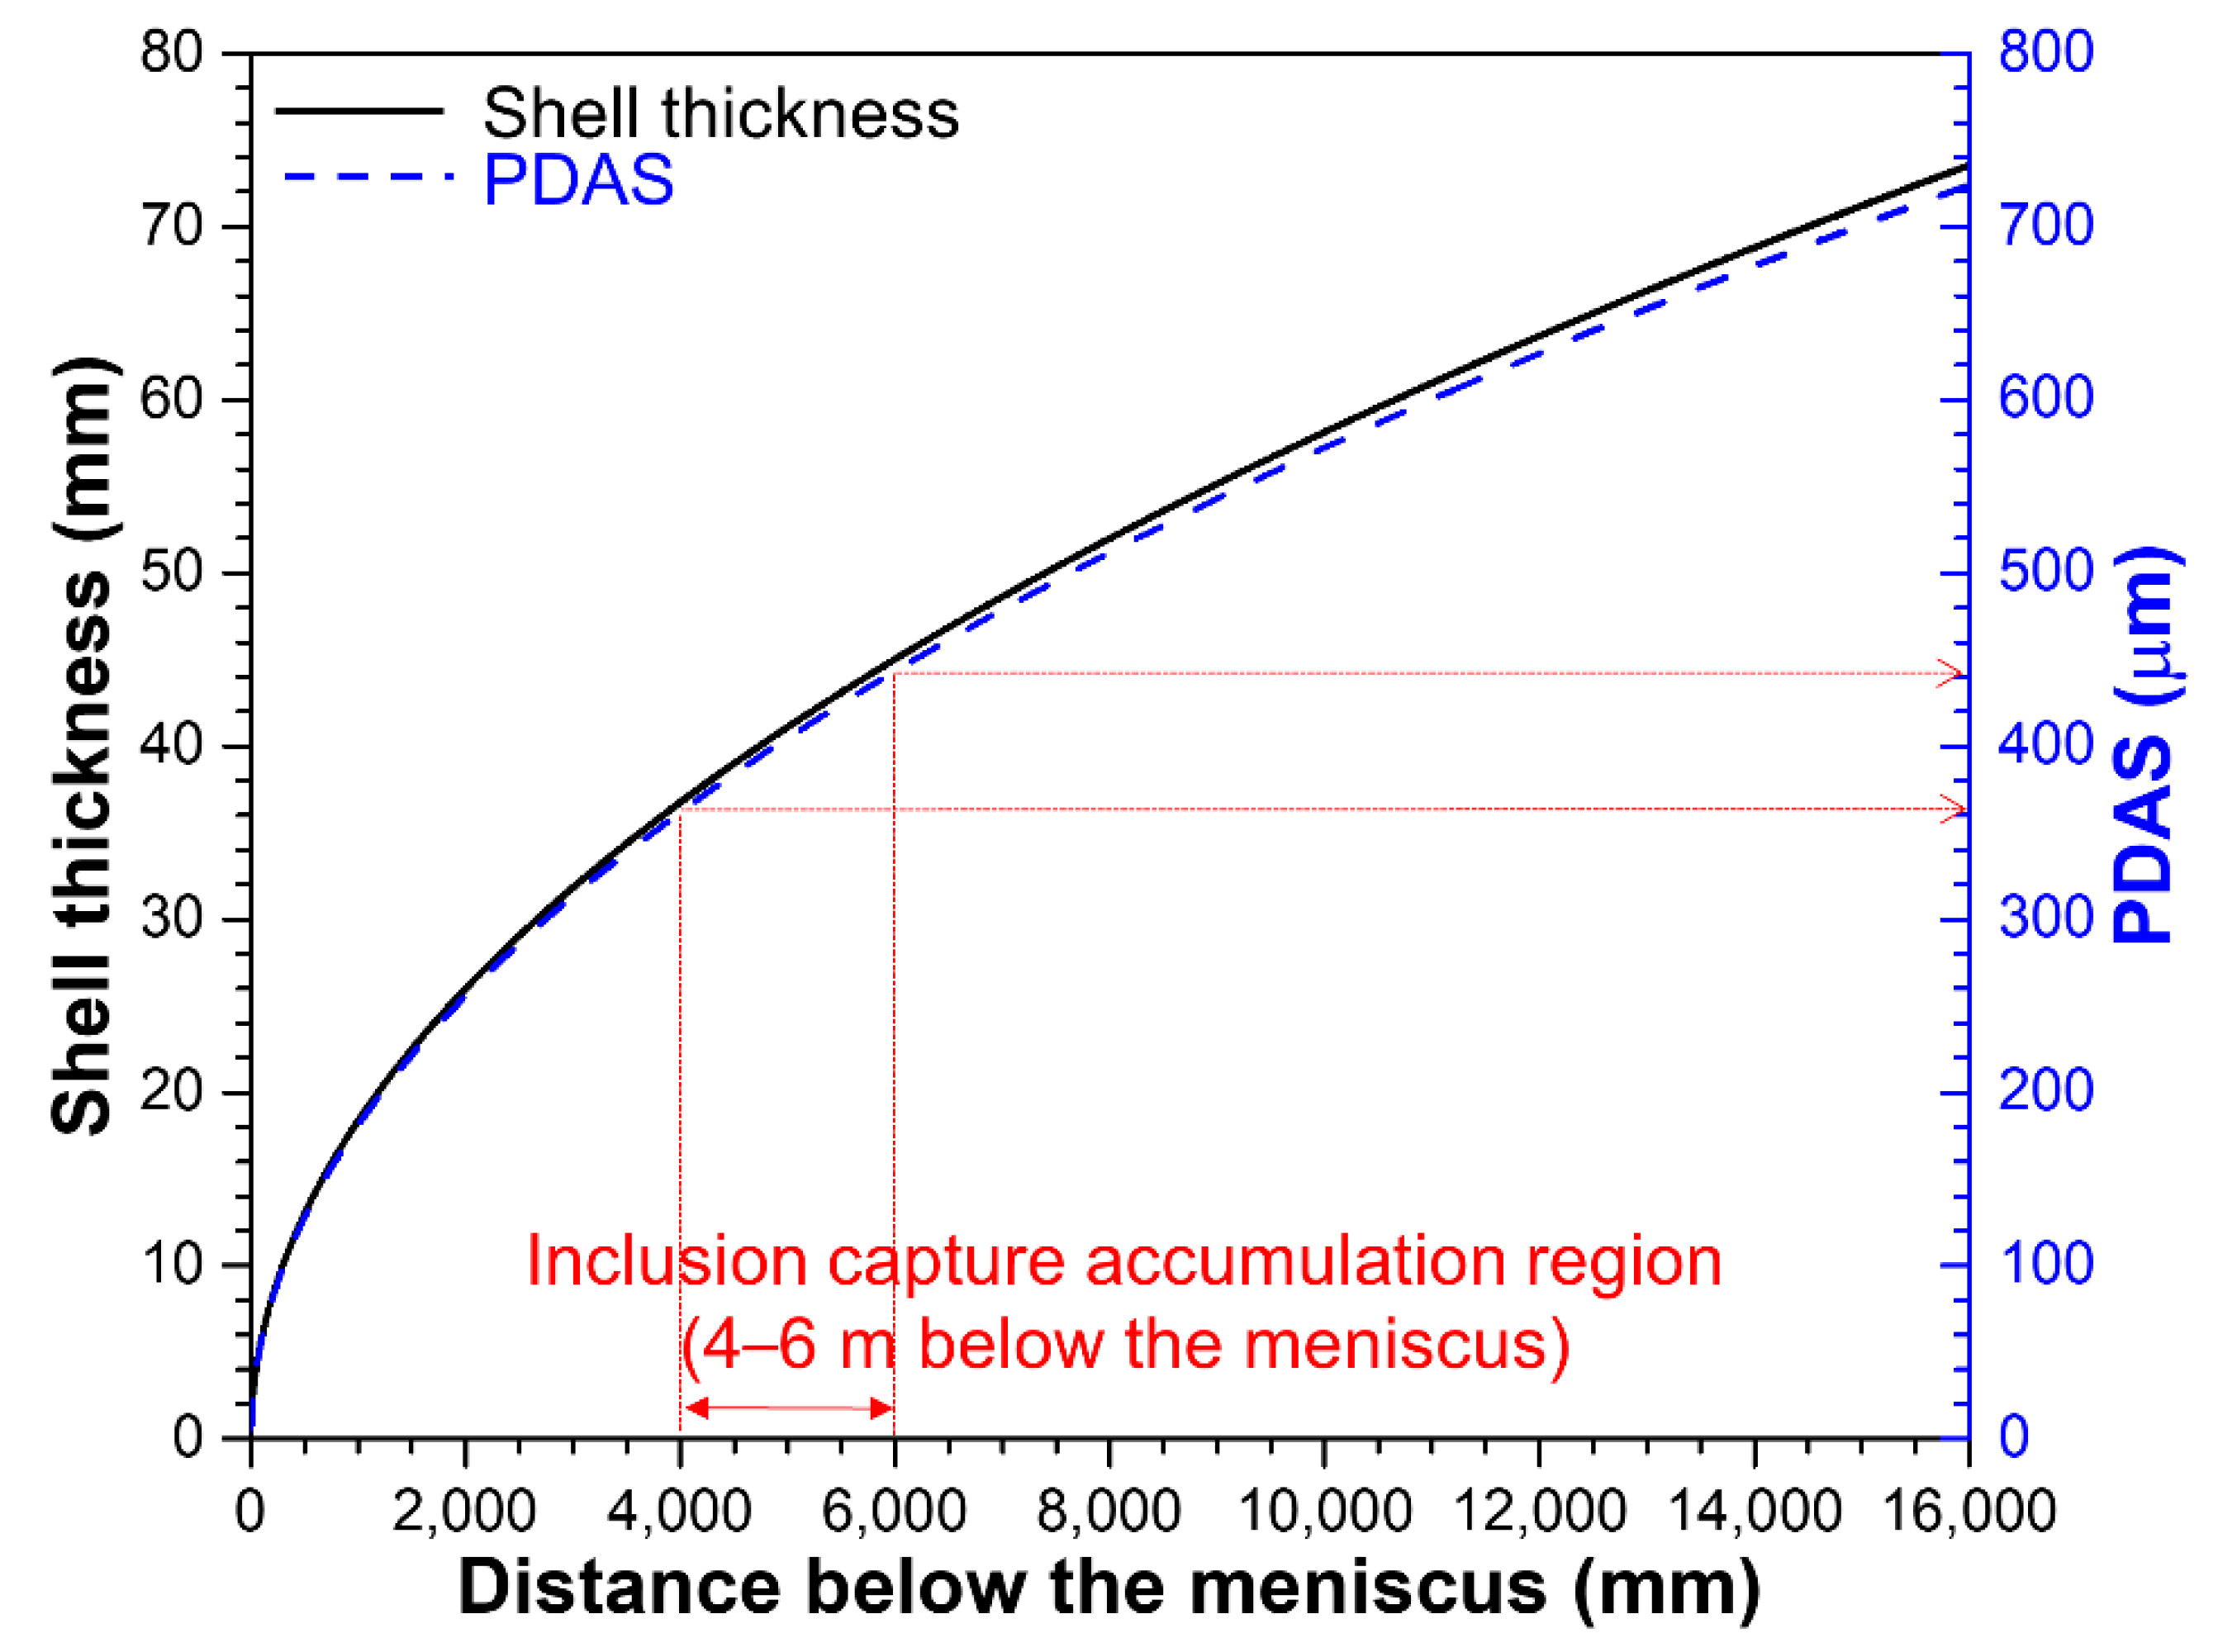
- An accumulation band is observed near the inside radius of steel slabs cast in these straight-curved strand casting machines. This capture band consists mainly of large inclusions (200–300 µm) with a capture rate of ~30 #/4 s. This band arises 4–6 m below the meniscus, at the beginning of the curved part of the strand.
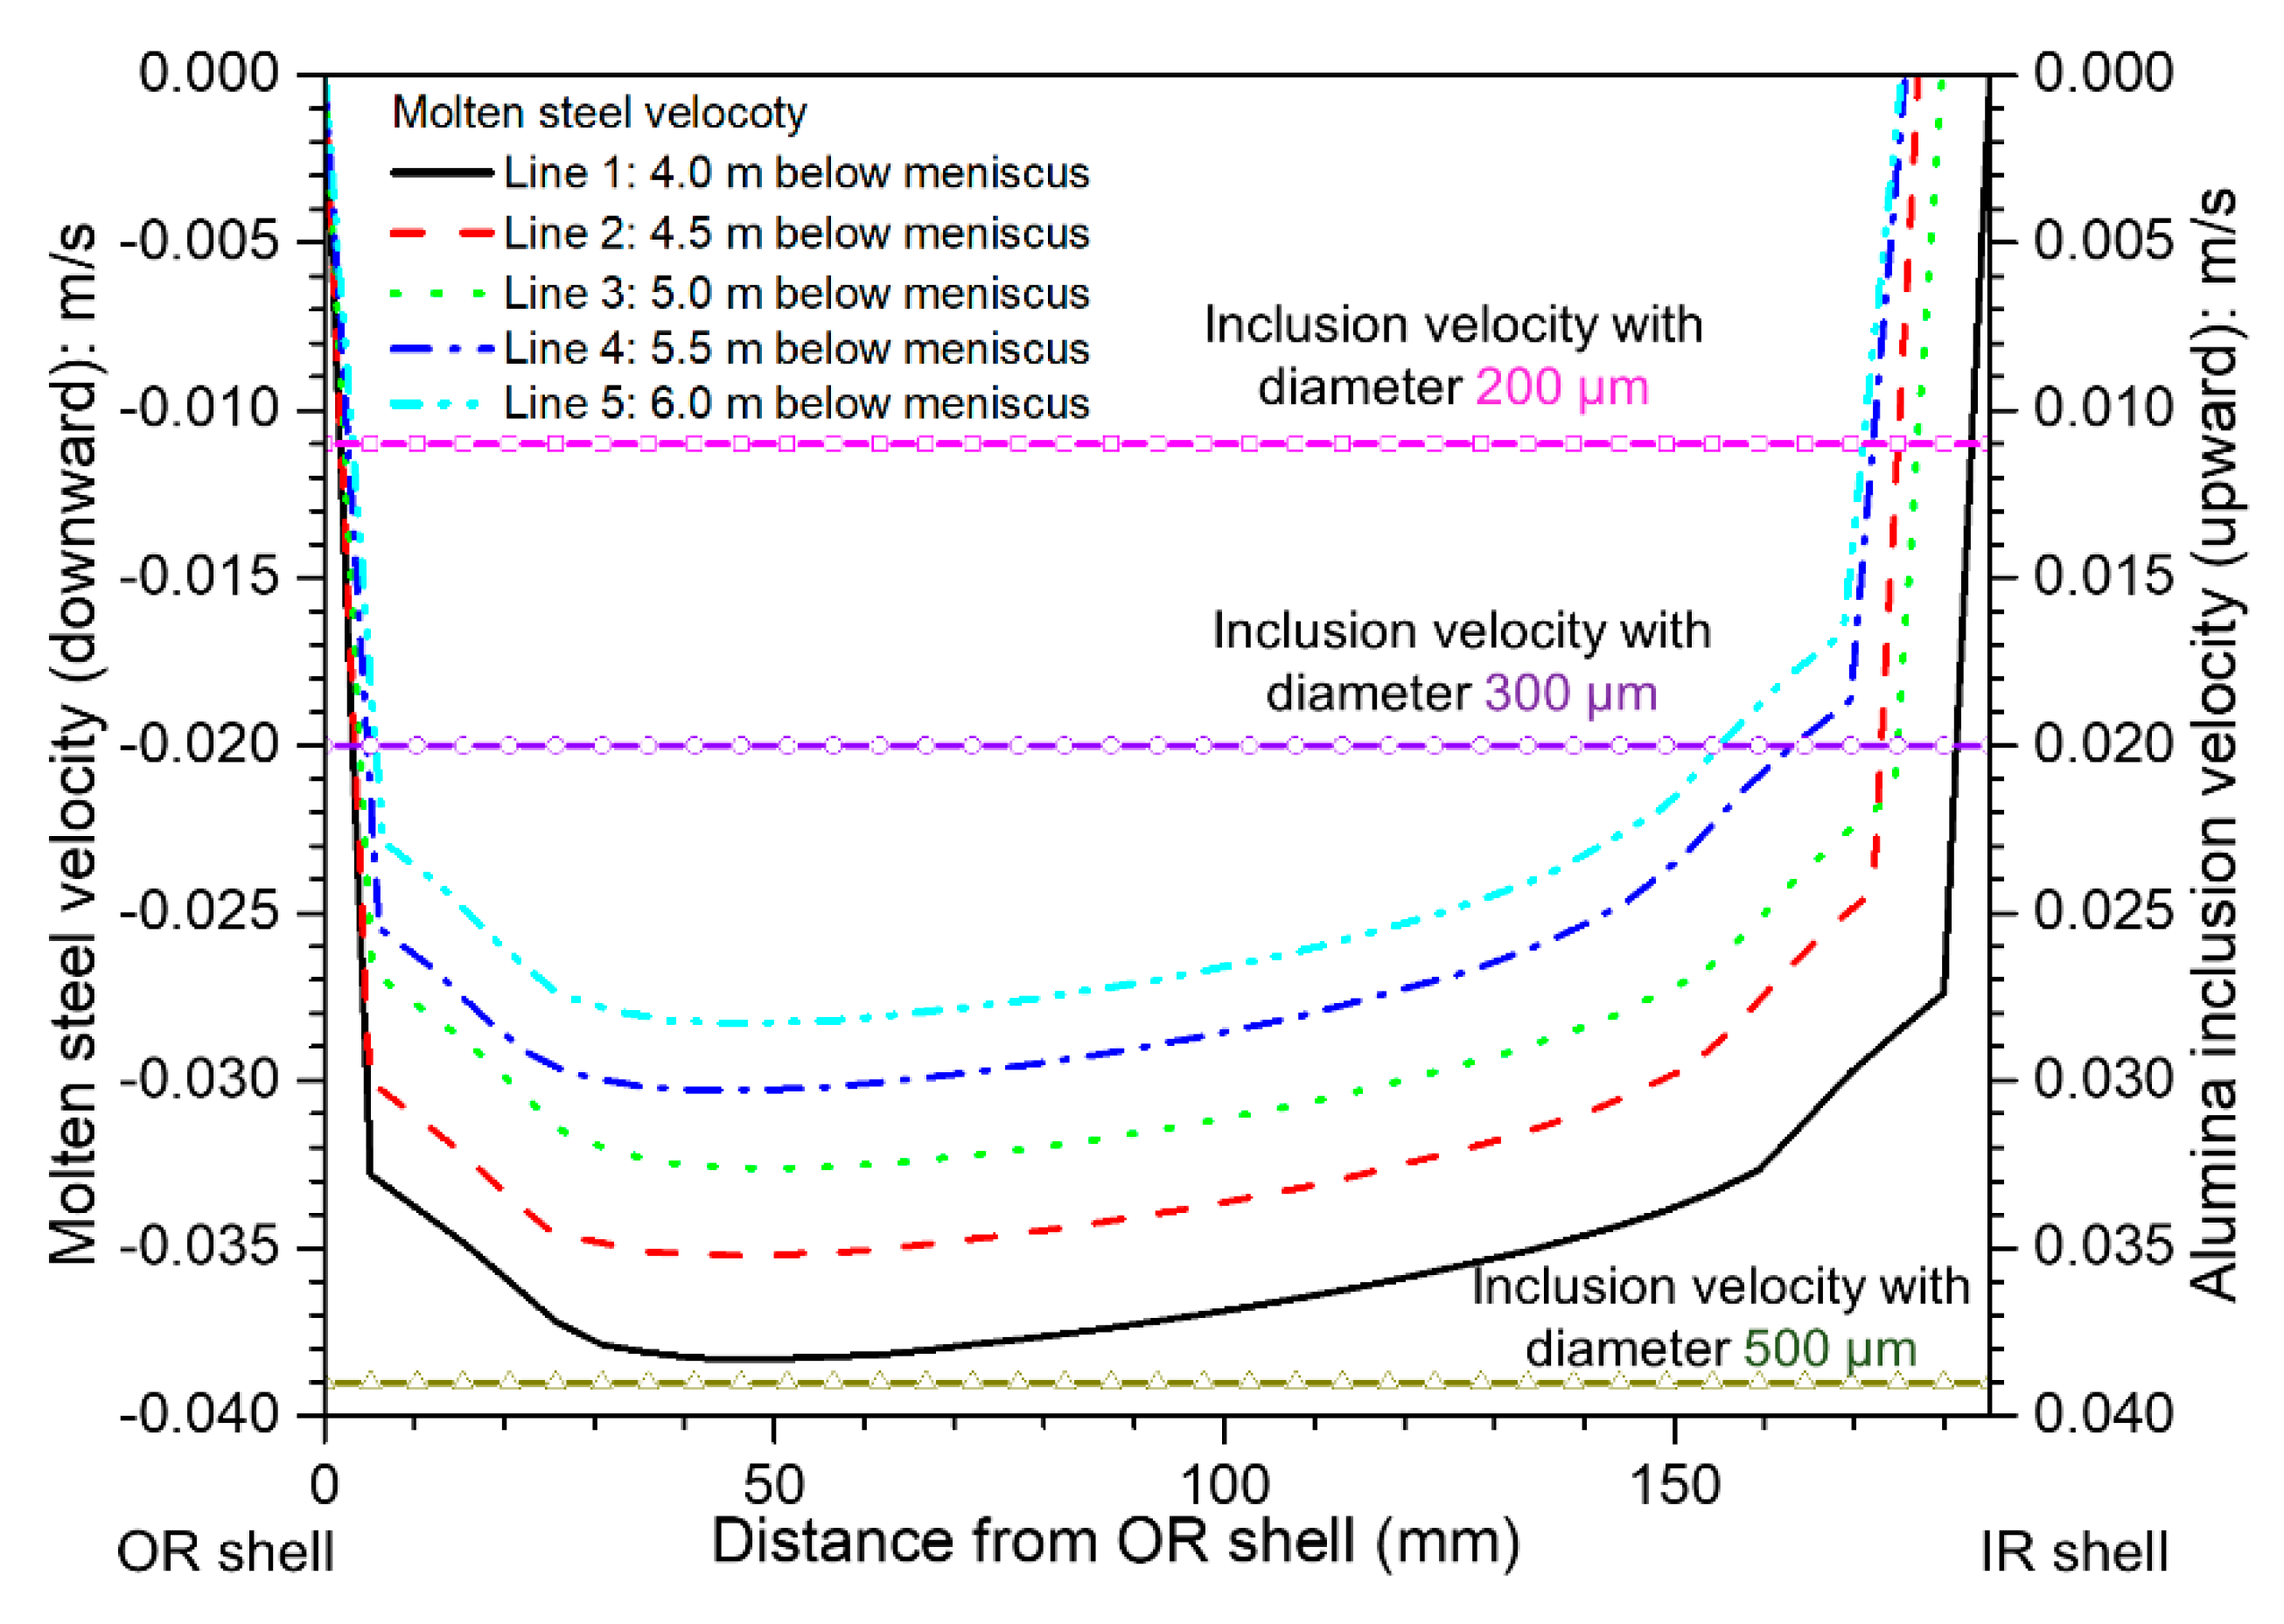
- The capture band coincides with a local decrease in flow velocity (<0.02 m/s) near the solidification front due to lower velocity flow along the IR WF in the strand thickness/length plane caused by the transition in the strand geometry (curvature).
- The model with the advanced capture criterion simulation accurately predicts both the location and number of inclusions captured in the accumulation band near the beginning of the IR curved part of the strand.
- The capture band is caused partly by the low molten steel velocity in this region (downward) almost matching the inclusion rising terminal velocity (upward), which suspends large inclusions (200–300 µm) at the steel shell front on the IR WF, and makes particle capture easier. The second, more important reason is that the increasing PDAS down the caster begins to exceed the size of the larger inclusions in this region, enabling easier entrapment between dendrite arms.
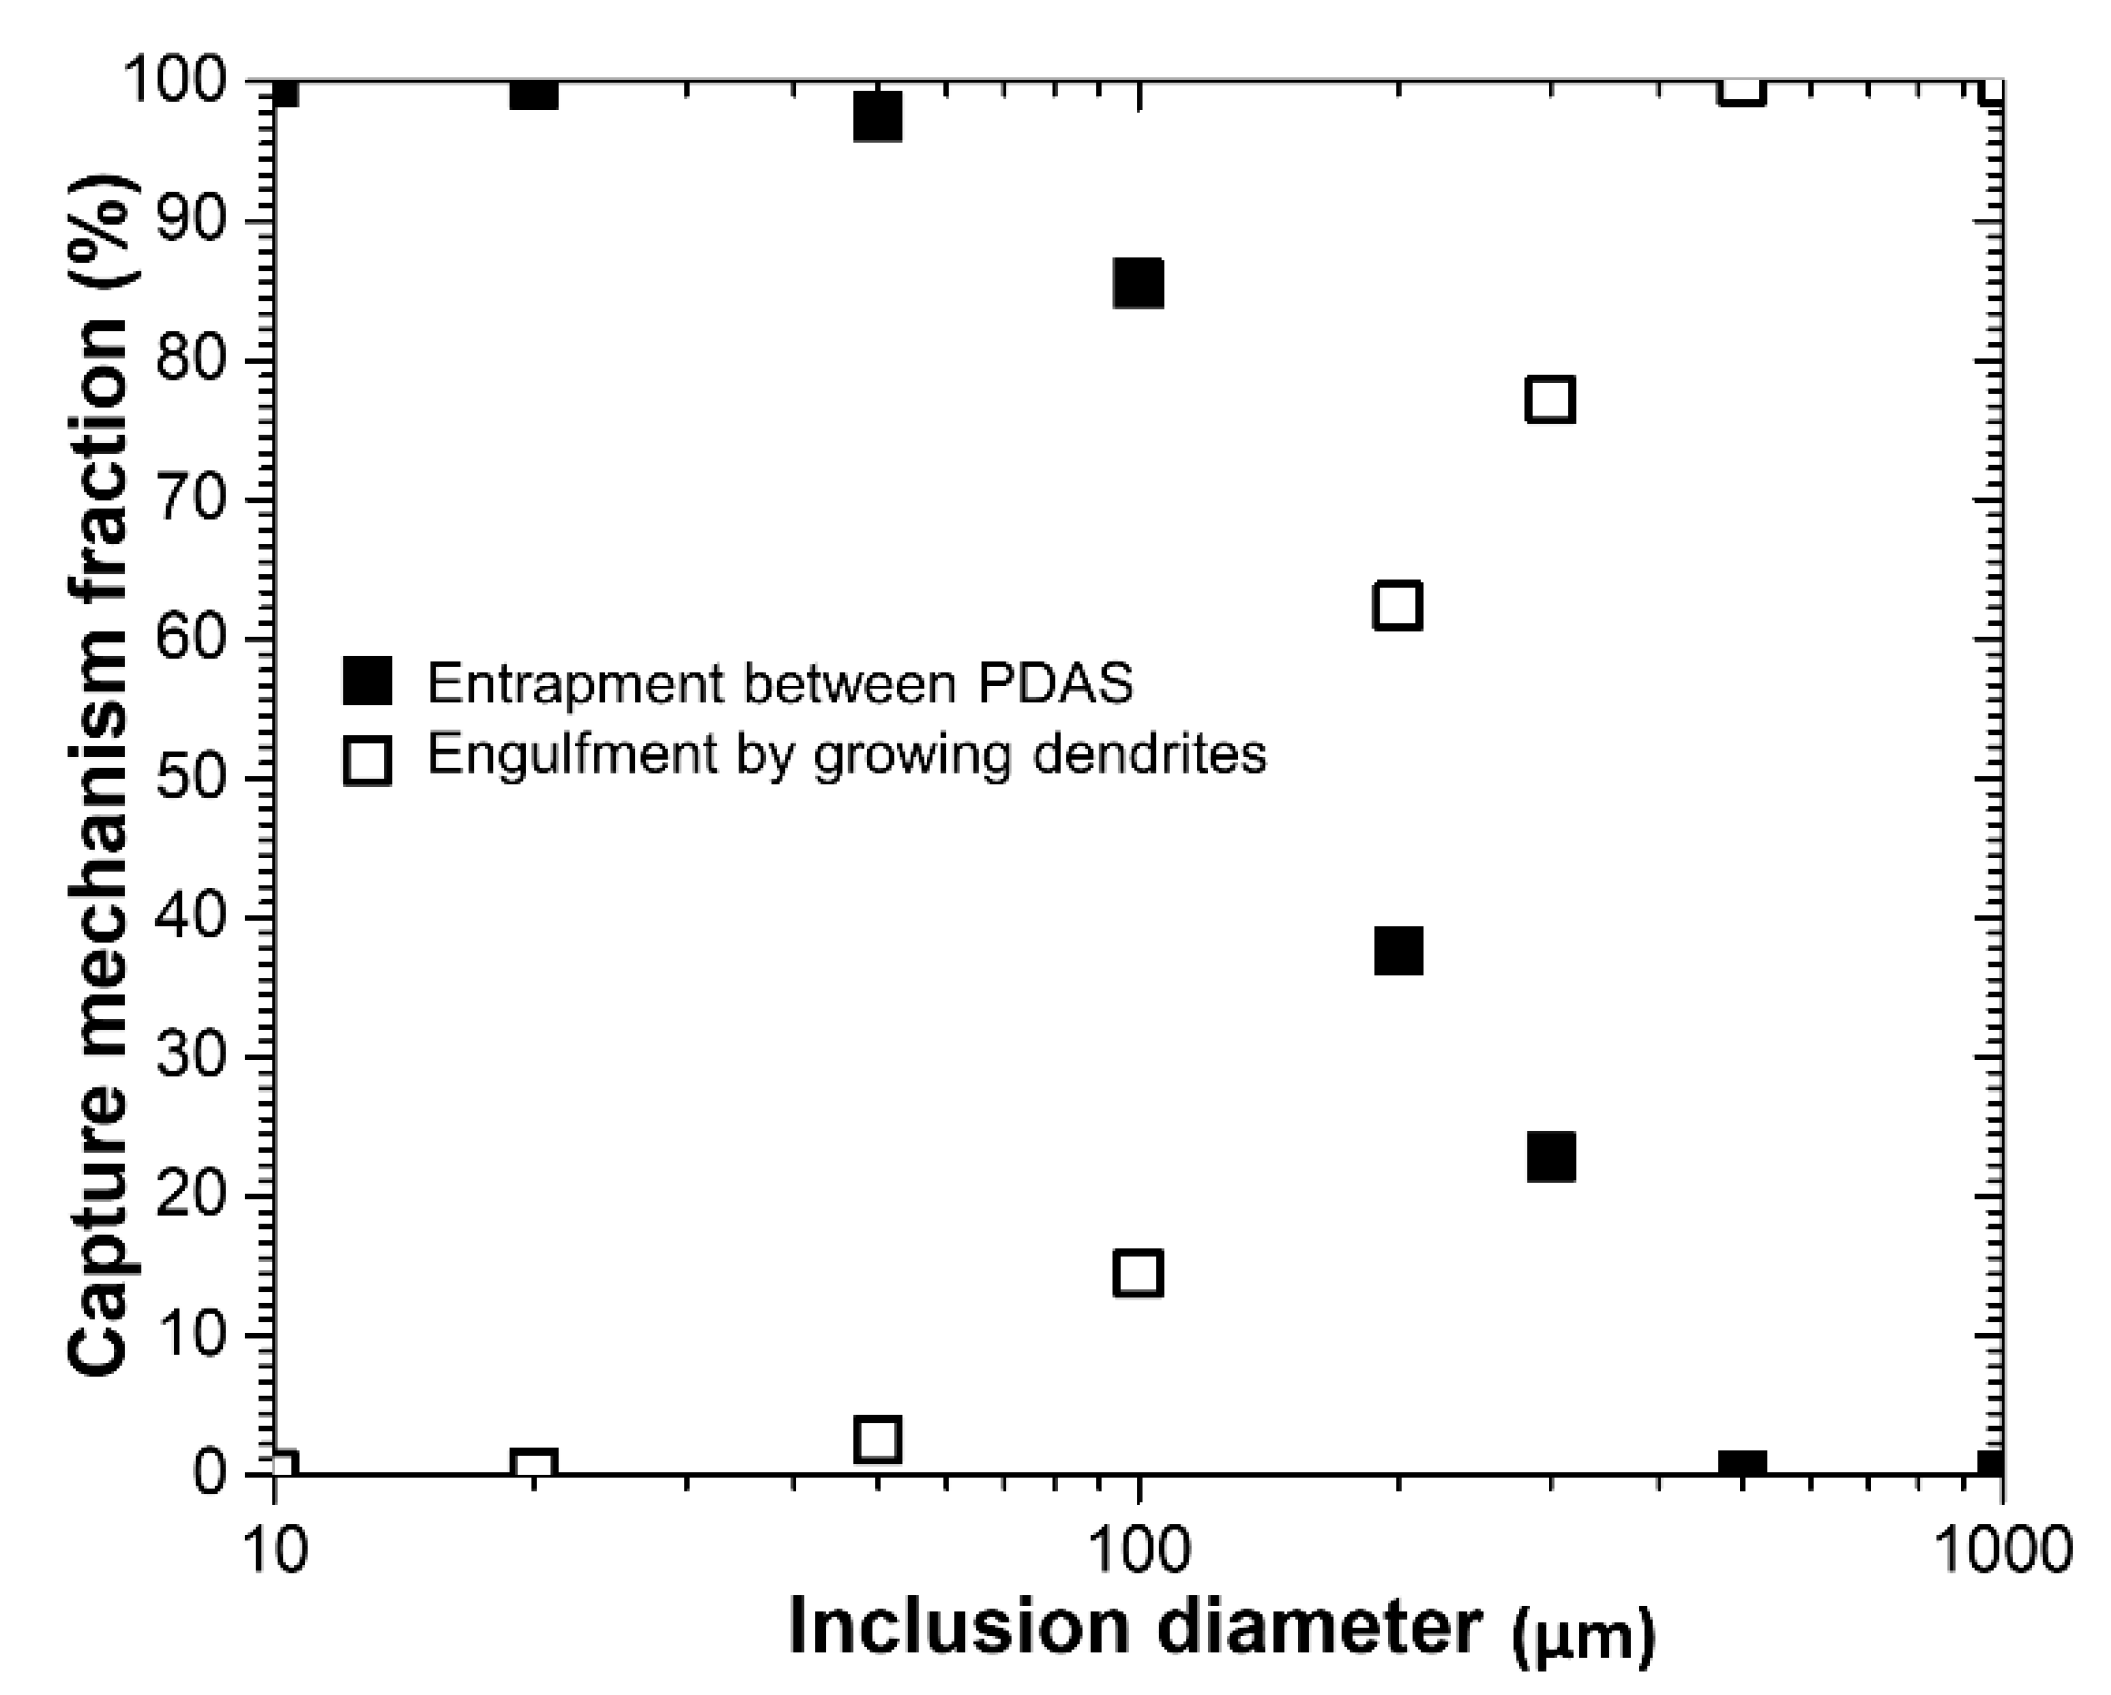
- The relative importance of different inclusion capture mechanisms is revealed: small inclusions are mainly captured by entrapment between dendrites, while large inclusions are captured mainly by engulfment, by being surrounded by growing dendrites while being almost suspended near the solidification front in low-velocity regions of the flow pattern.
- The engulfment mechanism (advanced capture criterion) explains the capture of inclusions larger than the local PDAS and suggests ways to prevent this phenomenon.
- Lessening the capture of large inclusions entering the mold can be accomplished by comprehensive control of the molten steel flow by optimizing both nozzle and strand geometry and careful application of electromagnetic stirring, in order to direct particles towards the top surface without excessive surface velocity, to avoid strong flow down the narrow faces, and to wash particles away from the solidification front by avoiding low velocity regions.
- Future work is needed to implement further mechanisms of inclusion formation, capture, and removal into the model methodology presented here, and to conduct parametric studies to find practical ways to lessen particle capture in continuous casting.
Author Contributions
Funding
Institutional Review Board Statement
Informed Consent Statement
Data Availability Statement
Acknowledgments
Conflicts of Interest
References
- Thomas, B.G. Fluid Flow in the Mold. In Making, Shaping and Treating of Steel: Continuous Casting, 11th ed.; Cramb, A., Ed.; AISE Steel Foundation: Pittsburgh, PA, USA, 2003; Volume 5, pp. 14.1–14.41. [Google Scholar]
- Rackers, K.G.; Thomas, B.G. Clogging in Continuous Casting Nozzles. In Continuous Casting: Tundish Operations; Iron and Steel Society: Warrendale, PA, USA, 2003; Volume 10, pp. 264–274. [Google Scholar]
- Hibbeler, L.C.; Thomas, B.G. Mold Slag Entrainment Mechanisms in Continuous Casting Molds. Iron Steel Technol. 2013, 10, 121–136. [Google Scholar]
- Cho, S.-M.; Thomas, B.G.; Kim, S.-H. Effect of Nozzle Port Angle on Transient Flow and Surface Slag Behavior During Continuous Steel-Slab Casting. Metall. Mater. Trans. B 2019, 50, 52–76. [Google Scholar] [CrossRef]
- Zhang, L.; Yang, S.; Cai, K.; Li, J.; Wan, X.; Thomas, B.G. Investigation of Fluid Flow and Steel Cleanliness in the Continuous Casting Strand. Metall. Mater. Trans. B 2007, 38, 63–83. [Google Scholar] [CrossRef]
- Sengupta, J.; Thomas, B.G.; Shin, H.J.; Lee, G.G.; Kim, S.H. Mechanism of Hook Formation during Continuous Casting of Ultra-low Carbon Steel Slabs. Metall. Mater. Trans. A 2006, 37, 1597–1611. [Google Scholar] [CrossRef]
- Wang, S.; Zhang, X.; Zhang, L.; Wang, Q. Influence of Electromagnetic Brake on Hook Growth and Inclusion Entrapment Beneath the Surface of Low Carbon Continuous Casting Slabs. Steel Res. Int. 2018, 89, 1–8. [Google Scholar] [CrossRef]
- Cho, S.-M.; Liang, M.; Olia, H.; Das, L.; Thomas, B.G. Multiphase Flow-Related Defects in Continuous Casting of Steel Slabs. In TMS 2020 149th Annual Meeting & Exhibition Supplemental Proceedings; Springer International Publishing: Berlin, Germany, 2020; pp. 1161–1173. [Google Scholar]
- Wang, Y.; Zhang, L. Fluid Flow-Related Transport Phenomena in Steel Slab Continuous Casting Strands under Electromagnetic Brake. Metall. Mater. Trans. B 2011, 42, 1319–1351. [Google Scholar] [CrossRef]
- Yuan, Q.; Thomas, B.G.; Vanka, S.P. Study of Transient Flow and Particle Transport during Continuous Casting of Steel Slabs, Part 2. Particle Transport. Metall. Mater. Trans. B 2004, 35, 703–714. [Google Scholar] [CrossRef]
- Zhang, L.; Wang, Y. Modeling the Entrapment of Nonmetallic Inclusions in Steel Continuous-Casting Billets. JOM 2012, 64, 1063–1074. [Google Scholar] [CrossRef]
- Liu, Z.; Li, B.; Jiang, M. Transient Asymmetric Flow and Bubble Transport Inside a Slab Continuous-Casting Mold. Metall. Mater. Trans. B 2014, 45, 675–697. [Google Scholar] [CrossRef]
- Yin, Y.; Zhang, J.; Lei, S.; Wang, Z. Numerical Simulation of Inclusion Capture in the Slab Continuous Casting Considering the Influence of the Primary Dendrite Arm Spacing. High Temp. Mater. Proc. 2018, 37, 375–386. [Google Scholar] [CrossRef]
- Liu, Z.; Li, B. Transient motion of inclusion cluster in vertical-bending continuous casting caster considering heat transfer and solidification. Powder Technol. 2016, 287, 315–329. [Google Scholar] [CrossRef]
- Liu, Z.; Li, B. Effect of vertical length on asymmetric flow and inclusion transport in vertical-bending continuous caster. Powder Technol. 2018, 323, 403–415. [Google Scholar] [CrossRef]
- Wilde, G.; Perepezko, J.H. Experimental study of particle incorporation during dendritic solidification. Mater. Sci. Eng. A 2000, 283, 25–37. [Google Scholar] [CrossRef]
- Thomas, B.G.; Yuan, Q.; Mahmood, S.; Liu, R.; Chaudhary, R. Transport and Entrapment of Particles in Steel Continuous Casting. Metall. Mater. Trans. B 2014, 45, 22–35. [Google Scholar] [CrossRef]
- Jin, K.; Thomas, B.G.; Ruan, X. Modeling and Measurements of Multiphase Flow and Bubble Entrapment in Steel Continuous Casting. Metall. Mater. Trans. B 2016, 47, 548–565. [Google Scholar] [CrossRef]
- Mukai, K.; Zeze, M. Motion of Fine Particles under lnterfacial Tension Gradient in Relation to Continuous Casting Process. Steel Res. 2003, 74, 131–138. [Google Scholar] [CrossRef]
- Lee, S.-M.; Kim, S.-J.; Kang, Y.-B.; Lee, H.-G. Numerical Analysis of Surface Tension Gradient Effect on the Behavior of Gas Bubbles at the Solid/Liquid Interface of Steel. ISIJ Int. 2012, 52, 1730–1739. [Google Scholar] [CrossRef]
- Yuan, Q. Transient Study of Turbulent Flow and Particle Transport during Continuous of Steel Slabs. Ph.D. Thesis, University of Illinois, Urbana-Champaign, IL, USA, 2004. [Google Scholar]
- Jin, K.; Vanka, S.P.; Thomas, B.G. Large Eddy Simulations of Electromagnetic Braking Effects on Argon Bubble Transport and Capture in a Steel Continuous Casting Mold. Metall. Mater. Trans. B 2018, 49, 1360–1377. [Google Scholar] [CrossRef]
- Liang, M.; Cho, S.-M.; Olia, H.; Das, L.; Thomas, B.G. Modeling of Multiphase Flow and Argon Bubble Entrapment in Continuous Slab Casting of Steel. In Proceedings of the AISTech 2019—Proceedings of the Iron & Steel Technology Conference, Pittsburgh, PA, USA, 6–9 May 2019; The Association for Iron & Steel Technology: Warrendale, PA, USA, 2019; pp. 2219–2231. [Google Scholar]
- Yuan, Q.; Thomas, B.G.; Vanka, S.P. Study of Transient Flow and Particle Transport during Continuous Casting of Steel Slabs, Part 1. Fluid Flow. Metall. Mater. Trans. B 2004, 35, 685–702. [Google Scholar] [CrossRef]
- Liu, R. Modeling Transient Multiphase Flow and Mold Top Surface Behavior in Steel Continuous Casting. Ph.D. Thesis, University of Illinois, Urbana-Champaign, IL, USA, 2015. [Google Scholar]
- Launder, B.E.; Spalding, D.B. Lectures in Mathematical Models of Turbulence; Academic Press: London, UK, 1972. [Google Scholar]
- Cho, S.-M.; Thomas, B.G. Effects of Strand EMS on Solidification Defects and Particle Entrapment in Slab Casting. In Proceedings of the Colorado School of Mines, Continuous Casting Center, Annual Meeting, Golden, CO, USA, 12 August 2020. [Google Scholar]
- ANSYS Fluent Theory Guide; ANSYS Inc.: Canonsburg, PA, USA, 2012.
- Clift, R.; Grace, J.R.; Weber, M.E. Bubbles, Drops, and Particles, 8th ed.; Academic Press: New York, NY, USA, 1970; p. 255. [Google Scholar]
- Jin, K. Argon Bubble Transport and Capture in Continuous Casting with an External Magnetic Field Using GPU-Based Large EDDY Simulations. Ph.D. Thesis, University of Illinois, Urbana-Champaign, IL, USA, 2016. [Google Scholar]
- Miki, Y.; Thomas, B.G. Mathematical Modeling of Inclusion Separation in Tundish. CAMP-ISIJ 1998, 11, 870. [Google Scholar]
- Miki, Y.; Thomas, B.G. Modeling of Inclusion Removal in a Tundish. Metall. Mater. Trans. B 1999, 30, 639–654. [Google Scholar] [CrossRef]
- Zinngrebe, E.; Hoek, C.V.; Visser, H.; Westendorp, A.; Jung, I.-H. Inclusion Population Evolution in Ti-alloyed Al-killed Steel during Secondary Steelmaking Process. ISIJ Int. 2012, 52, 52–61. [Google Scholar] [CrossRef]
- Ende, M.-A.V.; Guo, M.; Zinngrebe, E.; Blanpain, B.; Jung, I.-H. Evolution of Non-Metallic Inclusions in Secondary Steelmaking: Learning from Inclusion Size Distributions. ISIJ Int. 2013, 53, 1974–1982. [Google Scholar] [CrossRef]
- Seo, M.-D.; Cho, J.-W.; Kim, K.-C.; Kim, S.-H. Evolution of Non-Metallic Inclusions in Ultra Low Carbon Steel after Aluminum Deoxidization. ISIJ Int. 2014, 54, 475–481. [Google Scholar] [CrossRef]
- Zhang, L.; Thomas, B.G. State of the Art in Evaluation and Control of Steel Cleanliness. ISIJ Int. 2003, 43, 271–291. [Google Scholar] [CrossRef]
- Yang, W.; Wang, X.; Zhang, L.; Shan, Q.; Liu, X. Cleanliness of Low Carbon Aluminum-Killed Steels during Secondary Refining Processes. Steel Res. Int. 2013, 84, 473–489. [Google Scholar] [CrossRef]
- Yang, W.; Cao, J.; Wang, X.-H.; Xu, Z.-R.; Yang, J. Investigation on Non-Metallic Inclusions in LCAK Steel Produced by BOF-LF-FTSC Production Route. J. Iron Steel Research Int. 2011, 18, 6–20. [Google Scholar] [CrossRef]
- Furumai, K.; Matsui, Y.; Murai, T.; Miki, Y. Evaluation of Defect Distribution in Continuously-Cast Slabs by Using Ultrasonic Defect Detection System and Effect of Electromagnetic Brake on Decreasing Unbalanced Flow in Mold. ISIJ Int. 2015, 55, 2135–2141. [Google Scholar] [CrossRef]
- Lee, G.-G.; Shin, H.-J.; Thomas, B.G.; Kim, S.-H. Asymmetric Multi-phase Fluid Flow and Particle Entrapment in a Continuous Casting Mold. In Proceedings of the AISTech 2008, Pittsburgh, PA, USA, 5–8 May 2008; The Association for Iron & Steel Technology: Warrendale, PA, USA, 2008; pp. 1–12. [Google Scholar]
- Rohatgi, A. WebPlotDigitizer. Available online: https://automeris.io/WebPlotDigitizer/ (accessed on 30 April 2019).
- Teshima, T.; Osame, M.; Okimoto, K.; Nimura, Y. Improvement of Surface Property of Steel at High Casting Speed. In Proceedings of the 71th Steelmaking Conference; The Iron and Steel Society: London, UK, 1988; pp. 111–118. [Google Scholar]
- Kunstreich, S. Electromagnetic stirring for continuous casting—Part 1. Rev. Met. Paris 2003, 100, 395–408. [Google Scholar] [CrossRef]
- Kunstreich, S. Electromagnetic stirring for continuous casting—Part 2. Rev. Met. Paris 2003, 100, 1043–1061. [Google Scholar] [CrossRef]
- Cho, S.-M.; Thomas, B.G. Electromagnetic Forces in Continuous Casting of Steel Slabs. Metals 2019, 9, 471. [Google Scholar] [CrossRef]
- Sengupta, J.; Shin, H.-J.; Thomas, B.G.; Kim, S.-H. Micrograph Evidence of Meniscus Solidification and Sub-Surface Microstructure Evolution in Continuous-Cast Ultra-Low Carbon Steels. Acta Mater. 2006, 54, 1165–1173. [Google Scholar] [CrossRef]
- Zhang, X.; Ren, Y.; Zhang, L.; Yang, W. Entrapment of Inclusions by Solidified Hooks at the Subsurface of Ultra-Low-Carbon Steel Slab. Metall. Mater. Trans. B 2018, 48, 3186–3199. [Google Scholar] [CrossRef]
- Zhang, L.; Aoki, J.; Thomas, B.G. Inclusion Removal by Bubble Flotation in a Continuous Casting Mold. Metall. Mater. Trans. B 2006, 37, 361–379. [Google Scholar] [CrossRef]


| Caster dimensions | |
|---|---|
| Nozzle port area | 85 mm (width) × 85 mm (height) |
| Nozzle port angle | −25° (downward) at both top and bottom |
| Mold thickness Mold width (w) | 250 mm 1100 mm |
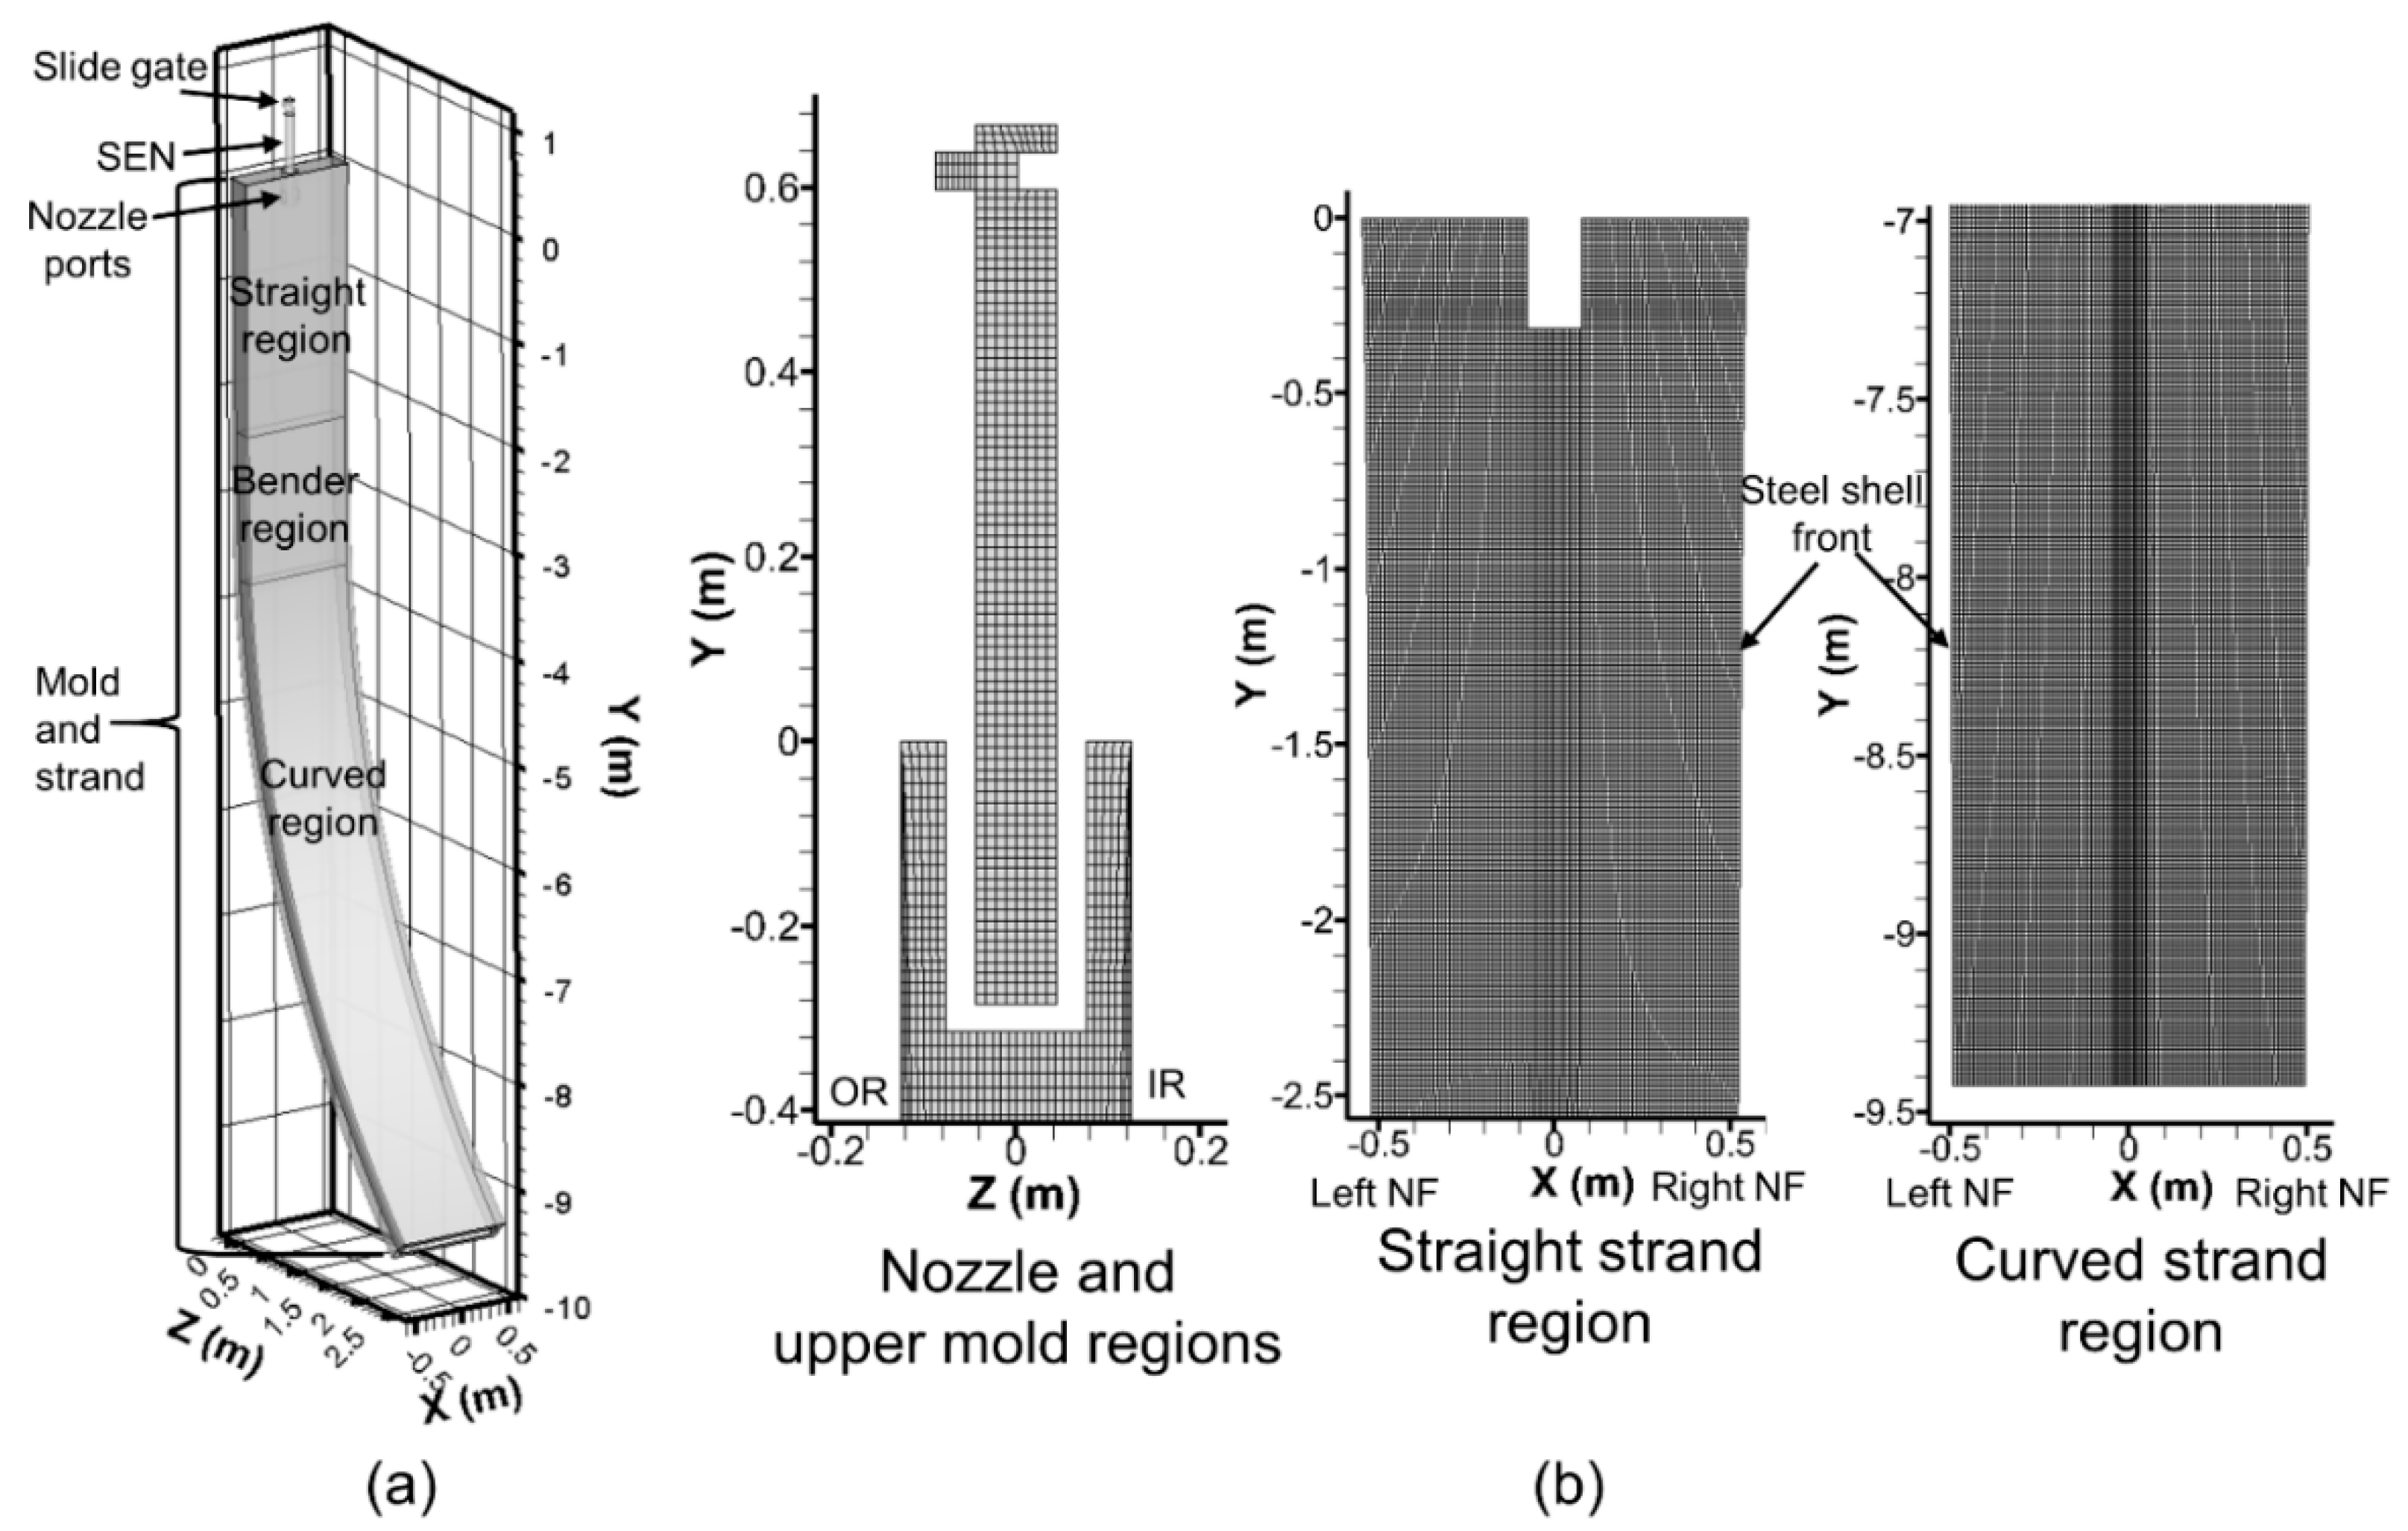
| Strand geometry Domain length | Straight mold and upper strand, curved lower strand 0.68 m above meniscus is modeled 9.5 m below meniscus is modeled |
| Process conditions | |
| Steel flow rate | 330 LPM (2.3 tonne/min) |
| Casting speed | 1.2 m/min (20 mm/s) |
| Tundish height | 1200 mm |
| Steel grade | Low carbon steel: carbon 0.04 wt% |
| Shell thickness profile | 2.6 mm/s0.5 |
| Slide-gate open-area fraction Slide-gate opening direction | 40.36% 90° (movement towards outer radius wide face) |
| Inclusion size range (diameter) | 10–1000 μm: DPM particle injection condition |
| Submergence depth of nozzle | 185 mm |
Publisher’s Note: MDPI stays neutral with regard to jurisdictional claims in published maps and institutional affiliations. |
© 2021 by the authors. Licensee MDPI, Basel, Switzerland. This article is an open access article distributed under the terms and conditions of the Creative Commons Attribution (CC BY) license (https://creativecommons.org/licenses/by/4.0/).
Share and Cite
Cho, S.-M.; Thomas, B.G.; Hwang, J.-Y.; Bang, J.-G.; Bae, I.-S. Modeling of Inclusion Capture in a Steel Slab Caster with Vertical Section and Bending. Metals 2021, 11, 654. https://doi.org/10.3390/met11040654
Cho S-M, Thomas BG, Hwang J-Y, Bang J-G, Bae I-S. Modeling of Inclusion Capture in a Steel Slab Caster with Vertical Section and Bending. Metals. 2021; 11(4):654. https://doi.org/10.3390/met11040654
Chicago/Turabian StyleCho, Seong-Mook, Brian G. Thomas, Jong-Yeon Hwang, Jong-Geun Bang, and Il-Sin Bae. 2021. "Modeling of Inclusion Capture in a Steel Slab Caster with Vertical Section and Bending" Metals 11, no. 4: 654. https://doi.org/10.3390/met11040654
APA StyleCho, S.-M., Thomas, B. G., Hwang, J.-Y., Bang, J.-G., & Bae, I.-S. (2021). Modeling of Inclusion Capture in a Steel Slab Caster with Vertical Section and Bending. Metals, 11(4), 654. https://doi.org/10.3390/met11040654