Article

Flotation Separation of Chalcopyrite and Talc Using Calcium Ions and Calcium Lignosulfonate as a Combined Depressant

1
School of Minerals Processing and Bioengineering, Central South University, Changsha 410083, China
2
Key Laboratory of Hunan Province for Clean and Efficient Utilization of Strategic Calcium-Containing Mineral Resources, Central South University, Changsha 410083, China
*
Author to whom correspondence should be addressed.
Q.M. and H.Z. contributed equally to this work.
Metals 2021, 11(4), 651; https://doi.org/10.3390/met11040651
Submission received: 19 March 2021 / Revised: 9 April 2021 / Accepted: 13 April 2021 / Published: 16 April 2021

Abstract

:
As a major gangue mineral in sulfide ores, talc is difficult to separate from chalcopyrite in the flotation process due to its natural floatability, which affects the subsequent smelting process. In this study, the effects of calcium ions and calcium lignosulfonate (CLS) as a combination depressant for talc were systematically investigated along with the fundamental mechanisms. The results of our flotation tests showed the talc floating can be effectively depressed via the combination depressant effect of calcium ions and CLS over the pH range of 6–12. Measurements of the adsorption capacity, zeta potential, and Fourier transform infrared (FTIR) showed an enhancement of the adsorption capacity and adsorption strength of CLS on the talc surface after calcium ions were added. This result indicates that calcium ions adsorbed onto the talc, neutralized the negative charge on the surface of talc, generated the binding site with CLS, and formed the [talc-Ca2+/Ca(OH)+-CLS] system by strong adsorption. Further, the coverage rate of CLS on talc was significantly improved after the addition of calcium ions, as shown in the AFM imaging.

1. Introduction

The use of copper, a key metal in the green energy transition, is expected to rise as long as the demand for electric cars, solar, and wind power continues to rise [1]. At present, copper is generally obtained by flotation of copper sulfide [2]. Talc (Mg3Si4O10(OH)2) is a widely distributed layered silicate mineral with ionic bonds in the layers and molecular bonds between the layers [3,4,5]. It possesses superb natural floatability due to its non-polar surface and highly hydrophobicity [6]. In the process of crushing and grinding, talc easily produces a slime phenomenon and adheres to the surface of the target mineral, which greatly affects the flotation separation, resulting in an increase in the MgO content in the concentrate and affecting the subsequent smelting process [7,8,9,10,11]. Copper sulfide minerals are often associated with magnesium-bearing silicate gangue minerals such as talc and serpentine, while flotation is a commonly used method for separating copper sulfide minerals and talc [12]. Three main strategies are currently employed by the mining industry to separate chalcopyrite from talc: (1) Reverse flotation. Preferential flotation of talc using collectors, with metal loss as a main drawback [13]. (2) Acid leaching. The avoidance of using depressants to depress talc flotation. Instead, talc is removed by acid leaching after naturally entering the concentrate. A disadvantage of this method is that the talc continues to circulate in the process, which increases the complexity of the production process [14]. (3) Depression of talc with high-efficiency depressants. However, the existing beneficiation technology has been unable to meet the needs of efficient development and utilization of lean ore [15]. Hence, the study of an efficient talc depressant is the key to realize the flotation separation of copper sulfide minerals and talc. Several commonly used talc depressants include guar gum, xanthan gum, starch, and carboxymethyl cellulose (CMC) [16,17,18]. Shi Qing et al. showed that xanthan gum obviously depressed talc flotation, with few effects on chalcopyrite flotation at pH 8. The adsorption of xanthan gum on the talc surface is achieved through physical action, with hydrophobic interactions acting as a main driving force [19]. Parolis et al. studied the effect of divalent cations Ca2+ and Mg2+ and monovalent K+ ions on the behavior of CMC adsorption. They found that Ca2+ and Mg2+ were far more efficient in promoting the adsorption of CMC onto talc surfaces than K+ ions [16]. Note that CMC is an effective talc depressant in copper sulfide flotation. However, CMC can hardly be fully dissolved during production, so the flotation separation of chalcopyrite and talc is still a problem [20]. Therefore, it is of great significance to find a reagent with high selectivity for talc depression in copper sulfide flotation.
Calcium lignosulfonate (CLS) is a high-molecular anionic polyelectrolyte, which is a by-product of cellulose extracted from wood processing [21]. CLS possesses excellent wettability, dispersibility, and adsorption performances due to its functional groups, including sulfonic and carboxyl groups as well as alkyl and aryl groups [22]. In the past decades, lignosulfonate has been used as a pyrite depressant in the flotation of chalcopyrite and is also a quartz depressant in the flotation of smithsonite [23,24]. Run-qing Liu et al. studied the effect of CLS on the separation of chalcopyrite from pyrite. They noticed that CLS covered the surface of pyrite and prevented the formation of dixanthogen on the pyrite surface, which made the pyrite surface hydrophilic and thus separated the pyrite from the chalcopyrite [25].
The purpose of this study is to use CLS as a talc depressant to separate chalcopyrite and talc by flotation. The depression effect of CLS in the presence or absence of calcium ions was studied through flotation tests. The adsorption capacity, zeta potential, and AFM tests were used to analyze the morphology of the polymer adsorption layer on the hydrophilic surface and to study the difference in the adsorption layer on the talc surface with or without calcium ions in CLS. The depression mechanisms were summarized based on the experimental results.

2. Materials and Methods
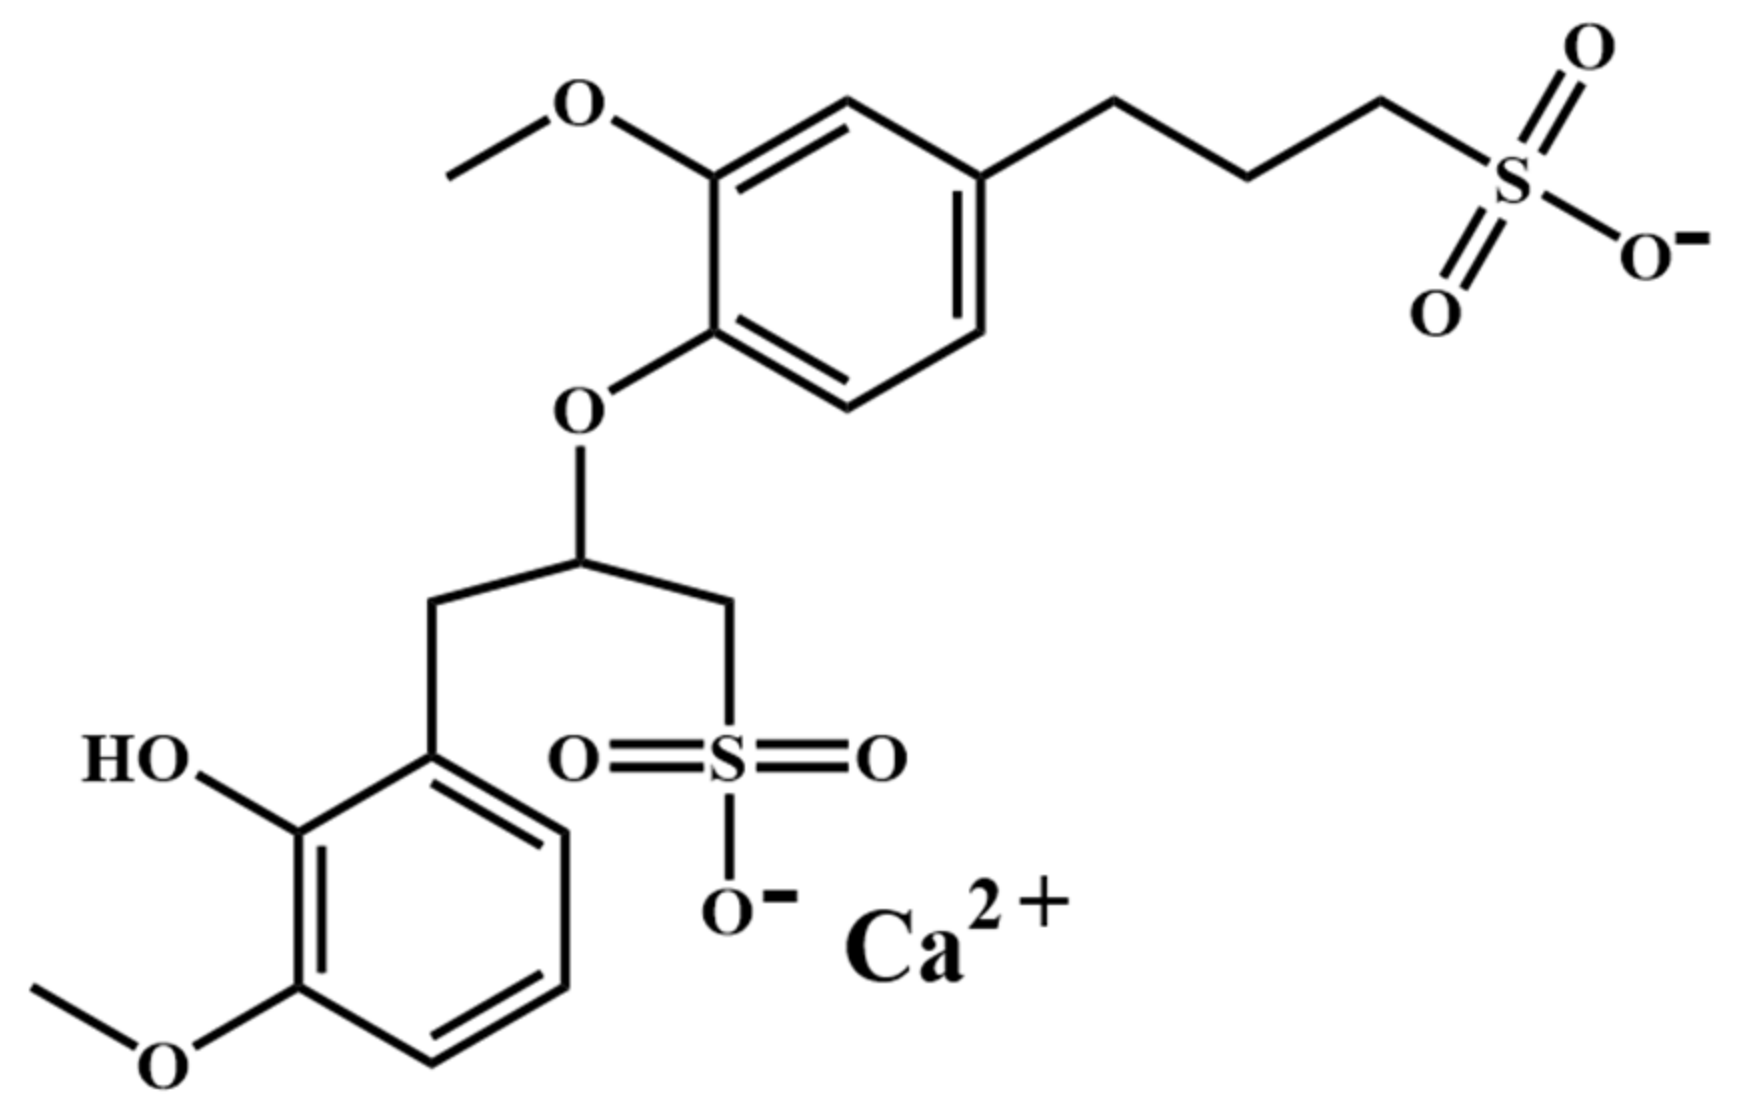
2.1. Materials

Chalcopyrite and talc were obtained from Hubei and Guangxi, respectively. The mineral samples were finely ground in an XQM-4 planetary ball mill and sieved into several particle sizes with 200 mesh and 400 mesh standard screens dividing them into three grades. Particles with a size of 38~74 μM were used for flotation, adsorption, and FTIR tests (Shimadzu, Kyoto, Japan), while those less than 38 μM were ground with an agate mill to below 5 μM for zeta potential measurements. The chemical composition analysis of chalcopyrite and talc was performed using an X’Pert3 POWder X-ray diffractometer (XRD, PANalytical, Almelo, The Netherlands) and Axios mAX X-ray fluorescence spectrometer (XRF, PANalytical, Almelo, The Netherlands). According to XRD (Figure 1) and elemental analysis (Table 1), the purity of the chalcopyrite and talc used in the test was relatively high and met the test requirements. CLS, potassium butylxanthate (PBX), hydrochloric acid, sodium hydroxide, and anhydrous calcium chloride were all analytical pure agents obtained from Tianjin Chemical Reagent Factory (Tianjin, China), and the experimental water was deionized water. The monomeric molecule structure of CLS is shown in Figure 2.

2.2. Flotation Experiment

Flotation experiments were carried out in an XFG-C flotation machine (Jilin Prospecting Machinery Factory, Changchun, China) with a 40 mL plexiglass cell; 2 g of minerals and 40 mL of deionized water were weighed and stirred in a flotation cell. Then, hydrochloric acid or sodium hydroxide was used to adjust the pH of the pulp, after which a calcium chloride solution, CLS depressant, potassium butylxanthate (PBX) collector, and MIBC frother were successively added to the pulp. The froth obtained by flotation and the product in the cell were filtered, dried, and weighed, and the yield was calculated as the recovery rate, while the flotation separation efficiency of the artificial mixed minerals was calculated by the Douglas formula, as shown in Equation (1).
E = ε γ 100 γ · β α β max α × 100 %
  • α—The primary ore grade, %.
  • β—The concentrate grade, %.
  • γ—The concentrate yield, %.
  • ε—Recovery, %.
  • βmax—Pure mineral grade, %.

2.3. Adsorption Capacity Experiment

A variorTOC analyzer was employed for the adsorption capacity experiment (Elementar, Langenselbold, Germany): 2 g mineral (chalcopyrite/talc) and 40 mL deionized water were weighed and then mixed well in a flotation cell. The pH of the pulp was adjusted by hydrochloric acid or sodium hydroxide, and then calcium ions and CLS were added according to the flotation conditions. According to Equation (2), the adsorption density of CLS on the mineral surface can be obtained [25].
Γ = C o C e V m A
  • Γ—Adsorption density of calcium lignosulfonate on the mineral surface, mg/m2.
  • Co—Original concentration of CLS, mg/L.
  • Ce—Supernatant concentration of calcium lignosulfonate, mg/L.
  • V—Volume of solution, ml.
  • m—Quality of minerals, g.
  • A—Specific surface area of minerals, m2/g.
The specific surface areas of chalcopyrite and talc were 2.224 m2/g and 2.626 m2/g, respectively, determined by the BET method.

2.4. Zeta Potential Measurements

The zeta potentials were measured using a Coulter Delsa440sx zeta analyzer machine (Colloidal Dynamics, LLC, Ponte Vedra Beach, FL, USA). The talc samples were ground until the particle size was less than 5 μM; then, 40 mg talc and 40 mL potassium chloride electrolytic solution were added to a beaker. The pulp pH was adjusted, and the agent was added according to the test requirements. After stirring with a magnetic agitator for 10 min, a certain amount of pulp was extracted, and its zeta potential value was measured with the zeta potential analyzer.

2.5. Fourier Transform Infrared Spectrometry (FTIR) Analysis

In order to characterize the interaction between depressants and minerals, an IRAffnity-1 Fourier Transform Infrared Spectrometer was used to measure the infrared spectra in the range of 400–4000 cm−1 with a resolution of 2 cm−1, scanned 30 times.

2.6. AFM Imaging

The samples under different reagent conditions were observed with a Multimode V scanning probe microscope produced by the Veeco Instrument Company, USA (Plainview, NY, USA). The AFM used an RTESP monocrystalline silicon cantilever probe with a scanning rate of 1 Hz, close to 600 nm/s, and all measurements were made at room temperature (25 °C) in air. The talc samples with the dissociated surface were placed in the required reagent solution, stirred for 30 min to reach the absorption equilibrium, and then dried under high-purity nitrogen. Three samples were selected for each test condition for measurement and calculation, and a representative image was produced for each condition. Nanoscope analysis 1.80 software was used to calculate the root mean square roughness and peak-to-valley distance (PTV) and to evaluate the surface coverage. According to the thickness difference between the polymer and the smooth stone surface, the polymer apparent layer thickness (ΔPTV) can be obtained [8,26].

3. Results and Discussion

3.1. Flotation Test Results

Figure 3 shows the effect of the amount of collector PBX on the flotation of chalcopyrite and talc. The recovery rate of talc remained high with increased PBX due to its natural floatability, while the recovery rate of chalcopyrite increased with the increase in the reagent concentration. When the dosage of PBX was 50 mg/L, the recovery rate of chalcopyrite reached the maximum. The results showed that the flotation separation of chalcopyrite and talc could not be achieved without the use of depressants. Figure 4 exhibits the effect of calcium ions on the flotation of chalcopyrite and talc. As shown in Figure 4, the recovery rates of chalcopyrite and talc changed insignificantly with the increase in the calcium ion concentration. Therefore, the flotation recoveries of chalcopyrite and talc were not only affected by the change in the calcium ion concentration.
The effects of CLS dosage on chalcopyrite and talc flotation under different calcium ion concentrations are exhibited in Figure 5. As shown in Figure 5a, when the dosage of CLS exceeded 200 mg/L, the depression effect of CLS on chalcopyrite was enhanced by increasing the dosage of the calcium ions. It can be seen from Figure 5b that CLS was an effective depressant of talc. When only the CLS depressant was added to the solution, the talc recovery rate decreased gradually with the increase in the amount of CLS. When the concentration of calcium ions was 1 × 10⁻³ mol/L, the flotation recovery of talc decreased rapidly with the increase in the dosage of CLS, and the flotation recovery of talc decreased to 6.0% when the dosage of CLS reached 200 mg/L. In Figure 6a, with the increase in pH, the recovery rate of chalcopyrite gradually increased and reached about 88% at pH = 6. When pH > 6, the recovery of chalcopyrite did not change much. As can be seen from Figure 6b, CLS exhibited a strong depression effect on talc under acidic conditions. With the increase in pH, the depression effect of CLS on talc was weakened when there were no calcium ions or the concentration of calcium ions was low (1 × 10⁻⁴ mol/L). When the calcium ion concentration increased, the depression effect of CLS on talc became stronger under a wide pH range. It can be concluded that the flotation separation of chalcopyrite and talc could be achieved in the pH range of 6 to 12 by using CLS as the depressant.
Table 2 shows the effects of CLS on the flotation of artificial mixed minerals in the presence or absence of added calcium ions. The results revealed that CLS could effectively realize the separation of chalcopyrite and talc. Compared with the flotation results of single CLS, the combined action of calcium ions and CLS reduced the content of talc in the artificial mixed minerals and improved the recovery of chalcopyrite. The combined action of calcium ions and CLS increased the separation efficiency from 11.7 to 26.3%, which was more beneficial to the flotation recovery of chalcopyrite.

3.2. Adsorption Capacity Experimental Results

Figure 7 presents the adsorption behavior of CLS on chalcopyrite and talc surfaces. The adsorption amount of CLS on the talc surface increased with the increase in the amount of CLS, and the adsorption amount of CLS on the talc surface was significantly higher than that on the chalcopyrite surface. After the addition of calcium ions, the adsorption capacity of CLS on chalcopyrite and talc increased, but the adsorption capacity on talc was significantly higher than that on chalcopyrite, which indicated that calcium ions were favorable for the adsorption of CLS on the surface of the talc.

3.3. Zeta Potential Measurements

Based on the results of the flotation tests, CLS and calcium ions were supposed to be an efficient combined depressant for chalcopyrite and talc flotation separation. Consequently, exploring the adsorption behavior of CLS/calcium ions on talc surface by zeta potential, FTIR, and AFM analyses is a meaningful objective. Figure 8 shows the zeta potentials of talc in the absence and presence of CLS. As can be seen from Figure 8, the isoelectric point pH of talc was about 2.1, and the surface of talc was negatively charged in a wide range of pH values. When pH < 3.7, the zeta potential on the talc surface shifted negatively after CLS was added. When pH >3.7, the zeta potential on the talc surface only shifted slightly. The above results indicated that the adsorption capacity of CLS on the talc surface in an acidic environment was stronger than that in an alkaline environment. This can be due to the fact that talc had a positive or small negative charge in the acidic environment, resulting in attraction forces or small repulsive forces between CLS and the talc in aqueous solution, which resulted in hydrogen bond formation and adsorption. However, talc had a more negative charge under alkaline conditions, so it did not readily adsorb negative CLS. Hence, the depression effect of CLS on talc in the alkaline environment was weaker than that in the acidic environment. Figure 9 exhibits the content of calcium ions at different pHs. After the addition of calcium ions, a positive shift in the zeta potential on the talc surface became obvious at pH > 3.7, which indicated that the presence of Ca2+ and Ca(OH)+ might promote the adsorption of CLS on talc and strengthen the depression effect of CLS. Ca2+ and Ca(OH)+ adsorbed on the talc, neutralized the negative charge on the surface of the talc, and generated the binding site with CLS, forming the [talc-Ca2+/Ca(OH)+-CLS] system.

3.4. FTIR Measurements

Figure 10 shows the results of the FTIR spectrum of CLS, and the peaks at 3387 cm−1, 1648 cm−1, 1042 cm−1, and 617 cm−1 could be assigned to the stretching vibration peak of −OH, the stretching vibration peak of the benzene ring, the symmetric stretching peak of SO3 sulfonate, and the asymmetric angular absorption peak of SO42− sulfate, respectively [27,28]. An FTIR spectrum test was conducted on CLS samples after interaction with the talc, and the results are shown in Figure 11. Figure 11 describes the FTIR spectra before and after CLS treatment of talc in the presence and absence of calcium ions. For talc, the tensile vibration and bending vibration of Si-O appeared at 1018 cm−1 and 462 cm−1, and the expansion peak and CO2 absorption peak of crystal water appeared at 3677 cm−1 and 670 cm−1. The addition of CLS resulted in two new peaks for talc, located at 3368 cm−1 and 1653 cm−1 and generated by −OH and benzene ring stretching vibrations, respectively, indicating that CLS was adsorbed onto the talc surface. Two new peaks were observed on the talc after the addition of calcium ions, which were seen at 3400 cm−1 and 1634 cm−1 and were generated by the −OH and benzene ring stretching vibration of CLS-2, respectively.

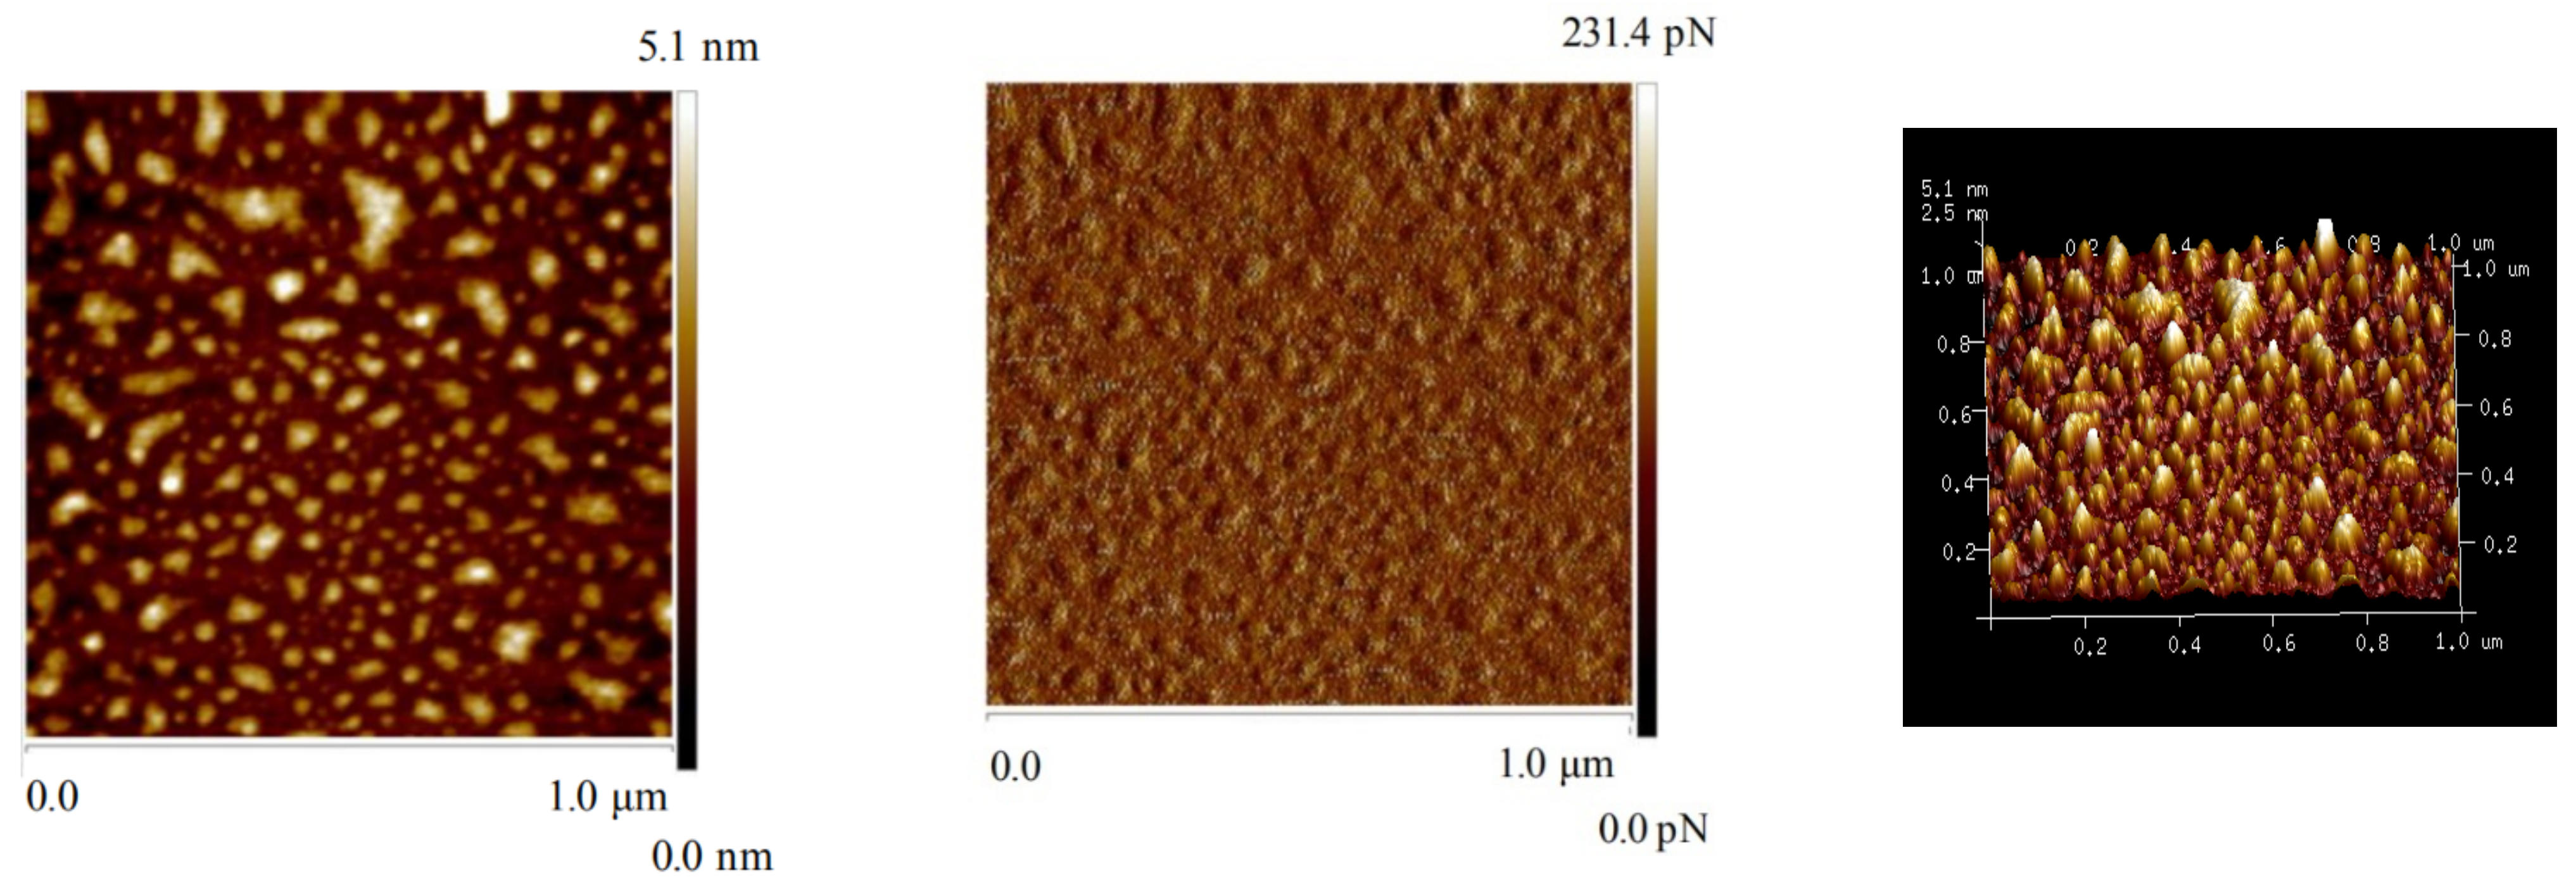
3.5. AFM Imaging Results

In order to study the effect of calcium ions on the adsorption behavior of CLS on the talc surface, the morphology of the CLS (200 mg/L, pH = 8) adsorption layer was studied by an AFM imaging method. Figure 12 shows the height and peak force error of exposed talc in the absence of CLS. Figure 13 and Figure 14 show the AFM images (height, peak force error, and 3D images) of CLS adsorbed on the talc surface with or without additional calcium ions. The AFM height map and 3D image reflect the adsorption morphology of the agent on the talc surface, while the peak force error image provides details of the difference in the deformation ability of the material surface, which is directly controlled by using the peak force as the feedback parameter.
As shown in Figure 13, in the absence of Ca2+ ions, CLS still had a certain adsorption capacity on the talc surface. The AFM image of CLS on the talc showed that CLS was adsorbed on the talc surface in a flocculating network, but the low content of calcium ions was not enough to overcome the electrostatic repulsion between the talc surface and CLS, and the hydrophobic groups of CLS were not well dispersed on the talc surface. Figure 14 shows the AFM diagram of CLS after the addition of the Ca2+(1 × 10⁻³ mol/L) solution. As can be seen from Figure 14, CLS was independently and densely adsorbed on the talc surface in a dispersive form, and the additional Ca2+ caused CLS to change from a flexible collapsed state into a highly dense shape. Combined with the previous zeta potential detection analyses, the [Talc-Ca2+/Ca(OH)+-CLS] system was beneficial to overcome the electrostatic repulsion between the talc surface and CLS, so that the hydrophilic groups of CLS were arranged independently and orderly on the talc surface, which greatly increased the hydrophilicity of the talc surface.
The sample roughness root mean square (RMS), peak-to-valley distance (PTV), apparent layer thickness (ΔPTV), and surface coverage are shown in Table 3. When CLS interacted with the talc, the ΔPTV without added calcium ions was 0.831 nm, and the ΔPTV with added calcium ions was 0.915 nm, which indicated that CLS was adsorbed on the surface of talc in multiple layers. After calcium ions were added, the adsorption layer of CLS on the surface of talc became thicker. The coverage rate of CLS on the surface of the talc without added Ca2+ was 76.75%, and the coverage rate of CLS on the surface of the talc with added Ca2+ was 91.46%. Compared with no added Ca2+, the coverage rate of CLS adsorbed on the talc was significantly improved, which indicated that the addition of calcium ions was beneficial to the adsorption of depressant CLS on the surface of the talc.

4. Conclusions

Several conclusions can be drawn from this study. Firstly, CLS had a strong depression effect on the talc, while calcium ions could enhance the depression effect of CLS on the talc though that the depression effect on chalcopyrite was weak. The flotation separation of chalcopyrite and talc can be achieved in a pH range of 6–12 by using the combined depressant of CLS and calcium ions. CLS mainly depressed the flotation of the talc by adsorbing on the talc surface. Ca2+ and Ca(OH)+ could adsorb on the talc surface after the addition of calcium ions, which would neutralize the negative charge of the talc surface, create sites for binding with CLS, and subsequently form the [talc-Ca2+/Ca(OH)+-CLS] system. Furthermore, results of AFM imaging showed that, in the absence of Ca2+ ions, CLS formed a flocculant network to adsorb on the talc surface. However, a dispersed and independent dense adsorption on the talc surface occurred when Ca2+(1 × 10⁻³ mol/L) solution was added. The addition of Ca2+ transformed the CLS adsorption layer from a flexible collapsed state to a highly dense shape, which thickened the adsorption layer on the talc surface and significantly improved the coverage.

Author Contributions

Conceptualization, methodology, formal analysis, investigation, writing—original draft preparation and writing—review and editing, Q.M. and H.Z.; Q.M. and H.Z. contributed equally to this work; supervision and project administration, L.O. All authors have read and agreed to the published version of the manuscript.

Funding

This work was financially supported by the National Natural Science Foundation of China (No. 51674291), and the Fundamental Research Funds for the Central Universities of Central South University (No. 2020zzts738).

Conflicts of Interest

The authors declare no conflict of interest.

References

  1. Seck, G.S.; Hache, E.; Bonnet, C.; Simoën, M.; Carcanague, S. Copper at the crossroads: Assessment of the interactions between low-carbon energy transition and supply limitations. Resour. Conserv. Recycl. 2020, 163, 105072. [Google Scholar] [CrossRef] [PubMed]
  2. Liu, D.; Zhang, G.; Chen, Y.; Huang, G.; Gao, Y. Investigations on the utilization of konjac glucomannan in the flotation separation of chalcopyrite from pyrite. Min. Eng. 2020, 145, 106089. [Google Scholar] [CrossRef]
  3. Jin, S.; Shi, Q.; Li, Q.; Ou, L.; Ouyang, K. Effect of calcium ionic concentrations on the adsorption of carboxymethyl cellulose onto talc surface: Flotation, adsorption and AFM imaging study. Powder Technol. 2018, 331, 155–161. [Google Scholar] [CrossRef]
  4. Khraisheh, M.; Holland, C.; Creany, C.; Harris, P.; Parolis, L. Effect of molecular weight and concentration on the adsorption of CMC onto talc at different ionic strengths. Int. J. Min. Process. 2005, 75, 197–206. [Google Scholar] [CrossRef]
  5. Mierczynska-Vasilev, A.; Beattie, D.A. The effect of impurities and cleavage character istics on talc hydrophobicity and polymer adsorption. J. Min. Process. 2013, 118, 34–42. [Google Scholar] [CrossRef]
  6. Morris, G.E.; Fornasiero, D.; Ralston, J. Polymer depressants at the talc-water interface: Adsorption isotherm, microflotation and electrokinetic studies. J. Min. Process. 2002, 67, 211–227. [Google Scholar] [CrossRef]
  7. Kursun, H.; Ulusoy, U. Influence of shape characteristics of talc mineral on the column flotation behavior. Int. J. Min. Process. 2005, 78, 262–268. [Google Scholar] [CrossRef]
  8. Mierczynska-Vasilev, A.; Beattie, D.A. Adsorption of tailored carboxymethyl cellulose polymers on talc and chalcopyrite: Correlation between coverage, wettability, and flotation. Min. Eng. 2010, 23, 985–993. [Google Scholar] [CrossRef]
  9. Jin, S.; Shi, Q.; Feng, Q.; Zhang, G.; Chang, Z. The role of calcium and carbonate ions in the separation of pyrite and talc. Min. Eng. 2018, 119, 205–211. [Google Scholar] [CrossRef]
  10. Lotter, N.O.; Bradshaw, D.J.; Becker, M.; Parolis, L.A.S.; Kormos, L.J. A discussion of the occurrence and undesirable flotation behaviour of orthopyroxene and talc in the processing of mafic deposits. Min. Eng. 2008, 21, 905–912. [Google Scholar] [CrossRef]
  11. Zhao, K.; Gu, G.; Wang, C.; Rao, X.; Wang, X.; Xiong, X. The effect of a new polysaccha ride on the depression of talc and the flotation of a nickel-copper sulfide ore. Min. Eng. 2015, 77, 99–106. [Google Scholar] [CrossRef]
  12. Ilhwan, P.; Seunggwan, H.; Sanghee, J.; Mayumi, I.; Naoki, H. Flotation Separation of Chalcopyrite and Molybdenite Assisted by Microencapsulation Using Ferrous and Phosphate Ions: Part I. Selective Coating Formation. Metals 2020, 10, 1667. [Google Scholar]
  13. Johnston, H.E. Reverse Flotation of a Chalcopyrite Concentrate. Bachelor’s Thesis, University of Queensland, St Lucia, Australia, 2005. [Google Scholar]
  14. Ahmed, M.M.; Ibrahim, G.A.; Hassan, M. Improvement of Egyptian talc quality for industrial uses by flotation process and leaching. Int. J. Min. Process. 2007, 83, 132–145. [Google Scholar] [CrossRef]
  15. Farrokhpay, S.; Ndlovu, B.; Bradshaw, D. Behavior of talc and mica in copper ore flotation. Appl. Clay Sci. 2018, 160, 270–275. [Google Scholar] [CrossRef]
  16. Parolis, L.A.; van der Merwe, R.; Groenmeyer, G.V.; Harris, P.J. The influence of metal cations on the behaviour of carboxymethyl celluloses as talc depressants. Colloids Surf. A Phys. Eng. Asp. 2007, 317, 109–115. [Google Scholar] [CrossRef]
  17. Feng, B.; Zhang, W.; Guo, Y.; Peng, J.; Ning, X.; Wang, H. Synergistic effect of acidified water glass and locust bean gum in the flotation of a refractory copper sulfide ore. J. Clean. Prod. 2018, 202, 1077–1084. [Google Scholar] [CrossRef]
  18. Liu, C.; Feng, Q.; Shi, Q. Utilization of N-carboxymethyl Chitosan as a Selective Depressant for Talc In Flotation of Chalcopyrite. Min. Min. 2019, 55, 108–115. [Google Scholar]
  19. Pan, G.; Shi, Q.; Zhang, G. Selective depression of talc in chalcopyrite flotation by xanthan gum: Flotation response and adsorption mechanism. Colloids Surf. A Phys. Eng. Asp. 2020, 600, 124902. [Google Scholar] [CrossRef]
  20. Liu, C.; Ai, G.; Song, S. The effect of amino trimethylene phosphonic acid on the flotation separation of pentlandite from lizardite. Powder Technol. 2018, 336, 527–532. [Google Scholar] [CrossRef]
  21. Ma, X.; Pawlik, M. The effect of lignosulfonates on the floatability of talc. Int. J. Min. Process. 2007, 83, 1–2. [Google Scholar] [CrossRef]
  22. Lim, Z.Q.; Aziz, N.A.A.; Idris, A.K.; Akhir, N.A.M. Green Lignosulphonate as co-surfactant for wettability alteration. Pet. Res. 2020, 5, 154–163. [Google Scholar] [CrossRef]
  23. Liu, R.; Sun, W.; Hu, Y.; Wang, D. Effect of organic depressant lignosulfonate calcium on separation of chalcopyrite from pyrite. J. Cent. South Univ. Technol. 2012, 16, 753–757. [Google Scholar] [CrossRef]
  24. Liu, C.; Zhu, G.; Song, S.; Li, H. Flotation separation of smithsonite from quartz using calcium lignosulphonate as a depressant and sodium oleate as a collector. Miner. Eng. 2019, 131, 385–391. [Google Scholar] [CrossRef]
  25. Zhou, H.; Zhang, Z.; Ou, L.; Mai, Q. Flotation separation of chalcopyrite from talc using a new depressant carrageenan. Colloids Surf. A Physicochem. Eng. Asp. 2020, 603, 125274. [Google Scholar] [CrossRef]
  26. Paredes, Á.; Acuña, S.M.; Toledo, P.G. AFM Study of Pyrite Oxidation and Xanthate Adsorption in the Presence of Seawater Salts. Metals 2019, 9, 1177. [Google Scholar] [CrossRef] [Green Version]
  27. Le Guern, C.; Conil, P.; Houot, R. Role of calcium ions in the mechanism of action of a lignosulphonate used to modify the wettability of plastics for their separation by flotation. Miner. Eng. 2000, 13, 53–63. [Google Scholar] [CrossRef]
  28. Wang, L.; Zhou, W.; Song, S.; Gao, H.; Niu, F.; Zhang, J.; Ai, G. Selective separation of hematite from quartz with sodium oleate collector and calcium lignosulphonate depressant. J. Mol. Liq. 2020, 322, 114502. [Google Scholar] [CrossRef]
Figure 1. XRD patterns of pure chalcopyrite (a) and talc (b) samples.
Metals 11 00651 g001
Figure 2. Monomeric molecular structure of CLS.
Metals 11 00651 g002
Figure 3. Effect of PBX dosage on the flotation of chalcopyrite and talc (c(MIBC) = 0.125 mL/L, pH = 8).
Metals 11 00651 g003
Figure 4. Effect of CaCl2 dosage on the flotation of chalcopyrite and talc (c(PBX) = 50 mg/L, c (MIBC) = 0.125 mL/L, pH = 8).
Metals 11 00651 g004
Figure 5. Effects of CLS dosage on the flotation behavior of chalcopyrite (a) and talc (b) in the presence of various Ca2+ ions (c(PBX) = 50 mg/L, c(MIBC)= 0.125 mL/L, pH = 8).
Metals 11 00651 g005
Figure 6. Effect of pH on depression effect of CLS on chalcopyrite(a) and talc (b) in the presence of various Ca2+ ions (c(CLS) = 200 mg/L, c(PBX) = 50 mg/L, c(MIBC) = 0.125 mL/L).
Metals 11 00651 g006
Figure 7. Adsorption behavior of CLS on chalcopyrite and talc with/without the presence of Ca2+ ions at pH 8.
Metals 11 00651 g007
Figure 8. Effect of CLS on zeta potential values of talc with/without the presence of Ca2+ ions (c(CLS) = 200 mg/L).
Metals 11 00651 g008
Figure 9. Calcium ion solution composition at different pH values.
Metals 11 00651 g009
Figure 10. FTIR spectrum of CLS.
Metals 11 00651 g010
Figure 11. FTIR spectrum of talc conditioned with CLS with/without the presence of Ca2+ ions.
Metals 11 00651 g011
Figure 12. Height and Peak Force Error image of bare talc (c(CLS) = 0 mg/L, pH = 8).
Metals 11 00651 g012
Figure 13. Height, Peak Force Error, and 3D image of talc treated with CLS (c(CLS) = 200 mg/L, pH = 8).
Metals 11 00651 g013
Figure 14. Height, Peak Force Error, and 3D image of talc treated with CLS and Ca2+ (c(CLS) = 200 mg/L, c(Ca2+) = 1 × 10⁻³ mol/L, pH = 8).
Metals 11 00651 g014
Table 1. Chemical composition of chalcopyrite and talc.
SampleMass Fraction/%
CuTFeSMgOSiO2Al2O3
Chalcopyrite33.63529.76433.584-2.782-
Talc-0.774-29.56164.8300.366
Table 2. Effect of CLS on flotation performance with/without the presence of Ca2+ ions (c(CLS) = 200 mg/L, c(Ca2+) = 1 × 10⁻³ mol/L, c(PBX) = 50 mg/L, c(MIBC) = 0.125 mL/L, pH = 8).
ConditionsProductYield/%Grade/%Recovery/%Separation Efficiency/%
CuMgOCuMgO
-Concentrate81.515.317.888.779.22.3
Tailings18.58.620.511.320.8
Feed100.014.018.3100.0100.0
CLSConcentrate27.923.86.846.211.011.7
Tailings72.110.821.153.889.0
Feed100.014.417.1100.0100.0
Ca2+ + CLSConcentrate23.429.73.050.04.126.3
Tailings76.69.021.750.095.9
Feed100.013.917.3100.0100.0
Table 3. Morphological details (RMS, PTV, ΔPTV, and coverage) for CLS adsorbed on talc (c(CLS) = 200 mg/L, c(Ca2+) = 1 × 10⁻³ mol/L, pH = 8).
SamplesRMS
(nm) ± 0.005
PTV
(nm) ± 0.005
ΔPTV
(nm) ± 0.005
Coverage (%)
Bare talc0.2750.176--
Talc + CLS1.171.0070.83176.75
Talc + Ca2++ CLS1.271.0910.91591.46
Publisher’s Note: MDPI stays neutral with regard to jurisdictional claims in published maps and institutional affiliations.

