Abstract
Iron-based shape memory alloys (SMAs) have been widely studied during the last years, producing new formulations with potential applications in civil engineering. In the present paper, the microstructure and the thermomechanical behavior of the Fe-28Mn-6Si-5Cr memory alloy has been investigated. At room temperature, the presence of ε-martensite and γ-austenite was confirmed using optical and electron microscopy techniques. The martensitic transformation temperatures (As, Af, Ms, and Mf) were determined by differential scanning calorimetry, together with an X-ray diffraction technique. The use of these techniques also confirmed that this transformation is not totally reversible, depending on the strain degree and the number of thermal cycles. From the kinetics study of the ε → γ transformation, the isoconversion curves (transformation degree versus time) were built, which provided the information required to optimize the thermal activation cycle. Tensile tests were performed to characterize the mechanical properties of the studied alloy. These kinds of tests were also performed to assess the shape memory effect, getting a recovery stress of 140 MPa, after a 7.6% pre-strain and a thermal activation up to 160 °C.
1. Introduction
Shape memory alloys (SMAs) are a variety of smart materials that can recover their original shape through temperature variation, after the material has been deformed beyond its elastic limit []. The development of SMAs started from the discovery of Au-Cd alloy with shape memory effect (SME) by Chang and Read in 1951, while later on, in 1961 Buehler et al. discovered the SME in Ti-Ni alloys. This marked the starting point for the prompt development of new SMAs with potential engineering applications. The iron-based shape memory alloys emerged as an alternative to the Ti-Ni alloys due to their low cost, easy manufacturing process and better mechanical properties (higher stiffness and strength). They are specially suitable for applications that require high shape memory stress, i.e., constrained recovery applications; typical examples are pipe joins, rail couplings or pre-stressing reinforcing elements in civil engineering [,,]. The SME in Fe-Mn-Si alloy systems was discovered by Sato et al. in 1982 []; different alloying elements were subsequently added to improve this SME, making the systems more suitable for structural applications [,,]. Nowadays, research in this field is growing, in order to obtain smart materials which are more competitive for civil engineering purposes.
In iron-based shape memory alloys (Fe-SMAs), the SME is based on the stress-induced transformation from γ(fcc)-austenite to ε(hcp)-martensite at low or intermediate temperature or by the action of stress, and the reverse transformation (ε → γ) at higher temperatures by heating. These transformations are governed by the motion of Shockley partial dislocations during heating []. In the last decades, extensive investigation has been carried out focused on the ε↔γ phase transformations, in order to better understand the thermomechanical behavior of the Fe-SMAs. The composition seems to have direct effect on the shape memory capacity. In this line, Mn is the basic element in the Fe-Mn-Si memory alloys. Depending on the Mn content, two types of martensite structures, namely ε and α’, can be formed from the γ-austenite phase. Both the transformation characteristics and the structure are different in each type of martensite. Only the γ(fcc) → ε(hcp) martensitic transformation is responsible for the shape memory effect in this alloy. The presence of α’-martensite is quite sensitive to the Mn content of the alloy; thus Mn additions higher than 21%wt stabilize the ε-martensite with respect to α’-martensite [,,,]. However, considering that Mn stabilizes the γ-austenite phase, the martensitic transformation can be inhibited []. The addition of small amounts of Si to the Fe-Mn system significantly improves the shape memory effect due to the reduction of the stacking fault energy of the austenite [,]. Later on, more elements were added to the Fe-Mn-Si system, particularly the addition of Ni and/or Cr to the Fe-Mn-Si alloys, which provide a combination of good corrosion resistance and good SME [,]. In the last 20 years, an alternative strategy based on the precipitation of fine particles, such as NdC, VN, TiC or VC, has been explored with remarkable increase in the recovery strain [,,,].
On the other hand, Standford et al. point out that the SME depends largely on the mechanical and thermal processes to which the alloy is submitted []. Several researchers reported the positive effects of ‘training’ the Fe-SMAs, namely, the repeated application of small strain followed by recovery annealing. Although the appropriate thermomechanical processing depends on the alloy composition, the recovery strain can be improved by up to around 5% [,,,,].
These results suggest that, for specific Fe-SMA, the optimum treatments have to be researched, in order to acquire the desired SME and mechanical properties. It should be remembered that the ultimate goal is the use of these Fe-SMAs for the construction of structural products.
The aim of the present work is to study the effect of mechanical and heat treatments on the microstructure of a commercial Fe-28Mn-6Si-5Cr shape memory alloy, together with the assessment of the transformation temperatures and the kinetics of the transitions. The morphological and crystallographic properties have been investigated by means of scanning electron microscopy (SEM) and X-ray diffraction (XRD), and the thermomechanical features have been assessed using differential scanning calorimetry (DSC) and tensile tests. The use of commercial alloy is a relevant aspect, since most of the studies have been performed on alloys synthesized in laboratory conditions that can yield different results than those obtained with commercial alloys.
2. Materials and Methods
The Fe-28Mn-6Si-5Cr (wt%, nominal composition) shape memory steel, hereinafter SMS, was provided by Awaji Materia Co., Ltd. (Sumoto, Japan). The material was received in pre-strained state.
The samples were mechanically ground with successive grades of SiC papers up to 1200 grade, after which they were polished with diamond paste of 1 µm grain size to obtain a mirror-like appearance. Finally, the samples were rinsed using ethanol and distilled water, and were air-dried. The microstructure was revealed by etching with modified Beraha’s reagent with potassium metabisulphite and hydrochloric acid, all the chemical reagents were supplied by Sigma-Aldrich® (Merck KGaA, Darmstadt, Germany). The optical observations were performed using a light optical microscope (LOM) GX51 from Olympus® (Olympus Corporation, Tokyo, Japan).
The surface morphology was studied with scanning electron microscopy (SEM). The equipment employed was an Electroscan JSM-54® model JEOL 5410. The chemical composition of the phases was determined by energy dispersive X-ray spectroscopy (EDS) with the Link ISIS 300 X-ray detector. The acceleration voltage was 20 kV, both are from OXFORD® instrument (Abingdon, England).
The X-ray diffraction (XRD) technique was used to characterize the phases present in the alloy, and the changes which occurred during deformation and heating processes. The diffraction patterns were collected using a X’Pert Pro (from Malvern PANalytical®, Malvern, UK) powder diffractometer with monochromatized CuKα radiation (λ = 1.54 Å) from 2θ = 20° up to 2θ = 130°. Eva software was used to evaluate the position of the peaks, 2θ, their intensity Ihkl and the full width at half maximum (FWHM). The peaks were identified using the International Centre for Diffraction Data (ICDD®, Philadelphia, PA, USA) powder diffraction data.
The mechanical properties and recovery stress were evaluated from tensile tests using a Universal Testing Machine (Shimadzu AG-I®, Shimadzu Corporation, Kyoto, Japan) with a capacity of 250 kN. Proportional tensile specimens with a gauge length of 50 mm and a diameter of 10 mm were manufactured. The tensile tests were performed using a strain rate of 10 mm·min−1, at room temperature. The stress–strain curves were obtained by using a contact extensometer (accuracy Class 0.5) and a Fiber Bragg Grating sensor, (FBG) that was interrogated by FS22® (Hottinger Brüel & Kjaer GmbH, Darmstadt, Germany) interrogator (resolution = 1.0 pm, sampling frequency = 1 Hz). The strain data acquisition system was based on Catman software.
The transformation temperatures were determined by differential scanning calorimetry (DSC) measurements, using Mettler Toledo® (Greifensee, Switzerland) 822e/400 equipment, from −70 °C to 210 °C, with a heating rate of 2.5 °C min−1 in a stream of N2 (flow: 50 mL min−1). Previous DSC measurements were performed in order to optimize the critical parameters, such as the interval of temperature and the heating rate. Samples with sizes of about 60 mg were placed into a 40 μL Al crucible. The same technique was also used to study the kinetics of the thermal activation (ε-martensite to γ-austenite transformation) for the SMS alloy. For that, three different heating rates: 5 °C min−1, 10 °C min−1, and 15 °C min−1 were used. The interval of temperature was limited to the martensitic transformation (ε → γ) window. The DSC data have been treated using the ‘model-free isoconversional’ method, developed by Vyazovkin, usually denoted as model-free kinetic (MFK) [,], which allows the evaluation of the effective activation energy, Eα, as a function of the conversion degree, α. The latter parameter is determined as the area of the DSC peak associated with the considered transformation. For that, and considering a set of n experiments carried out at different heating rates, Ti(t), the effective activation energy can be assessed at any particular value of α by finding the Eα that minimizes the function:
where
In Equation (2), α varies from 2Δα to 1 − Δα with a step Δα = (m + 1)−1, where m is the number of the equidistant values of α chosen for the analysis. The integral J in Equation (2) is evaluated numerically, substituted in Equation (1) and the minimization is carried out to find Eα. This procedure is repeated for each value of α to establish the dependence of Eα with α. A more detailed explanation can be found in references [,,,].
3. Results and Discussion
3.1. Microstructural Characterization
Figure 1 shows the optical micrographs of the pre-strained SMS alloy at different magnifications. At lower magnification (Figure 1a) the size of the austenite grains, which are very uniform and randomly oriented, can be easily appreciated. The deformation twins inside the grain can also observed. At higher magnification (Figure 1b), not only the γ-austenite grains but also the stress-induced ε-martensite plates can be clearly distinguished, appearing as parallel dark lines inside the γ-austenite grains.
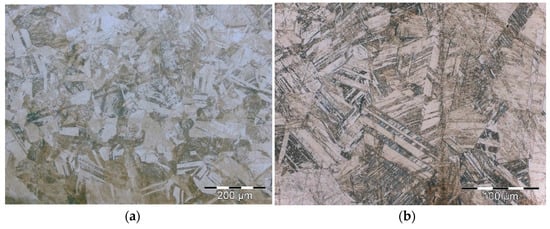
Figure 1.
Optical micrographs of the Fe-28Mn-6Si-5Cr alloy at low (a) and high (b) magnifications.
The coexistence of both phases was corroborated by X-ray diffraction measurements in agreement with the observations of other researchers [,,]. This structure is perceived with more detail in Figure 2. The SEM images clearly show the stress-induced ε-martensite formed in regularly spaced individual plates with uneven thicknesses. The twin boundaries in the γ-austenite grains are also visible.
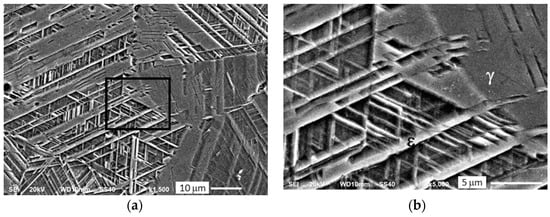
Figure 2.
SEM micrograph showing a general view of the SMS alloy (a) and the enlarged area labeled with a black square in Figure 2a (b).
The SMS alloy was thermally activated by heating at 160 °C for 5 min, and the microstructure is shown in Figure 3. The temperature of 160 °C is above Af (the temperature at which the ε → γ transformation finished), which is 141 °C. This value was obtained from DSC experiments—a detailed discussion of the thermal analysis results will be provided in Section 3.3. The observed microstructure reveals the disappearance of the martensite plates, indicative that the reverse transformation (ε → γ) has been completed. Twins and slip bands are clearly visible, a characteristic feature of dislocation motion. In addition, the presence is noticeable of large inclusions that are heterogeneously distributed all over the sample, although there is a higher accumulation in the central zone of the specimen; this feature could be due to a greater solute enrichment in this area. These precipitates are located at the grain boundaries and also within the austenite grains, as Figure 3b displays. In addition, the size of particles embedded into austenite grains is much smaller, around 300–500 nm, than that of precipitates located at the grain boundary, which are roughly 1–3 μ in size.
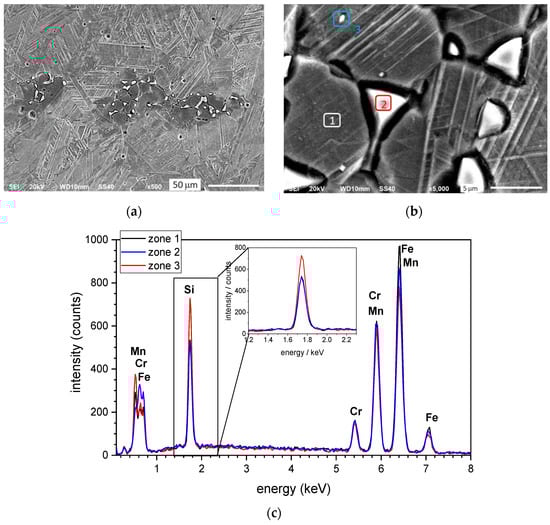
Figure 3.
SEM micrograph of the Fe-28Mn-6Si-5Cr SMS alloy after thermal activation (a), a detail of the precipitate morphology (b), EDS spectra corresponding to zones 1, 2, and 3 indicated in Figure 3b (c).
The composition of the precipitates was assessed using the EDS technique. The spectra obtained in zones 1, 2, and 3 of Figure 3b are shown in Figure 3c, and the chemical microanalysis results are displayed in Table 1. Particles located at the grain boundary have a similar composition to the surrounding matrix; however, the precipitates observed within the parent austenite grains are enriched in Mn and mainly in Si, and accordingly, they are depleted in Fe. The phase identification is discussed in the next section.

Table 1.
EDS analysis corresponding to the phases and particles identified in Figure 3.
3.2. X-ray Diffraction Study
Figure 4 shows the XRD pattern corresponding to the SMS alloy in the pre-strained state.
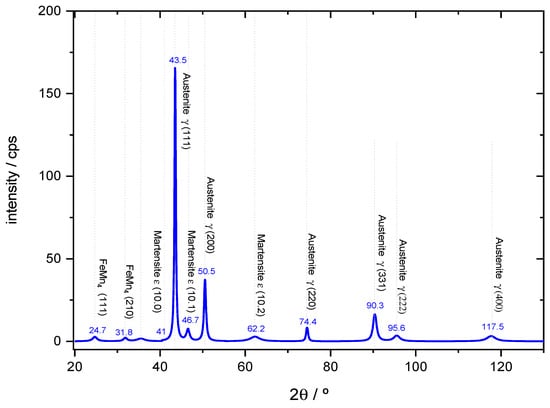
Figure 4.
XRD pattern corresponding to the Fe-28Mn-6Si-5Cr SMS alloy in pre-strained state.
As expected, the γ-austenite is the predominant phase with the strongest diffraction peaks at 2θ = 43.5° and 2θ = 50.5°, which correspond to the reflections of (111) and (200) planes, respectively. The lower intensity peaks are located at 2θ = 74.4°, 2θ = 90.3°, 2θ = 95.6°, and 2θ = 117.5°, associated with the reflection of the (220), (311), (222), and (400) planes, as labeled in Figure 4. In addition, the ε-martensite phase is also detected, confirmed by the presence of small peaks at 2θ = 46.7° and 2θ = 62.2° ascribed to the (10.1) and (10.2) planes, respectively []. On the other hand, no peaks related to the α’-martensite (bcc) have been detected; this result is expected considering the Mn content of the studied alloy (28%wt.). Previous studies postulate that a minimum of 21% wt. Mn content is necessary to stabilize the ε-martensite in respect of the α’-martensite phase [].
As aforementioned, the SME in the iron-based shape memory alloys results from the stress-induced transformation of γ-austenite to ε-martensite and its reversion (ε → γ) by heating. To characterize this reversibility, the pre-strained alloy was heated at a temperature above Af. In these conditions, the reverse transformation should be activated. Figure 5 illustrates the changes in SMS alloy subjected to a temperature of 160 °C for 5 min.
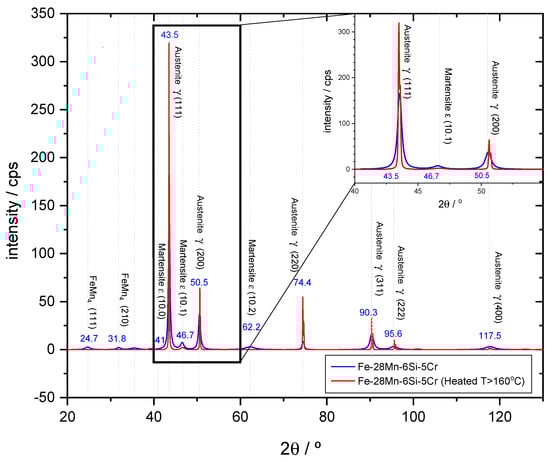
Figure 5.
XRD diffractograms of the SMS alloy in pre-strained state (blue) and after thermal activation at 160 °C during 5 min (red). A detailed insert of 2θ between 40 and 60° is provided.
As expected, the intensity of martensite peaks decreases, which is clearly detected in ε(10.1) peak. In addition, there is a noticeable big intensity increase observed in all the austenite peaks. In addition, there is a significant decrease in the width of the peaks, which was assessed using the full width at half maximum (FWHM) parameter. Table 2 displays the quantification of the peak intensity ratio (I/Imax) and the FWHM parameters in the main diffraction peaks of γ-austenite. The peak intensity can be considered a measure for the volume fraction of a phase in a certain grain orientation []. Therefore, the increase of the peak intensity observed in all the γ-austenite grain families after the thermal activation confirms the reverse ε → γ transformation. On the other hand, it can be seen that this increase strongly depends on the grain orientation. Thus, the highest increase is observed in the (220) grains. This result was already observed by other researchers, which explains their softer behavior considering the Schmid factor for the movement of the Shockley partial dislocations. The Schmid factor for (220) family is 0.47, so these grains are optimally-oriented, while the other families have Schmid factors far from this value [,]. With respect to the FWHM decrease, Leinenbach et al. [] attribute this evolution to the combination of two contributions: one is the reverse ε → γ transformation, which can correlate to the peak intensity increase, and the second is the reversible motion of the Shockley partial dislocations that not modify the peak intensity. This last contribution could explain the highest peak refinement observed in the (311) family.
Table 2.
Peak intensity ratio (I/Imax) and FWHM corresponding to the characteristic diffraction peaks of the γ-austenite.
The reversibility of stress-induced martensite was investigated by Stanford and Dunme in Fe-Mn-Si shape memory alloys []. Thus, in Fe-Mn-Si alloys with 5–6%wt. Si, they observed that this reversibility is limited, mainly when they are submitted at a high strain percentage. This irreversible transformation is illustrated in Figure 6, where the XRD pattern corresponding to the highly deformed SMS alloy is compared with that obtained in the same highly deformed sample subsequently heated at 180 °C for 5 min. Although a slight increase is observed in the γ-austenite peaks’ intensity, the most remarkable feature is the presence of the ε-martensite peaks, which undergo only a small intensity decrease. This irreversibility should be related to the large volume change associated with the phase transformation, which generates dislocations that pin at phase boundary and inhibit its reverse motion [].
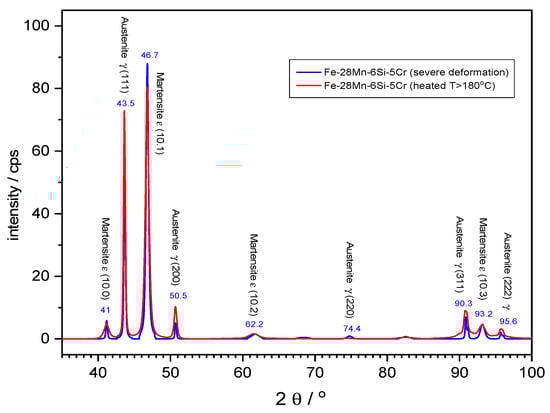
Figure 6.
XRD patterns corresponding to the Fe-28Mn-6Si-5Cr alloy after severe straining (blue) and after heating at 180 °C for 5 min.
Some small peaks are observed at 2θ = 27.4° and 2θ = 31.8° positions. Although their ascription is not clear, they should be related to the precipitates observed in SEM micrographs. As previously described, two types of particles are observed, located at the grain boundaries and within the austenite grains (see Figure 3b). Considering the very low volume fraction of the particles within the grains, it is probable that they cannot be detected by X-ray diffraction; therefore, these peaks should correspond to the precipitates located at the grain boundary. Lin et al. [] studied grain boundary precipitates in an Fe-30-Mn-6Si-5Cr SM alloy, which has a composition very similar to those studied in this work. They are formed during annealing at 600–750 °C and exhibit a bcc structure with a lattice parameter about of 8.8 Å. Stanford et al. [] identify these particles as χ phase. In these studies, the samples were submitted to an annealing process at high temperatures; however, in the present work, the SMS alloy is thermally activated at 160–180 °C. On the other hand, the observed diffraction peaks fit well to the intermetallic FeMn4 pattern (code: 00-003-1180), which has a fcc structure and a lattice parameter of 6.29 Å. These disagreements suggest that the observed precipitates do not correspond to the χ phase. Taking into account that the composition of these grain boundary precipitates includes Si and Cr (see Table 1), they should be isomorphic to the FeMn4 compound with certain Cr and Mn atomic substitutions in the fcc lattice of Fe. Further studies should be carried out to confirm this assumption.
3.3. Thermal Analysis
Figure 7 depicts the DSC curve corresponding to the heating and cooling cycles for the SMS alloy. The DSC peaks are associated with the thermal-induced transformation of ε (martensite) ↔ γ (austenite); the main parameters extracted from these curves are also included. Ms and As are defined as the critical temperatures to start the fcc → hcp and the hcp → fcc martensitic transformations, respectively. Similarly, Mf and Af correspond to the temperatures where no further changes related to these transitions are detected. The enthalpy associated with these transformations is also included.
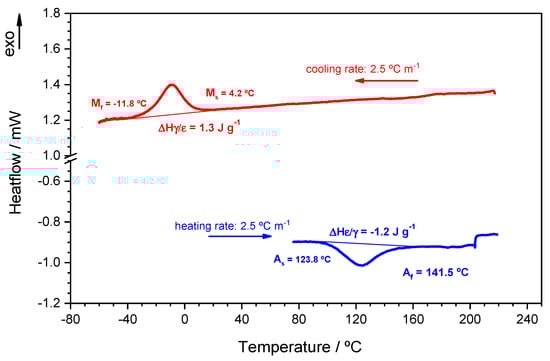
Figure 7.
DSC curve corresponding to the heating and cooling cycles of the SMS alloy.
The values agree well with previous studies []. The low Ms value is noteworthy, and can be related to the high amount of Mn in this alloy and its effect of stabilizing the fcc γ-austenite, even at very low temperatures []. Furthermore, the Si and Cr additions to Fe-Mn alloys enhance reversibility of thermally or stress induced ε-martensite, involving a decrease of Ms, as well [,]. This low temperature is not in agreement with the presence of ε-martensite observed in the XRD pattern recorded at room temperature (see Figure 4). The same discrepancy has already been observed by other researchers [,], which explains the presence of the ε-martensite at room temperature by mechanically-induced transformation during the sample conditioning. However, an alternative interpretation can be made, based on the fact that the Ms temperature increases significantly when decreasing the cooling rate []. To analyze this aspect, DSC measurements at four cooling rates were performed and the results are shown in Figure 8. At 1 °C min−1 cooling rate, the onset of the γ → ε transformation is close to room temperature; thus, the presence of martensite is feasible at room temperature if the alloy is kept long enough after cooling.
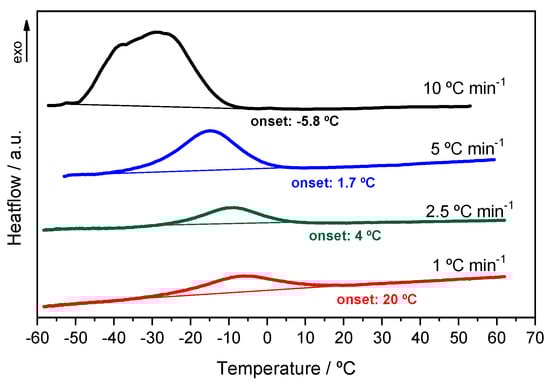
Figure 8.
DSC curves corresponding to the γ → ε transformation at four different cooling rates. The onset is related to the Ms temperature.
On the other hand, the heat involved in the martensitic transformation is very close to the ε → γ transformation and the reverse process, which indicates that the transformations occurred simultaneously in the whole sample. The obtained values are in the same order of magnitude as those found in the literature [,], although they can markedly differ depending on the alloy composition and on the prior thermomechanical treatments [].
The effect of the thermal cycling on the fcc/hcp martensitic transformation temperatures was also investigated to discover more about the reversibility of the martensitic transformation and the thermal stability of the phases involved; both aspects are the base of the shape memory effect. These aspects have been studied for Fe-Mn alloys [], Fe-Mn-Co [,], Fe-Mn-Si [,], and Fe-Mn-Cr [] ternary systems; however, no references have been found related to the Fe-Mn-Si-Cr quaternary system.
Figure 9 illustrates the effect of the number of cycles in the DSC peaks corresponding to ε ↔ γ reverse transformation. The measurements were performed between −60 °C and 200 °C, at heating and cooling rates of 5 °C·min−1. A reduction in the peak height with the cycle number can be observed, which is more evident for the ε → γ transformation. The heat involved in these transformations was evaluated from the area under the corresponding peak. The normalized enthalpy values (ΔH*) were obtained following the expression:
where ΔH* is the normalized enthalpy (in absolute value) and ΔHi and ΔH1 are the enthalpies obtained in the cycle number i and in the first cycle, respectively.
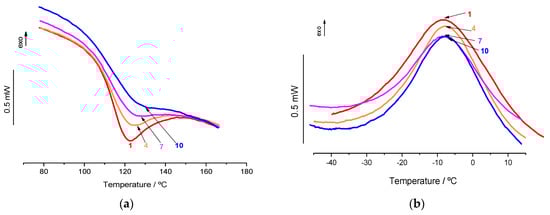
Figure 9.
DSC peaks corresponding to the ε → γ transformation (a) and the reverse ε → γ transformation (b) for ten consecutive cycles.
The results are plotted versus cycle number in Figure 10a. The evolution suggests that the fraction of the transformed phase slightly diminishes with the increase of the cycle number, which means that the ε-martensite↔γ-austenite transformation is not totally reversible. The magnitude of the enthalpy is also related to the amount of crystal defects, which should increase with thermal cycling, even though Marinelli et al. [] suggest that this contribution to the energy of the crystal is very small.
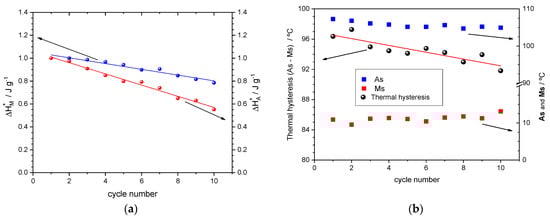
Figure 10.
Evolution with the cycle number of: the normalized enthalpies for the ε → γ transformation (, absolute values) and the reverse γ → ε transformation () (a). The thermal hysteresis (black circle) and Ms/As temperatures (blue and red squares, respectively) (b).
From the DSC curves, the As and Ms temperatures and the thermal hysteresis can be observed, calculated as As-Ms. The effect of the thermal cycling in these parameters is illustrated in Figure 10b. As can be seen, As and Ms temperatures have very stable values; As decreases around 3 °C after 10 cycles and Ms increases by the equivalent amount. These results differ from the general tendency found in the literature, in which As shifts to higher temperatures and Ms evolves to lower temperatures. These shifts are monotonic during the initial cycles whereas they tend to converge to stable values at later cycles [,,,]. Baruj et al. [] explain these evolutions as being due to the increase of obstacles (dislocations and stacking faults) generated with the increase of thermal cycles that inhibit the movement of the interface. The same inhibition effect was also observed by the introduction of plastic deformation in the fcc-austenite phase. Based on these findings, the discrepancies observed can be explained considering that the SMS alloy is in a pre-strained state; with some dislocations density. In contrast, the SMS alloys investigated in the aforementioned studies are submitted to annealing heat treatment that involves the recrystallization of the material, before the thermal cycling. In this state it is supposed they are dislocation-free. Therefore, the stabilization period observed in these alloys should correspond to the evolution noticed in the Fe-28Mn-6Si-5Cr alloy studied in the present work.
The DSC technique has also been used to study the kinetics of the ε → γ transformation. This occurs in a narrow temperature interval and it is better defined than the γ → ε reverse transformation. For that reason, the studies are usually focused on the ε → γ transformation [].
Figure 11a shows the DSC data corresponding to the endothermic peak associated with the ε → γ transformation at three heating rates. As expected, at higher heating rates the peak is better distinguished and the peak temperature is slightly shifted towards higher values. However, the peak morphology is not affected by the heating rate. The existence of overlapping peaks that partially resolve at different scan rates would be indicative of a multi-stage process. In this sense, the results obtained by Liu et al. [] in the NiTi alloys show that the reverse transformation (ε → γ) can occur in two stages, one corresponding to stress-induced martensite and the other to thermal-induced martensite.
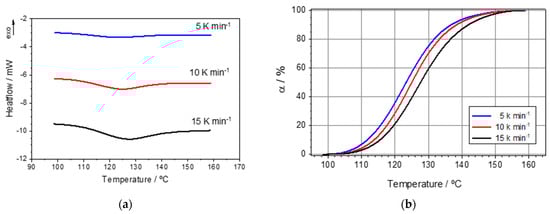
Figure 11.
DSC data regarding to the ε → γ transformation at different heating rates (a). Evolution of the transformation degree (α) with the temperature obtained from the experimental DSC data in Figure 3a (b).
By the integration of the enthalpies recorded in Figure 11a, the transformation degree, α, can be obtained, and its evolution with temperature is depicted in Figure 11b.
From these experimental data and applying the isoconversional analysis described in the experimental section, the effective activation energy, Eα, is extracted as a function of the transformation degree, α. The results are plotted in Figure 12a. Eα is almost independent of α which suggests that the ε → γ transformation is governed by single-step reaction. More careful analysis reveals a slight decline of Eα with the extent of transformation degree. Although the interpretation is unclear, Vyazovkin suggests that this feature is characteristic of endothermic quasi-reversible reactions []. This result supports the conclusions obtained by the thermal cycling regarding to the irreversibility of the ε ↔ γ transformation. The calculated isoconversion curves (transformation degree versus time) for three different temperatures are displayed in Figure 12b. As expected, less time is necessary to acquire high transformation degrees when the activation temperature is higher. The information provided by these plots is important to optimize the thermal activation cycle in the SMS alloys. To the best of our knowledge, this kind of kinetic analysis has not been performed in SMS alloys.
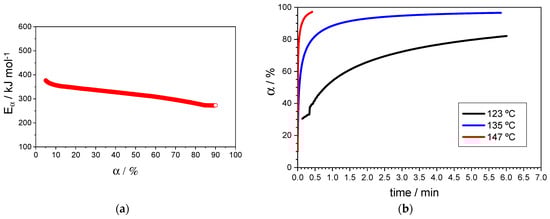
Figure 12.
Evolution of the activation energy, Eα, with the conversion degree, α (a). Calculated isoconversion curves at three temperatures (b).
3.4. Mechanical Behavior
Tensile tests were conducted to characterize the mechanical properties of the Fe-28Mn-6Si-5Cr alloy. The stress–strain curve obtained at room temperature is shown in Figure 13, which also includes a detail of the setting of the extensometer and the FBG sensor in the sample. The determined values of 0.2% proof stress (Rp0.2), ultimate tensile strength (UTS), elongation (EL%), and necking (reduction of area, in percentage) are indicated in Figure 13.
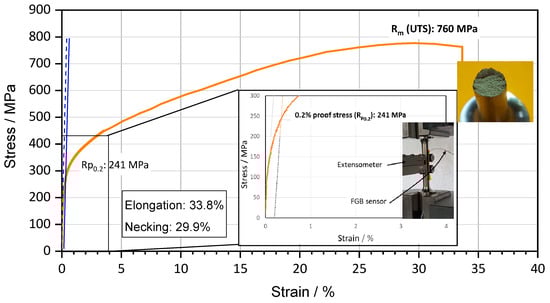
Figure 13.
Stress–strain characteristic curve of Fe-28Mn-6Si-5Cr alloy in pre-strained state. A detail of the extensometer and the FBG sensor placed on the sample is inserted, together with a picture that illustrates the fracture surface at the end of the test.
Although the mechanical properties are strongly affected by the thermomechanical history of the material (heat treatments or hot/cold working), the obtained values are in good agreement with those reported for these kinds of alloys [,]. The high elongation value justifies the surface fracture observed after the specimen breaks, characteristic of ductile fracture as can be seen in the picture included in Figure 13. In tensile tests, the ductile fracture is generated by the nucleation, growth, and coalescence of microvoids near to the center tested specimen. The examination of the surface fracture at high magnification, using SEM technique, reveals a dimpled surface, on which are traces of the microvoids generated during the fracture. Figure 14a shows the morphology of the central zone, characterized by a large number of equiaxed dimples with heterogeneous size, even though two families are predominant, with 1–2 μm and 10–20 μm diameters. The presence of precipitates of different sizes, described in Section 3.1, can explain the diverse size observed in the microvoids, since it is well-known that these particles accelerate the void-nucleation process []. Figure 14b displays the morphology in the shear lip, where the dimples are elongated and less deep.
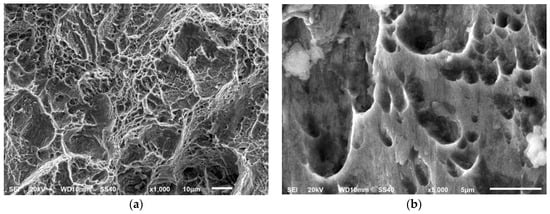
Figure 14.
Surface fracture of the SMS alloy exhibiting ductile fracture after tensile test. A detail of the central region (a) and the shear lip (b).
The shape memory effect (SME) was assessed under restrained strain conditions. The specimen was first submitted to a tensile pre-strain of 7.6% at room temperature followed by an unloading to a small tensile stress (σ ≈ 80 MPa). This small stress prevents buckling failure due to the thermal expansion effect on it during the heating phase []. The pre-deformed sample was heated to 160 °C and subsequently cooled to room temperature. The strain in the SMS is kept constant in order to simulate the behavior of the SMS elements when they are applied to stiff civil or mechanical structures. The stress–strain evolution under these conditions is shown in Figure 15. The general trend follows the pattern observed by other researchers in shape memory steels [,,,,]. The non-linear deformation response during loading is noteworthy. Lee et al. explain this behavior as being due to a γ-austenite to ε-martensite transformation, and due to plastic flow []. The unloading curve also deviates from its linear behavior showing a pseudo-elastic behavior as a result of partial reverse transformation of the previously formed ε-martensite into γ-austenite []. The residual strain after uploading is about 6.2%; this value is higher than that usually observed in the literature, perhaps because of the high pre-strained level applied to the sample. Furthermore, Hong et al. also obtained high residual strain values when applying a 8% pre-strain level []. During the heating stage, an initial stress decrease is observed due to the thermal expansion of the SMS alloy; however, as the temperature increases the reverse phase transformation (ε → γ) is activated and the tensile stress is generated upon the specimen, which means the shape memory effect overcomes the thermal expansion. The sample is then cooled to room temperature and the tensile stress continues to increase due to the thermal contraction of the alloy. Based on the data recorded in Figure 15, the recovery stress achieved is 140 MPa; this value is in accordance with the literature reviewed [] and confirms that the studied Fe-28Mn-6Si-5Cr alloy is suitable for use as a strengthening material in civil structures.
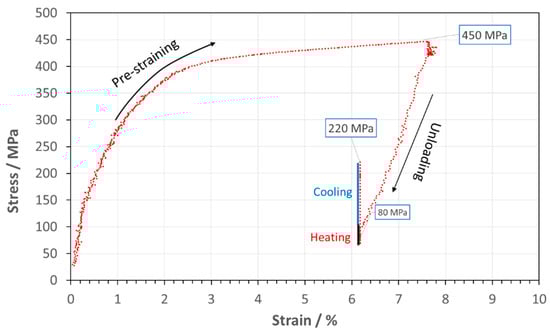
Figure 15.
Stress–strain curve of the SMA alloy showing the effect of the pre-straining and the activation process.
4. Conclusions
The Fe-28Mn-6Si-5Cr shape memory alloy was investigated. Based on obtained results, several conclusions can be drawn.
- The microstructural characterization corroborated the presence of the two phases, ε-martensite and γ-austenite at room temperature. In addition, two types of intermetallic compounds were detected. Those located at the grain boundary had a similar composition to the surrounding matrix, whereas the particles embedded in the matrix were Si-enriched.
- The reversibility of the martensitic transformation, ε ↔ γ, was assessed by thermal analysis and X-ray diffraction studies. The obtained values for the critical temperatures As, Af, Ms, and Mf were 123.8 °C, 141.5 °C, 4.2 °C, and −11.8 °C, respectively. It was also confirmed that the transformation was not totally reversible, depending on the strain degree and the number of thermal cycles. Thus, the increase of any of these parameters involves a lower degree of reversibility.
- Thermal analysis was also used to study the kinetics of the ε → γ transformation. The isoconversion curves were constructed to design the improved thermal activation cycle in the studied SMS alloy.
- From the tensile tests the Rp0.2, Rm(UTS), the EL(%), and the necking parameters were evaluated. The values were 241 MPa, 760 MPa, 33.8%, and 29.9%, respectively. The recovery stress was 140 MPa, after 7.6% pre-strain and a thermal activation to 160 °C, under a fully constrained condition.
Author Contributions
Conceptualization, C.P. and A.C.; methodology, R.F. and C.M.-M.; formal analysis, A.C. and R.F.; investigation, R.F. and C.M.-M.; resources, A.C. and C.M.-M.; writing—original draft preparation, C.P. and C.M.-M.; writing—review and editing, C.P.; supervision, C.P. and A.C. All authors have read and agreed to the published version of the manuscript.
Funding
This work has received funding from the European Union’s Horizon 2020 research and innovation program under grant agreement No769255. This document only reflects the views of the authors. Neither the Innovation and Networks Executive Agency (INEA) nor the European Commission are in any way responsible for any use that may be made of the information it contains.
Data Availability Statement
All the data generated during this study are included in this article.
Conflicts of Interest
The authors declare no conflict of interest.
References
- Nascimento-Borges, F.C. Iron Based Shape Memory Alloys: Mechanical and Structural Properties, Shape Memory Alloys-Processing, Characterization and Applications. Shape Mem. Alloy. Process. Charact. Appl. 2013, 116–128. [Google Scholar] [CrossRef]
- Cladera, A.; Weber, B.; Leinenbach, C.; Czaderski, C.; Shahverdi, M.; Motavalli, M. Iron-based shape memory alloys for civil engineering structures: An overview. Constr. Build. Mater. 2014, 63, 281–293. [Google Scholar] [CrossRef]
- Hong, K.; Lee, S.; Han, S.; Yeon, Y. Evaluation of Fe-based shape memory alloy (Fe-SMA) as strengthening material for reinforced concrete structures. Appl. Sci. 2018, 8, 730. [Google Scholar] [CrossRef]
- Lee, W.J.; Weber, B.; Feltrin, G.; Czaderski, C.; Motavalli, M.; Leinenbach, C. Phase transformation behavior under uniaxial deformation of an Fe-Mn-Si-Cr-Ni-VC shape memory alloy. Mater. Sci. Eng. A 2013, 581, 1–7. [Google Scholar] [CrossRef]
- Sato, A.; Chishima, E.; Soma, K.; Mori, T. Shape memory effect in γ ⇄ ε transformation in Fe-30Mn-1Si alloy single crystals. Acta Metall. 1982, 30, 1177–1183. [Google Scholar] [CrossRef]
- Chen, J.; Peng, H.B.; Yang, Q.; Wang, S.L.; Song, F.; Wen, Y.H. Effect of carbon content on shape memory effect of Fe-Mn-Si-Cr-Ni-based alloys at different deformation temperatures. Mater. Sci. Eng. A 2016, 677, 133–139. [Google Scholar] [CrossRef]
- Kırındı, T.; Sarı, U. The effects of austenite phase deformation on microstructure and magnetic properties in Fe-13.4%Mn-5.2%Mo alloy. J. Mater. Sci. 2011, 46, 6378–6383. [Google Scholar] [CrossRef]
- Sari, U.; Kirindi, T.; Yüksel, M.; Aǧan, S. Influence of Mo and Co on the magnetic properties and martensitic transformation characteristics of a Fe-Mn alloy. J. Alloys Compd. 2009, 476, 160–163. [Google Scholar] [CrossRef]
- Maji, B.C.; Krishnan, M. The effect of microstructure on the shape recovery of a Fe-Mn-Si-Cr-Ni stainless steel shape memory alloy. Scr. Mater. 2003, 48, 71–77. [Google Scholar] [CrossRef]
- Sari, U.; Kirindi, T. Effect of Mn content on the austenite-martensite phases and magnetic properties in Fe-Mn-Co alloys. Mater. Chem. Phys. 2011, 130, 738–742. [Google Scholar] [CrossRef]
- Guerrero, L.M.; La Roca, P.; Malamud, F.; Baruj, A.; Sade, M. Composition effects on the fcc-hcp martensitic transformation and on the magnetic ordering of the fcc structure in Fe-Mn-Cr alloys. Mater. Des. 2017, 116, 127–135. [Google Scholar] [CrossRef]
- Pan, M.M.; Zhang, X.M.; Zhou, D.; Misra, R.D.K.; Chen, P.; Su, X. Bin On the significance of C and Co on shape memory performance of Fe–Mn–Si–Cr–Ni shape memory alloy. Mater. Sci. Eng. A 2020, 786, 139412. [Google Scholar] [CrossRef]
- Otsuka, H.; Yamada, H.; Maruyama, T.; Tanahashi, H.; Matsuda, S.; Murakami, M. Effects of alloying additions on Fe-Mn-Si shape memory alloys. ISIJ Int. 1990, 30, 674–679. [Google Scholar] [CrossRef]
- Cotes, S.; Fernández Guillermet, A.; Sade, M. Phase stability and fcc/hcp martensitic transformation in Fe-Mn-Si alloys Part I. Experimental study and systematics of the Ms and As temperatures. J. Alloys Compd. 1998, 278, 231–238. [Google Scholar] [CrossRef]
- Dias, D.; Nakamatsu, S.; Della Rovere, C.A.; Otubo, J.; Mariano, N.A. Characterization and corrosion resistance behavior of shape memory stainless steel developed by alternate routes. Metals 2020, 10, 13. [Google Scholar] [CrossRef]
- Lai, M.J.; Li, Y.J.; Lillpopp, L.; Ponge, D.; Will, S.; Raabe, D. On the origin of the improvement of shape memory effect by precipitating VC in Fe–Mn–Si-based shape memory alloys. Acta Mater. 2018, 155, 222–235. [Google Scholar] [CrossRef]
- Lee, W.J.; Weber, B.; Feltrin, G.; Czaderski, C.; Motavalli, M.; Leinenbach, C. Stress recovery behaviour of an Fe–Mn–Si–Cr–Ni–VC shape memory alloy used for prestressing. Smart Mater. Struct. 2013, 22, 125037. [Google Scholar] [CrossRef]
- Leinenbach, C.; Arabi-Hashemi, A.; Lee, W.J.; Lis, A.; Sadegh-Ahmadi, M.; Van Petegem, S.; Panzner, T.; Van Swygenhoven, H. Characterization of the deformation and phase transformation behavior of VC-free and VC-containing FeMnSi-based shape memory alloys by in situ neutron diffraction. Mater. Sci. Eng. A 2017, 703, 314–323. [Google Scholar] [CrossRef]
- Stanford, N.; Dunne, D.P.; Li, H. Re-examination of the effect of NbC precipitation on shape memory in Fe-Mn-Si-based alloys. Scr. Mater. 2008, 58, 583–586. [Google Scholar] [CrossRef]
- Stanford, N.; Dunne, D.P. Thermo-mechanical processing and the shape memory effect in an Fe-Mn-Si-based shape memory alloy. Mater. Sci. Eng. A 2006, 422, 352–359. [Google Scholar] [CrossRef]
- Wen, Y.H.; Peng, H.B.; Raabe, D.; Gutierrez-Urrutia, I.; Chen, J.; Du, Y.Y. Large recovery strain in Fe-Mn-Si-based shape memory steels obtained by engineering annealing twin boundaries. Nat. Commun. 2014, 5, 1–2. [Google Scholar] [CrossRef] [PubMed]
- Peng, H.B.; Wen, Y.H.; Xiong, L.R.; Li, N. Influence of initial microstructures on effectiveness of training in a FeMnSiCrNi shape memory alloy. Mater. Sci. Eng. A 2008, 497, 61–64. [Google Scholar] [CrossRef]
- Vyazovkin, S. Evaluation of Activation Energy of Thermally Stimulated Solid-State Reactions under Arbitrary Variation of Temperature. J. Comput. Chem. 1997, 18, 393–402. [Google Scholar] [CrossRef]
- Vyazovkin, S. Modification of the Integral Isoconversional Method to Account for Variation in the Activation Energy. J. Comput. Chem. 2001, 22, 178–183. [Google Scholar] [CrossRef]
- Vyazovkin, S. Advanced isoconversional method. J. Therm. Anal. 1997, 49, 1493–1499. [Google Scholar] [CrossRef]
- Farjas, J.; Roura, P. Isoconversional analysis of solid state transformations. A critical review. Part I. Single step transformations with constant activation energy. J. Therm. Anal. Calorim. 2011, 105, 757–766. [Google Scholar] [CrossRef]
- Balagurov, A.M.; Bobrikov, I.A.; Pons, J.; Cifre, J.; Sun, L.Y.; Golovin, I.S. Structure of the Fe-Mn-Si alloys submitted to γ↔ε thermocycling. Mater. Charact. 2018, 141, 223–228. [Google Scholar] [CrossRef]
- Oliver, E.C.; Mori, T.; Daymond, M.R.; Withers, P.J. Comparison using neutron diffraction of martensitic transformation in Fe-Mn-Si shape memory alloys with and without VN precipitates. Mater. Sci. Technol. 2008, 24, 902–907. [Google Scholar] [CrossRef]
- Stanford, N.; Dunne, D.P. Effect of Si on the reversibility of stress-induced martensite in Fe-Mn-Si shape memory alloys. Acta Mater. 2010, 58, 6752–6762. [Google Scholar] [CrossRef]
- Lin, H.C.; Lin, C.S.; Lin, K.M.; Chuang, Y.C. An investigation of grain-boundary phase in Fe-30Mn-6Si-5Cr shape memory alloy. J. Alloys Compd. 2001, 319, 283–289. [Google Scholar] [CrossRef]
- Stanford, N.; Dunne, D.P.; Monaghan, B.J. Austenite stability in Fe-Mn-Si-based shape memory alloys. J. Alloys Compd. 2007, 430, 107–115. [Google Scholar] [CrossRef]
- Chen, S.; Chung, C.Y.; Yan, C.; Hsu, T.Y. Effect of f.c.c. antiferromagnetism on martensitic transformation in Fe-Mn-Si based alloys. Mater. Sci. Eng. A 1999, 264, 262–268. [Google Scholar] [CrossRef]
- Lin, H.C.; Wu, S.K.; Peng, Y.T.; Cheng, T.C.; Lin, K.M. Pseudoelasticity of thermo-mechanically treated Fe-Mn-Si-Cr-Ta alloys. J. Alloys Compd. 2013, 577, S338–S343. [Google Scholar] [CrossRef]
- Brachet, J.C.; Gavard, L.; Boussidan, C.; Lepoittevin, C.; Denis, S.; Servant, C. Modelling of phase transformations occurring in low activation martensitic steels. J. Nucl. Mater. 1998, 258–263, 1307–1311. [Google Scholar] [CrossRef]
- Mertinger, V.; Benke, M.; Nagy, E.; Pataki, T. Reversible characteristics and cycling effects of the ε ↔ γ martensitic transformations in Fe-Mn-Cr Twip/Trip steels. J. Mater. Eng. Perform. 2014, 23, 2347–2350. [Google Scholar] [CrossRef]
- Marinelli, P.; Baruj, A.; Pons, J.; Sade, M.; Guillermet, A.F.; Cesari, E. The enthalpy change of the hcp → fcc martensitic transformation in Fe-Mn alloys: Composition dependence and effects of thermal cycling. Mater. Sci. Eng. A 2002, 335, 137–146. [Google Scholar] [CrossRef]
- Baruj, A.; Fernández Guillermet, A.; Sade, M. Effects of thermal cycling and plastic deformation upon the Gibbs energy barriers to martensitic transformation in Fe-Mn and Fe-Mn-Co alloys. Mater. Sci. Eng. A 1999, 273–275, 507–511. [Google Scholar] [CrossRef]
- Marinelli, P.; Fernández Guillermet, A.; Sade, M. The enthalpy change of the hcp → fcc martensitic transformation in Fe-Mn-Co alloys: Composition dependence and thermal cycling effects. Mater. Sci. Eng. A 2004, 373, 1–9. [Google Scholar] [CrossRef]
- Liu, Y.; Tan, G.S. Effect of deformation by stress-induced martensitic transformation on the transformation behaviour of NiTi. Intermetallics 2000, 8, 67–75. [Google Scholar] [CrossRef]
- Vyazovkin, S. A Unified Approach to Nonisothermal Data. Unified Kinet. Process. 1995, 28, 95–101. [Google Scholar]
- Ur Rahman, R.A.; Juhre, D.; Halle, T. Review of types, properties, and importance of ferrous based shape memory alloys. Korean J. Mater. Res. 2018, 28, 381–390. [Google Scholar] [CrossRef]
- Sawaguchi, T.; Maruyama, T.; Otsuka, H.; Kushibe, A.; Inoue, Y.; Tsuzaki, K. Design concept and applications of Fe-Mn-Si-based alloys-from shape-memory to seismic response control. Mater. Trans. 2016, 57, 283–293. [Google Scholar] [CrossRef]
- Noell, P.J.; Carroll, J.D.; Boyce, B.L. The mechanisms of ductile rupture. Acta Mater. 2018, 161, 83–98. [Google Scholar] [CrossRef]
- Ghafoori, E.; Hosseini, E.; Leinenbach, C.; Michels, J.; Motavalli, M. Fatigue behavior of a Fe-Mn-Si shape memory alloy used for prestressed strengthening. Mater. Des. 2017, 133, 349–362. [Google Scholar] [CrossRef]
- Hosseini, E.; Ghafoori, E.; Leinenbach, C.; Motavalli, M.; Holdsworth, S.R. Stress recovery and cyclic behaviour of an Fe-Mn-Si shape memory alloy after multiple thermal activation. Smart Mater. Struct. 2018, 27. [Google Scholar] [CrossRef]
- Izadi, M.R.; Ghafoori, E.; Shahverdi, M.; Motavalli, M.; Maalek, S. Development of an iron-based shape memory alloy (Fe-SMA) strengthening system for steel plates. Eng. Struct. 2018, 174, 433–446. [Google Scholar] [CrossRef]
Publisher’s Note: MDPI stays neutral with regard to jurisdictional claims in published maps and institutional affiliations. |
© 2021 by the authors. Licensee MDPI, Basel, Switzerland. This article is an open access article distributed under the terms and conditions of the Creative Commons Attribution (CC BY) license (https://creativecommons.org/licenses/by/4.0/).