Abstract
Water-wall tubes are important components in power plants and are used to absorb the heat from the boilers, and they often fail prematurely due to corrosion, erosion, and fatigue during service. To repair the defects, weld overlay repair is often adopted by forming a compressive stress area around the susceptible area to prevent the cracks from propagating. In order to obtain reasonable process parameters of weld overlay repair, a study combining experiments and numerical simulations was performed to investigate the welding residual stress distribution on the repaired area with different welding repair methods. The results reveal that a compressive stress area is generated on the repaired area after the repair, and a center-to-outside welding sequence is better than either a right-to-left welding sequence or an outside-to-center welding sequence when overlaying a one-layer weld; with an increase in the number of weld layers, the compressive stress area of the repaired area is expanded, and the stress level is increased, which results from the upward movement of the compressive stress area of the subsequent-overlaying layer and the superposition of the compression areas of the subsequent-overlaying layer and previous-overlaying layer, respectively. In addition, the number of the weld passes of each layer should be not less than four with the center-to-outside welding sequence.
1. Introduction
Low alloy ferritic steel tubes are extensively used as water walls in power plants to absorb heat from flue gas around steam generators of the power plants [1]. The water-wall tubes operate at and often fail prematurely due to the corrosion and erosion of high-temperature flue gas; more seriously, it will lead to the accidents of pipe burst [2].
Weld overlay repair is an easily-operated, efficient, and fast method to repair the defects [3]; moreover, it can realize in-service maintenance and avoid the low efficiency and economic losses caused by shutdown and replacement. However, the rapid heating and cooling process of welding repair will induce welding residual stress in the welded structure. The welding residual stress is one of the driving forces of crack propagation, and the existence of welding residual stress may weaken the strength of the components; thus, in the evaluation of structural integrity, welding residual stress inside the components must be considered [4].
Close attention should be paid to the residual stress distribution inside the components during the overlaying process, and attempts should be made to adjust the stress distribution on the repaired area through a reasonable overlaying process parameters. The literature [5,6,7,8] mentions that weld overlay repair can reduce the residual stress and even reverse tensile stress into compressive stress in the area of interest of pressurized water reactor (PWR), boiling water reactor (BWR), penetration nozzle, and nuclear reactor pipe. The post-weld residual stress distributions within the components are affected by many factors, like heat input [9], pre-heating temperature [10,11], temper bead temperature [3], inter-pass temperature, post-weld heat treatment [12], welding sequence [7,13,14,15,16,17], multi-layer [9,18], weld overlay geometry [4,5,6,19], welding filler metal [12,20], etc.
The weld pass sequence will lead to through-wall variations in a localized manner [15]. It was found in [17] that the deposition sequence not only affects the stress distribution significantly but also alters the deformation mode in an austenitic steel J-groove welded joint. Zhang et al. [7] concluded that the center-to-outside welding sequence obtained the best repair results compared to left-to-right and outside-to-center welding sequences in the weld overlay repair of pipes in BWRs. It is worth noting that the last weld pass has a key impact on the final stress distribution [7,16,17,21]. In addition, a reasonable bead sequence can improve hardness distribution and microstructure in heat-affected zones [13,14].
For weld overlay geometry, weld overlay length has a great impact on residual stress distribution; as the applied overlay length increases, the peak value of repair-induced residual stress decreases in the weld repair of the penetration nozzle [6] and the SUS304 stainless steel pipe butt-welded joint [16]. The authors in [19] systematically studied the influence of the weld overlay geometry on the repair of pipeline components and concluded that the weld overlay should be as long, narrow, and shallow as possible.
Water-wall tubes are core components of a power plant. The cracking and leakage of the water-wall tubes affect normal operation of the power plant. Cracks often occur on the fire side of the water-wall tubes, and the technology to repair them is to overlay stainless steel, nickel-based alloy, and other high-toughness, corrosion-resistant alloy material on the outer surface of the tubes. The weld overlay can not only avoid possible leakage and enhance the strength of the flawed tubes but also induce compressive residual stress on the repaired area of the tubes to prevent the propagation of the cracks and therefore prolong the life of the tubes [22,23]. Predecessors were mainly focused on the overlaying welding repair of medium thick-walled components and their girth welds, and the defective materials were generally removed first before the repair. However, components like water wall tubes are so thin that weld metal is generally overlaid directly on the surface of the tubes. Few studies on the welding repair of thin-walled components have been performed, so it is necessary to carry out an investigation of the overlaying welding repair process of the water wall tubes before the repair.
Limited by the shape and structure of the sample, it is difficult with an experimental method to obtain the global stress distribution. In addition, experimental methods can only obtain the final residual stress state but cannot clarify the evolution process of the residual stress. Therefore, the method of combining experiments and numerical simulations is often applied to study the residual stress distribution. To repair the axial cracks on the outer surface of the water-wall tubes, Inconel 82 nickel-based filler metal was deposited on the cracks to form compressive residual stress on the repaired area with the shrinkage function of the weld overlay during the cooling process. It is worth noting that the welding direction in this research is along the pipeline axis, and the compressive area formed in the repaired area results from the shrinkage function of the weld in the transverse direction (perpendicular to the welding direction). In contrast, in girth welding [5,6,7], the compressive area generated in the repaired area is due to the shrinkage function of the weld in the longitudinal direction (parallel to the welding direction). Compared with girth welding, the overlaying welding method applied in this research only requires simpler welding equipment and operation.
The method of combining experiments and numerical simulation was adopted. The 3D finite element model was calibrated by comparing the historical temperature of a certain point in the heat affected zone (HAZ) and the residual stress distribution on the outer surface and cross section of the overlaying sample, obtained by experiments and simulation. In the validated model, the residual stress distributions on the repaired area under different conditions were compared and quantitatively characterized. Finally, the influence of the welding sequence and the transverse geometry of the weld overlay (the width and the thickness are decided by the pass number per weld layer and the number of weld layers, respectively) on the repair effect were clarified.
2. Materials and Experiments
2.1. Materials
As shown in Figure 1a, there were several axial cracks on the water-wall tubes. The weld was deposited on the flaws along the axis direction, and the weld overlay center was located on the cracks. Since the crack propagation direction was axial, our attention was focused on the hoop stress of the repaired area during the repair.
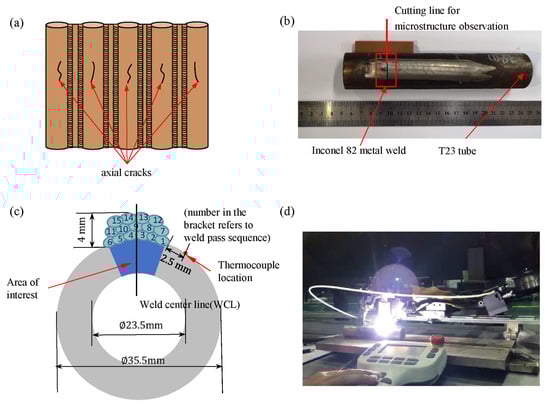
Figure 1.
(a) Appearance of axial cracks on the outer surface of T23 water-wall tubes; (b) appearance of the overlaying sample with 82 Inconel weld metal; (c) transverse geometry of the weld overlay joint and layout of the welding pass sequence; and (d) manufacturing process of the overlaying sample.
The water-wall tube material was T23 low alloy high-strength steel. Compared with low alloy steel welding filler metal, overlaying with nickel-based alloy filler metal does not require pre-heating and post-weld heat treatment, which tremendously improves repair efficiency and lowers repair cost; hence, nickel-based alloy was selected for the repair, and the filler metal was determined to be Inconel 82. The chemical compositions of T23 and 82 weld metal measured using an electron-probe micro analyzer (EPMA) are shown in Table 1. Metallographic examination was conducted by cutting an area of material from the completed overlaying sample shown in Figure 1b. The microscopic sample was prepared by cutting the overlaying sample at the cutting line shown in Figure 1b. It was mechanically ground and polished and then chemically corroded with 4% nital reagent [12]. Figure 2 shows the optical microscopic morphology near the HAZ on the cross section of the weld overlay joint. The base metal was bainite, and the width of the HAZ between the interface and the base metal was ~3 mm, which was used to calibrate the heat source. The experimental part aimed to obtain a temperature history of a certain point in the HAZ, residual stress distribution on the outer surface, and hoop residual stress distribution on the cross section of the overlaying sample.

Table 1.
Chemical compositions of T23 steel base metal and 82 weld metal (wt.%).
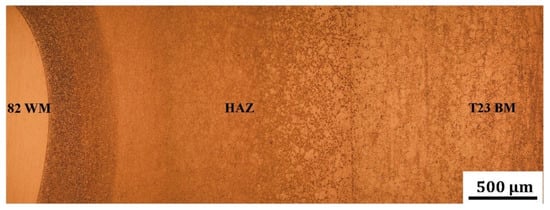
Figure 2.
Microscopic image of weld overlay joint.
2.2. Fabrication of the Overlaying Sample and Thermal Measurement Experiment
The outer diameter of the T23 water wall tube was 35.5 mm, and the thickness was 6 mm. Tungsten inert gas (TIG) welding was employed to deposit 82 nickel-based alloy on the parent T23 tubes to fabricate the overlaying sample. The overlaying process parameters are depicted in Table 2. Three layers were deposited, and the last two layers adopted higher process parameters than the first layer. The first, second, and third layers were deposited using 6, 5, and 4 passes, respectively. The geometry of the weld overlay is shown in Figure 1c, and the numbers on the weld pass indicate the welding sequence. The inter-layer temperature was controlled to be less than 150 °C, and no preheating and post-weld heat treatments were performed. A NiCr thermocouple of K-type with −200 to 1300 °C measuring range was connected with a HIOKI LR8500 data logger and placed ~2.5 mm from the weld overlay in the HAZ, as shown in Figure 1c. The completed overlaying sample and the fabrication process are shown in Figure 1b,d, respectively.
Table 2.
The welding process parameters.
2.3. Stress Measurement with Hole Drilling Method
The blind hole method was employed to measure the residual stress on the surface of the weld overlay, and the layout plan of the measurement points is shown in Figure 3. Along reference lines L1 and L2 on the outer surface of the sample, 2 points at the weld surface center line and 4 points on both sides of the weld were selected for the residual stress measurement. Measuring two sets of results was conducted mainly to verify the repeatability and reliability of the measured results. The blind hole method measures the regional average stress, so we had to make the hole as small as possible; in addition, it was necessary to ensure uninterrupted drilling. ASTM-E837-08 and existing research results show that boreholes less than 2 mm have little effect on the measurement results. Therefore, hole diameter and hole depth were 1.5 mm and 2 mm, respectively.
where and represent principal stresses; is the elastic modulus, and represent the stress release coefficients, which are 0.07255 and 0.1514, respectively, corresponding to a 2 mm depth hole; , , and represent strains measured by gages at 0° (hoop direction), 90° (axial direction), 225°, respectively; α represents the angle between the principal stress and the 0° rosette axis. In addition, the additional strains caused by the drilling process in the weld and base metal are −27 με and −39 με, respectively.
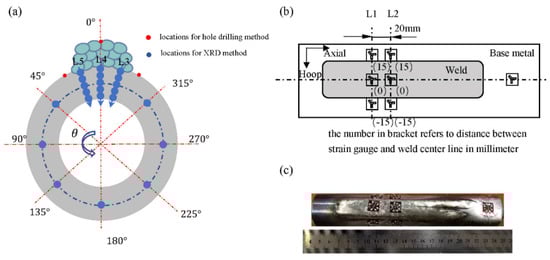
Figure 3.
Locations of residual stress measurement: (a) locations on the transverse cross section of the overlaying sample, (b) schematic diagram of stress measurement locations, and (c) experimental locations with hole drilling method. The blind hole method is a simple and effective method for measuring residual stress at a certain depth. It has a standardized operation process and the measurement results are accurate and reliable. The blind hole method measures the residual stress by drilling a small blind hole in the strain center to locally release the residual stress and obtain the released strains in different directions from the strain rosettes to calculate the residual stress. The principal stress calculation equations are as follows.
2.4. Stress Measurement with XRD Method
The high-precision X-ray residual stress analyzer of Japan’s Pulstec was employed to measure the hoop stress distribution on the cross section of the overlaying sample. The obtains the residual stress information by comparing the change of the Debye ring before and after the application of the residual stress. The layout plan of residual stress measurement is shown in Figure 3a; along the centerline of the weld (L4) and the radial lines (L3, L5) symmetrical to L4 on the repaired area, starting from the fusion line, 5 points were measured with 1 mm steps. In order to investigate the stress distribution of the whole tube along the circumferential direction, the counterclockwise direction was defined as the positive direction, and hoop stress measurements were taken every 45° along the centerline in the thickness direction of the tube. In addition, before performing the measurement, the measured surface needed to be mechanically polished and then electrolytically corroded to remove the compressive stress layer caused by the grinding and polishing process. The electrolyte was composed of phosphoric acid 65%, sulfuric acid 15%, glycerol 12%, water 3%, and chromium trioxide 5%, and the electrolysis process parameters were 6 V, 1.2 A, and 30 s, respectively.
3. Finite Element Analysis
General finite element simulation software ABAQUS was employed. Based on the thermo-elastic–plastic theory, a 3D finite element model consistent with the actual overlaying sample was established to obtain the evolution law of temperature and residual stress of the overlaying sample during the overlaying process. In order to obtain accurate simulation results, a fully coupled method was adopted, which means the effects of temperature, microstructure, and mechanical properties were simultaneously considered.
3.1. Three-Dimensional Finite Element Model
The three-dimensional model of the overlaying sample with limited axial length was established corresponding to the size of the T23 tube and the weld overlay, as shown in Figure 4a. Figure 4b illustrates the mesh model of the overlaying sample; to improve calculation efficiency and accuracy, the mesh grids near the joints were denser, and the others were sparser. The basic element of the simulation model was an 8-node thermo-mechanical coupling unit C3D8T, and the whole model consisted of 5160 grid units in total. “Model change” technology was employed to realize the superposition process of the weld passes; all elements of the base metal and weld metal were generated at the beginning, but the elements of the weld pass were deactivated before analysis. Once the welding started, corresponding elements of the weld pass were activated and heated and then cooled to room temperature. The heat source adopted a double ellipsoidal moving body heat source, and the welding speed referred to the actual fabrication parameters as Table 2 shows; peak and base welding speeds took and , respectively, and the corresponding time took 0.2 s and 0.3 s, respectively, in a time period. The size of the body heat source was calibrated with the width of the HAZ. The overlaying process of each pass was divided into two steps, namely heating and cooling, and the heating time took 13 s, and the cooling time took 1200 s until the weld cooled to room temperature. In addition, both end faces (S1, S2 in Figure 4a) of the water-wall tube were completely fixed, that is to say the degree of freedom was fully constrained (U1 = U2 = U3 = UR1 = UR2 = UR3 = 0).
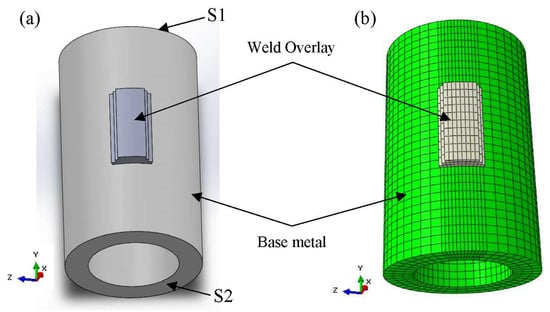
Figure 4.
Weld overlay model in the work: (a) three-dimensional stereogram and (b) finite element mesh model.
3.2. Thermal Analysis
Considering the influence of molten weld pool flow on heat transfer, the thermal conductivity above the melting point of the weld material was set twice to the room temperature coefficient [24]. Conduction of heat created by the welding arc within the weldment can be described by the nonlinear heat conduction governing equation [25]:
where is temperature, is the heat transfer coefficient, is the rate of internal heat generation, is the density, is the specific heat capacity, and is the time. The thermal physical properties of T23 steel [26] and 82 Inconel [27] are shown in Figure 5a,c, respectively. The melting points of T23 steel and 82 Inconel metal are 1520 °C and 1400 °C, respectively.
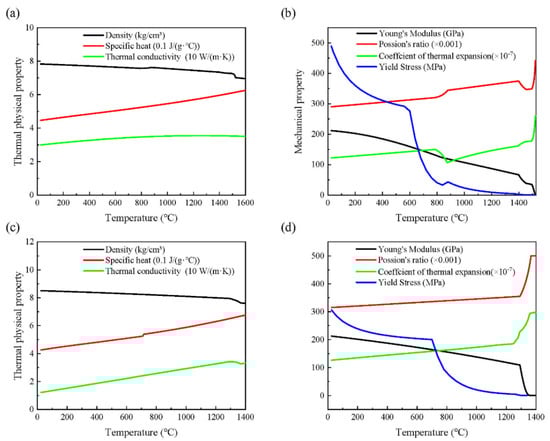
Figure 5.
Temperature-dependent material properties of T23 steel and Inconel 82 weld metal: (a) thermal physical properties and (b) mechanical properties of T23 steel; (c) thermal physical properties and (d) mechanical properties of Inconel 82.
Due to the heat exchange between the weldments and the environment, two forms of heat loss, namely convective heat dissipation and radiative heat dissipation, were considered in the simulation. They can be described by Newton’s law and Stefan–Boltzmann’s law [25] respectively:
where is the convective heat transfer coefficient, which is ; is thermal emissivity; is Steven Boltzmann constant, which is ; is the surface temperature of the weldment; and is ambient temperature.
For the heat source power, a double ellipsoidal heat source by Goldak et al. [28] was selected, and the heat flux of heat source model can be described as the following equations:
For the front part,
For the rear part,
where and are calculation coefficients, which are 0.8 and 1.2, respectively; Q is the power of heat source; ,, , and are ellipsoid shape parameters, which are 4 mm, 2.5 mm, 2 mm, and 2 mm respectively; is the arc heat efficient, which is assumed as 0.75; is the arc voltage; and is the welding current.
3.3. Phase Transformation
The water-wall T23 tube is bainite steel. During the heating process, austenite transformation occurs, so the T23 base metal shrinks, showing a decrease in volume. Bainite transformation occurs during the cooling process. Previous literatures mainly considered the influence of the low-temperature phase transformation of martensitic steel, such as P91, on the residual stress in the component [20,29]. The of P91 martensitic steel is low, which has a great impact on the formation of residual stress after welding. On the contrary, phase transformation temperature of T23 bainite steel is high, so bainite transformation has little effect on the formation of residual stress. Hence, in order to improve calculation efficiency, the strain change caused by the bainite transformation during the cooling process should be ignored.
3.4. Mechanical Analysis
In each step of the calculation, the temperature field obtained by thermal calculation is imported into the stress–strain calculation. At room temperature, the yield strength and tensile strength of T23 base steel are 400 MPa and 510 MPa, respectively [26]. For 82 nickel-based welding material, the yield strength and tensile strength are 360 MPa and 640 MPa, respectively [27]. The stress before overlaying is ignored, and the change of the mechanical properties of the material with temperature must be considered in the calculation. The mechanical properties of T23 low-alloy steel [26] and 82 nickel-based alloy [27] as a function of temperature are shown in Figure 5b–d, respectively.
Elastic strain, plastic strain, thermal strain, and strain caused by phase transformation were mainly considered in the mechanical analysis, so the total strain can be described as the following equation [16]:
where ,,, and are total strain, elastic strain, plastic strain, and strain induced by phase transformation, respectively.
3.5. Simulation Cases
For the 3D numerical model with the right-to-left welding sequence shown in Figure 6c, its welding sequence was consistent with that of the experimental model, so the simulated results could be compared with experimental results to adjust the parameters of the heat source model. The main purpose of establishing simulation models subjected to different welding sequences is to investigate the welding sequence influence on the repair and obtain an optimal welding sequence. One end to the other end of the welding sequence is commonly employed for welding repair in engineering and can be used as a contrast. It was demonstrated in [7,16,17] that the last pass has a key influence on the stress distribution, so the weld bead above the weld centerline (WCL) was placed at the beginning, the medium, and the end, respectively; in addition, to obtain symmetrical residual stress distribution, the welding sequences were set symmetrical to the WCL. According to the requirements above, center-to-outside and outside-to-center welding sequences were selected for the research, and corresponding simulated models are shown as Figure 6d,e. By extracting the stress distribution on the repaired area during the welding process, the stress evolution law of the repaired area with the change of the number of the weld layers and weld passes per layer can be obtained.
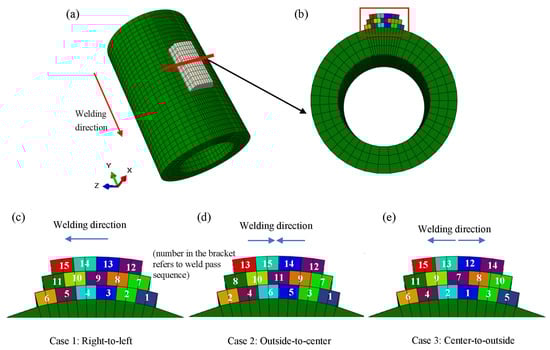
Figure 6.
(a) Location of the transverse cross section on the tube, (b) transverse cross section at mid-length of the weld overlay joint and schematic diagram of the weld overlay with 3 different welding sequences: (c) case 1: right-to-left, (d) case 2: outside-to-center, and (e) case 3: center-to-outside.
4. Results and Discussion
4.1. Temperature Field
Figure 7a illustrates the temperature field of the weld overlay joint. The peak temperature of the molten pool was ~2500 °C, and the HAZ, which is between melting temperature of base metal and the temperature of phase transformation from ferrite to austenite, was ~3 mm wide. The width of the HAZ was reasonable, which proved the adequacy of the simulated model. Figure 7b,c shows the record of the experimental and simulated historical temperature results of the thermocouple position during the first and second pass of the repair. It can be seen that the peak temperatures obtained by simulation and experiment at the position of the thermocouple were ~1100 °C and ~1050 °C, respectively, when overlaying the first pass, and ~450 °C and ~460 °C, respectively, when overlaying the second pass. In summary, the widths of the HAZ and the historical temperature curve obtained by experiment and simulation were in good consistency, which prove the effectiveness of the weld overlay model.
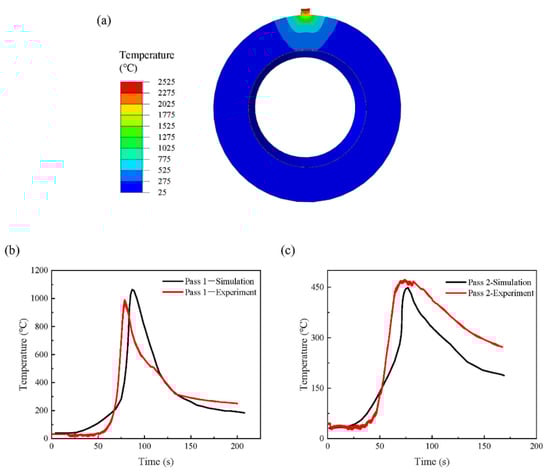
Figure 7.
(a) Transient temperature field (with the highest temperature) comparisons of simulated and recorded history temperature at the thermocouple point during (b) pass 1 and (c) pass 2.
4.2. Residual Stress Distribution on the Outer Surface of the Weld Overlay
Figure 8a illustrates the axial residual stress distribution on the outer surface of the overlaying sample. The outer surface of the weld overlay and its adjacent HAZ were in tension, and the stress ranged from 0 to 500 MPa, whereas the base metal near the HAZ were in compression, and the stress ranged from −200 to 0 MPa. This is because in the axial direction, the base metal was compressed by its adjacent HAZ and the weld overlay during the cooling process. Figure 8c demonstrates the experimentally measured results of the axial residual stress distribution on the weld overlay center and the base metal on both sides. The experimental and simulated results of the axial residual stress along L1 and L2 are presented. The axial stress distribution trends obtained by the experiment and simulated model both present inverted “V” shape, and the axial residual stress of the weld overlay center obtained by the experiment and simulation model are both ~200 MPa, and the axial residual stress of the base metal near the HAZ were −300 to −150 MPa and −100 to −80 MPa, respectively. The experiment and simulation results of axial residual stress were in acceptable agreement.
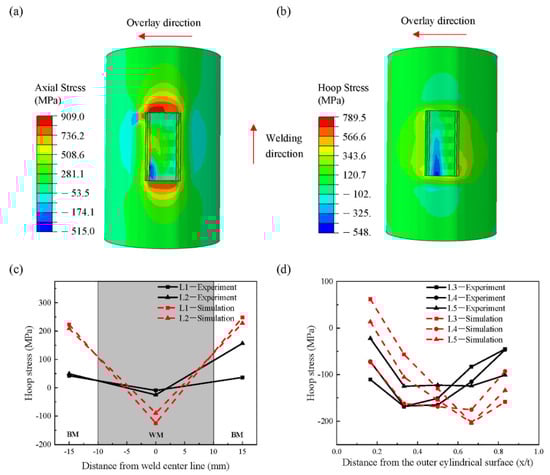
Figure 8.
Full field stress distribution on the outer surface of the simulated model after the welding process: (a) axial stress, (b) hoop stress; comparison of the stress of calculated results and measured results on the outer surface of the sample: (c) axial stress, (d) hoop stress.
Figure 8b shows the hoop residual stress distribution on the surface of the overlaying sample. The surface of the weld overlay presented compressive stress or low tensile stress, and the stress ranged between −400 MPa and 100 MPa. The stress distribution results from the superposition of two functions were determined. On the one hand, the weld overlay shrunk in the axial direction, and the corresponding expansion in the circumferential direction was hindered when the weld cooled to temperature; therefore, the surface of the weld overlay was in compression. On the other hand, the weld overlay shrunk in the hoop direction, and the weld was pulled by the base metal when the weld cooled to temperature; therefore, the surface of the weld was in tension [12] and the former dominated. The HAZ adjacent to the weld overlay was in tension, and the stress ranged from 50 MPa to 450 MPa, which may be related to the shrinkage of the first layer weld and its adjacent HAZ in the circumferential direction after overlaying the first layer weld. Figure 8d demonstrates the experimentally measured results of the hoop residual stress distribution of the weld overlay center and the base metal on both sides. The experimental and simulated results of the hoop residual stress along L1 and L2 are presented. The hoop stress distribution trends obtained by the experiment and simulated model both presented “V” shapes, and the hoop residual stresses of the weld overlay center obtained by the experiment and simulated model were approximately −20 MPa and approximately −100 MPa, respectively, and the HAZs were 50–150 MPa and 200–230 MPa, respectively. The hoop residual stress results of the experiment and simulation were in acceptable agreement. The residual stress measurement difference may come from simulation and measurements. For numerical simulation, the result difference was mainly due to simplified numerical models, such as the simplified heat source model, and simplified reaction in the weld pool, deviation of material property parameters, and element type and grid density in the mesh process. For the blind hole residual stress measurement method, the residual stress results were obtained by averaging residual stress at a certain depth and area, while the numerical simulation extracted the stress value at a certain point. In addition, from the simulation results in Figure 8a,b, we could conclude that the residual stress gradient on the surface of the weld overlay joint was relatively large. Therefore, the calculation and measured results may be different. Other factors like hole depth error, hole diameter error, drilling eccentricity, etc. all had key influences on the results.
The residual stress measured by the blind hole method was in good agreement with the residual stress obtained in the simulation, which proves the validity of the simulated model. The hoop residual stress and axial residual stress on the weld overlay surface were mainly in tension. From the perspective of stress balance, there will inevitably be compressive residual stress offset in the circumferential and axial directions on the repaired area. In the next part, we investigate the residual stress distribution on the repaired area.
4.3. Residual Stress Distribution on the Cross Section of the Overlaying Sample
Figure 9a illustrates the results of the residual hoop stress distribution on the cross section of the three-layer overlaying sample with the right-to-left welding sequence. It can be seen from Figure 9a that the repaired area under the weld overlay formed a compressive pressure area, which was almost symmetrically distributed with respect to the weld center line, and the stress range was −200 to 0 MPa. On the contrary, the tensile stress distribution area was formed in the weld overlay and at the outer surface of the tube, and the stress range was 0–400 MPa. The stress distribution and magnitude were consistent with the residual stress distribution in the welding repair of PWRs [5], penetration nozzle [6], and BWRs [7]. The results of the hoop residual stress distribution on the cross section of the overlaying sample with right-to-left sequence demonstrated that the expected compressive area can be achieved.
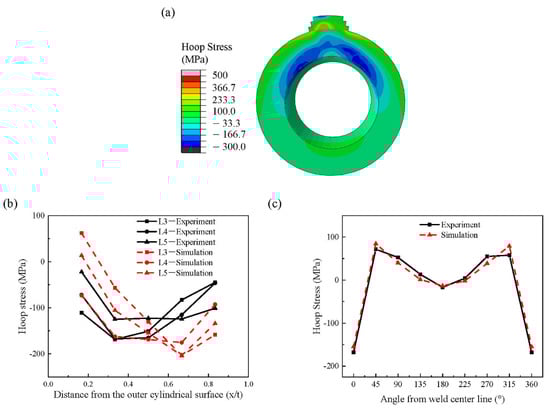
Figure 9.
(a) Hoop stress distribution on the cross section at mid-length of the weld overlay joint, (b) comparison of hoop residual stress on the area of interest, (c) comparison of hoop residual stress on the whole tube.
The experimental and simulated hoop residual stress distribution on the repaired area along the radial lines L3, L4, and L5 are shown in Figure 9b. The distribution of the hoop residual stress shows great dispersion, which may be related to the sensitivity to the surface state and local subtle changes of the sample for the XRD method itself. However, the experimental and simulation results have similar stress distribution trends; that is, the outer surface of the tube is in low tensile stress or low compressive stress, and the compressive stress increases continuously along the thickness direction until reaches the peak value at the position of 0.3–0.7 t and then decreases. The compressive stress range measured by the experiment is −180 to −30 MPa, and the stress range of the corresponding area on the simulation model is −220 to 60 MPa. For the hoop residual stress difference on the repaired area of the weld overlay joint, on the one hand, it may come from the simulation, which has been analyzed in detail in Section 4.2. On the other hand, the difference may be caused by the XRD measuring method itself. In the preparation process of the sample, the hoop residual stress inside the sample may be released partly. In addition, the error can be caused by the surface condition and grain size. In addition to paying attention to the residual stress distribution on the repaired area, the hoop residual stress of the entire cross section of the tube was also investigated. The distribution presents a symmetrical characteristic, and the overall stress level is low, the area near the repaired area is around 80 MPa tensile stress, and the stress of the area opposite to the repaired area is almost zero. The stress distribution is consistent with the requirements of inter-stress balance, which prove the reasonableness of the result.
4.4. Effects of Welding Sequence on the Residual Stress Distribution
Figure 10a shows the hoop stress distribution on the repaired area in the thickness direction after overlaying one layer with three different welding sequences. The repaired area had similar stress distribution in the thickness direction with the different welding sequences: The tensile stress around the outer surface of the tube gradually turned into compressive stress, and the compressive stress gradually increased, until reaching its peak at 0.67 t, and then decreased. The stress distribution of the center-to-outsider welding sequence was similar to the right-to-left’s and had a lower tensile stress or higher compressive stress in the (0–0.67)t region, and lower compressive stress in the (0.67–1)t area than outside-to-center’s. The residual stress distribution results were consistent with the results in reference [7]. In order to quantify the hoop stress distribution at the weld centerline (WCL) of the repaired area, two parameters and , which are most critical to fracture assessment, were introduced. and represent the membrane and the bending parts extractd from stress distribution, respectively [4,30]. The expressions are as follows:
where x represents the distance from the outer surface of the tube.
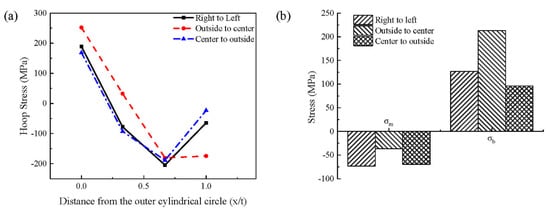
Figure 10.
(a) Distribution of hoop residual stress in the through-thickness direction after overlaying 1 layer weld, and (b) comparison of decomposed components of hoop residual stress with 3 different welding sequence.
Generally, has an impact on the entire process of crack propagation along the depth direction and is the most critical among the three parameters; mainly affects the crack propagation process when the crack depth is less than 70% depth [31].
Figure 10b illustrates that the of the three welding sequences were all in compression, the of center-to-outside was −70 MPa, and the close to right-to-left’s was −73 MPa and higher than outside’s −37 MPa. The of the center-to-outside was 96 MPa, lower than right-to-left’s 127 MPa and outside-to-center’s 213 MPa. Hence the center-to-outside welding sequence was the best among three overlaying sequences when overlaying one layer. In the next section, we discuss the influence of the weld overlay thickness on the stress distribution on the repaired area.
4.5. Effects of the Number of the Weld Layers on the Residual Stress Distribution
Figure 11a–c shows the hoop stress distribution results on the cross section of the weld overlay joint after overlaying 1-layer, 2-layer, and 3-layer metal welds with the center-to-outside welding sequence. Similar to the stress distribution in Figure 9a, overlaying one layer, two layers, and three layers of metal weld all formed tensile stress areas in the weld overlay and around the outer surface of the tube, and −200 to 0 MPa compressive stress area on the repaired area. With the increase of the number of weld layers, the compressive stress area of the repaired area continued to expand. This is because the compressive stress area of the subsequent-overlaying layer continued to move towards the weld overlay.
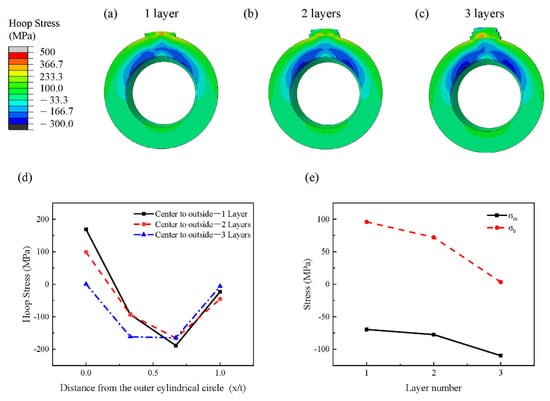
Figure 11.
Hoop residual stress distribution at mid-length of the weld overlay joint with center-to-outside welding sequence for (a) 1 layer, (b) 2 layers, and (c) 3 layers, respectively, (d) distribution of hoop residual stress in the through-thickness direction, and (e) evolution of the decomposed components of hoop residual stress distribution.
Figure 11d shows the results of the hoop residual stress distribution at the WCL of the repaired area along the thickness direction. It can be seen from Figure 11d that as the number of weld layers increased, the tensile stress continued to decrease on the upper half portion of the repaired area. It is especially worth noting that the residual stress of the WCL on the outer surface of the tube was close to 0 when 3 layers were deposited, which verifies the expansion of the compressive stress area of the repair area. Qualified parameters and corresponding to the stress distribution at the WCL on the repaired area in Figure 11d changed with the increase of the number of the weld layers, as Figure 11e shows, where and are constantly compressive and tensile, respectively, with the increase of the number of weld layers. The of the WCL of the repaired area increased from −70 MPa to −110 MPa, and the of the WCL of the repaired area decreased from 96 MPa to 3 MPa. The continuous increase of resulted from the superposition of the compressive area of the subsequent-overlaying layer and the previous-overlaying layer on the repaired area, as Figure 12a indicates, and the continuous decrease of was related to the tensile stress reduction of the area around the outer surface of the tube, which resulted from the upward movement of the compressive stress area of the subsequent-overlaying layer with the increase of the number of the overlaying layer.
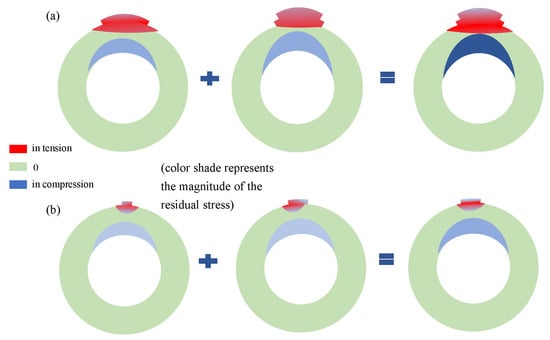
Figure 12.
Non-linear superposition function of (a) weld passes and (b) weld layers.
4.6. Effects of the Number of Weld Passes on the Residual Stress Distribution
Figure 13a–c illustrates the hoop residual stress distribution on the cross section of the overlaying sample with the center-to-outside welding sequence after overlaying the first pass, third pass, and the sixth pass. Similar to the stress distribution in Figure 9a and Figure 11a–c, tension areas were formed in the weld and around the outer surface of the tube, while a compressive stress area was formed in the middle and lower parts of the tube. With the increase of the pass number, the compressive stress level of the repaired area increased due to the superposition of the compressive stress function of the weld passes during the overlaying process, as Figure 12b shows.
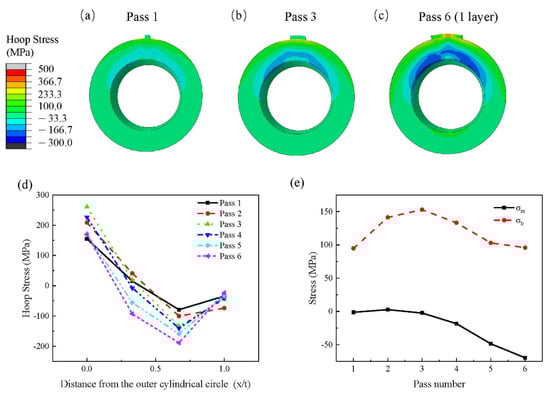
Figure 13.
Hoop residual stress distribution at mid-length of the weld overlay joint with outside-to-center welding sequence after (a) pass 1, (b) pass 3, and (c) pass 6 (1 layer), respectively; (d) distribution of hoop residual stress in the through-thickness direction; and (e) evolution of decomposed component of hoop residual stress distribution when overlaying the 1st layer.
Figure 13d shows the hoop residual stress distribution with the increase of the pass number, and the stress curves of the WCL constantly move down. Figure 12e shows and results at the WCL of the repaired area along the thickness direction; was close to 0 during the first three passes and then turned into compressive stress and increased after overlaying the fourth pass. was positive and increased first with the increase of the number of the weld passes, reached its peak at the third weld pass, and then decreased. According to the residual distribution results of and in Figure 12e, the number of the weld passes for one layer should be no less than four layers.
5. Conclusions
In summary, to solve the axial crack problem of the water-wall tubes, a weld overlay repair solution is proposed. The consistency of the experimental and simulation results proves the validity of the numerical model. Both the experimental and simulation results show that the weld overlay repair forms a compressive area on the repaired area, which proves the effectiveness of the weld overlay repair. Based on the validated simulated model, the effect of welding sequence and weld overlay geometry on the repair is investigated. The conclusions are as follows:
- The simulated model with right-to-left sequence has acceptable consistency with the experimental overlaying model, which proves the validity of the finite element model.
- Under the weld repair influence, the repaired area below the weld overlay is mainly in −200 to 0 MPa compression, balanced by 0–400 MPa tensile stress in the weld overlay and around the outer surface area of the tube.
- The residual stress induced by overlaying welding along the pipeline axis in this paper has similar residual stress distribution and residual stress magnitude as girth welding in the repaired area; however, the former requires simpler equipment and operation.
- Under the condition of overlaying one layer, the of center-to-outside is −70 MPa, close to right-to-left’s −73 MPa, and higher than outside’s −37 MPa. The of center-to-outside is 96 MPa, lower than right-to-left’s 127 MPa and outside-to-center’s 213 MPa. Hence the order of the weld overlay effect is as follows: center-to-outside > right-to-left > outside-to-center.
- As the number of weld layers increases, the compressive stress area of the repaired area is expanded, the of the WCL of the repaired area is increased from −70 MPa to −110 MPa, and the of the WCL of the repaired area is decreased from 96 MPa to 3 MPa.
- When overlaying one layer with the center-to-outside welding sequence, the number of the weld passes should be no less than four layers.
Author Contributions
Writing—original draft preparation, X.X.; writing—review and editing, K.L. and M.H.; supervision, Q.L.; project administration, Z.C.; funding acquisition, Z.C. All authors have read and agreed to the published version of the manuscript.
Funding
This research was funded by the National Natural Science Foundation of China (Project 51775300 and 51901113).
Acknowledgments
State Key Laboratory of Tribology, Beijing, China.
Conflicts of Interest
The authors declare no conflict of interest.
References
- Senthur, P.S.; Choudhary, A.; Mittal, N.; Gupta, S.; Ramkumar, D.; Natarajan, A. Failure evaluation of SA 210C riffle water wall tubes in 70 MW CFBC boiler. Eng. Fail. Anal. 2019, 95, 239–247. [Google Scholar] [CrossRef]
- Rahman, M.M.; Purbolaksono, J.; Ahmad, J. Root cause failure analysis of a division wall superheater tube of a coal-fired power station. Eng. Fail. Anal. 2010, 17, 1490–1494. [Google Scholar] [CrossRef]
- Aloraier, A.; Al-Mazrouee, A.; Price, J.W.H.; Shehata, T. Weld repair practices without post weld heat treatment for ferritic alloys and their consequences on residual stresses: A review. Int. J. Press. Vessel. Pip. 2010, 87, 127–133. [Google Scholar] [CrossRef]
- Dong, P. On repair weld residual stresses and significance to structural integrity. Weld. World 2018, 62, 351–362. [Google Scholar] [CrossRef]
- Liu, R.-F.; Wang, J.-C. Finite element analyses of the effect of weld overlay sizing on residual stresses of the dissimilar metal weld in PWRs. Nucl. Eng. Des. 2021, 372, 110959. [Google Scholar] [CrossRef]
- Jiang, W.; Luo, Y.; Wang, B.Y.; Tu, S.T.; Gong, J.M. Residual stress reduction in the penetration nozzle weld joint by overlay welding. Mater. Des. 2014, 60, 443–450. [Google Scholar] [CrossRef]
- American Society of Mechanical Engineers, P.V.; Piping Division Staff Corporate, A. Weld-Overlay Analyses-An Investigation of the Effect of Weld Sequencing. In Proceedings of the ASME Pressure Vessels and Piping Conference—2008, Chicago, IL, USA, 27–31 July 2008; pp. 565–574. [Google Scholar]
- Iwamatsu, F.; Yanagida, N.; Miyazaki, K. Effect of Weld Overlay Repair on Residual Stress and Crack Propagation in a Welding Pipe. In Proceedings of the ASME Pressure Vessels and Piping Conference, San Antonio, TX, USA, 22–26 July 2007; pp. 645–651. [Google Scholar]
- Jiang, W.C.; Wang, B.Y.; Gong, J.M.; Tu, S.T. Finite element analysis of the effect of welding heat input and layer number on residual stress in repair welds for a stainless steel clad plate. Mater. Des. 2011, 32, 2851–2857. [Google Scholar] [CrossRef]
- Schaupp, T.; Schroepfer, D.; Kromm, A.; Kannengiesser, T. Welding residual stresses in 960MPa grade QT and TMCP high-strength steels. J. Manuf. Process. 2017, 27, 226–232. [Google Scholar] [CrossRef]
- Dong, P.; Hong, J.K.; Bouchard, P.J. Analysis of residual stresses at weld repairs. Int. J. Press. Vessel. Pip. 2005, 82, 258–269. [Google Scholar] [CrossRef]
- Hu, M.; Li, K.; Li, S.; Cai, Z.; Pan, J. Numerical investigation on stress distribution and evolution in 9Cr/2.25Cr dissimilar welded rotor undergoing welding and heat treatment. Weld. World 2020, 64, 1981–1995. [Google Scholar] [CrossRef]
- Mičian, M.; Winczek, J.; Gucwa, M.; Koňár, R.; Málek, M.; Postawa, P. Investigation of Welds and Heat Affected Zones in Weld Surfacing Steel Plates Taking into Account the Bead Sequence. Materials 2020, 13, 5666. [Google Scholar] [CrossRef] [PubMed]
- Tomków, J.; Fydrych, D.; Rogalski, G. Role of Bead Sequence in Underwater Welding. Materials 2019, 12, 3372. [Google Scholar] [CrossRef] [PubMed]
- Dong, P. On the Mechanics of Residual Stresses in Girth Welds. J. Press. Vessel Technol. 2006, 129, 345–354. [Google Scholar] [CrossRef]
- Dai, P.; Wang, Y.; Li, S.; Lu, S.; Feng, G.; Deng, D. FEM analysis of residual stress induced by repair welding in SUS304 stainless steel pipe butt-welded joint. J. Manuf. Process. 2020, 58, 975–983. [Google Scholar] [CrossRef]
- Deng, D. Influence of deposition sequence on welding residual stress and deformation in an austenitic stainless steel J-groove welded joint. Mater. Des. 2013, 49, 1022–1033. [Google Scholar] [CrossRef]
- Zhao, L.; Liang, J.; Zhong, Q.; Yang, C.; Sun, B.; Du, J. Numerical simulation on the effect of welding parameters on welding residual stresses in T92/S30432 dissimilar welded pipe. Adv. Eng. Softw. 2014, 68, 70–79. [Google Scholar] [CrossRef]
- Song, S.; Dong, P. Residual stresses at weld repairs and effects of repair geometry. Sci. Technol. Weld. Join. 2017, 22, 265–277. [Google Scholar] [CrossRef]
- Guo, Q.; Du, B.; Xu, G.; Chen, D.; Ma, L.; Wang, D.; Zhang, Y. Influence of filler metal on residual stress in multi-pass repair welding of thick P91 steel pipe. Int. J. Adv. Manuf. Technol. 2020, 110, 2977–2989. [Google Scholar] [CrossRef]
- Li, S.; Ren, S.; Zhang, Y.; Deng, D.; Murakawa, H. Numerical investigation of formation mechanism of welding residual stress in P92 steel multi-pass joints. J. Mater. Process. Technol. 2017, 244, 240–252. [Google Scholar] [CrossRef]
- Lant, T.; Robinson, D.L.; Spafford, B.; Storesund, J. Review of weld repair procedures for low alloy steels designed to minimise the risk of future cracking. Int. J. Press. Vessel. Pip. 2001, 78, 813–818. [Google Scholar] [CrossRef]
- Odanovic, Z.; Arsic, M.; Grabulov, V.; Djurdjevic, M. Investigation of the Repair Welding Technology Using Ni Base Electrode. Struct. Integr. Welded Struct. 2013, 814, 25–32. [Google Scholar] [CrossRef]
- Marques, E.S.V.; Silva, F.J.G.; Pereira, A.B. Comparison of Finite Element Methods in Fusion Welding Processes—A Review. Metals 2020, 10, 75. [Google Scholar] [CrossRef]
- Holman, J.P. Heat Transfer, 10th ed.; McGraw-Hill: New York, NY, USA, 2002; pp. 4–19. [Google Scholar]
- V&M T23. High-Temperature Ferritic Steel. Alloy Dig. 2001, 50, 1. [Google Scholar]
- RIMA 82. Nickle-Base Welding Wire. Alloy Dig. 2002, 51, 6. [Google Scholar]
- Goldak, J.; Chakravarti, A.; Bibby, M. A new finite element model for welding heat sources. Metall. Trans. B 1984, 15, 299–305. [Google Scholar] [CrossRef]
- Xu, G.; Guo, Q.; Hu, Q.; Pan, H.; Qian, H.; Du, B. Numerical and Experimental Analysis of Dissimilar Repair Welding Residual Stress in P91 Steel Considering Solid-State Phase Transformation. J. Mater. Eng. Perform 2019, 28, 5734–5748. [Google Scholar] [CrossRef]
- Song, S.; Dong, P.; Kim, M.H. Residual stresses in narrow-groove girth welds and applications for fitness-for-service assessment. Int. J. Press. Vessel. Pip. 2020, 188, 104238. [Google Scholar] [CrossRef]
- Dong, P. Length scale of secondary stresses in fracture and fatigue. Int. J. Press. Vessel. Pip. 2008, 85, 128–143. [Google Scholar] [CrossRef]


Publisher’s Note: MDPI stays neutral with regard to jurisdictional claims in published maps and institutional affiliations. |
© 2021 by the authors. Licensee MDPI, Basel, Switzerland. This article is an open access article distributed under the terms and conditions of the Creative Commons Attribution (CC BY) license (https://creativecommons.org/licenses/by/4.0/).