Article

Strategies to Reduce Porosity in Al-Mg WAAM Parts and Their Impact on Mechanical Properties

1
LORTEK Technological Centre, Basque Research and Technology Alliance (BRTA), 20240 Ordizia, Spain
2
Mechanical Engineering Department, University of the Basque Country UPV/EHU, 48013 Bilbao, Spain
*
Author to whom correspondence should be addressed.
Metals 2021, 11(3), 524; https://doi.org/10.3390/met11030524
Submission received: 1 March 2021 / Revised: 16 March 2021 / Accepted: 18 March 2021 / Published: 23 March 2021
(This article belongs to the Special Issue Directed Energy Deposition of Metal Alloys)

Abstract

:
With the advent of disruptive additive manufacturing (AM), there is an increasing interest and demand of high mechanical property aluminium parts built directly by these technologies. This has led to the need for continuous improvement of AM technologies and processes to obtain the best properties in aluminium samples and develop new alloys. This study has demonstrated that porosity can be reduced below 0.035% in area in Al-Mg samples manufactured by CMT-based WAAM with commercial filler metal wires by selecting the correct shielding gas, gas flow rate, and deposition strategy (hatching or circling). Three phase Ar+O2+N2O mixtures (Stargold®) are favourable when the hatching deposition strategy is applied leading to wall thickness around 6 mm. The application of circling strategy (torch movement with overlapped circles along the welding direction) enables the even build-up of layers with slightly thicker thickness (8 mm). In this case, Ar shielding gas can effectively reduce porosity if proper flow is provided through the torch. Reduced gas flows (lower than 30 Lmin) enhance porosity, especially in long tracks (longer than 90 mm) due to local heat accumulation. Surprisingly, rather high porosity levels (up to 2.86 area %) obtained in the worst conditions, had a reduced impact on the static tensile test mechanical properties, and yield stress over 110 MPa, tensile strength over 270 MPa, and elongation larger than 27% were achieved either for Ar circling, Ar hatching, or Stargold® hatching building conditions. In all cases anisotropy was lower than 11%, and this was reduced to 9% for the most appropriate shielding conditions. Current results show that due to the selected layer height and deposition parameters there was a complete re-melting of the previous layer and a thermal treatment on the prior bottom layer that refined the grain size removing the original dendritic and elongated structure. Under these conditions, the minimum reported anisotropy levels can be achieved.

1. Introduction

Wire-arc additive manufacturing (WAAM) is offering a new building perspective to the industry, enabling higher depositions rates than other additive manufacturing techniques despite having lower dimensional precision in as-built state. Compared with other additive manufacturing (AM) technologies, WAAM uses simple equipment and obtains higher deposition rates [1]. Since this technology is based on arc welding processes with wire raw material in either robots or computer numerical control (CNC) systems, it is considered appropriate for medium-large part manufacturing. In the last years, industry has been interested in this manufacturing alternative for different applications, such as aeronautical, automotive, defence, naval, and nuclear energy industry [2,3]. Another beneficial aspect of this technology is the reduction of material waste, and therefore overall process cost, especially in metallic alloys with high added value. For instance, the buy-to-fly (BTF) ratio of many aeronautical parts can be usually higher than 30 when machining from billets, whereas when manufactured by WAAM, this value can be reduced to lower than 1.5, minimising the cost and maximising material savings [3,4].
In WAAM, solidification is a major challenge, due to the promotion of microstructure with large columnar grains. This provides lower strength, toughness, and corrosion resistance compared to a fine equiaxed microstructure, which usually is difficult to develop in WAAM and other AM technologies [5].
Depending on the heat source used in WAAM, a classification of four process types can be done: gas metal arc welding (GMAW)-based, gas tungsten arc welding (GTAW)-based, plasma arc welding (PAW)-based, and cold metal transfer (CMT)-based [1,6,7]. This last one, is a GMAW based welding technology, developed by Fronius International GmbH, Pettenbach, Austria. This technology uses a controlled-dip transfer mode mechanism which gives rise to excellent quality weld beads, with lower thermal heat input and ideally no spatter. Specifically, for aluminium, the low-heat input contributes to obtaining finer equiaxed grains and oxide cleaning [4]. For aluminium alloys, investigations have been using mainly GMAW and CMT-based technologies.
CMT technologies reduce arc energy compared to conventional GMAW, leading to smaller, cooler, and faster cooling melt pool, which leads to pore content reduction when using aluminium alloys [8]. The increase in the temperature can lead to cracking in addition to the usual porosity [9].
Aluminium offers a unique combination of properties, with the good corrosion resistance and elevated strength–weight ratio being the ones to stand out. In addition, the possibility of adding small amounts of different alloying elements makes this material highly interesting, and this has historically conducted to the development of heat-treatable high-strength aluminium alloy series.
Besides hot cracking, porosity is one of the main problems in WAAM of aluminium alloys, which can severely limit the mechanical properties of the part. Porosity is generated as a result of several factors including arc welding process, process parameters, interpass temperature, wire quality, and alloy composition [10]. In a multiple-layer WAAM process, the heat input of new superposed layer can contribute to the growth of pores [11].
Studying the effect of arc modes in microstructure characteristics and mechanical properties, B. Lu et al. [12] analysed the effect of CMT, CMT-P, and CMT-ADV arc modes depositing 5183 aluminium alloy in porosity formation. The results obtained of porosity area percentage of 0.63%, 0.85%, and 0.36%, respectively, demonstrated that heat input during deposition has a high influence. Moreover, CMT and CMT-A consist of interlayer fine-grain region and layer column grain size, while the CMT-P process, with the greatest heat input, contributes to generate column grains. Because of this, CMT-ADV had the best mechanical properties results with a UTS above 290 MPa, while CMT had reduced values (280 MPa), and CMT-P had the lowest ones with 270 MPa. B. Cong et al. [13] studied the effect of CMT arc modes (CMT, CMT-P, CMT-ADV, and CMT-PADV) in the generation of porosity in walls manufactured by WAAM. Excellent superficial appearance and effective wire oxidation cleaning were obtained for the four CMT technologies but especially for those CMT modes with negative polarity cycles. However, the porosity present in each case was different, concluding that the selected CMT arc mode directly affects the generated porosity as the heat input for each one is different. CMT-PADV highly reduces the heat input, and as a consequence, less porosity is generated. K. F. Ayarkwa et al. [14] further investigated the effect of CMT-PADV arc mode besides analysing the impact of the wire feed speed/travel speed (WFS/TS) relation to the resultant dimensions as well as to the heat input. This relation also determined resulting porosity in the part: while its value increased from 10 to 20, so did the porosity amount.
Other authors [4,15] have also concluded on the great benefits of using CMT-PADV for the sake of reducing porosity and improving the tensile test mechanical properties. The porosity values obtained with CMT and CMT-ADV (in [4]) were 0.347% and 0.288%, respectively, whilst by using CMT-PADV, a 0.06% of porosity was obtained for AlMg5Mn alloy from 5xxx series. They concluded [4,15] that only parts manufacturing by the CMT-PADV process has an almost isotropic behaviour, since with the rest of the processes, pores concentrated at the interlayer boundaries had a detrimental effect on samples tested along the building direction. Therefore, the anisotropy that reduced the deformation capacity in the vertical direction (parallel to building direction) was attributed to the crack initiation by stress concentration and cross-sectional weakening due to this mostly lineal interlayer porosity.
B. Qi et al. [11] reached a similar conclusion for Al-6.3%Cu alloy equivalent to AA2219, and they reported that the heat input is the key factor in order to obtain a low porosity amount and should be below 300 J/mm. In this case, thin and bulk parts were built up leading to different cooling rates and resulting porosity levels. The thin walls cooled by dissipating heat in 2D, while head dissipation was faster in bulk parts due to 3D heat-sinking paths, and as a consequence, the grains were more refined and the pore nucleation speed reduced.
Furthermore, K. Derekar et al. [16] studied the impact of interpass temperature on the generation of porosity. X-rays revealed less porosity amounts in parts built with higher temperature between consecutive layers and dominated by small pores.
E. M. Ryan et al. [17] studied the influence of the ER2319 wire superficial quality on the soundness of WAAM deposits. They concluded that this was the most critical parameter to avoid the generation of pores in parts, and the CMT modes, wire feed speed (WFS) or wire feed speed/travel speed (WFS/TS) ratio did not appear to induce any significant variation in porosity. According to them, process parameters do not have such a great impact on the final quality of the part as the wire surface quality. In this sense, a rough wire surface is associated with enlargement of the superficial area and preferential sites for the entrapping of humidity, contaminants, and oxides, which can increase the hydrogen absorption enhancing porosity in deposited material.
Porosity can impair the mechanical properties of WAAM aluminium parts. M. Köhler et al. [18] observed a noticeable anisotropy in the mechanical properties of AA4047 and AA5356 WAAM deposits depending on the direction of loading. Samples parallel to the build-up direction suffered a remarkable elongation loss that the ones tested in the transversal direction did not. Authors referred to the non-equiaxed microstructure, but also the porosity of the part mostly in interlayer region to explain this behaviour.
Y. Zhao et al. [19] reported the same behaviour with three different aluminium alloys (4043, 5356, and 2319). The anisotropy was related to the preferential growth of the grains in the vertical direction, that is, in the direction parallel to the building axis, which generated a reduction of mechanical properties determined along this testing direction. In the horizontal direction, the grains were continuous, and the dendritic structure were able to support a higher elongation and tensile strength.
Other authors who noticed this behaviour with 5xxx series aluminium when building with CMT technology were M Gierth et al. [4]. In this study, porosity levels were below 0.5%, but the microstructural analysis showed non-equiaxed grains. This had a direct impact on the elongation of the specimens, having lower values for the ones extracted in the vertical direction, parallel to the building direction.
However, to the authors best knowledge, nobody has deeply investigated the influence of shielding conditions on the resulting porosity and mechanical properties of aluminium WAAM parts.
The current work studies the influence of shielding gas, gas flow rate, and deposition strategy on the porosity and resulting mechanical properties of Al-Mg series aluminium WAAM parts manufactured by ER5356 commercial wire filler metal.

2. Materials and Methods

In this study, cold metal transfer (CMT)-based WAAM with ER5356 filler metal of 1.2 mm diameter is investigated. Four mm thickness AA6082-T6 substrate was used. This material only has an influence in the initial layers, while the study has been focused in the analysis of soundness and porosity of additively manufactured components built by superposition of multiple layers using the described wire filler metal. The chemical compositions of the filler and base materials are shown in Table 1.
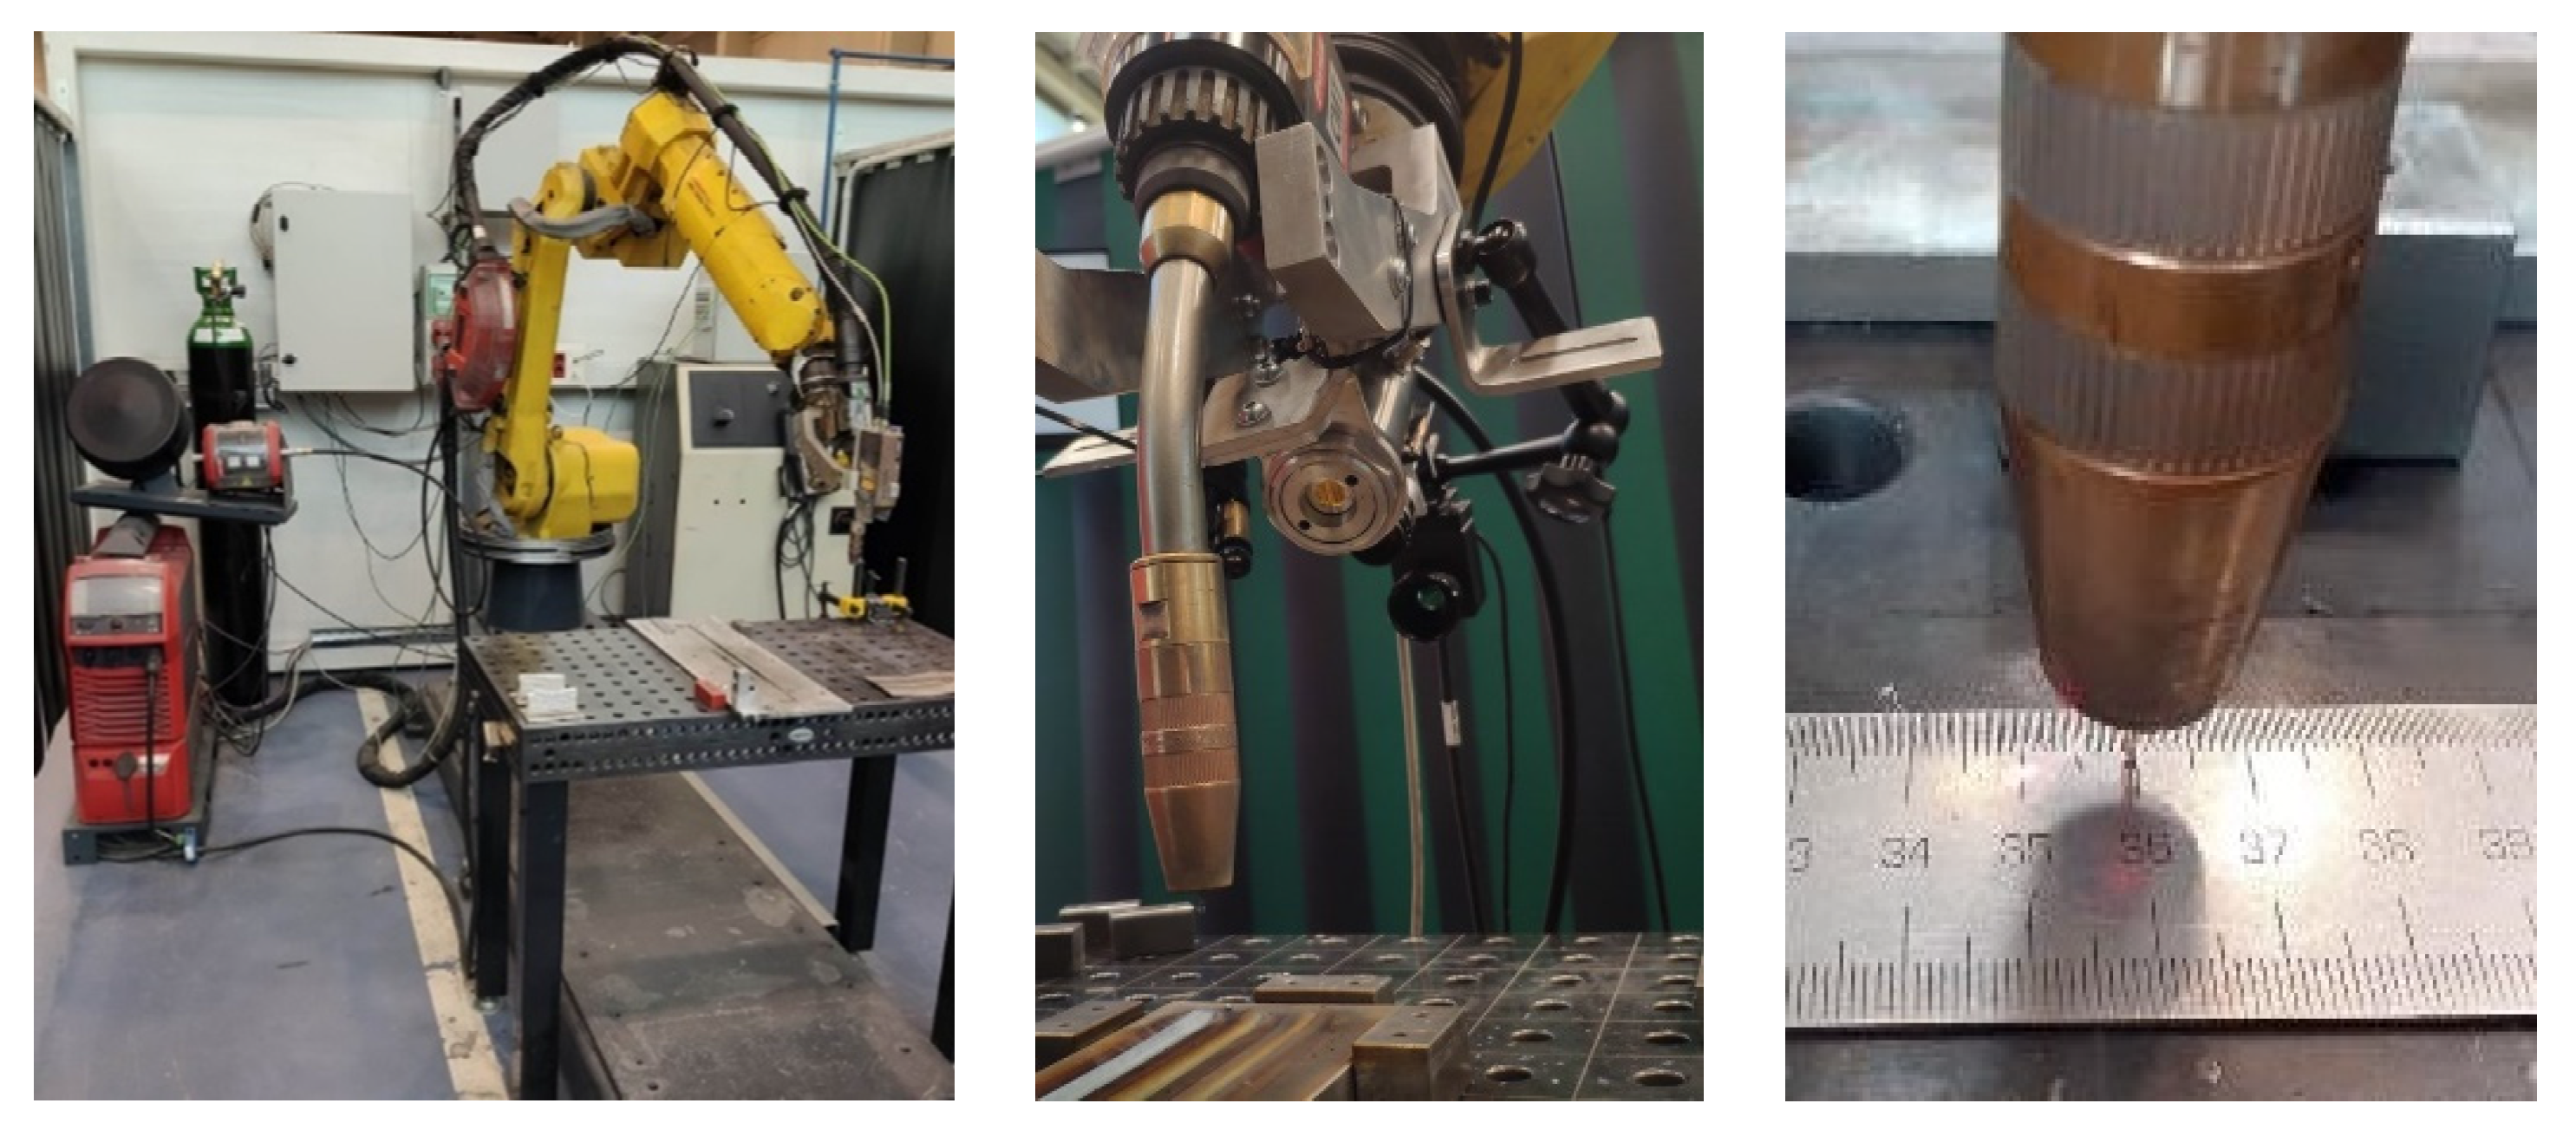
For the WAAM trials, a Fronius CMT TPS 400i welding power source and WF 60i Robacta Drive CMT/W welding torch (Fronius International GmbH, Pettenbach, Austria ) assembled in a Fanuc ARC Mate 120iC robot (Fanuc Corporation, Oshino-mura, Yamanashi Prefecture, Japan)were employed. This equipment (Figure 1) was mounted in the intelligent welding cell of LORTEK that includes an optris CTlaser 1MH1 (Optris GmbH, Berlin, Germany) pyrometer (lower right picture) closely pointing to the weld and a PLC CX2040 data acquisition system. The data caption system was able to capture and record the current, arc voltage, WFS, shielding gas flow rate, coordinates of the tool centre point (TCP), and temperature of the melt pool. Temperature was taken from a distance of 10 mm from the TCP and central position of the wire in the torch.
The study included the manufacturing of single-layer deposits, 20-layer height walls, and taller walls from which tensile test samples were extracted. Tensile test samples were machined both from vertical (90 mm × 130 mm) and horizontal (130 mm × 70 mm) walls, and corresponding samples were parallel and transversal to the building direction, respectively.
Single-layer weld beads were useful to analyse the effect of two shielding gases (Argon Q1 and Stargold® three-phase Ar+O2+N2O mixture from Nippon Gases (Table 2)) and corresponding flow rates on the porosity.
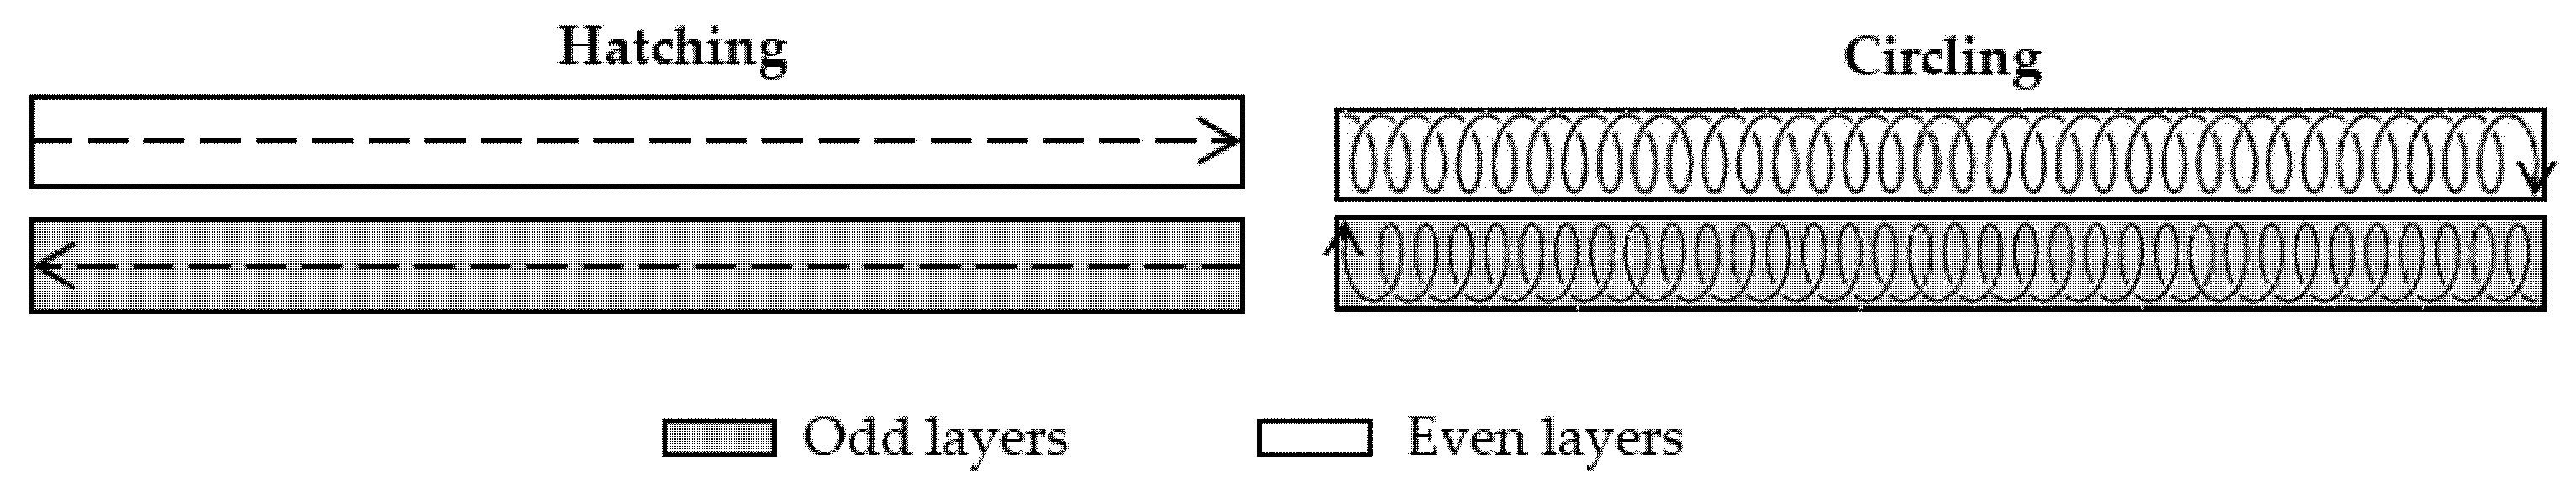
Two deposition strategies shown in 
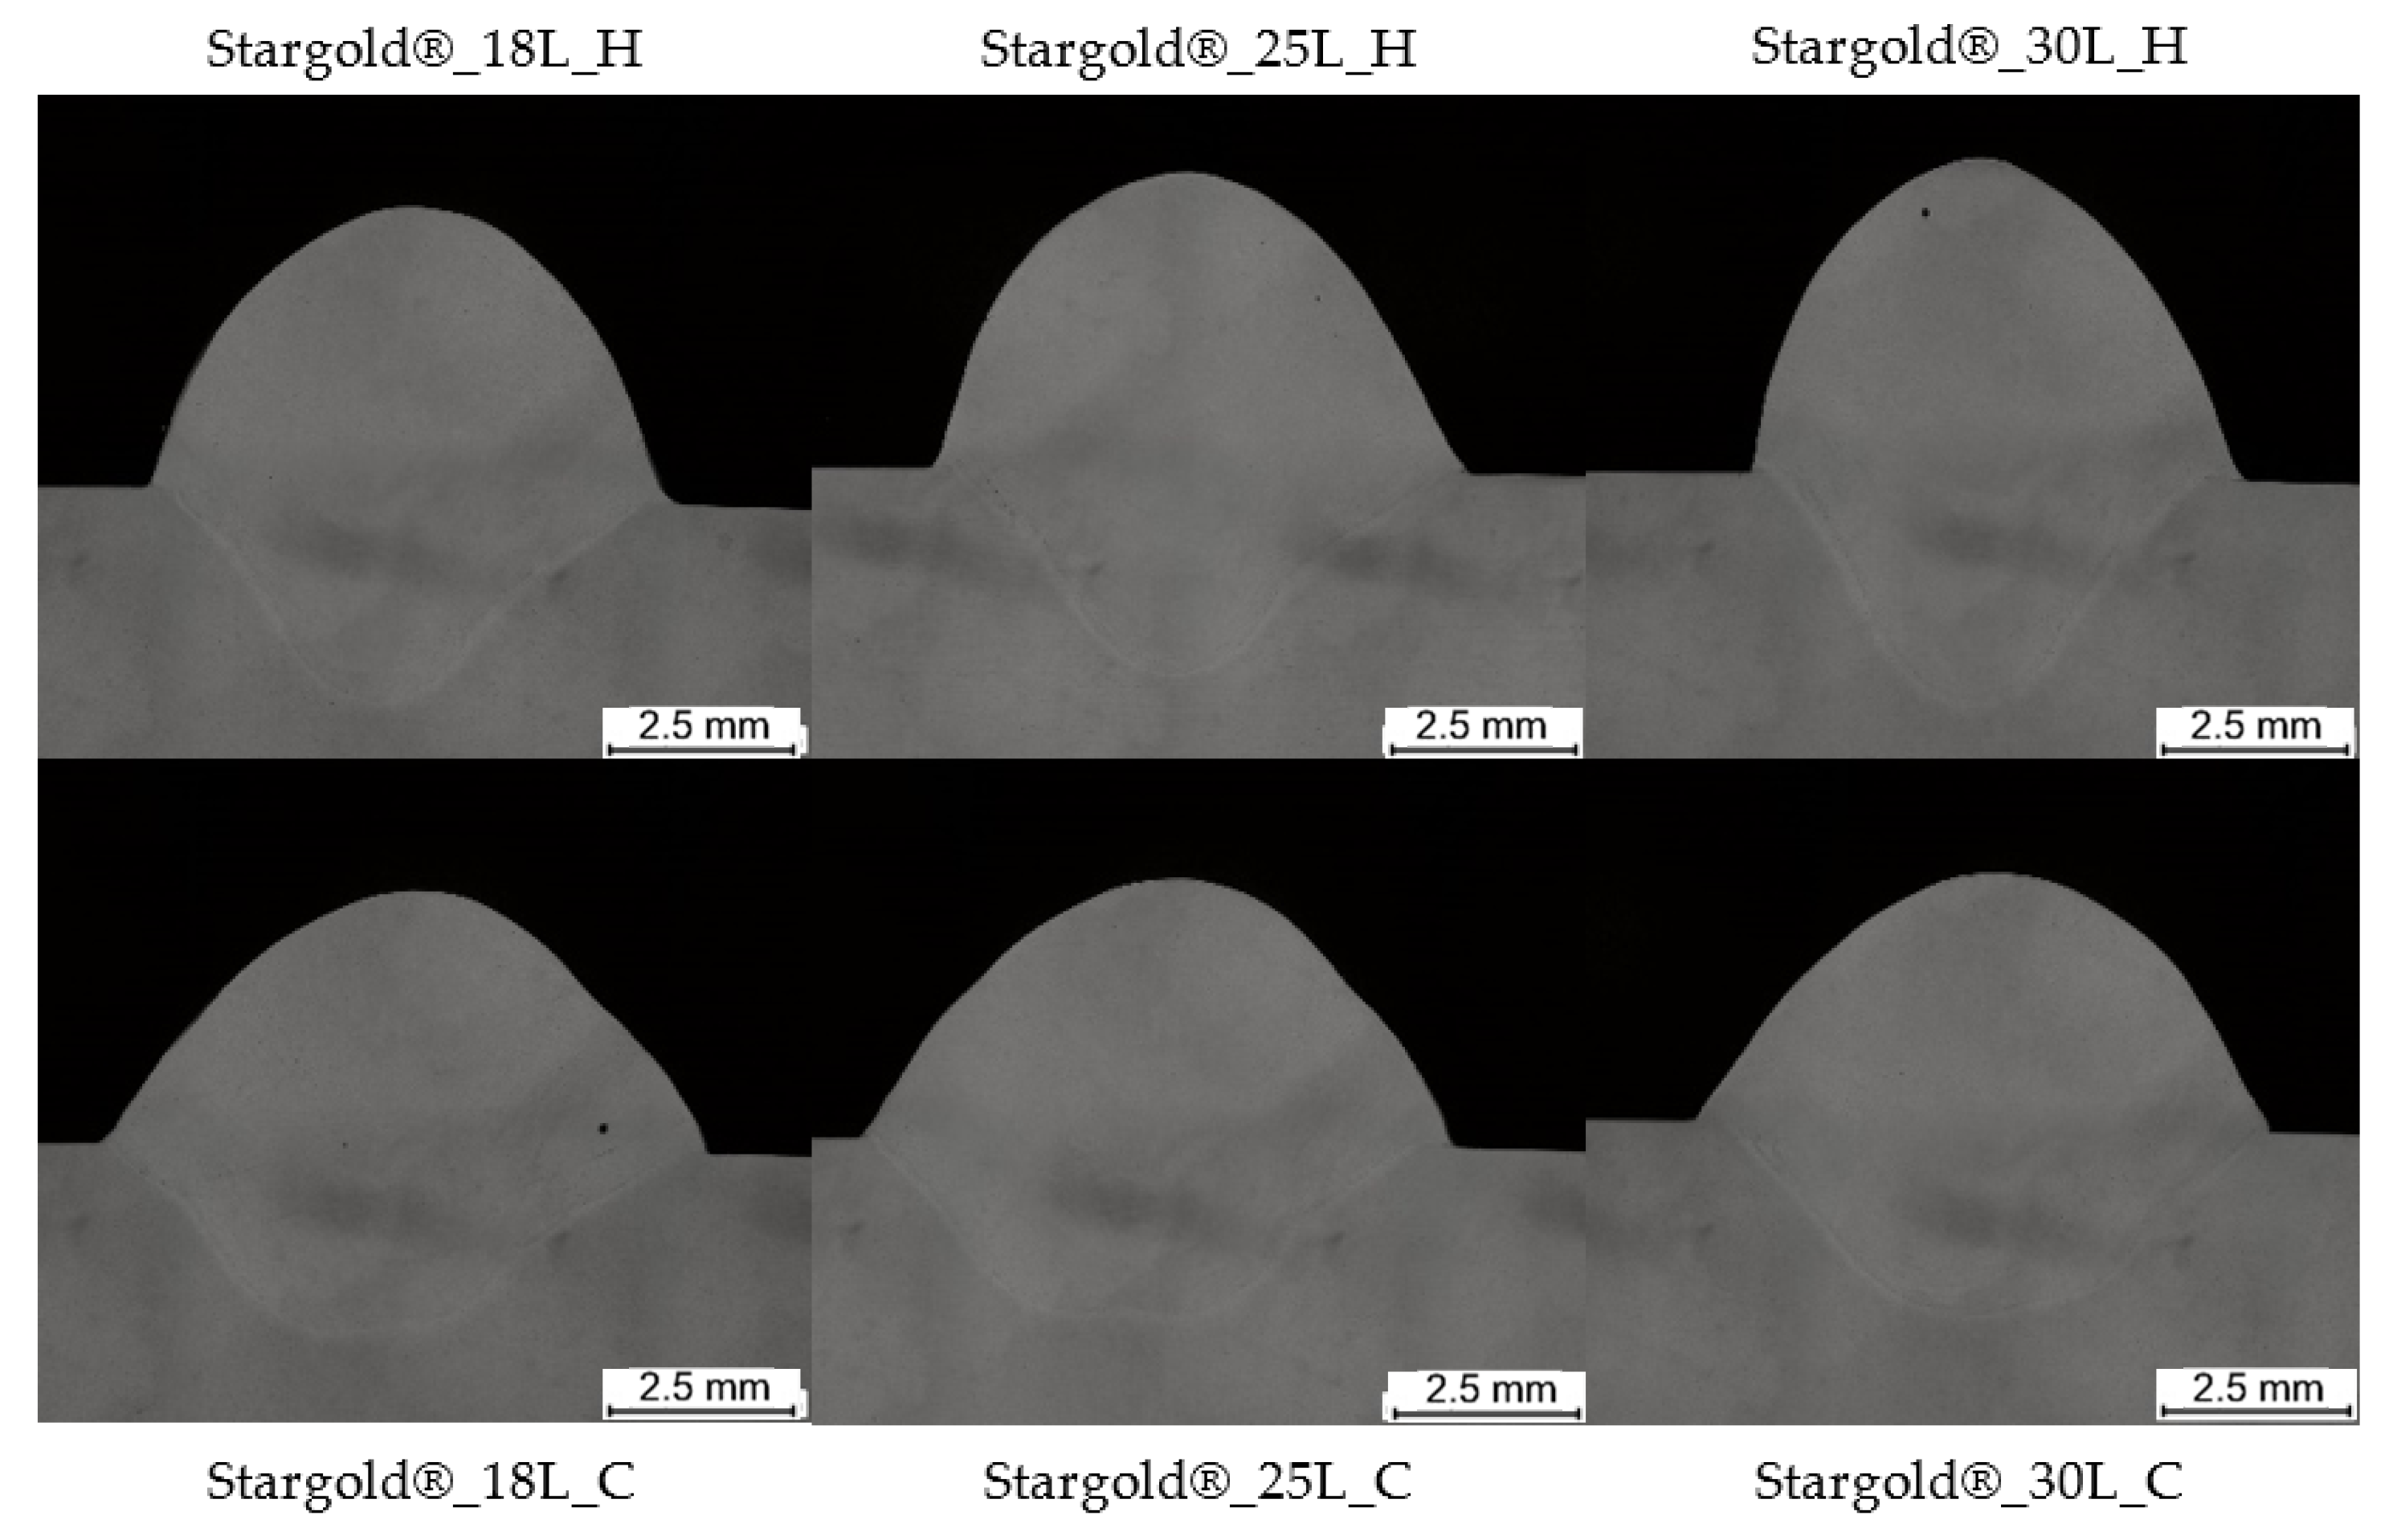
Figure 2 were tested. Hatching strategy represents straight weld bead without any weaving, whereas circling can be described as the overlapping of round circles with 2 mm amplitude and 3 Hz frequency. For both deposition strategies, travelling direction is changed from odd to even layers to provide a more stable building.
To avoid necking formation when using hatching deposition strategy, a sequential reduction of welding parameters was used reducing the welding intensity from the initial 130 A to 77 A in the fourth layer (Table 3). Circling deposition strategy does not need this adjustment of the welding parameters and only the intensity of the first layer must be increased to ensure good wetting and fusion of the base plate. The travel speed was kept constant at 0.6 m/min, whereas the wire feed speed varied from 5.2 m/min at 77 A to 8.6 m/min at 130 A.
Taking into account the applied electrical parameters, the heat input (HI) value can be calculated (Formula (1)), having as a result 72.07 J/mm. Another factor taken into account is the WFS/TS ratio, which was kept in 8.6 below 10 to meet recommended welding parameters to reduce porosity [14].
HI = I · V T S · η = 77 · 11.7 10 · 0.8 = 77.07   [ J mm ]
The same welding parameters, building strategies, and gases were employed for the manufacturing of multiple layered walls to check the quality in terms of porosity and pore size and determine mechanical properties. In all cases, the base metal was cleaned with a stainless-steel brush and acetone before welding. In order to ensure a stable growth, an interlayer waiting time of 90 s was applied between layers. Main process parameters and melt pool temperature were recorded during these deposition trials.
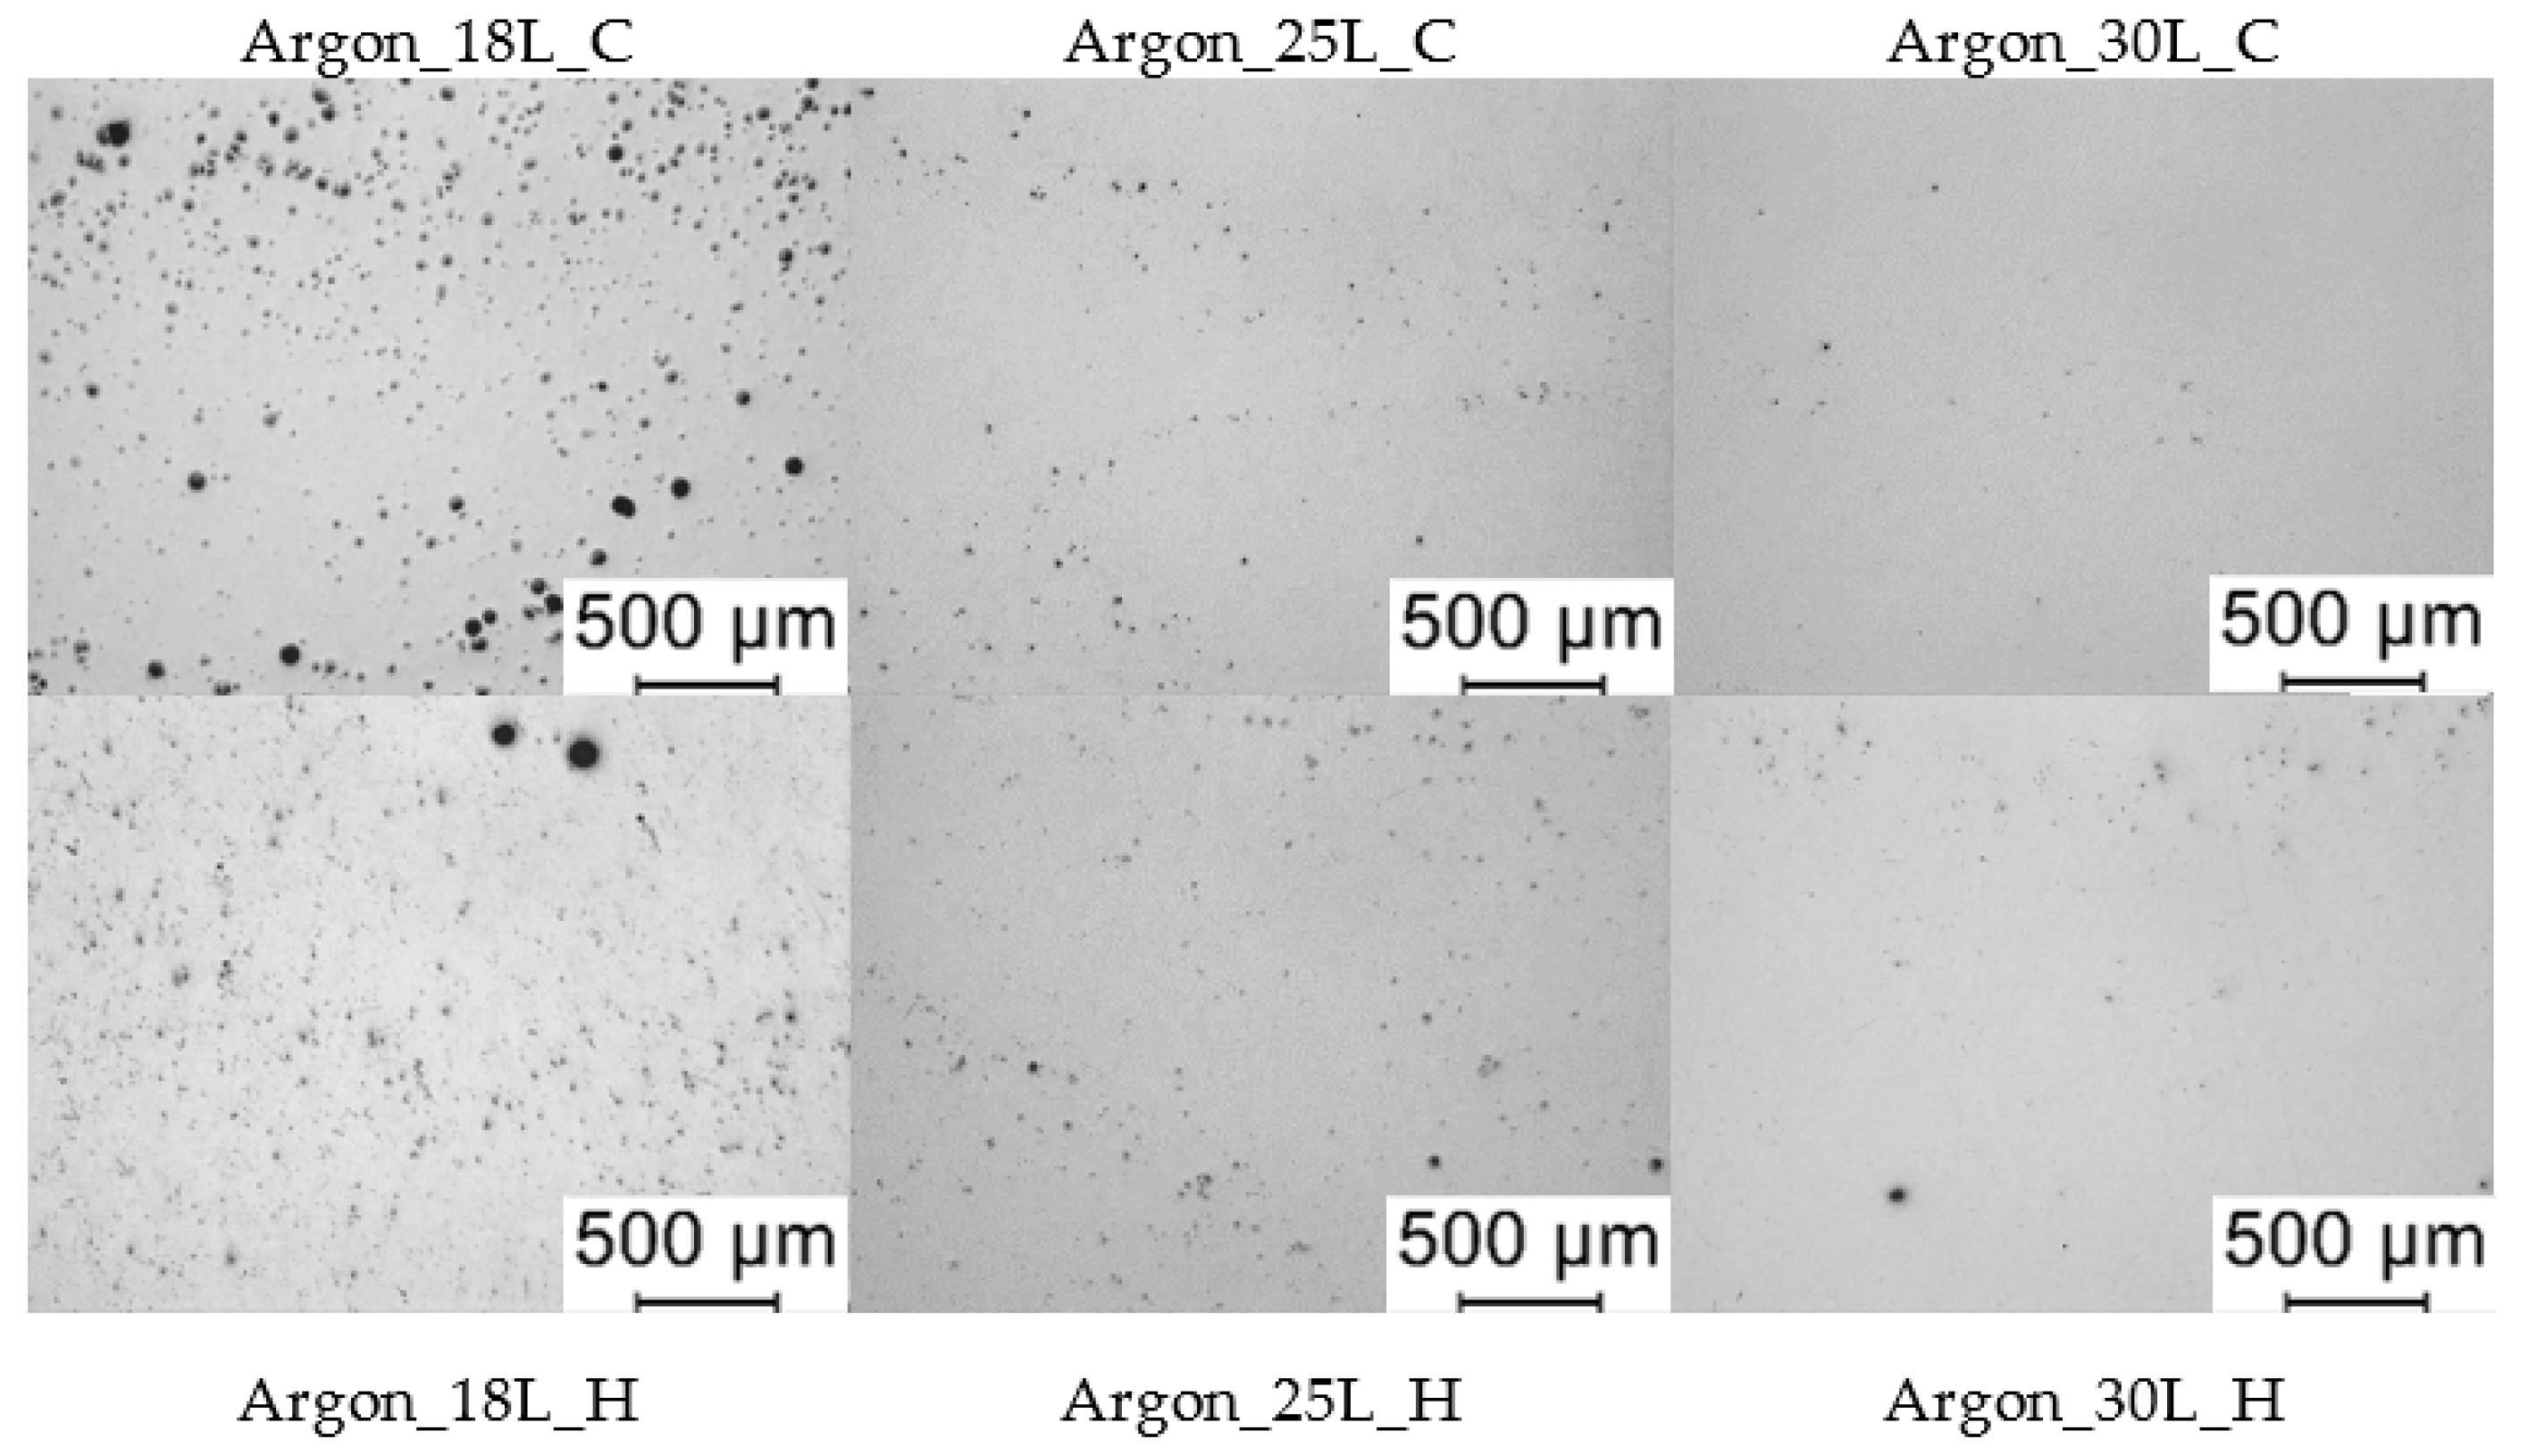
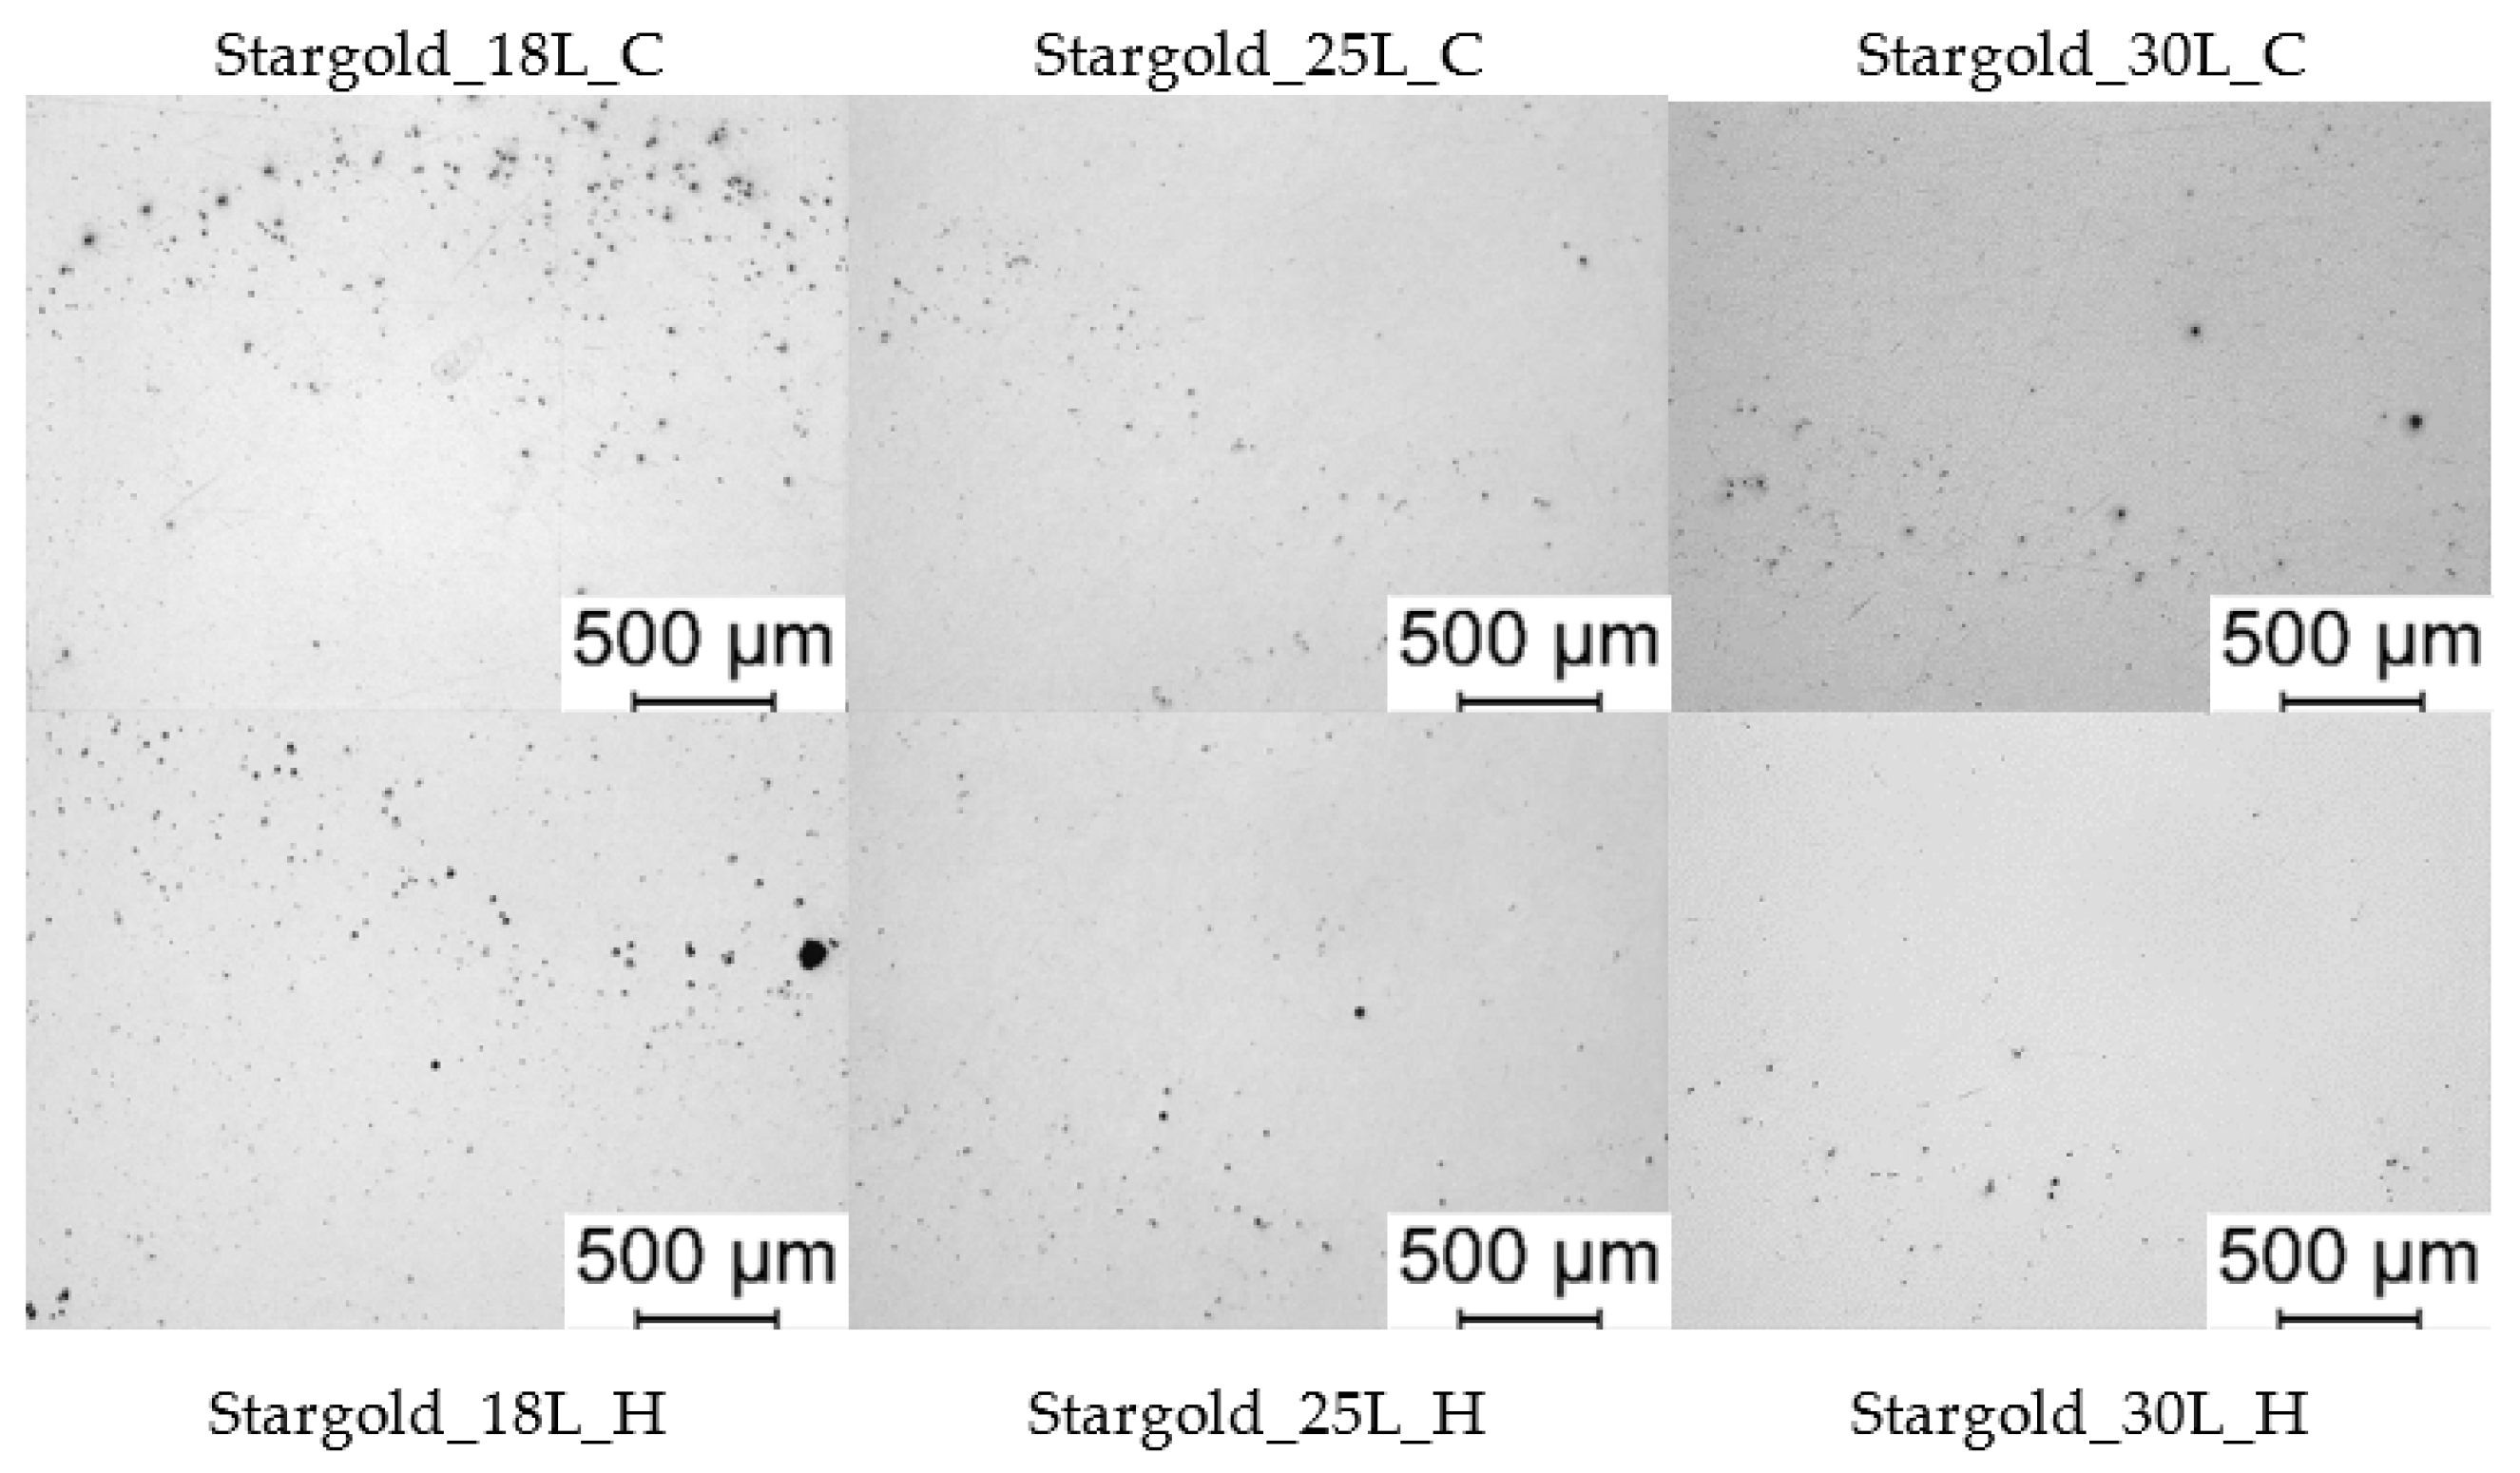
After the visual examination, metallographic samples were taken from the bottom, middle, and top part of the samples for porosity analysis. To do so, an Olympus Gx51 microscope and ImageJ program were used, where pores smaller than 10 µm were dismissed. Taking images from the middle part of the sample along the wall length. A minimum of three images with a magnification of 5× were taken from the overall studied part, meaning a total inspection area of 6.12 mm2 was analysed for each part.
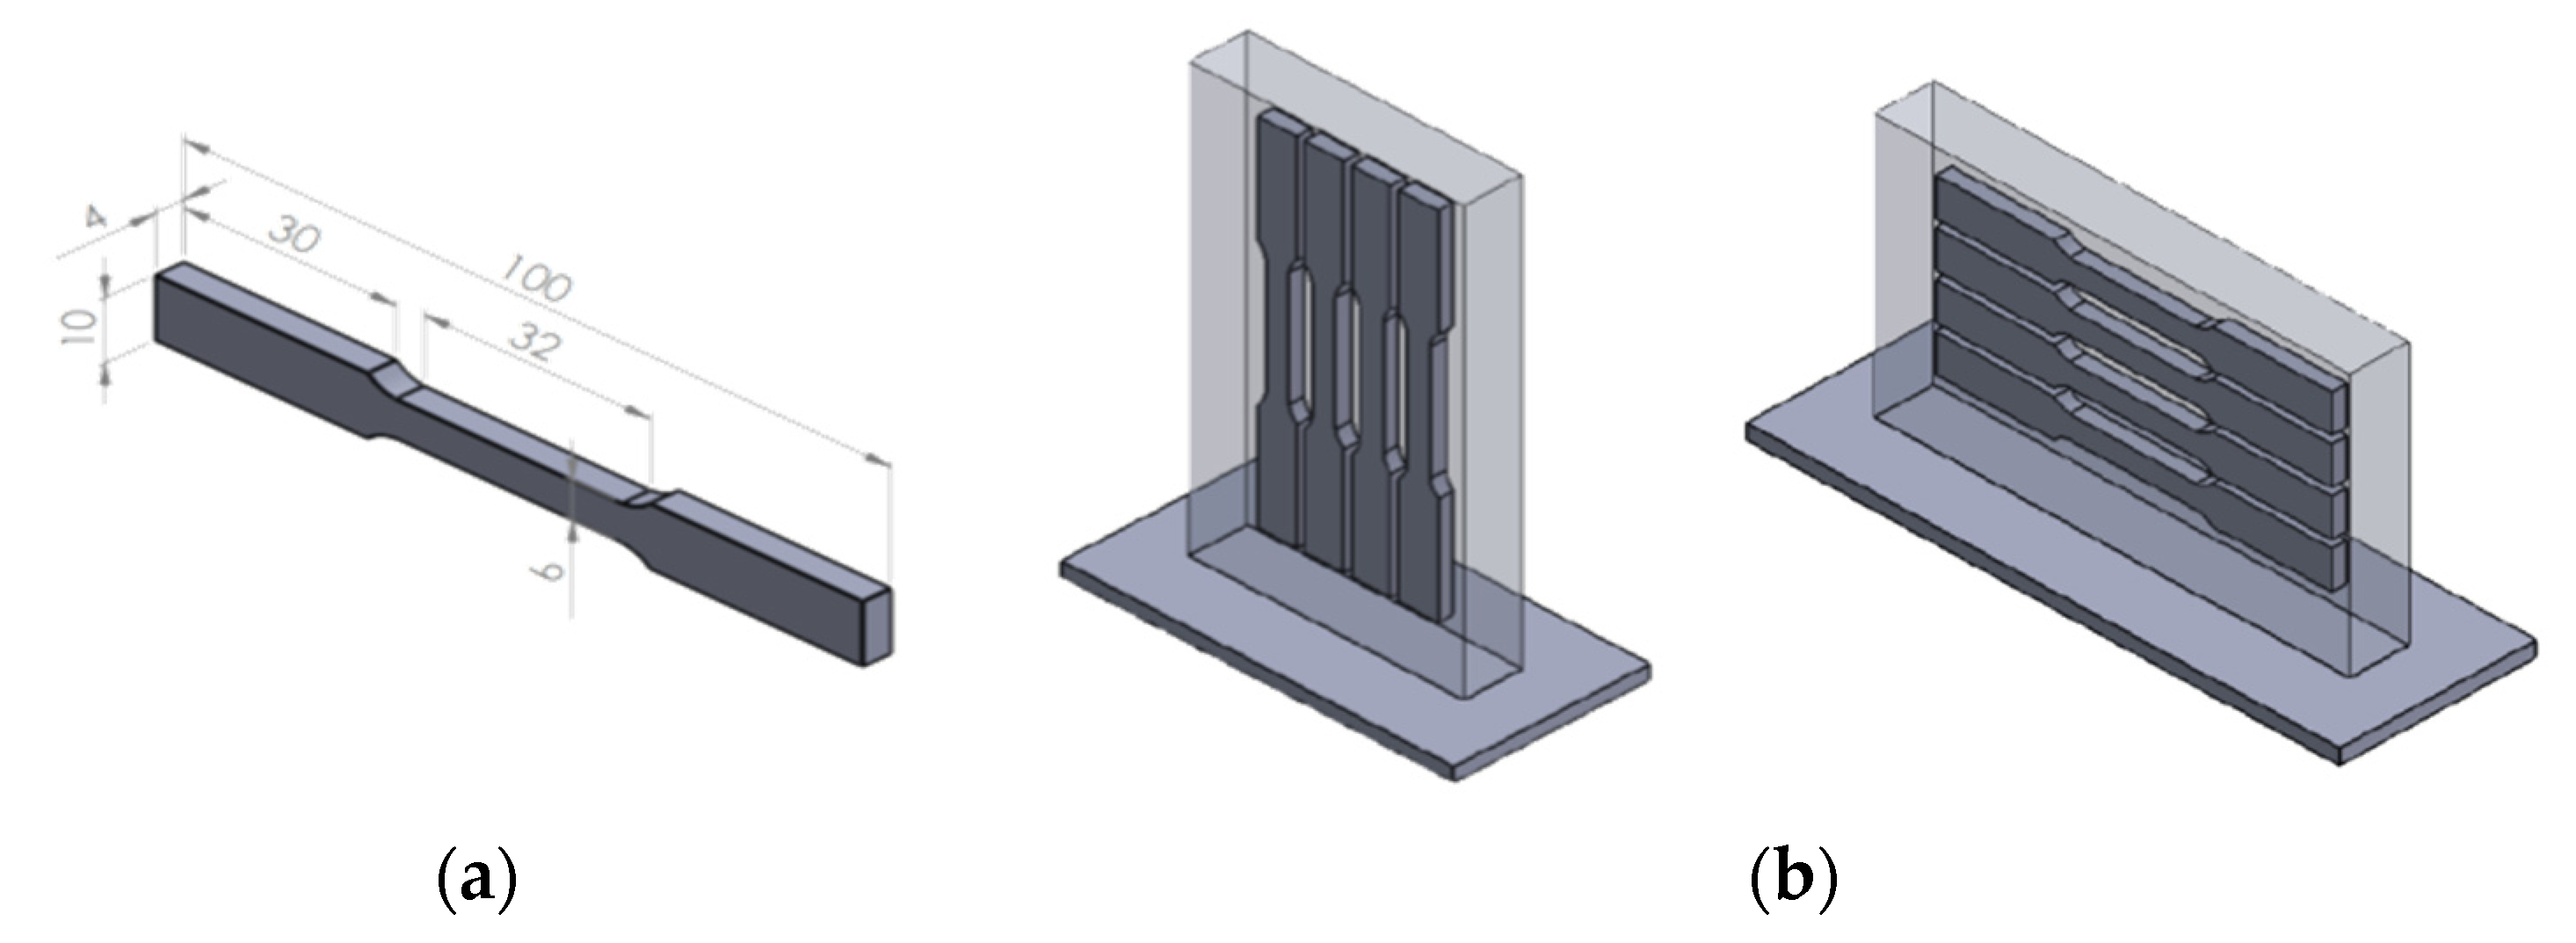
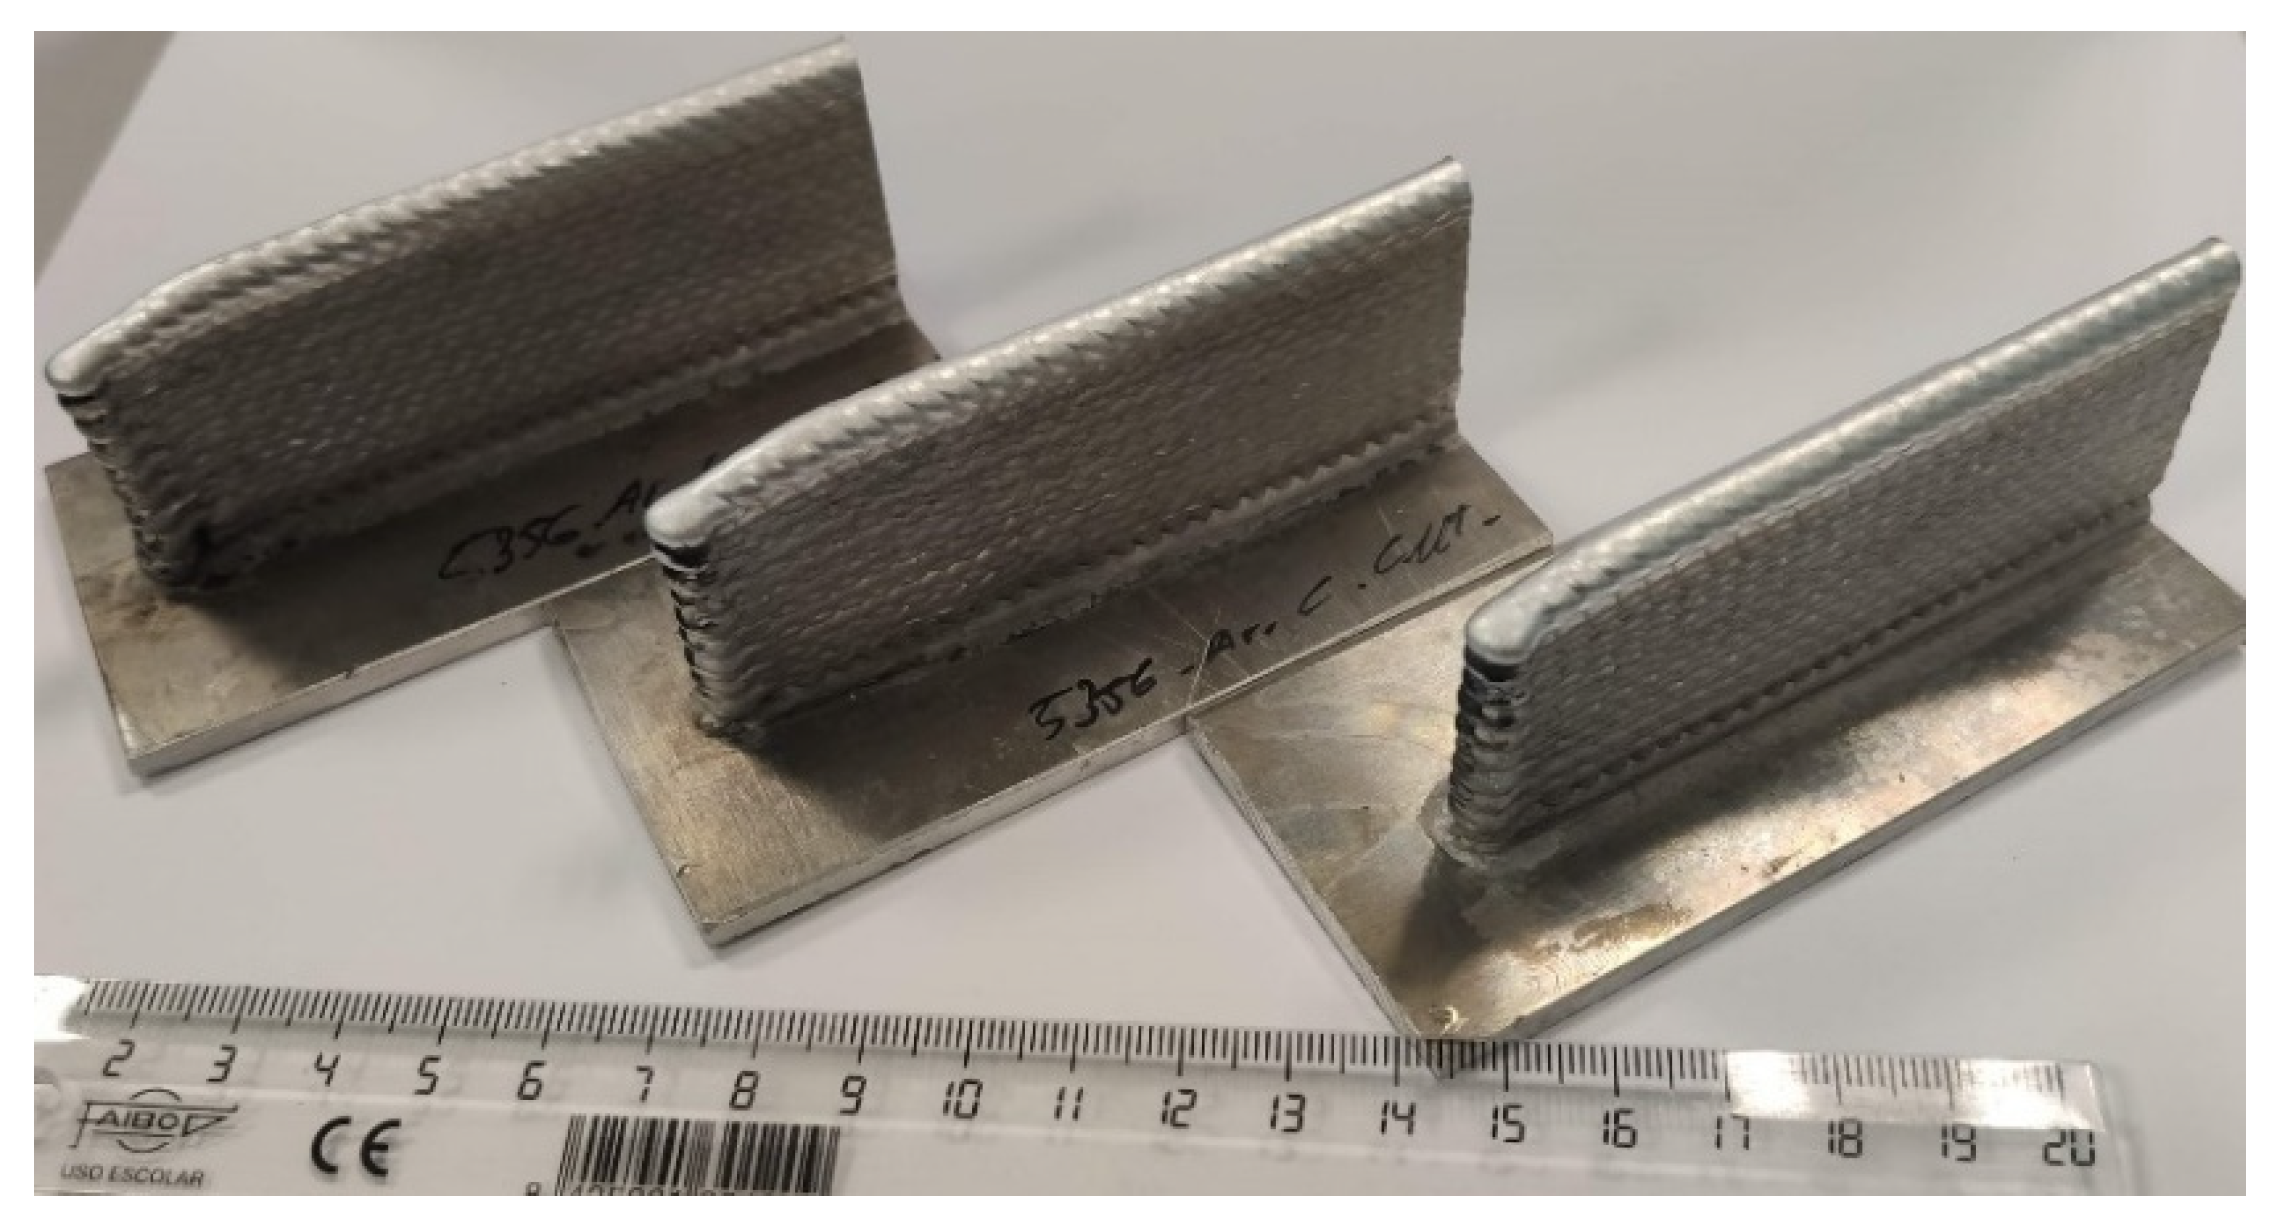
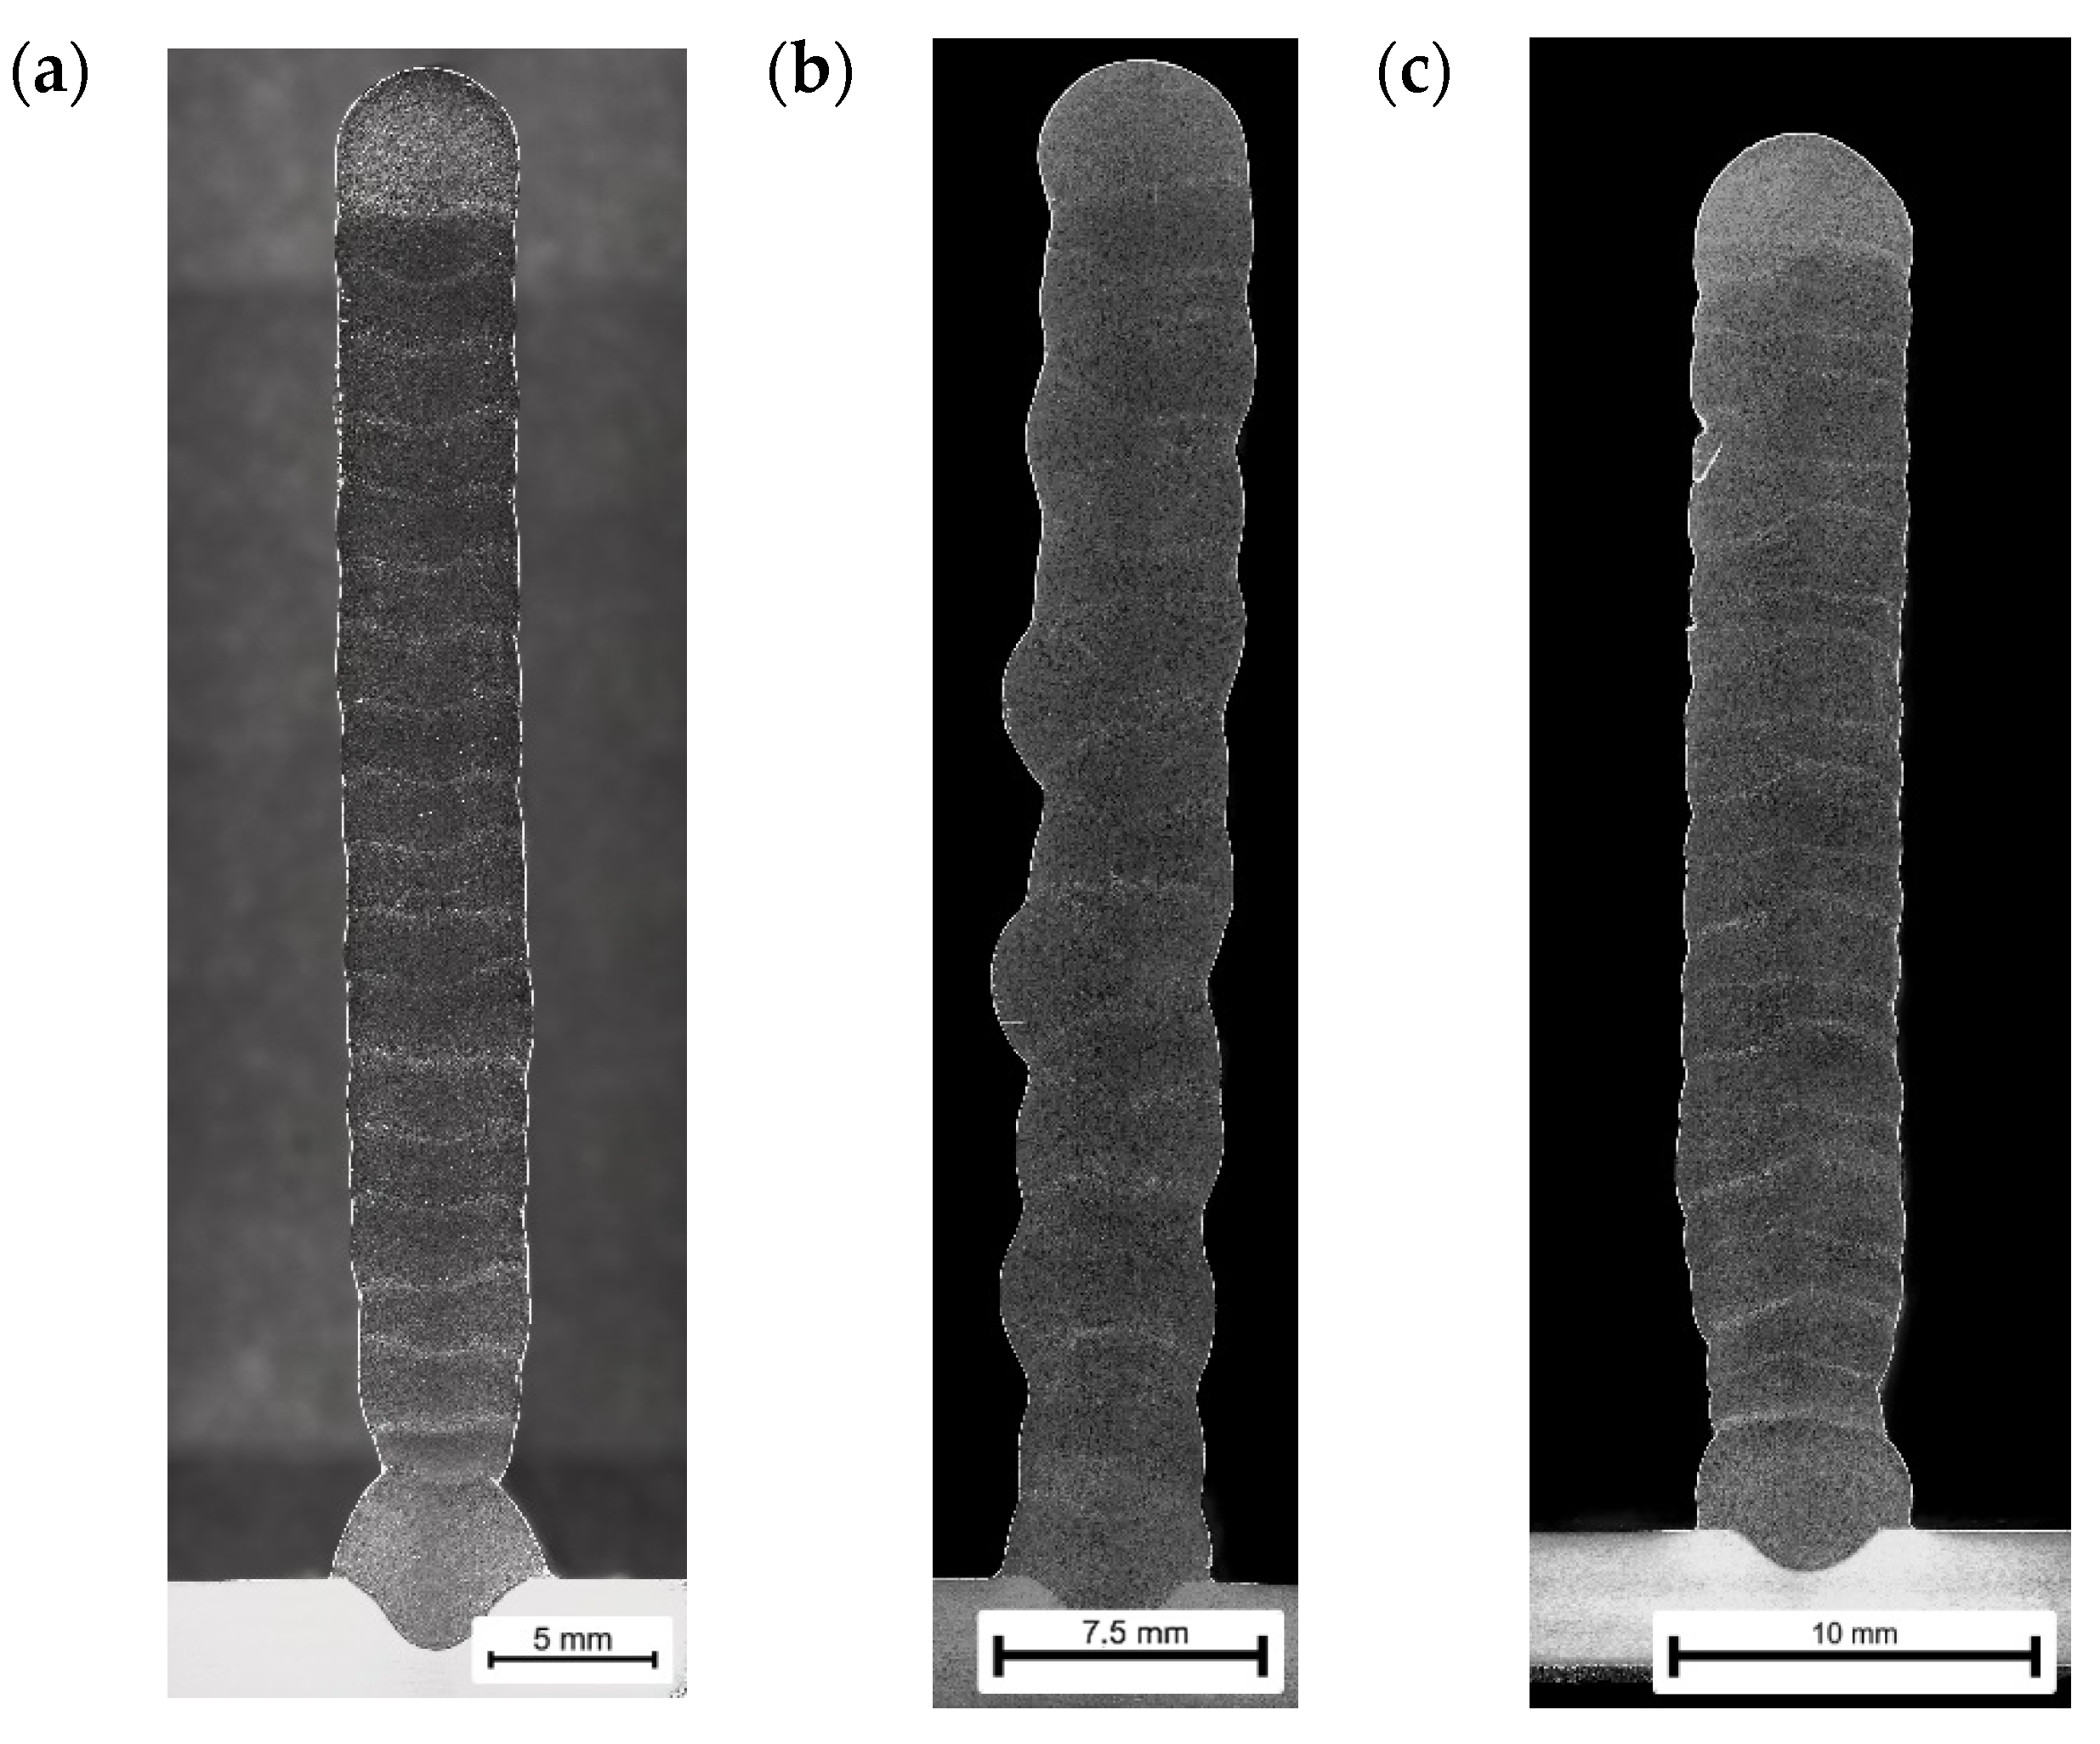
The walls built to analyse the mechanical properties were inspected with X-rays previous to the extraction of the specimens and after surface milling to reduce roughness and facilitate inspection. For the X-rays, a ISOVOLT Titán X-ray emission equipment (Waygate Technologies, Hürth, North Thine-Westphalia, Germany) was used perpendicular to the parts, with 100 kV and 15.7 mA. Three specimens were extracted from each building condition, and they were extracted according to ASTM E8M from the core of the walls (
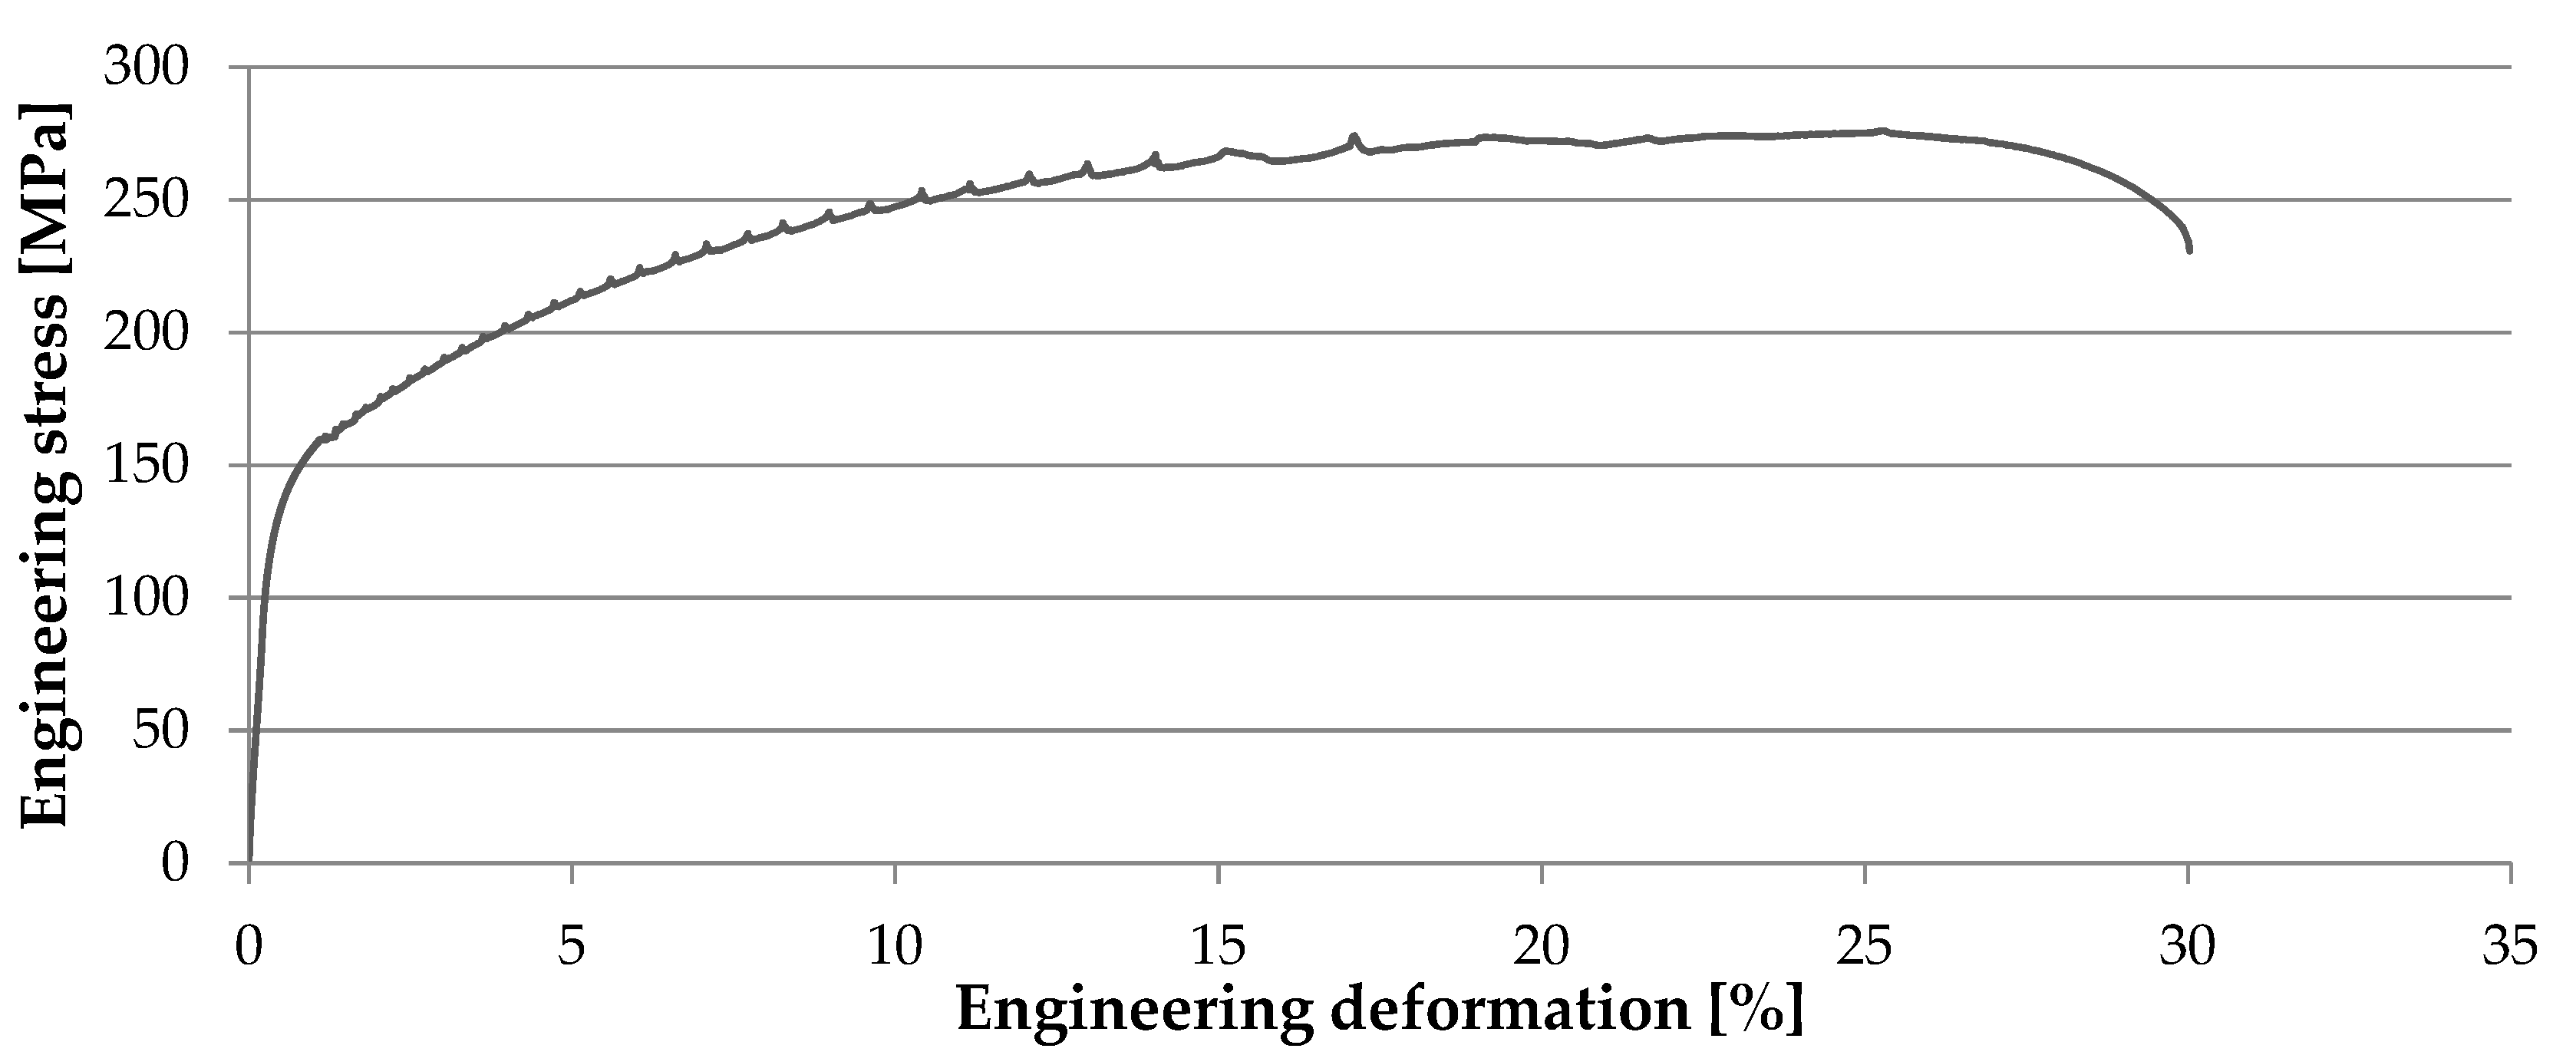
Figure 3) avoiding the arc start and end regions. To test these samples a ZwickRoell Z100 tensile test machine (ZwickRoell GmbH & Co. KG, Ulm, Germany) was used. To study the anisotropy of the part, some specimens were prepared parallel to build-up direction (vertically) and others perpendicularly (horizontally).

3. Results

3.1. Single Welding Bead Trials

Initially, the influence of the shielding gas, gas flow rate, and the depositing strategy on the porosity and the welding bead geometry was investigated using Argon Q1 and Stargold®. Both hatching (H) and circling (C) strategies were applied with 130 A of intensity. This was the intensity required in the first layer in direct connection with the base plate to ensure good wetting and fusion of the substrate.
The micrographs in Figure 4 and Figure 5 show that generally the welding beads are mostly free of porosity except for some isolated pores not greater than 100 µm in diameter. No influence of shielding gas or flow in terms of porosity was observed in these single beads.
The dimensions of the single beads were measured to compare the effect of the deposition parameters (Figure 6). Hatching led to comparatively narrower and higher weld beads with deeper penetration. Minor influence of the nature of shielding gas and gas flow rate was observed.

3.2. Multiple-Layered WAAM Walls

Influence of deposition strategy and shielding gas on porosity were studied using CMT arc mode. To do so, 20-layer height walls were manufactured (Figure 7), and the area percentage of porosity was quantified from examination of cross-sections. The resultant wall thickness was 6 mm for hatching deposition strategy and 8 mm for circling.
As for the single weld beads, combinations between Argon and Stargold®, with hatching and circling deposition strategies were studied. With hatching, a necking happened in the first layers when reducing intensity directly from 130 A in the first layer to 77 A in the second and the rest (Figure 8a). To avoid this defect, the process parameters were adjusted in the second and third layers (Table 3) to obtain a constant wall thickness along deposited layers (Figure 8b). On the other hand, circling was a very stable deposition strategy which ensured a flat and even layer width and height, and the reduced risk of humping. A banded structure can be seen either for hatching and circling deposition strategies, which resemble the layer-by-layer building process.
The minimum shielding gas flow of 18 L/min was selected as this value is specified in most of the available bibliography references [16,17,18,19], but as the flow was increased to 25 L/min and 30 L/min, a drastic reduction of porosity was observed (Table 4). The area percentage porosity was determined from micrographs that were taken randomly throughout all the part.
In most of the cases, the reduction of porosity was more than evident when increasing gas flow rate to 25 and 30 L/min, except for Stargold® + circling. The impact was especially relevant for the Ar circling and Stargold® hatching conditions that shown the lowest porosity levels below 0.06% and 0.12% in area, respectively.
In Figure 9 and Figure 10, the micrographs of the manufactured parts with different shielding gases, flows, and deposition strategies are shown.
For the lowest shield gas flow rates (Figure 11), high dimensioned pores tended to be aligned and concentrated in the interlayer bands with smaller pores distributed randomly in the part, whereas for 30 L/min only the smaller, isolated, and randomly distributed pores appeared.
The temperature of the melt pool in each layer throughout the manufacturing process was measured during the deposition, using the pyrometer. The pyrometer was located close to the welding torch following the movement of the robotic arm and always keeping the same distance, i.e., 10 mm, with respect to the TCP, as shown by the blue dot in Figure 1. The torch did not rotate when manufacturing different layers, and therefore, the pyrometer was pointing to the rear side of the weld in odd layers and to the front side in even layers. This difference can be seen in Figure 11 showing that measured temperatures were higher in the even layers. Temperature was measured every millisecond (100 Hz) while the welding was active. A mean temperature value was determined for each layer after leaving out the initial and final time gaps of one second.
As Figure 12 represents, circling is a comparatively hotter deposition strategy that leads to continuous accumulation of heat and increment of average melt pool temperature compared to hatching. Moreover, temperatures determined for Argon shielding gas, gave rise to comparatively higher weld bead temperatures than for equivalent conditions with Stargold® shielding gas.
In the next Figure 13 and Figure 14, the 19th layer is represented for the two deposition strategies and shielding gases blown at 30 L/min. Being an odd layer, the pyrometer was measuring behind the arc. In this graph, the difference between circling and hatching temperature can be observed. Because of the torch movement with overlapped circles along the welding direction applied during circling, temperature rises and drops periodically, whilst for hatching it stays constant along the time. For the determination of mean melt pool temperatures included in Figure 12, data from the first to the twelfth second are computed, that is, temperature data between two black vertical lines in Figure 13 and Figure 14.

3.3. Mechanical Properties Determined from WAAM Samples

After analysing porosity results, taller walls were manufactured in order to obtain tensile specimens. The parameter combinations used were the following ones: Argon at 18 L/min+ hatching, Argon at 30 L/min + hatching, Argon at 30 L/min + circling, and Stargold® at 30 L/min + hatching. Tensile test samples of 4 mm thickness were machined from these walls to test the mechanical properties along building direction (vertical) and along horizontal direction.
In this case, besides average area % of porosity, pore size distributions and maximum pore diameters were also measured in cross-sections of the walls. The largest pores were manually searched in each section by scanning the whole cross-section. Note that for the determination of average area % of porosity, analysed sections were selected randomly. As it happened in 20-layer height walls, Argon at 30 L/min + circling (Ar_C_30l) and Stargold® at 30 L/min + hatching (Star_H_30l) combinations showed again the lowest porosity levels (Table 5). Moreover, maximum pore sizes that were identified along the whole cross-sections were comparatively much smaller for these two conditions. These results are consistent with the pore size distributions determined from the three analysed sections that were randomly selected in each wall (Figure 14). The micrographs taken from these walls were similar to the ones shown in Figure 9 and Figure 10.
It has to be taken into account, that after analysing the distribution of this porosity, it was observed that most of the pores present in the parts were smaller than 50 µm in diameter, as shown in Figure 15, but for Argon + hatching with 18 and 30 L/min (Ar_H_18L and Ar_H_30L) pores greater than 100 µm were found even in randomly selected sections.
It is worth noting the difference observed between vertical (90 mm long) and horizontal walls (130 mm long), particularly in the case of the two combinations with higher porosity levels (Ar 18 L/min + hatching and Ar 30 L/min + hatching) as shown in Table 5. The reason behind this behaviour is the temperature accumulation during the process. Knowing that Argon + hatching with 18 L/min is the one with the highest difference on porosity between horizontal and vertical walls, this condition was studied to determine differences in temperature accumulation. In Figure 16, the mean melt pool temperatures taken with the pyrometer in each layer can be seen, while in Figure 17, the temperatures obtained by thermocouples attached to the base plate in equivalent parts are drawn. A slight peak and higher interlayer temperatures are observed in the temperature taken by thermocouple attached to the substrate in the horizontal wall (Figure 17), especially after the initial six layers, but this effect cannot be captured properly as the hottest point is getting further from the measurement point as the wall is building up and the number of layers increases. This heat accumulation effect in horizontal wall is more evident when looking at melt pool temperature (Figure 16). Whereas for the vertical wall, the average melt pool temperature keeps constant in different layers, for the horizontal one with longer weld beads, the temperature increases constantly after initial layers.
After superficial machining, X-ray analysis was done. Smooth surface makes it easier to identify the internal defects (lack of fusion, pores…) in these walls. Manufactured walls showed no presence of pores greater than 0.3 mm of diameter, lack of fusion, or other internal defects.
Tensile test samples were machined from these radiographed walls to analyse the mechanical properties of the specimens. Samples taken from walls included in Table 5 that showed different porosity levels were tested in as-built condition.
As can be seen in Figure 18 and Table 6, all the specimens had similar mechanical properties, and there was low anisotropy, especially in terms of ultimate tensile strength (<1%) and yield stress (<9%). Greatest anisotropy was found in elongation, 11%, for the case of Argon Q1 shielding gas with 18 L/min flow rate + hatching, which is the case with the greatest porosity. Despite the relatively low number of testing conditions, it seems that hatching deposition strategy tends to give rise to a higher anisotropy in elongation, whereas circling strategy induces a higher variability in yield stress between vertical and horizontal testing directions.
During the tensile test, the stress-strain diagram showed a zigzag form which occurred on every tested sample. According to M. Gierth et al. [4], this is due to the Portevin–Le Chatelier (PLC) effect. It is typical of AlMg(Mn) alloys and depends on the magnesium content. For the alloys with magnesium content above 0.5%, the dynamic strain ageing increases, which makes the magnesium atoms remain in the proximity of the dislocations and blocks their movement, leading to an increase in the yield stress. An example of this effect is shown in Figure 19.

4. Discussion

According to the selected welding parameters, the heat input (HI) value was 72.07 J/mm, which is below 300 J/mm as B. Qi et al. [16] recommended. Another factor taken into account is the WFS/TS ratio, which was kept below 10 as K. F Ayarkwa et al. [14] recommended to avoid the increase of porosity formation in aluminium WAAM parts.
The influence of the shielding gas flow rate on the generation of porosity was not so evident in single weld beads, but it resulted critical in multilayered walls.
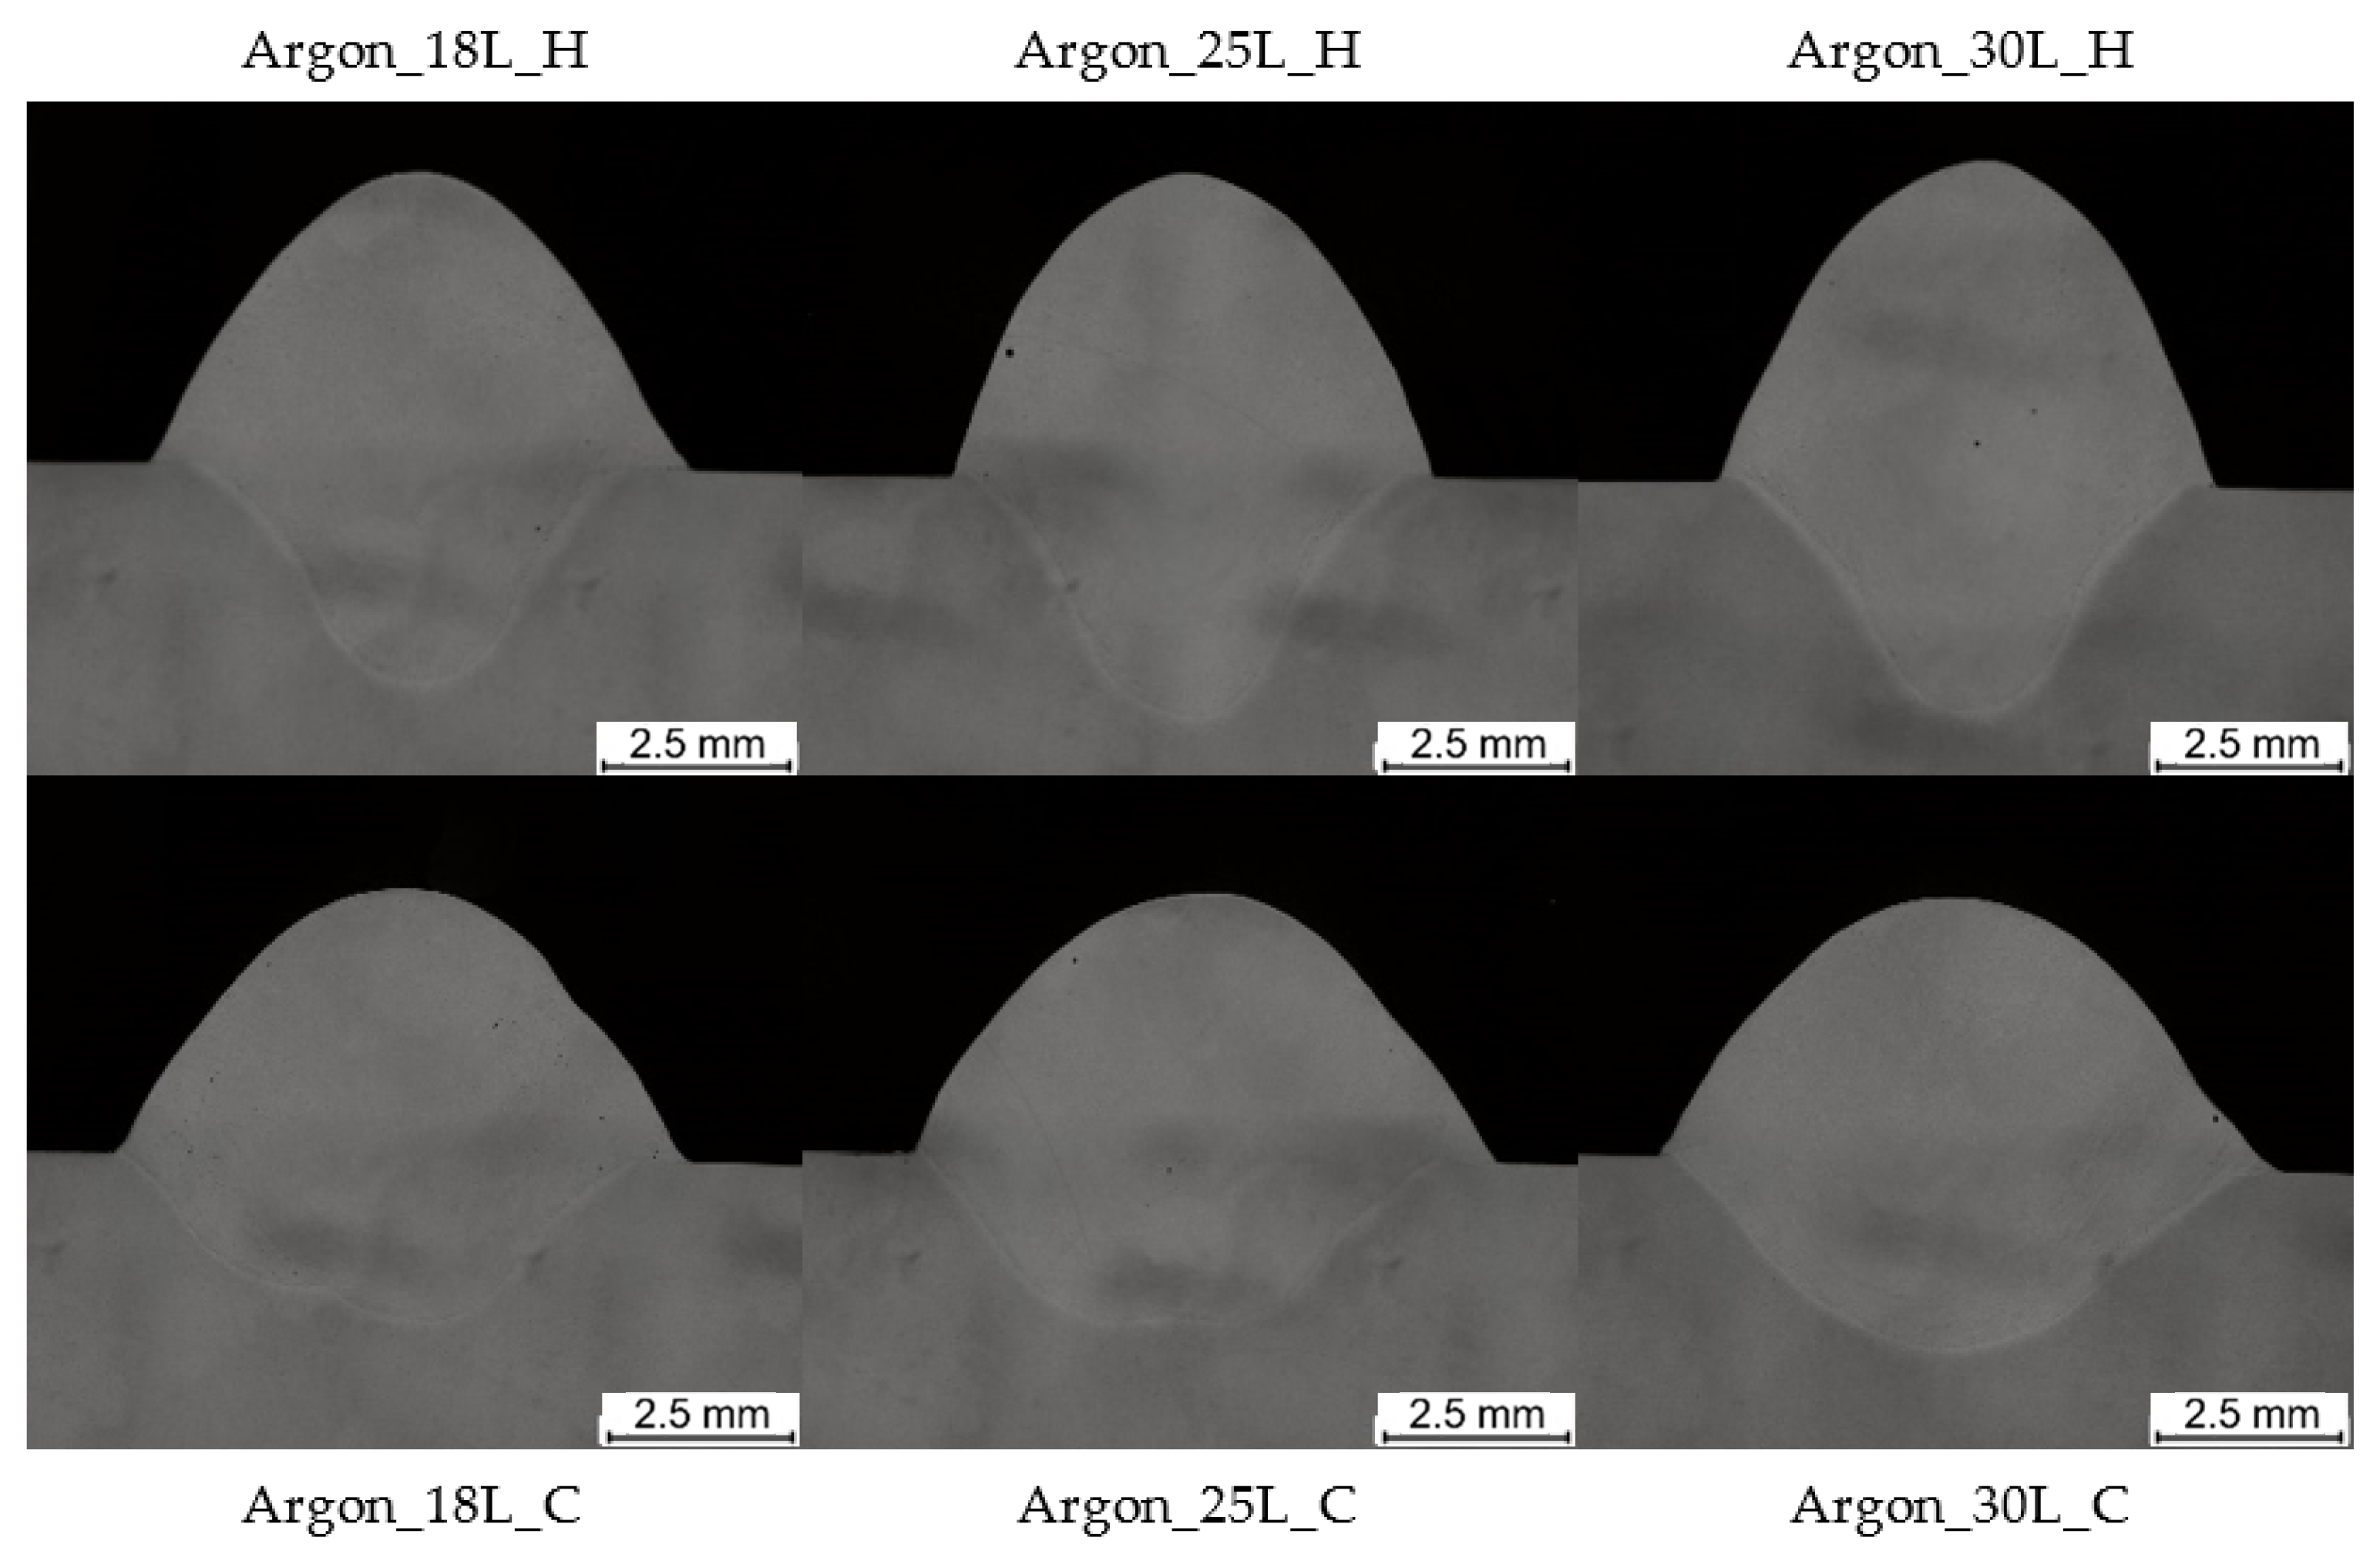
In the case of single-weld-bead deposition, porosity at the edges of the welding were analysed. No accumulation of porosity at the edges was observed, and good wetting and adhesion with the substrate were achieved. Evidence of aligned and continuous oxide layers was not found, meaning that the applied preweld cleaning treatment was effective. The welds were shown to be clean of pores greater than 100 µm in diameter, and pores were randomly distributed throughout all the welding beads, irrespective of the shielding gas and gas flow.
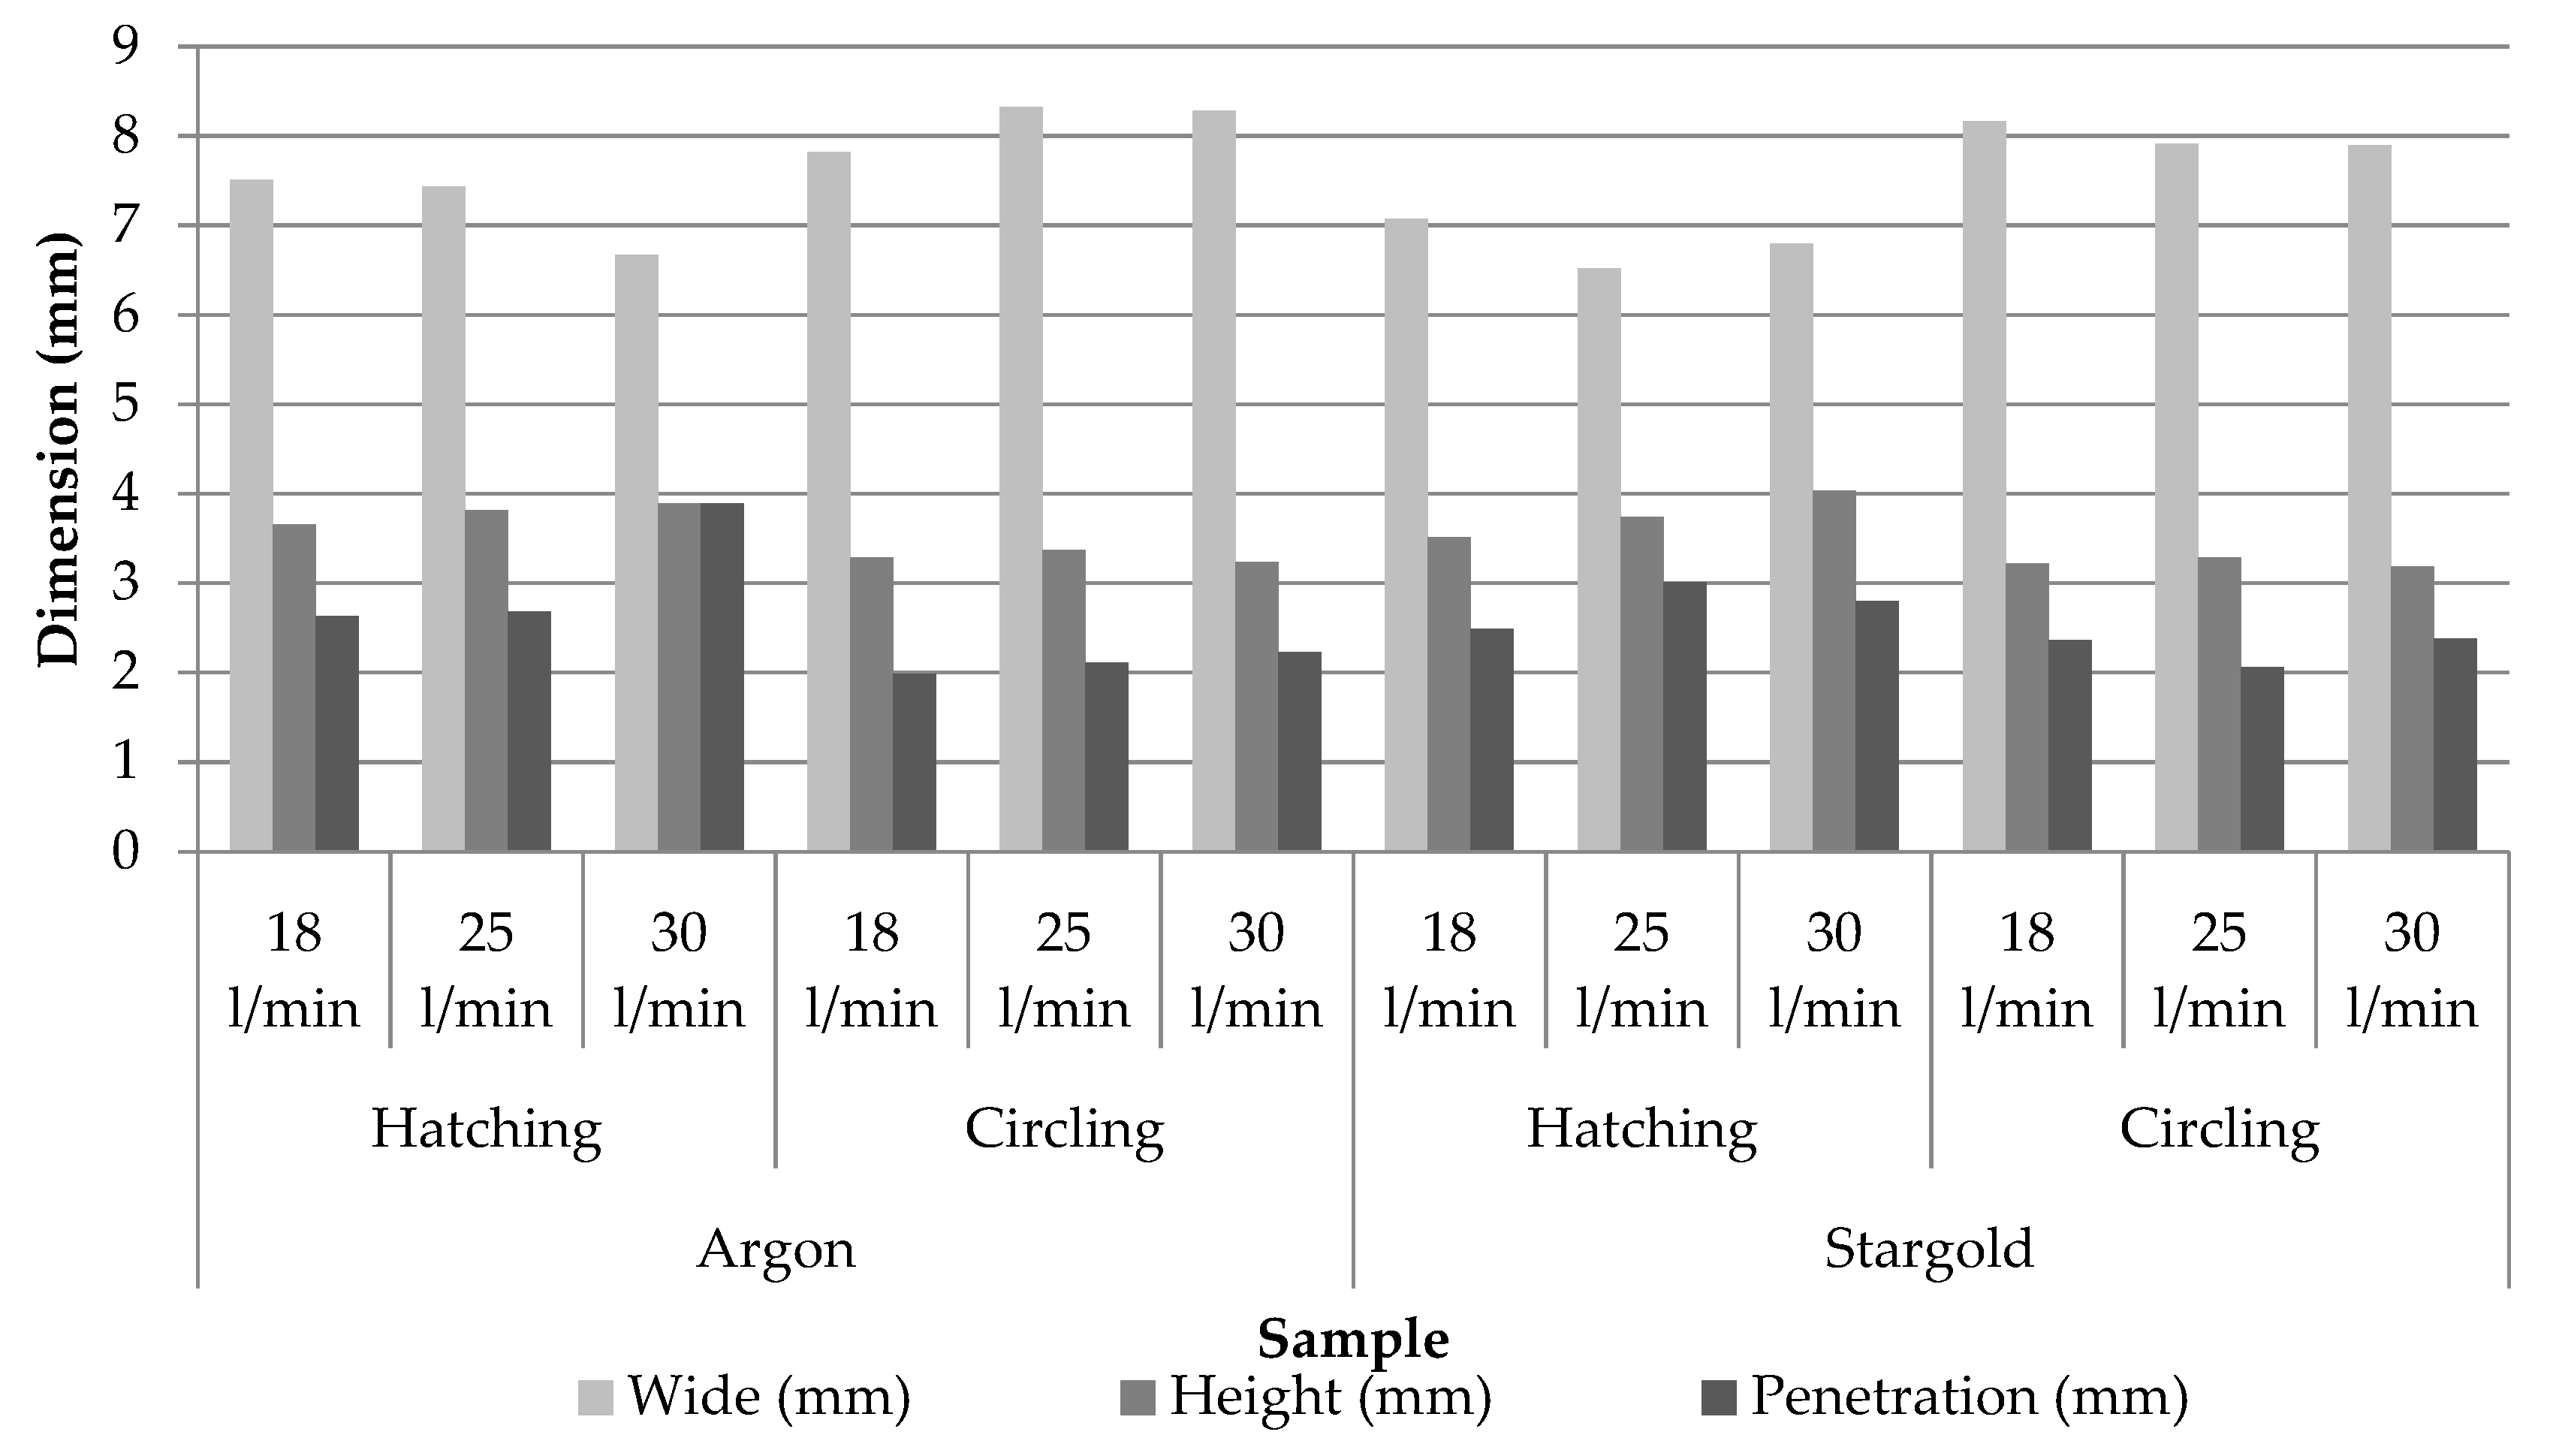
The use of different shielding gas and flow rate did not directly affect welding dimensions, but the deposition strategy clearly changed its dimensions. Circling generated wider beads but less penetration and height than hatching.
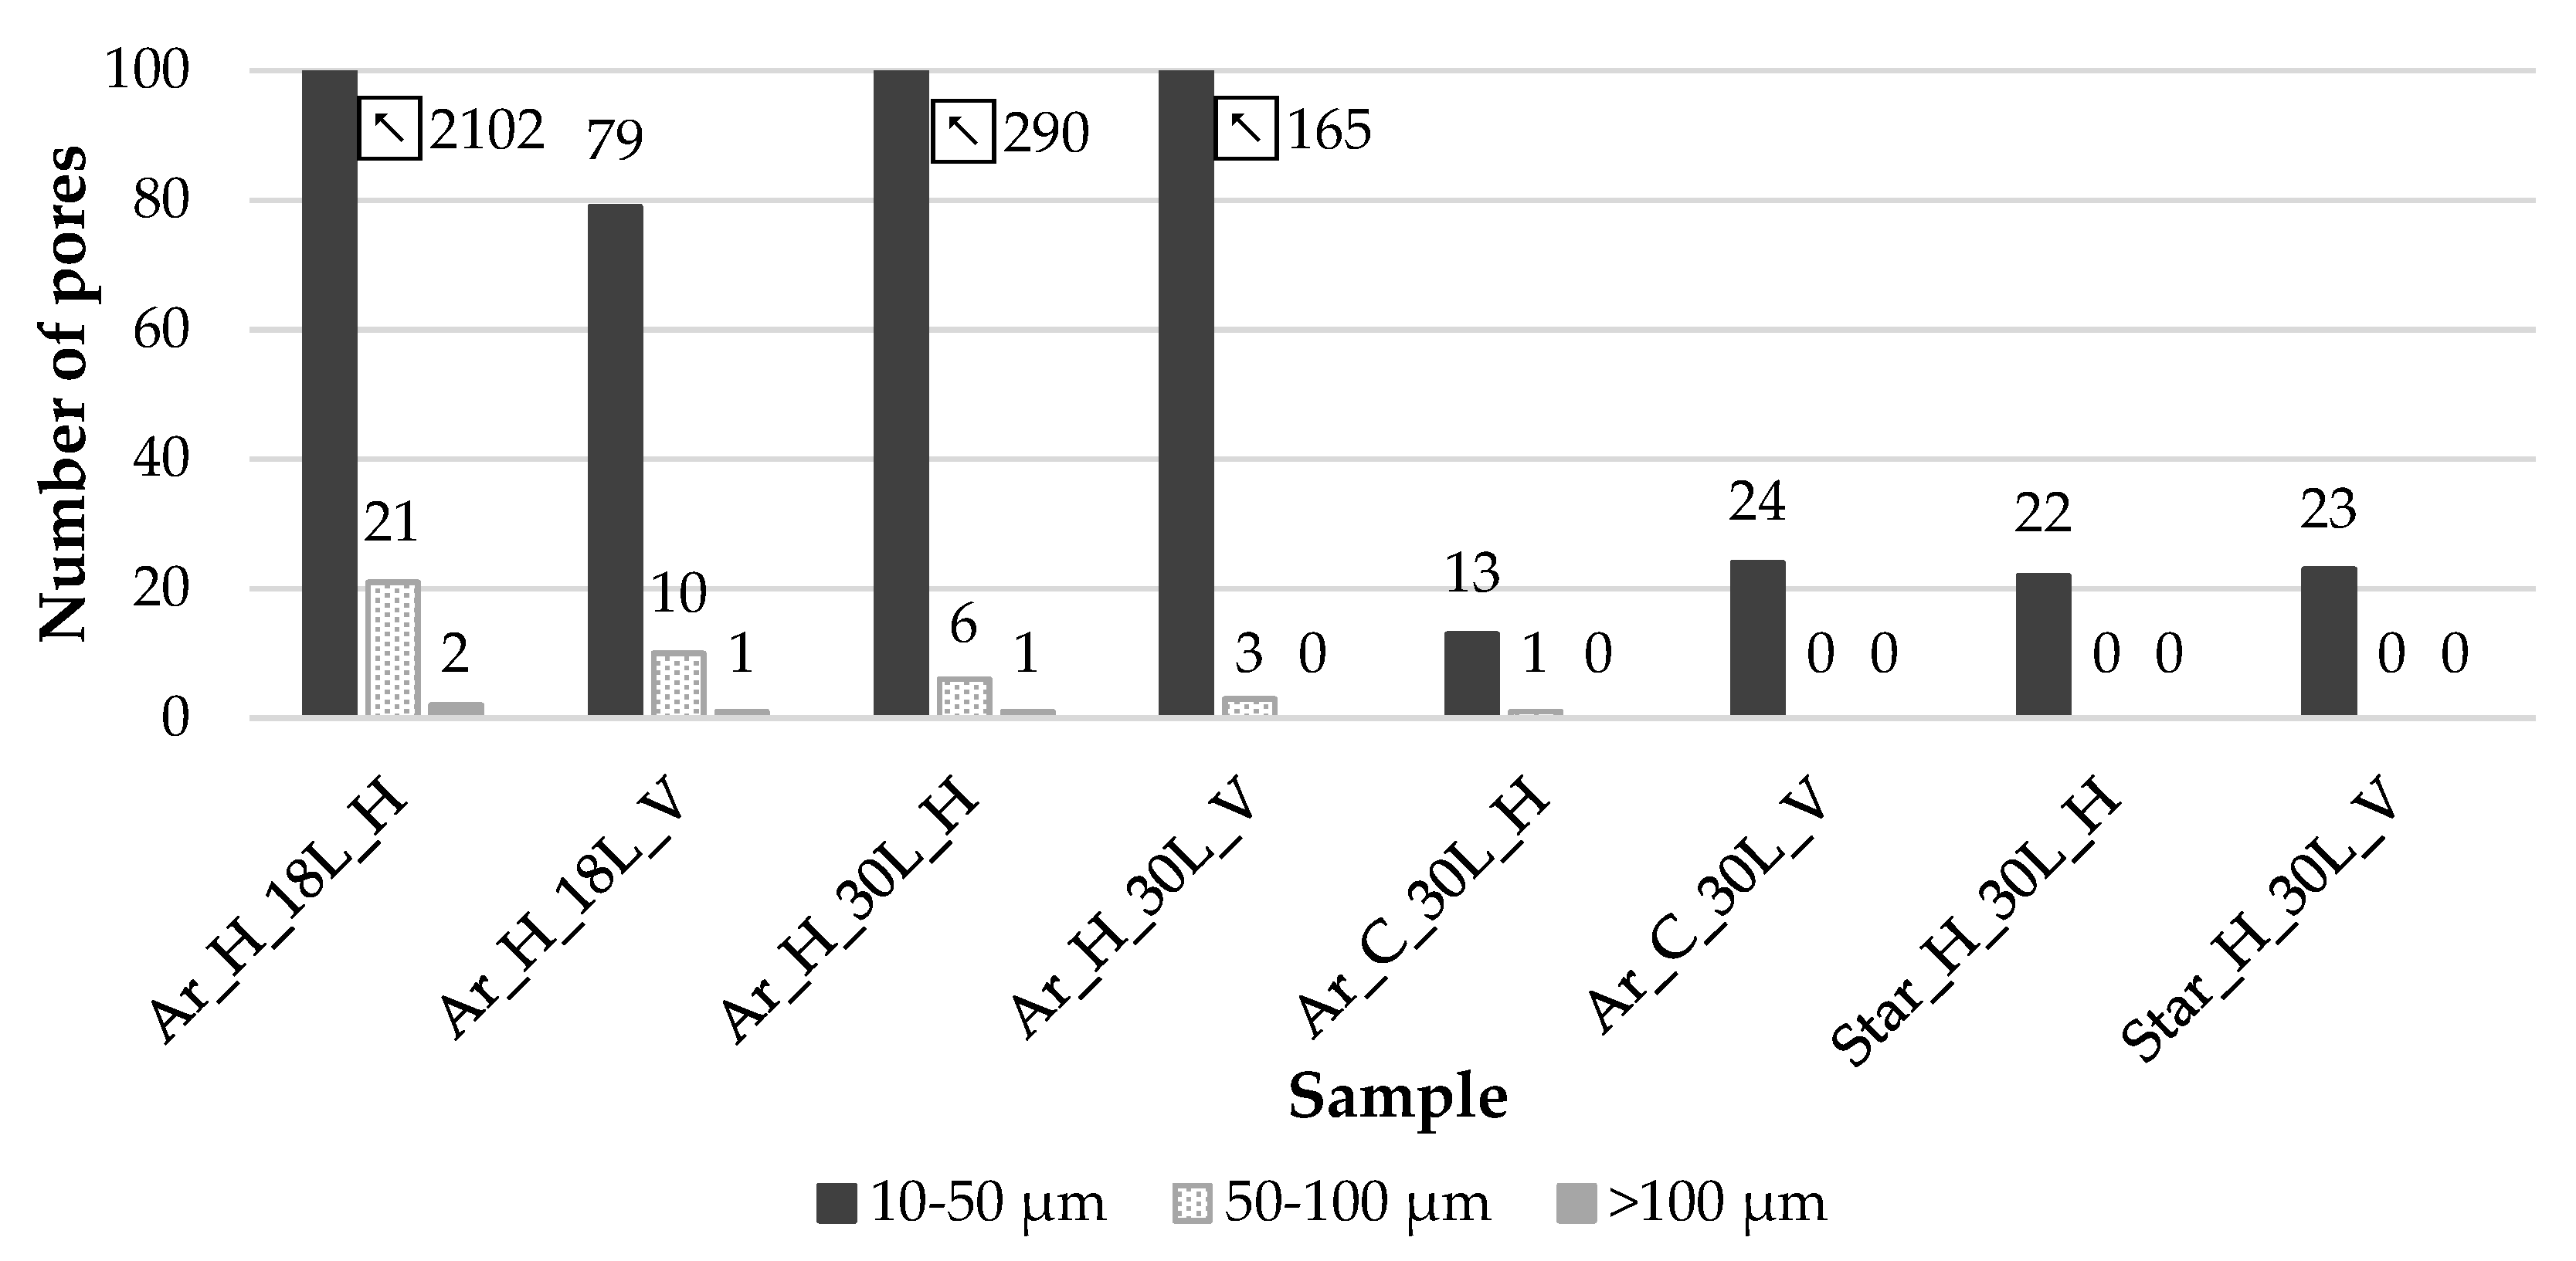
Qualitative differences multilayer walls with beneficial impact of Stargold® when using hatching and the need of increasing gas flow rate to 30 L/min for Ar and circling combination were determined.
According to current results, using high gas flow rates close to 30 L/min contributes to effectively reducing porosity and maximum pore size, being the best conditions the combination of Ar + circling and Stargold® + hatching.
Circling deposition strategy was demonstrated to be a very stable building condition, ensuring a flat and even layer height and reduction of humping. Hatching, on the other hand, required a sequential reduction of welding parameters in the initial four layers to avoid necking in the initial layers due to enhanced heat sinking through the base plate and due to the relatively lower temperature generated during the welding process.
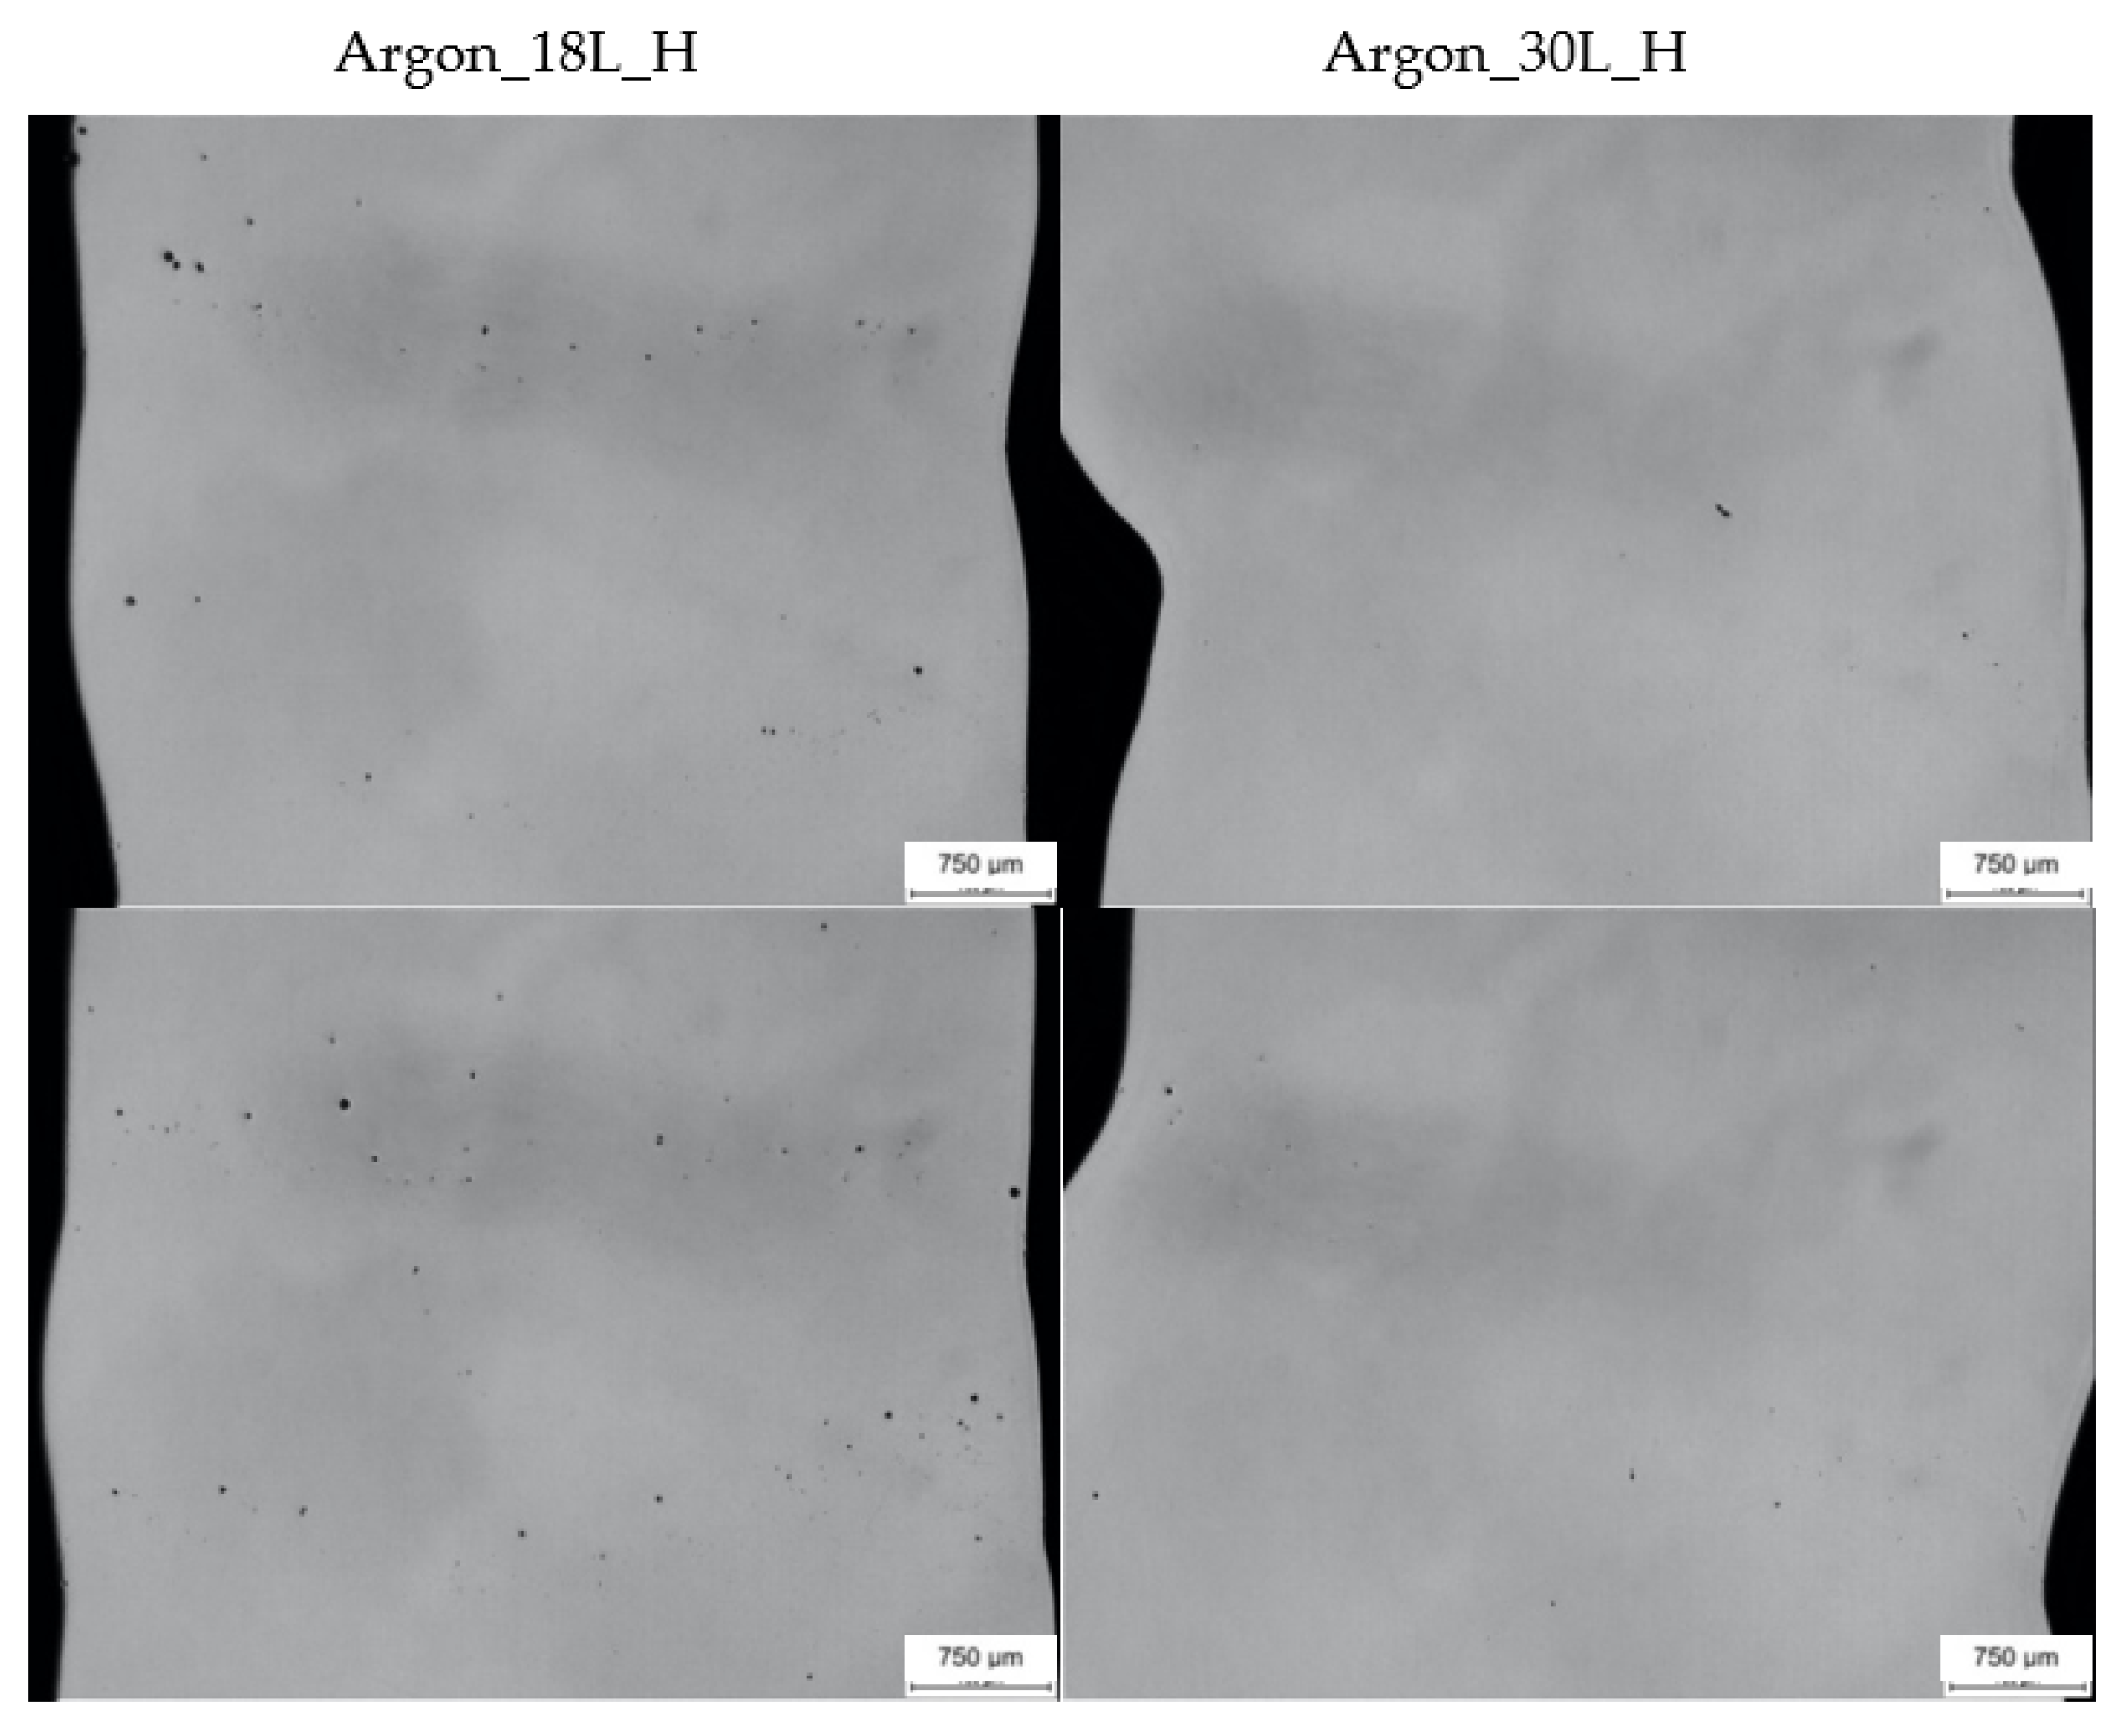
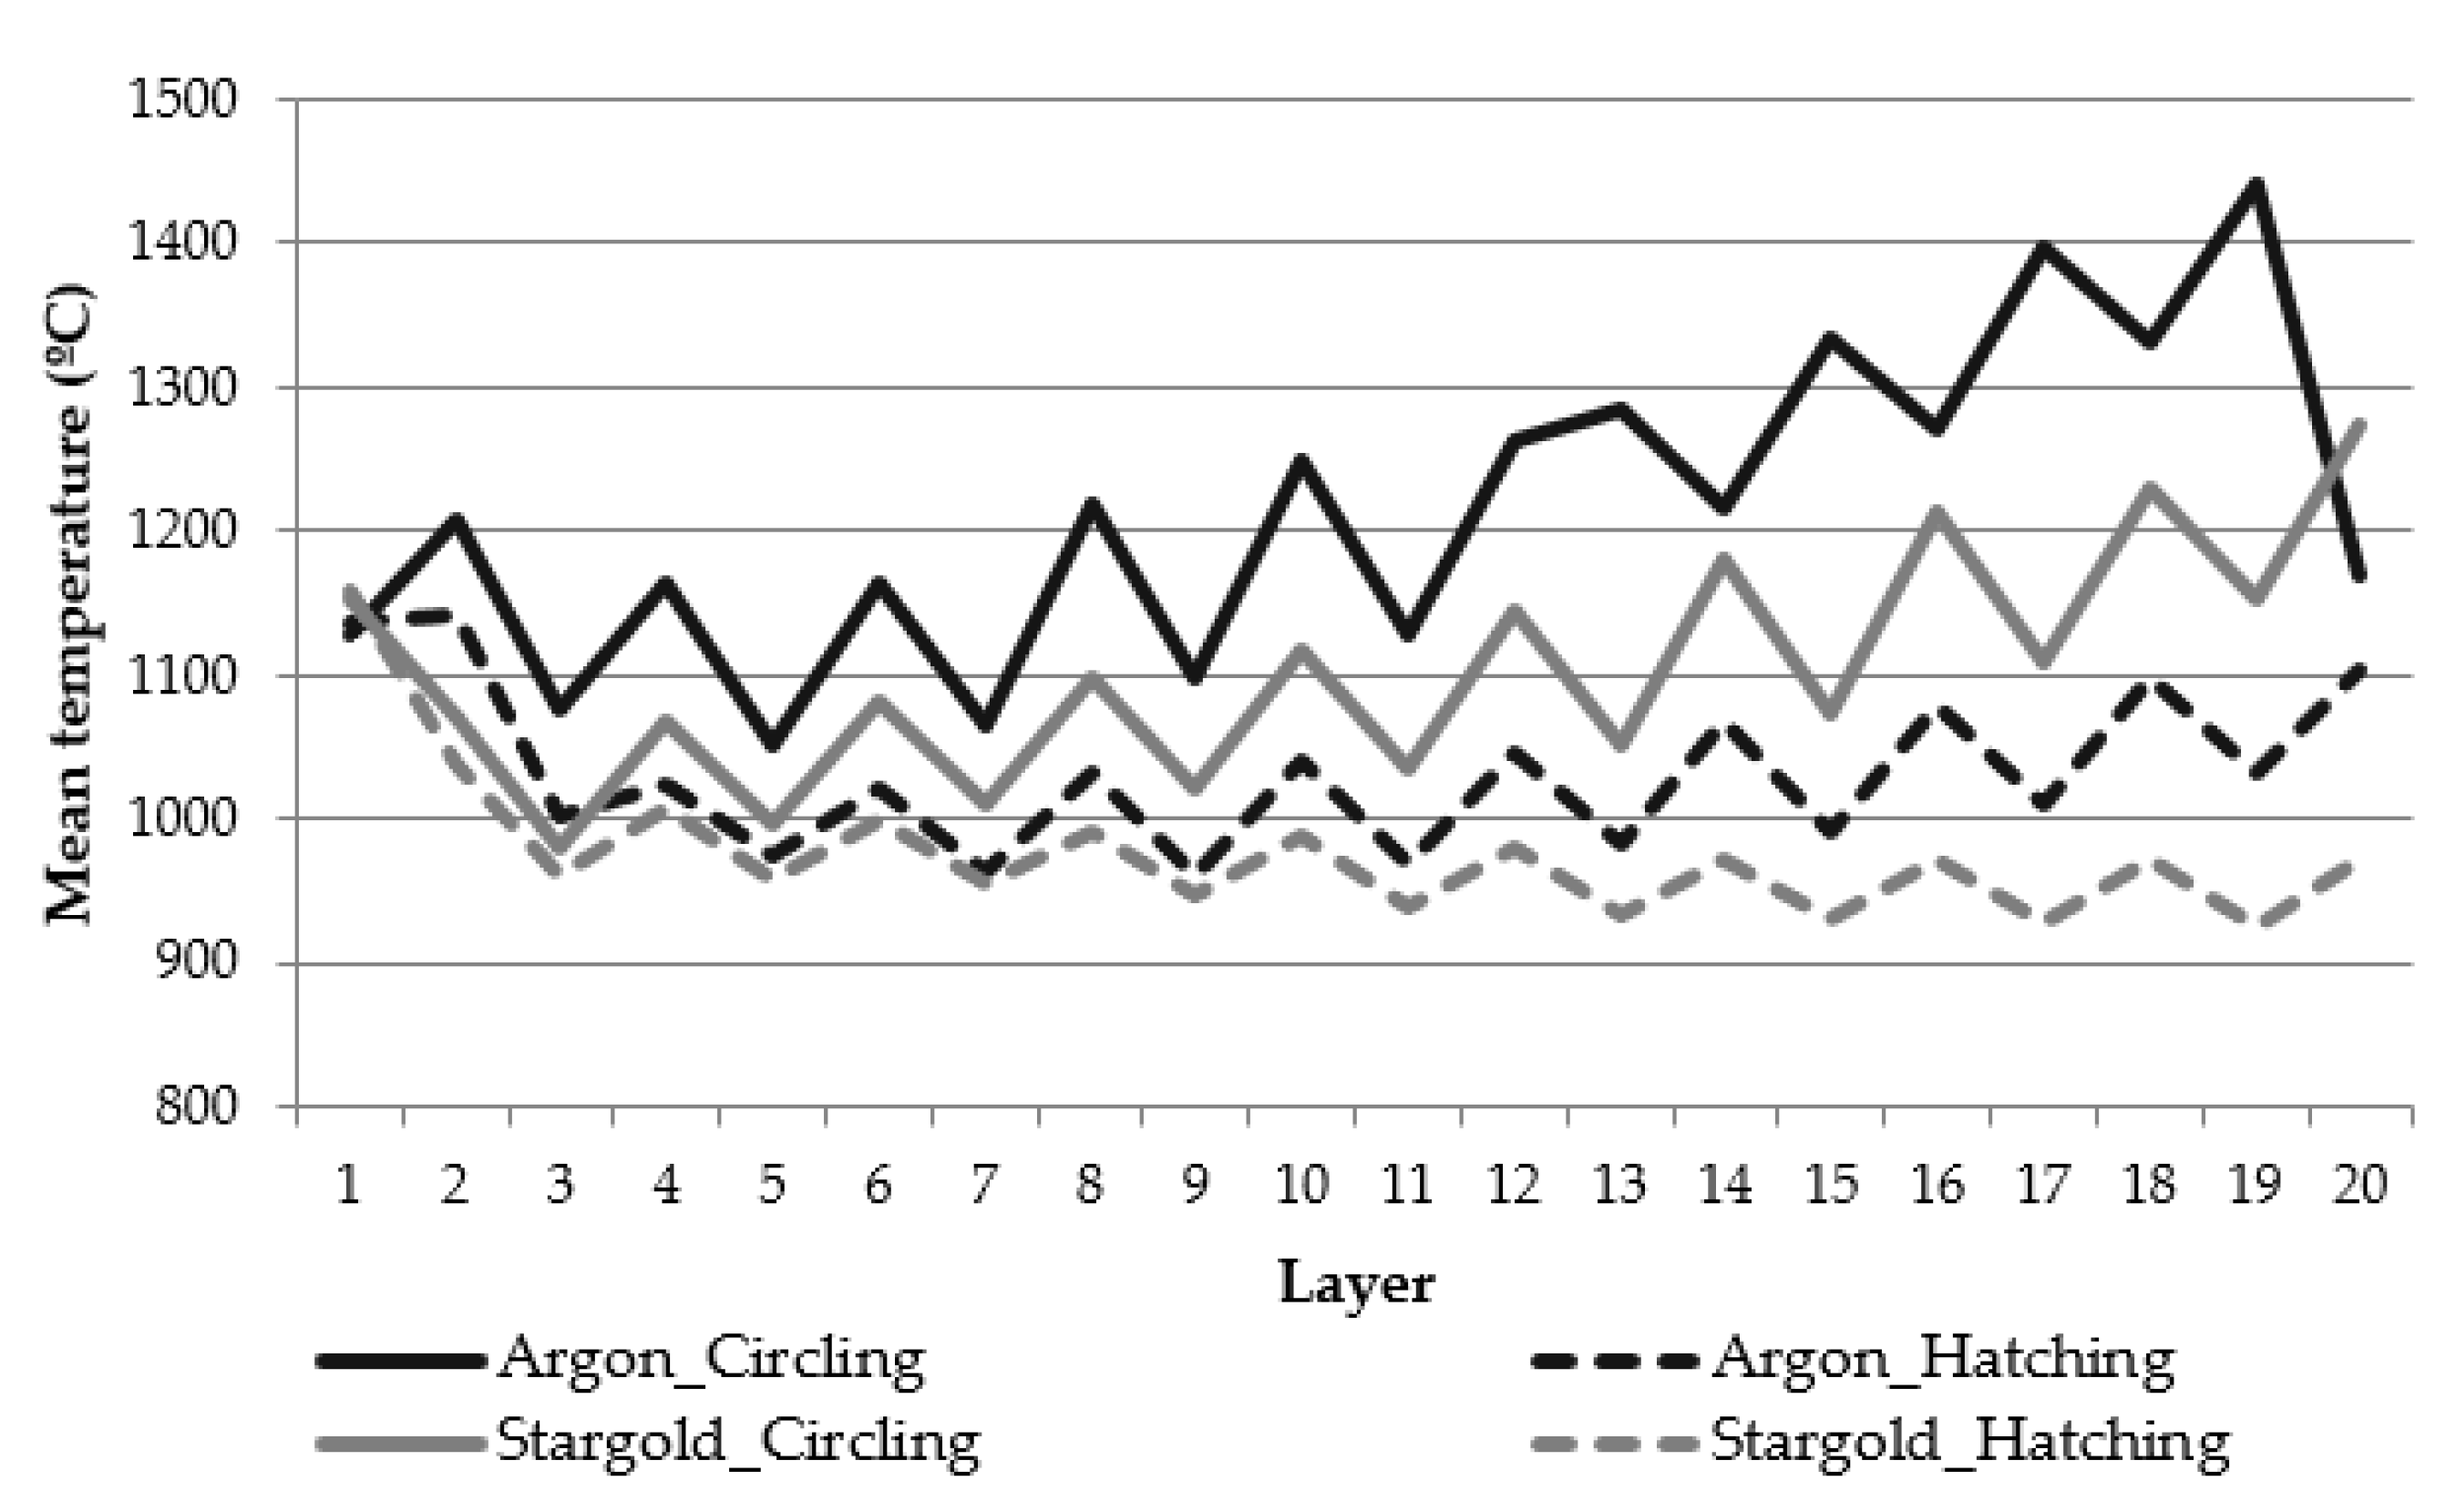
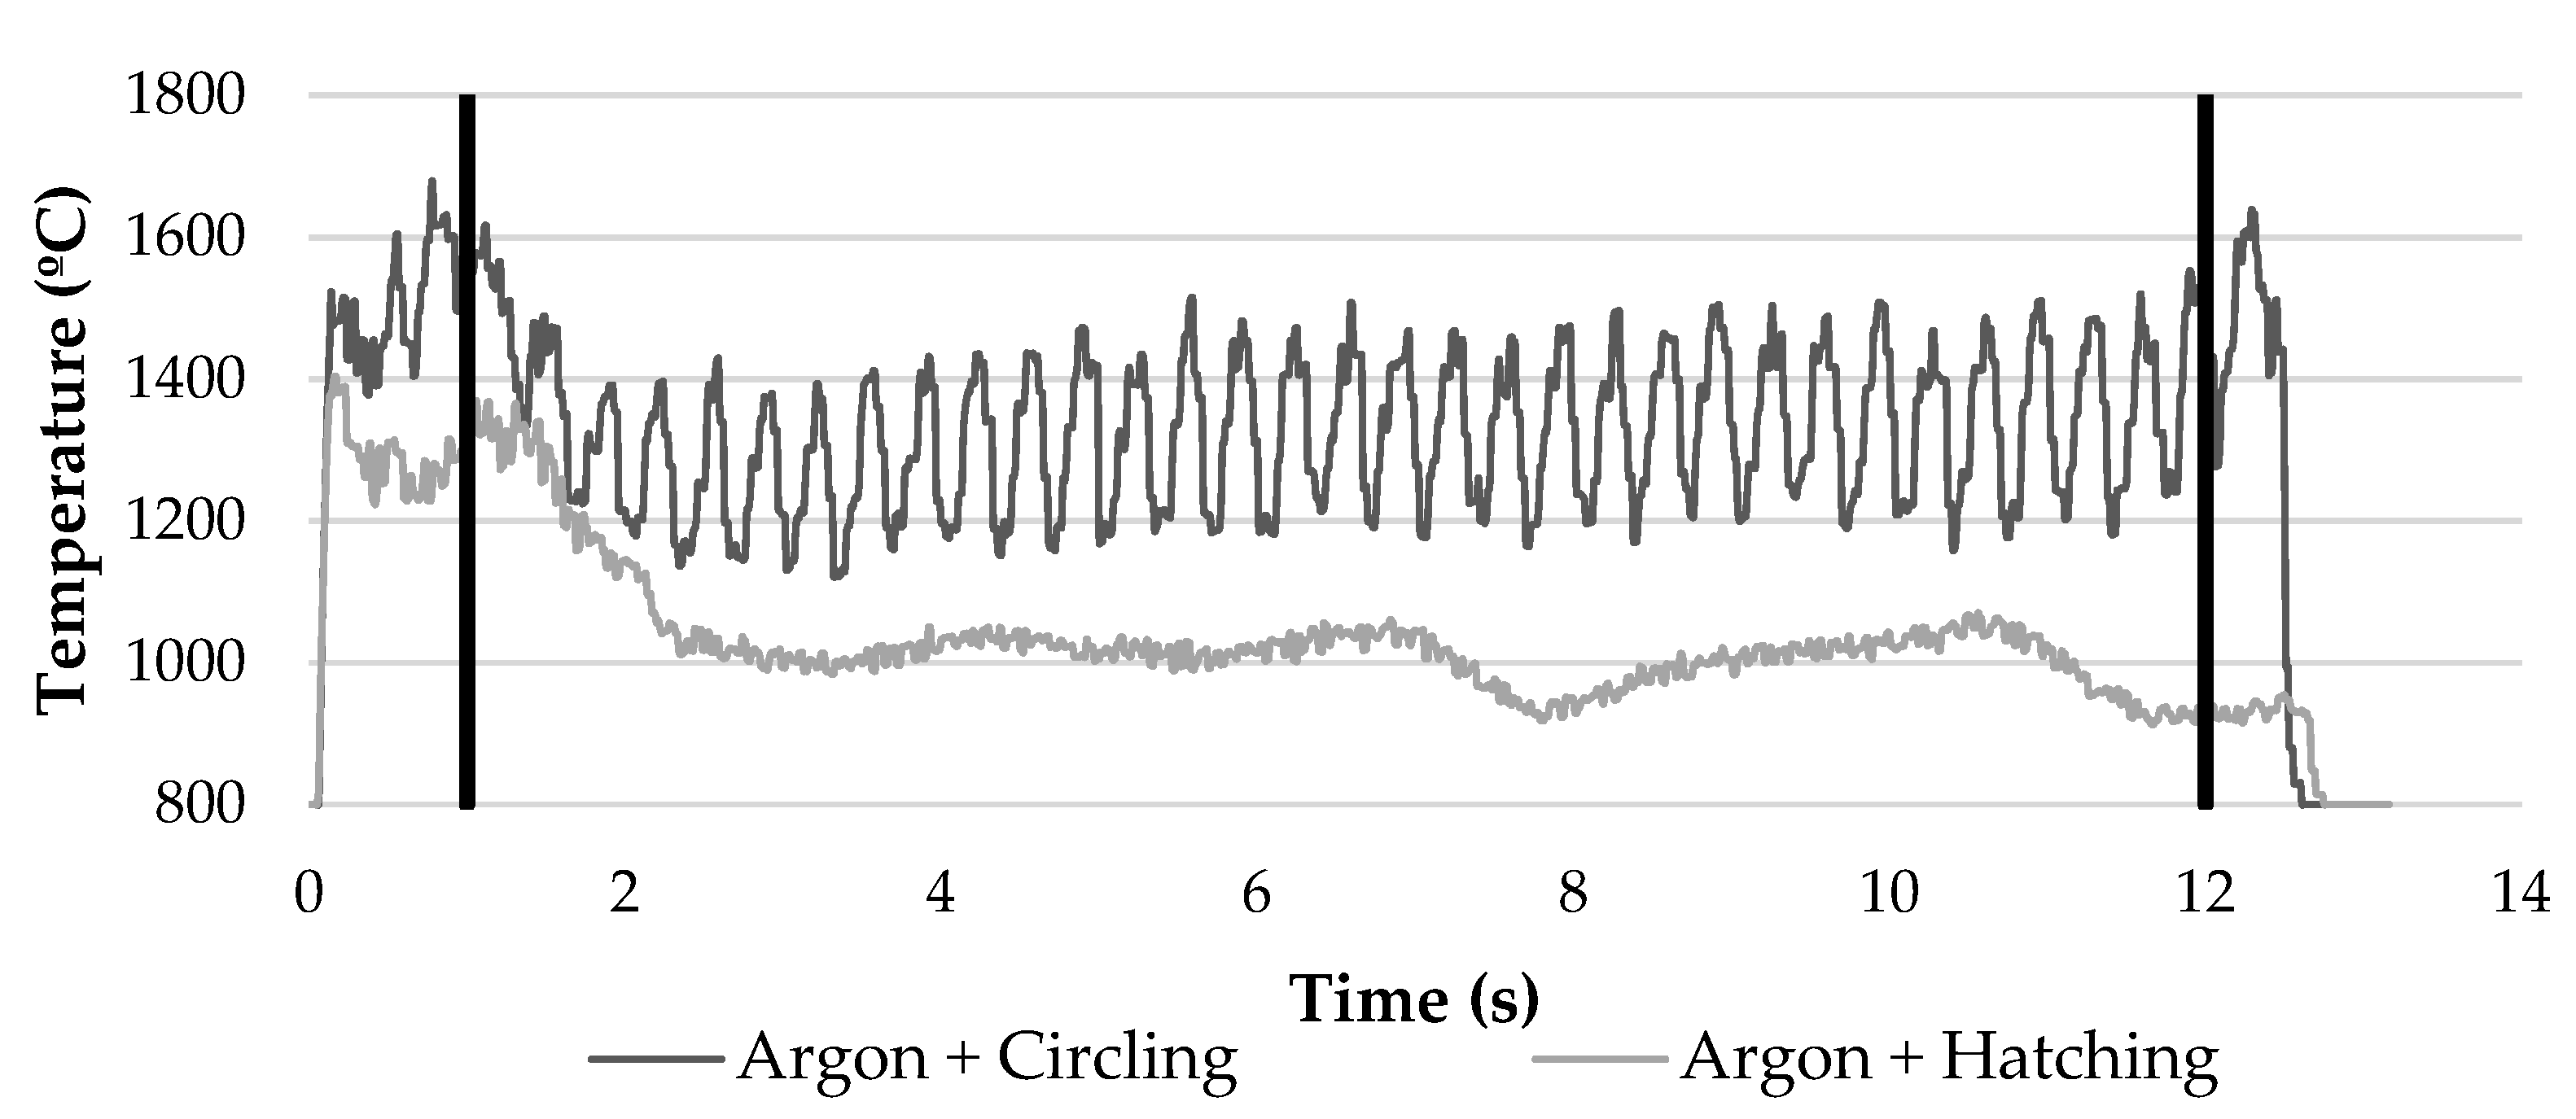
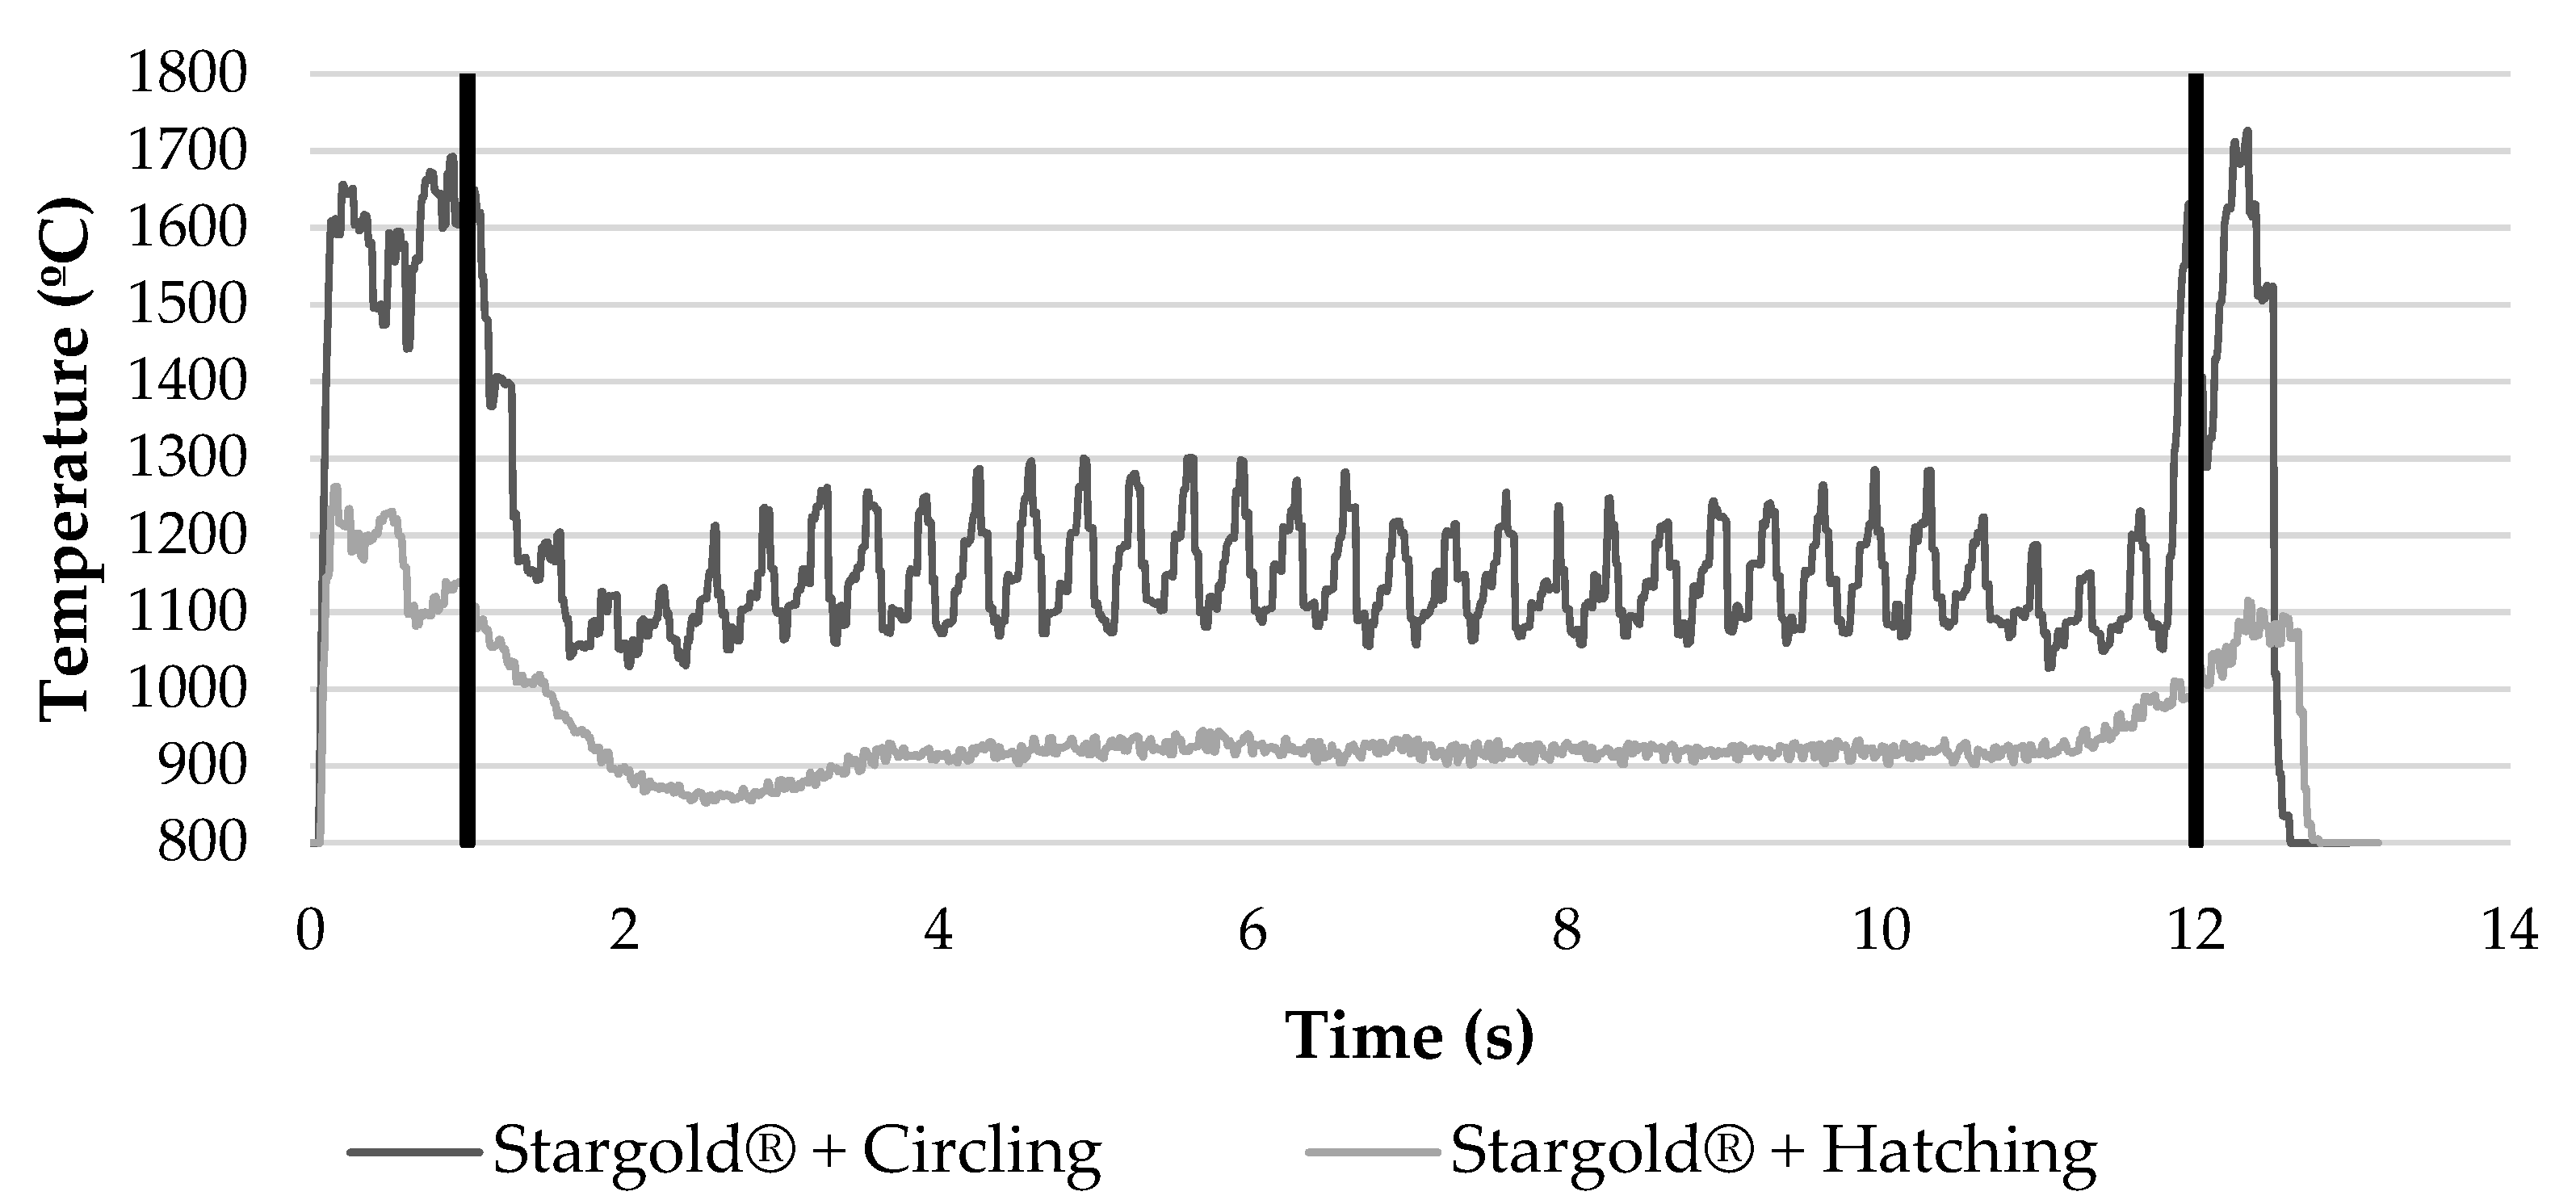
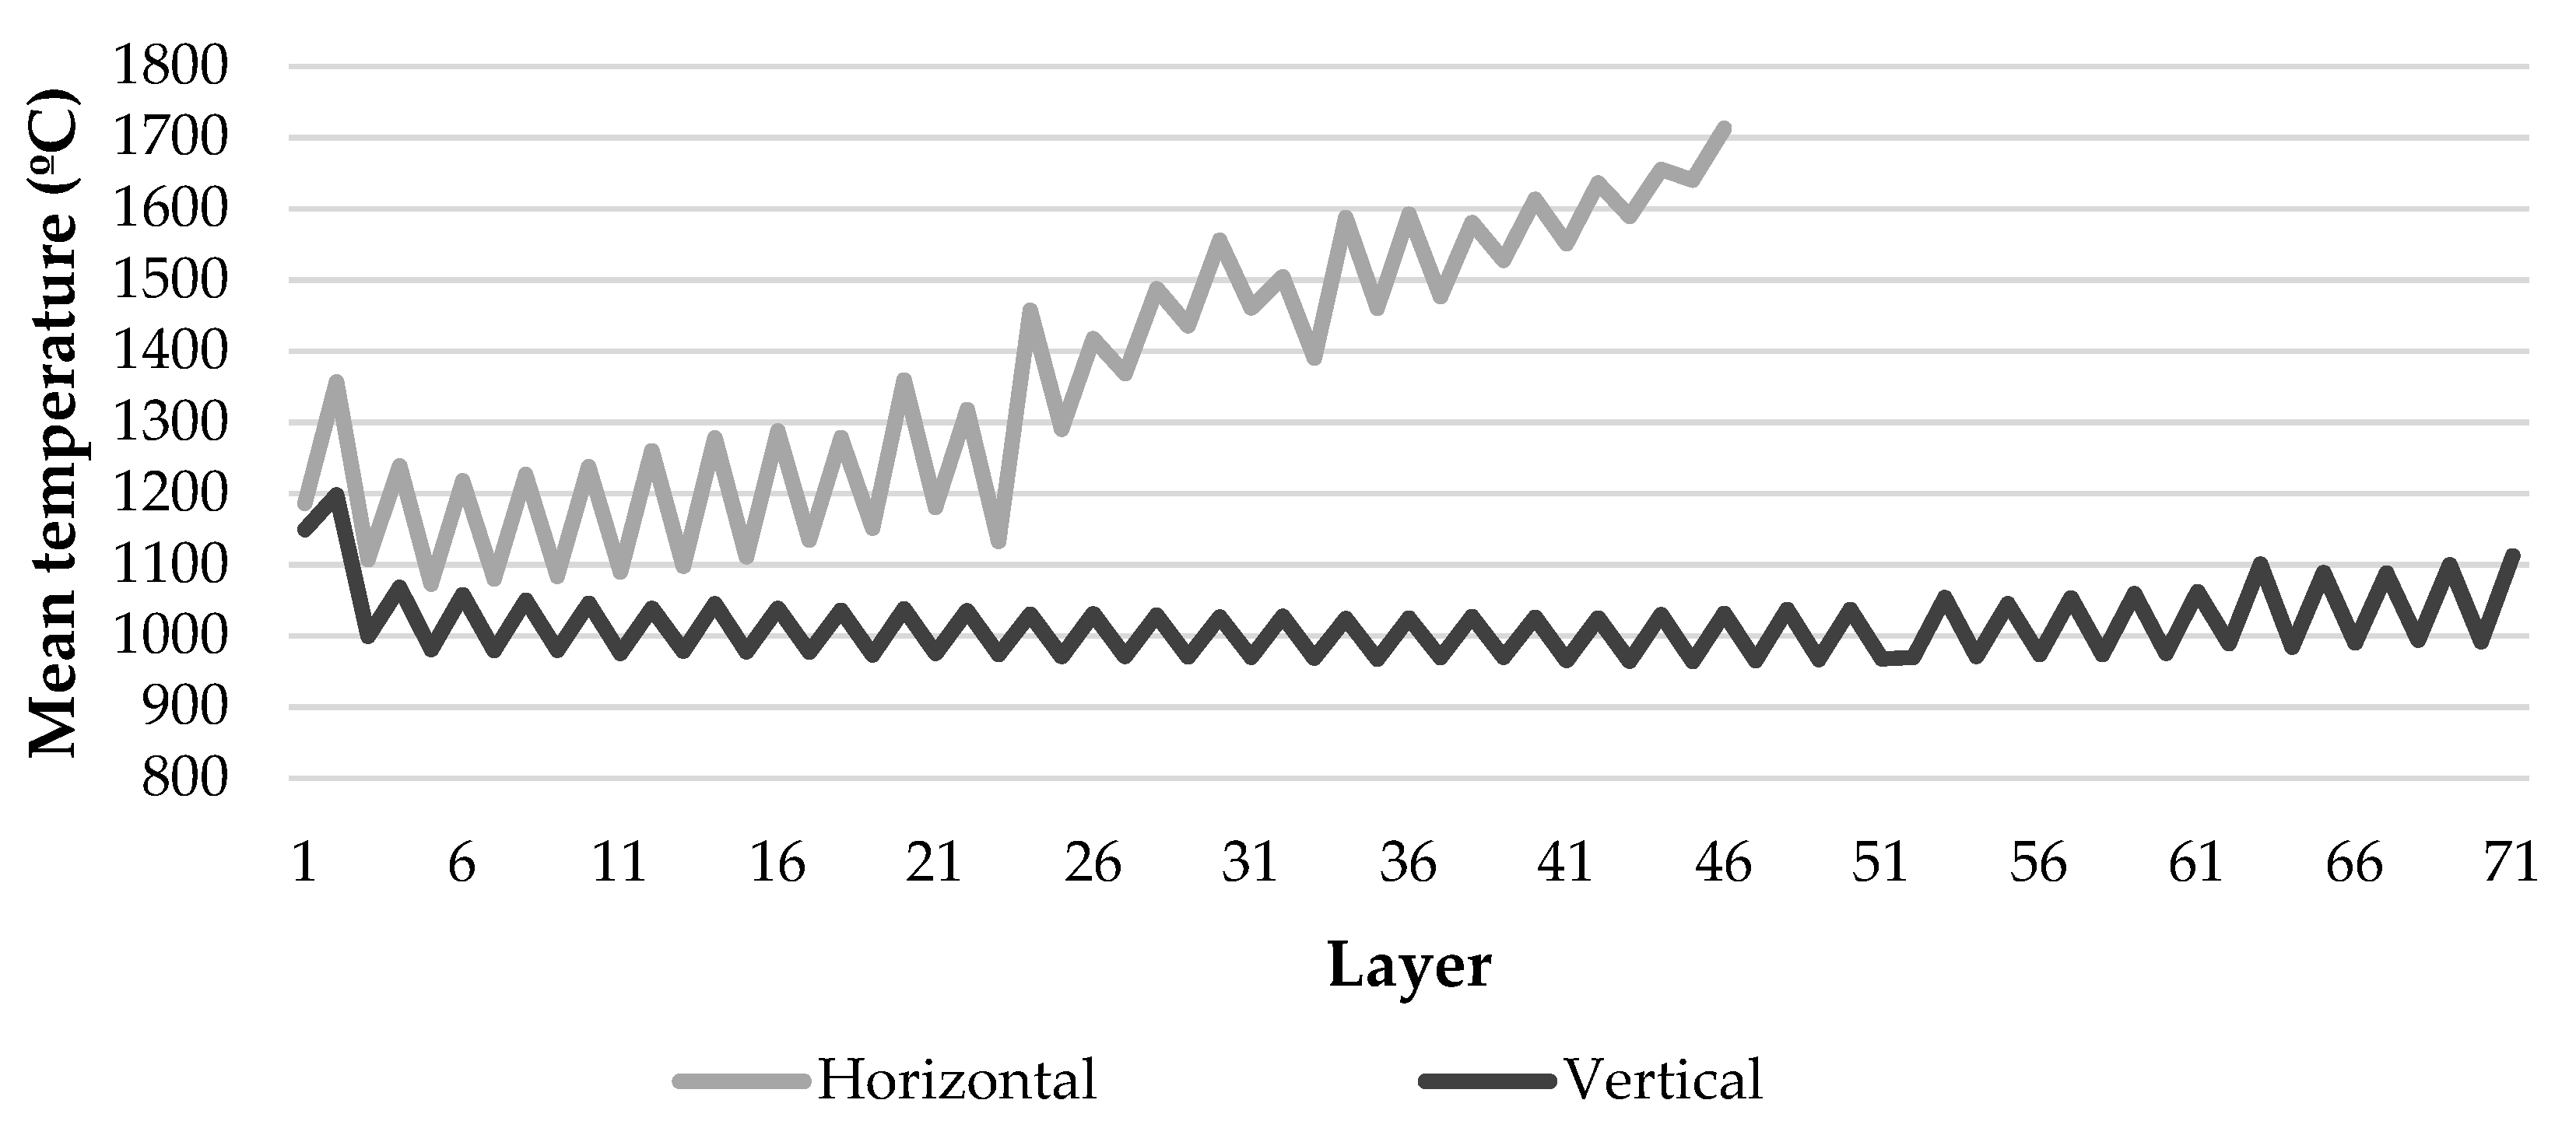
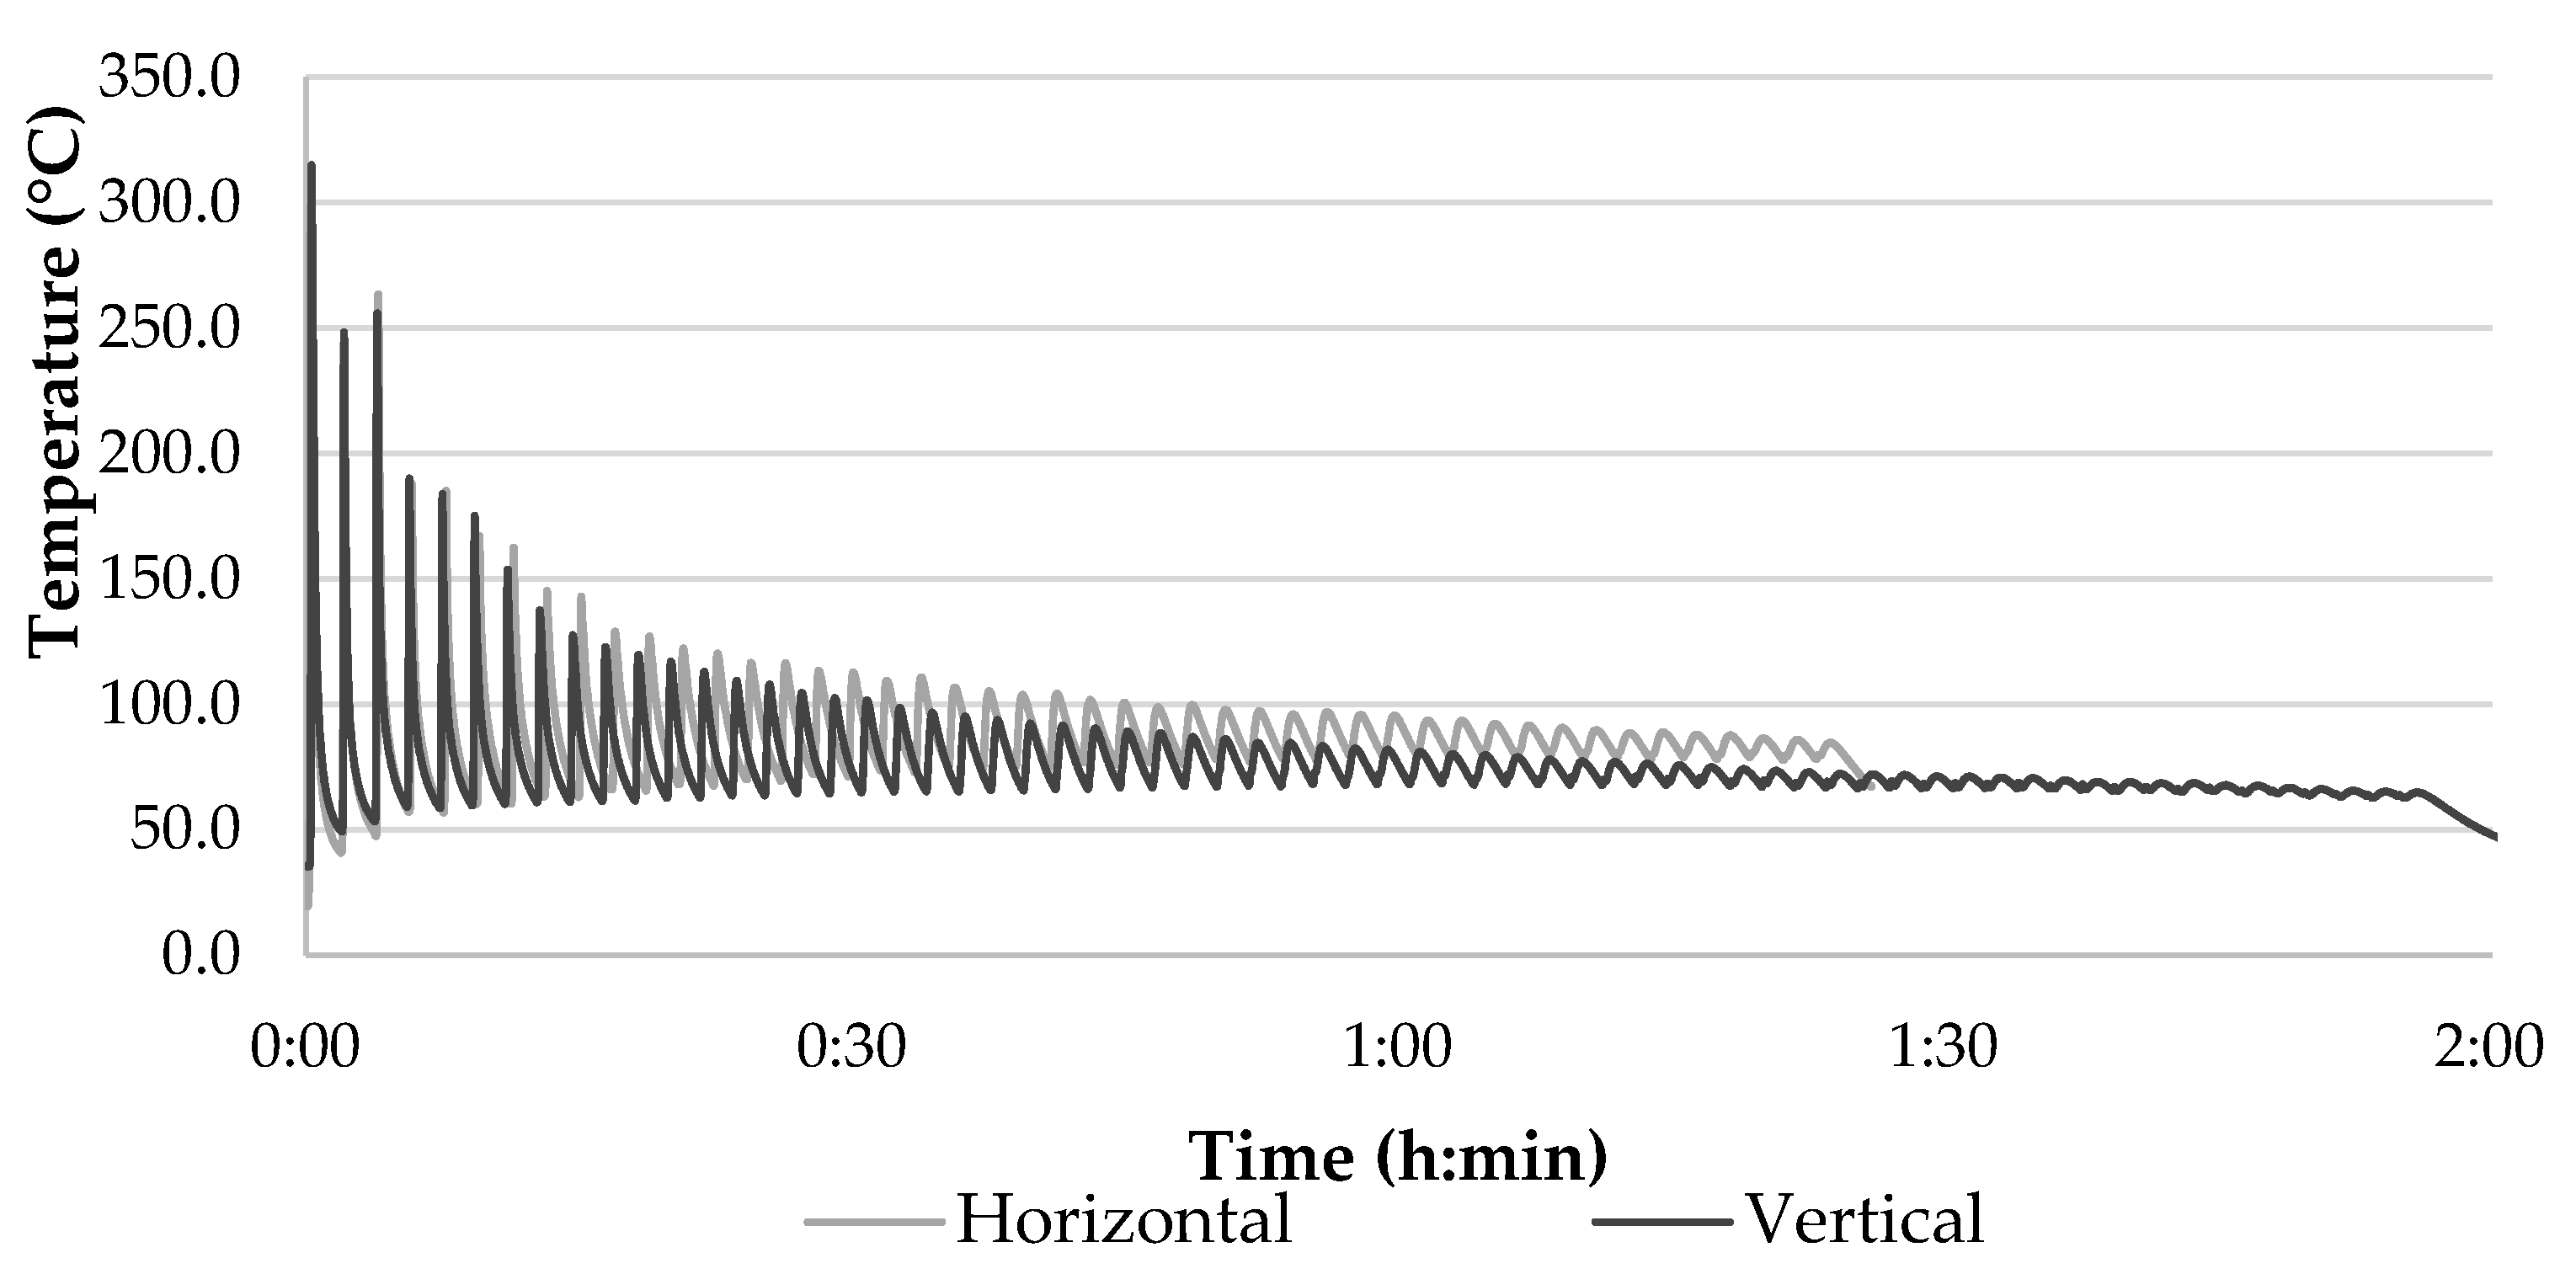
It has to be noted, that in the parts manufactured to test mechanical properties, there was a difference in porosity area percentage between the different geometries: horizontal and vertical. The one with the most notable effect was the 18 L/min gas flow rate of Argon Q1 and hatching deposition strategy. The increasing temperature accumulation described in Figure 16 for the horizontal geometry leading to an increase of the melt pool size and a lack of proper shielding from the atmosphere before solidification can explain this behaviour. For the higher shielding gas flow rates, the enhancement of the porosity in longitudinal walls was avoided due to the better shielding conditions provided through the torch.
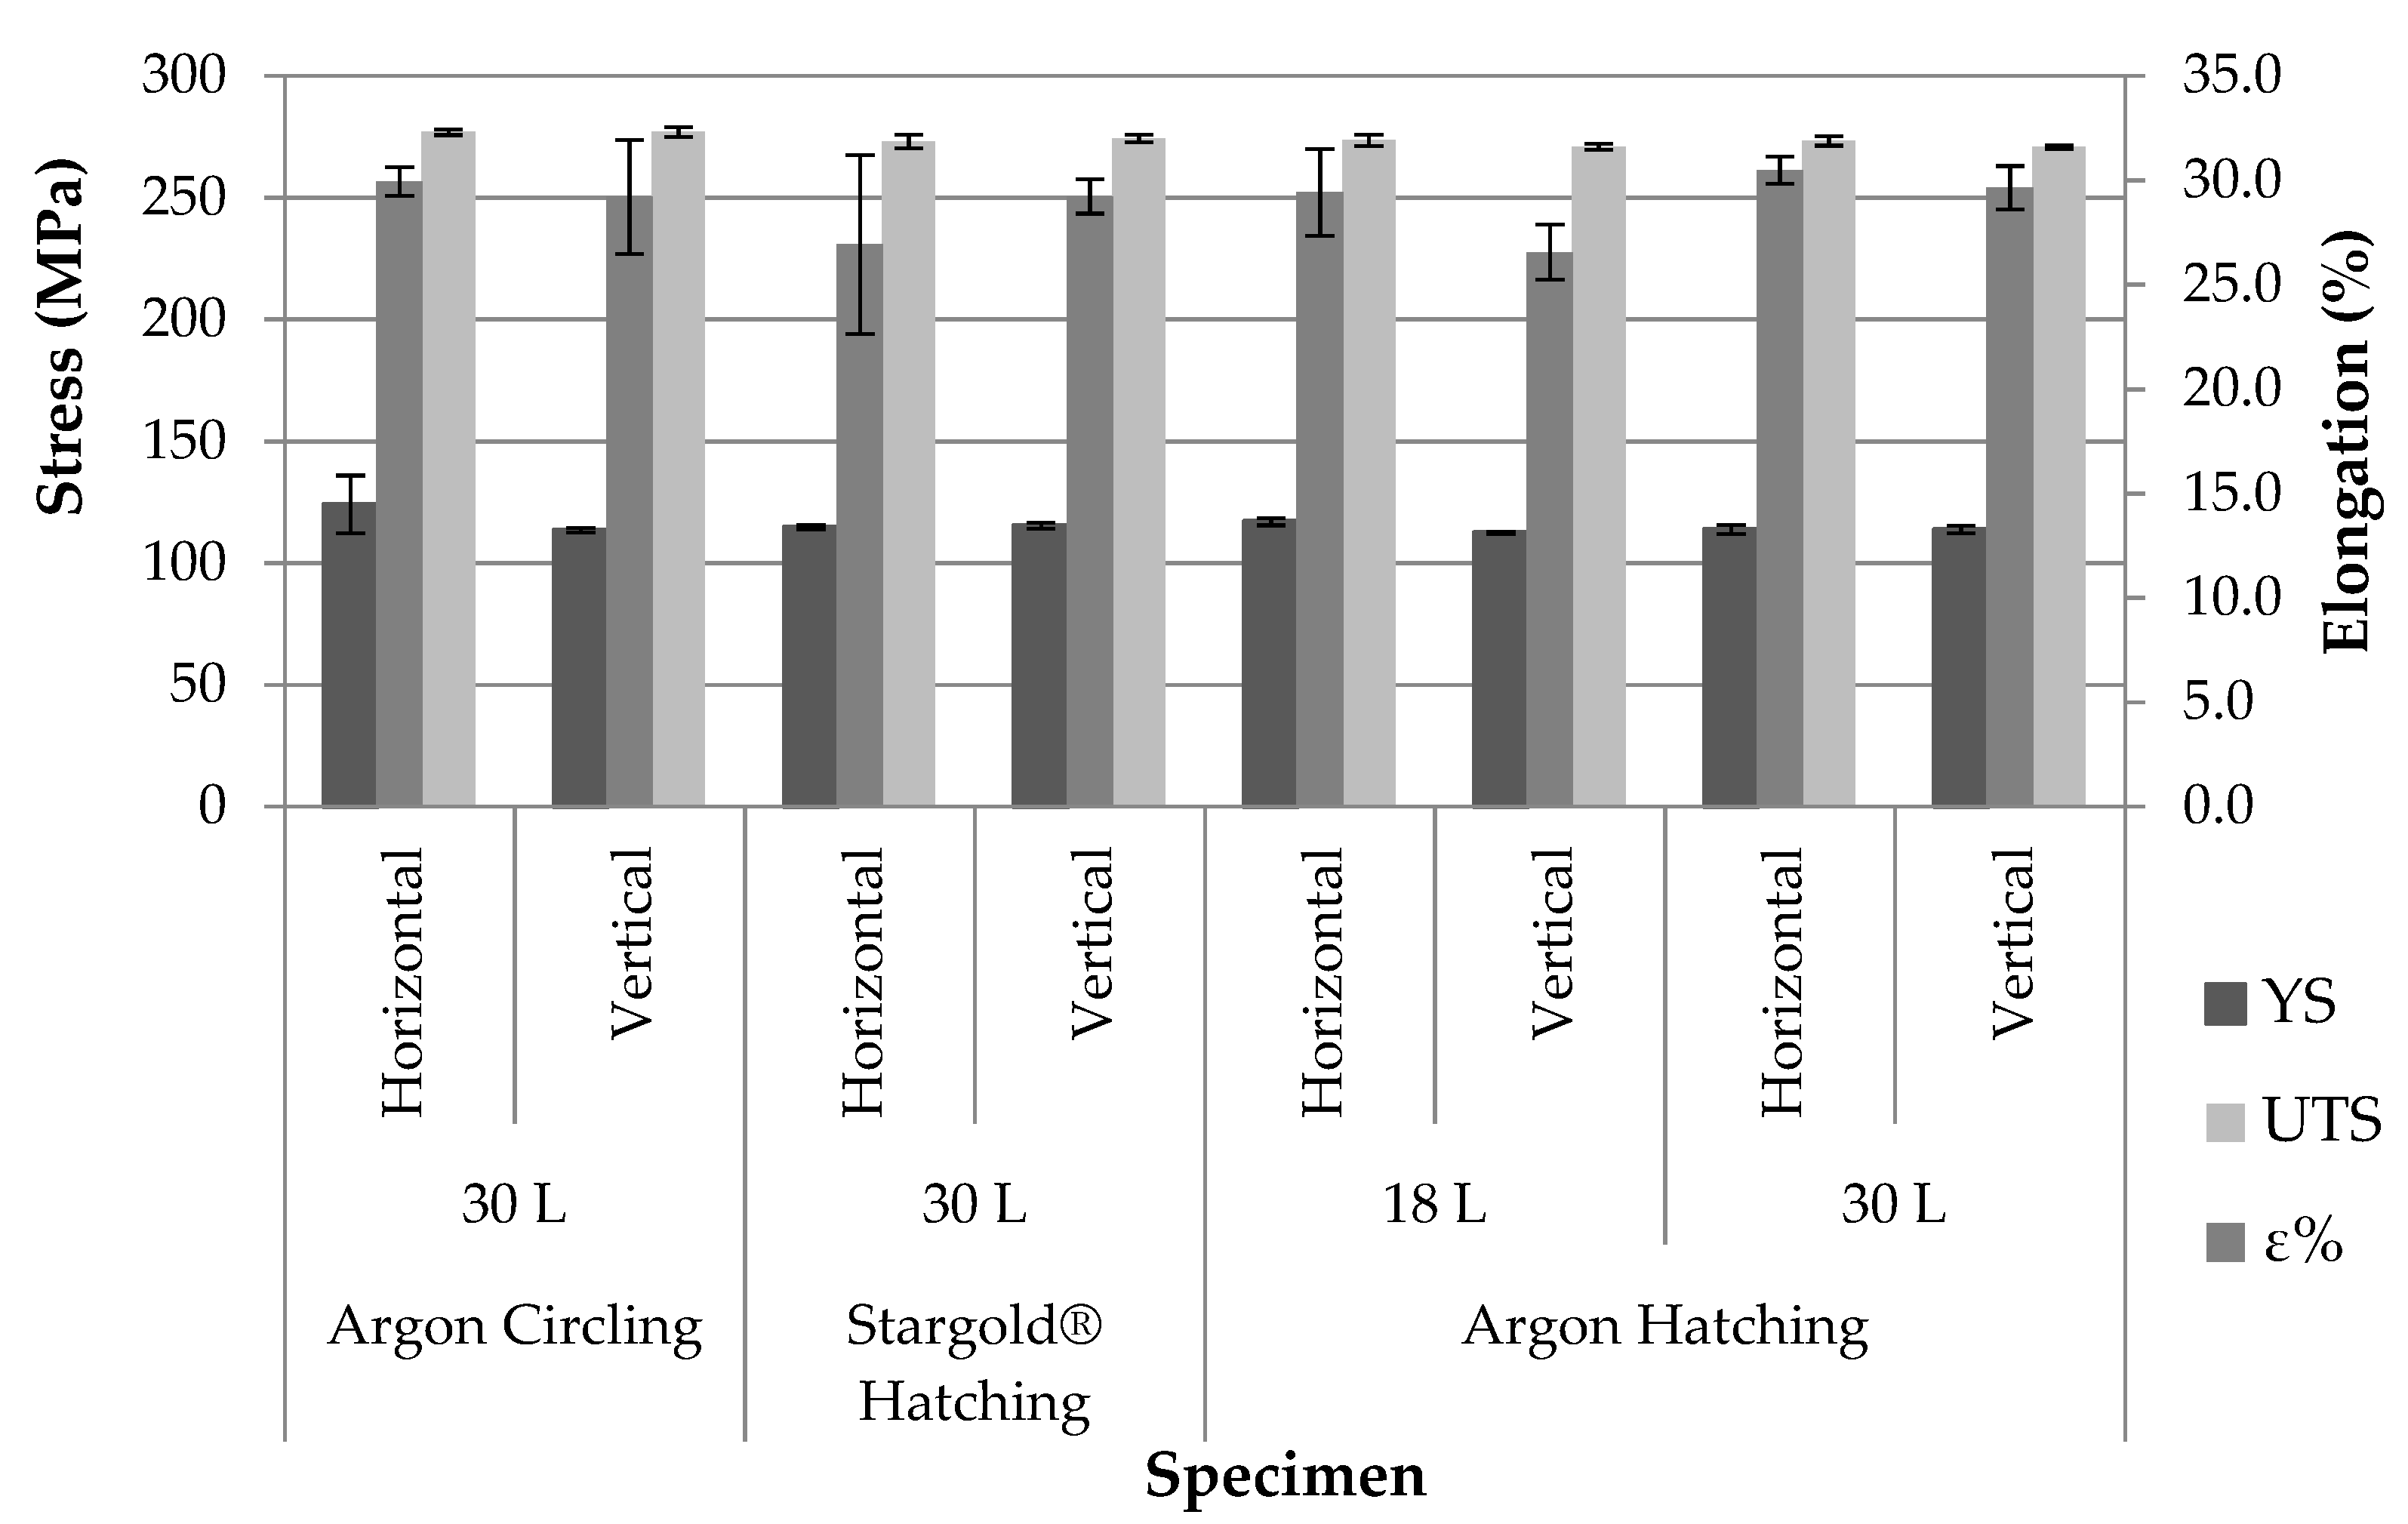
Despite the different levels of porosity in the WAAM walls manufactured to test the mechanical properties, there was a minor influence on the final yield stress, ultimate tensile strength, and elongation of the specimens. In addition, the randomly distributed pores which are not aligned or grouped in interlayer boundaries and the equiaxed grains led to a reduced anisotropy below 11%.
In previously reported works by Köhler et al. [18] and Zhao et al. [19], anisotropy was very high in WAAM parts with AA5356. Elongation and ultimate tensile strength were lower in the vertical direction. This was due to the un-uniformly distributed wall chemical composition and dendritic microstructure with elongated grains along building direction. The poor mechanical properties in vertical direction were associated to the likeliness of having weaker areas in the interlayer region, while in the horizontal direction the dendritic structure was intact, and the growth was continuous. The difference between these two papers and the results obtained in this study rely on the welding parameters. Zhao et al. [19] analysed the arc penetration and observed that the three previously deposited layers were re-melted, changing their microstructure. The repetitively re-melting process increased the solubility of alloying element in the aluminium matrix, and as these elements gradually dissolved in the matrix, the fusion line show a bright stripe-like band, that made the composition un-uniformly distributed in the longitudinal direction.
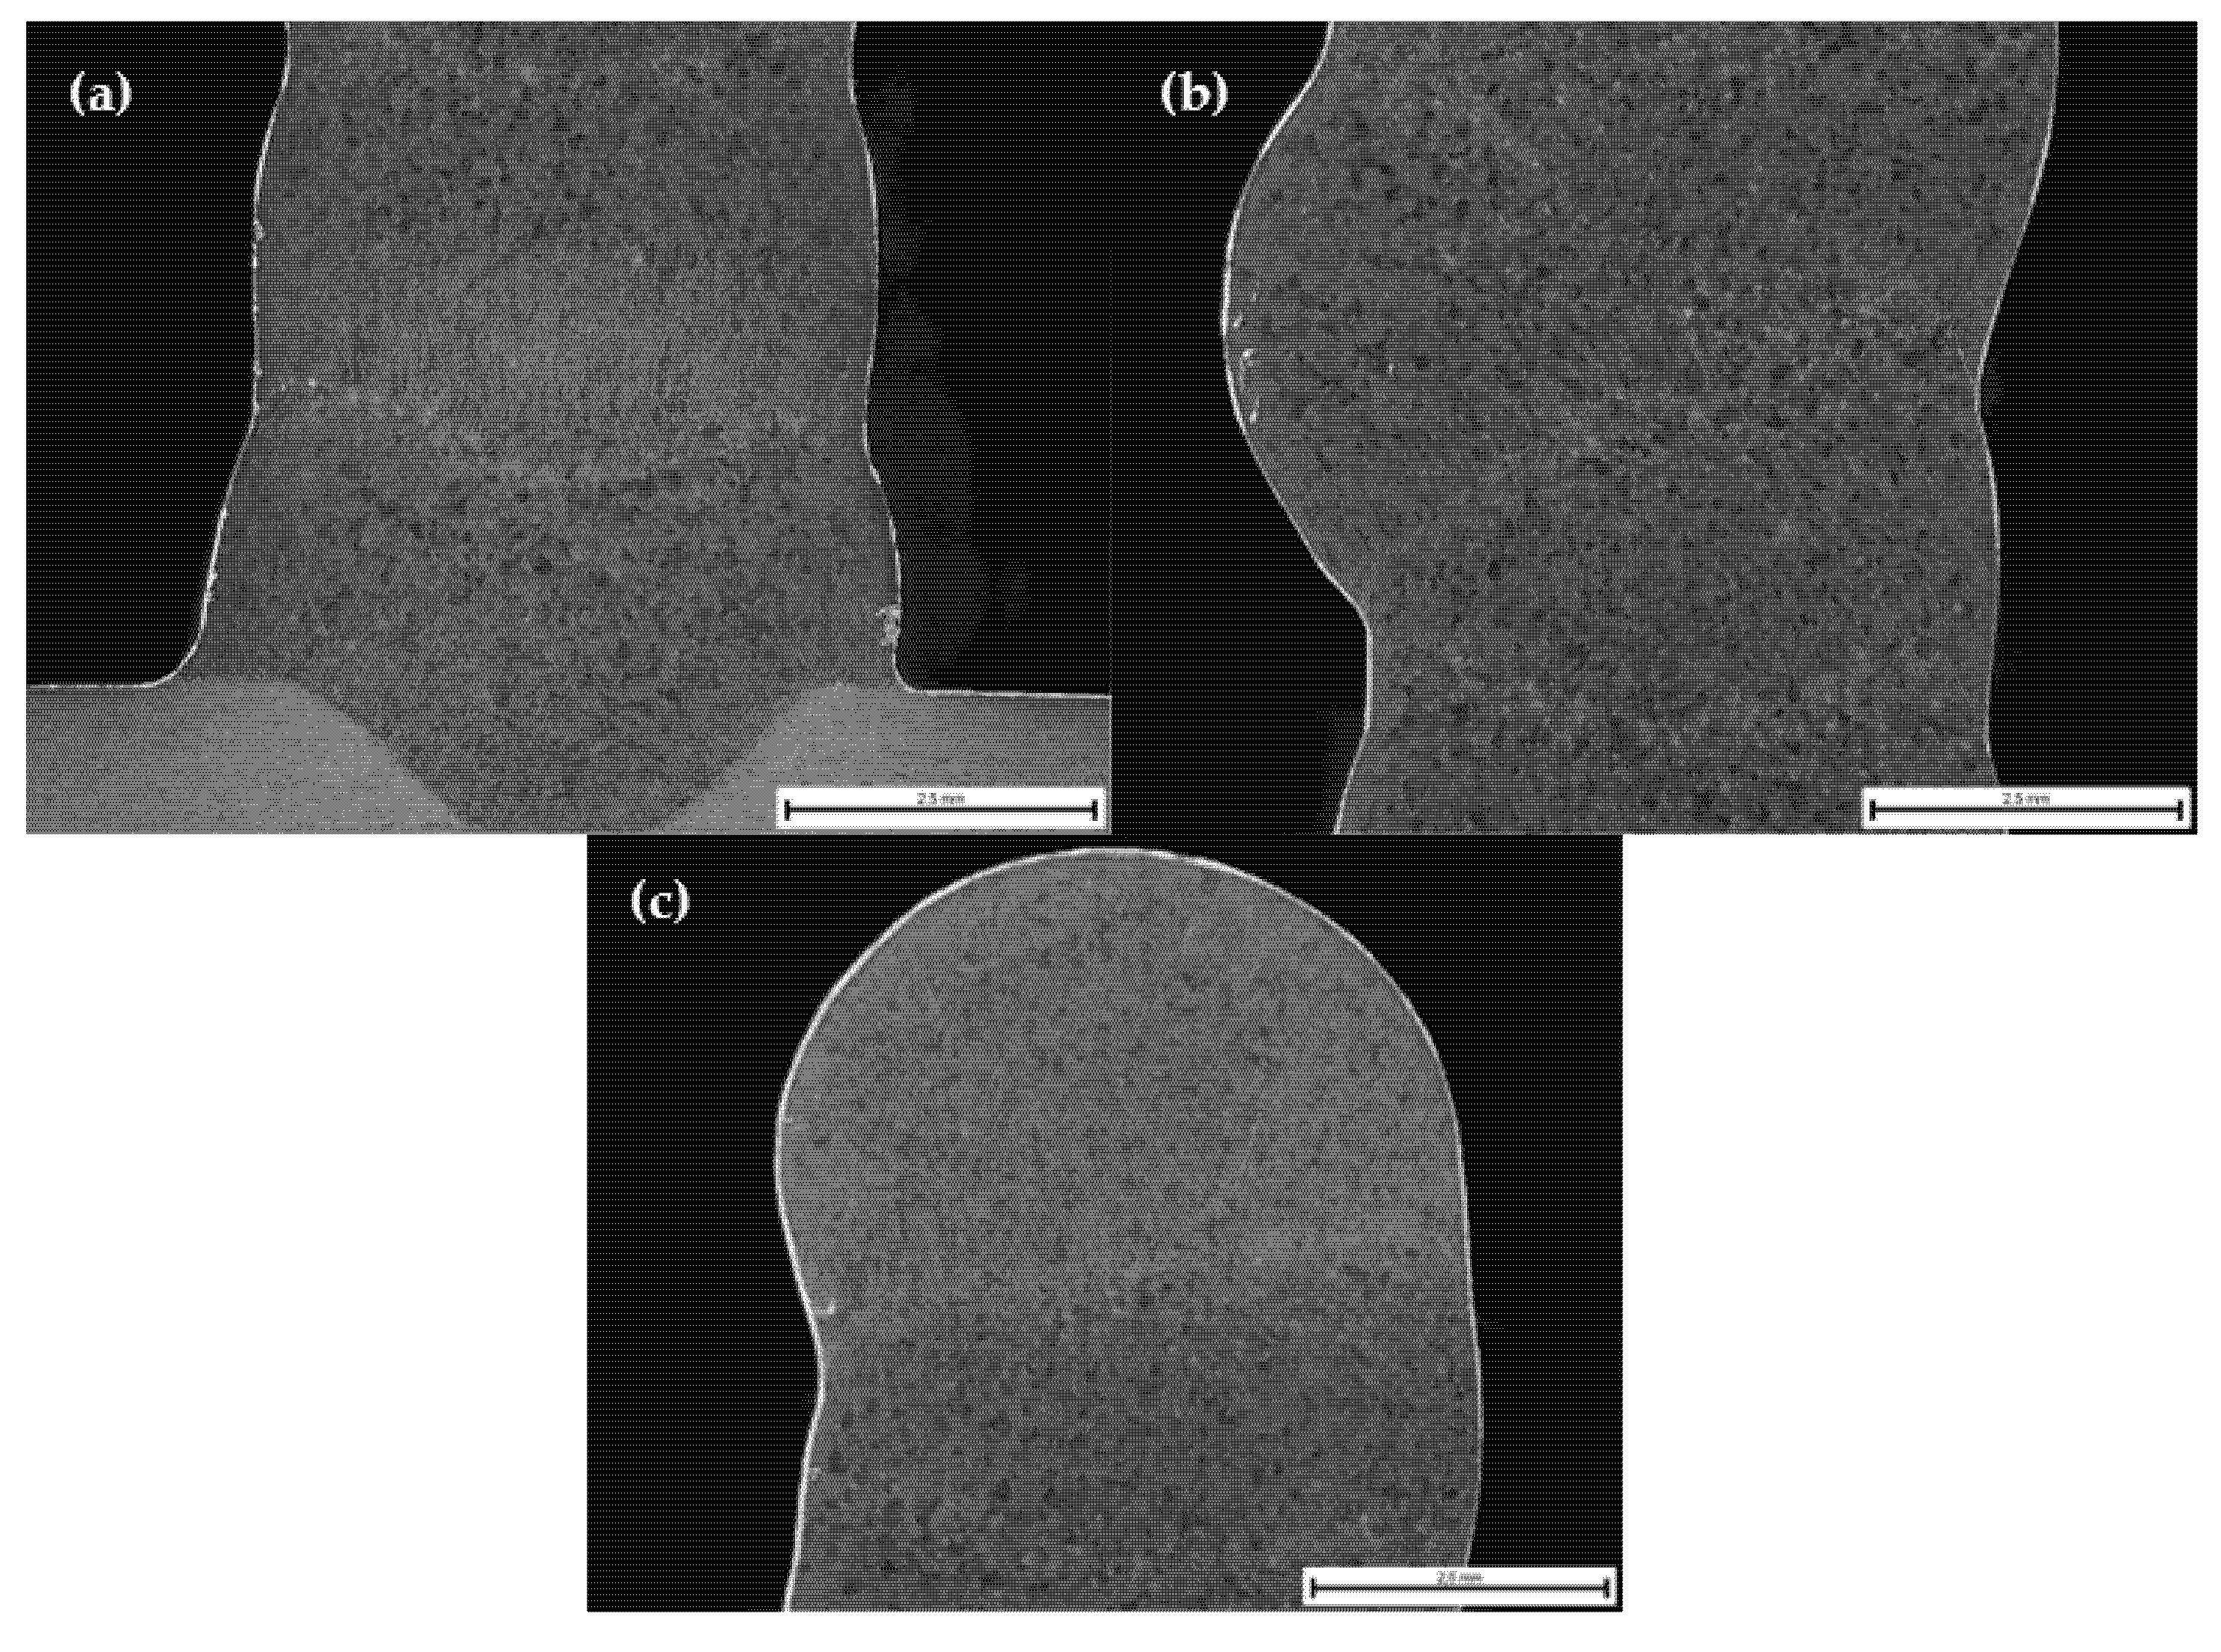
Our microstructural images in Figure 20 show an equiaxed grain structure in the previously deposited layers, while there is only a dendritic structure in the last layer at the top. The microstructure is not fully uniform in the interlayer section, but clusters of pores are not observed as in other works [4]. Because of the selected deposition strategy and resulting weld bead height of approximately 3.75 mm, a complete re-melting of the previously deposited layer and thermal treatment of the prior bottom layer happened, which refined grain size and removed the original dendritic structure, leading to highly isotropic mechanical properties.

5. Conclusions

The main conclusions of this study are:
  • The type of deposition strategy, shielding gas, and gas flow rate directly affects the porosity observed in AA5356 WAAM walls built with CMT arc mode.
  • The best conditions to reduce porosity area percentage and maximum pore size were Ar + circling and Stargold® + hatching, with a resultant porosity below 0.035% in both cases.
  • Circling demonstrated to be a more stable build-up condition with reduction of humping risk and no need for a gradual decrease of intensity in the initial four layers, due to a higher temperature reached during deposition process.
  • Despite the obtained porosity levels being up to 2.86% in the worst shielding conditions, there was a reduced effect of porosity on the yield stress (>110 MPa), ultimate tensile strength (>270 MPa), and elongation (>27%), and in all cases, anisotropy was below 11%.
  • The apparent reasons behind the low anisotropy are the lack of clustered pores in the interlayer region and the grain refining effect due to the re-melting of the previously deposited layers because of the selected layer height and deposition welding parameters. [1]

Author Contributions

Conceptualization, M.A., E.U., and P.A.; methodology, M.A., A.I., and I.R.; validation, E.U. and P.A.; formal analysis, M.A., E.U., and P.A.; investigation, M.A., A.I., and I.R.; resources, P.A.; data curation, M.A. and A.I.; writing—original draft preparation, M.A.; writing—review and editing, P.A. and E.U.; supervision, P.A. and E.U.; funding acquisition, P.A. All authors have read and agreed to the published version of the manuscript.

Funding

This research was supported by the Ministry of Science and innovation of the Spain Government through the program “Ayudas Destinadas a Centros Tecnológicos de Excelencia CERVERA Año 2019” from CDTI (Centro para el Desarrollo Tecnológico Industrial) in the frame of the CEFAM Project, grant CER-20191005.

Institutional Review Board Statement

Not applicable.

Informed Consent Statement

Not applicable.

Data Availability Statement

Data available on request due to restrictions. The data presented in this study are available from the corresponding author.

Conflicts of Interest

The authors declare no conflict of interest.

References

  1. Wang, Z.; Zhang, Y. A review of aluminum alloy fabricated by different processes of wire arc additive manufacturing. Medziagotyra 2021, 27, 18–26. [Google Scholar] [CrossRef]
  2. Rodrigues, T.A.; Duarte, V.; Miranda, R.M.; Santos, T.G.; Oliveira, J.P. Current status and perspectives on wire and arc additive manufacturing (WAAM). Materials 2019, 12, 1121. [Google Scholar] [CrossRef] [PubMed] [Green Version]
  3. Derekar, K.S. A review of wire arc additive manufacturing and advances in wire arc additive manufacturing of aluminium. Mater. Sci. Technol. 2018, 34, 895–916. [Google Scholar] [CrossRef]
  4. Gierth, M.; Henckell, P.; Ali, Y.; Scholl, J.; Bergmann, J.P. Wire Arc Additive Manufacturing (WAAM) of aluminum alloy AlMg5Mn with energy-reduced Gas Metal Arc Welding (GMAW). Materials 2020, 13, 2671. [Google Scholar] [CrossRef] [PubMed]
  5. Cunningham, C.R.; Flynn, J.M.; Shokrani, A.; Dhokia, V.; Newman, S.T. Invited review article: Strategies and processes for high quality wire arc additive manufacturing. Addit. Manuf. 2018, 22, 672–686. [Google Scholar] [CrossRef]
  6. Pan, Z.; Ding, D.; Wu, B.; Cuiuri, D.; Li, H.; Norrish, J. Arc Welding Processes for Additive Manufacturing: A Review. Trans. Intell. Weld. Manuf. 2018, 3–24. [Google Scholar] [CrossRef]
  7. Ivántabernero, A.; Paskual, P.Á.; Suárez, A. Study on Arc Welding Processes for High Deposition Rate Additive Manufacturing. Procedia CIRP 2018, 68, 358–362. [Google Scholar] [CrossRef]
  8. Derekar, K.S.; Addison, A.; Joshi, S.S.; Zhang, X.; Lawrence, J.; Xu, L.; Melton, G.; Griffiths, D. Effect of pulsed metal inert gas (pulsed-MIG) and cold metal transfer (CMT) techniques on hydrogen dissolution in wire arc additive manufacturing (WAAM) of aluminium. Int. J. Adv. Manuf. Technol. 2020, 107, 311–331. [Google Scholar] [CrossRef]
  9. Horgar, A.; Fostervoll, H.; Nyhus, B.; Ren, X.; Eriksson, M.; Akselsen, O.M. Additive manufacturing using WAAM with AA5183 wire. J. Mater. Process. Technol. 2018, 259, 68–74. [Google Scholar] [CrossRef]
  10. Williams, S.W.; Martina, F.; Addison, A.C.; Ding, J.; Pardal, G.; Colegrove, P. Wire + arc additive manufacturing. Mater. Sci. Technol. 2016, 32, 641–647. [Google Scholar] [CrossRef] [Green Version]
  11. Cong, B.; Qi, Z.; Qi, B.; Sun, H.; Zhao, G.; Ding, J. A comparative study of additively manufactured thin wall and block structure with Al-6.3%Cu alloy using cold metal transfer process. Appl. Sci. 2017, 7, 275. [Google Scholar] [CrossRef]
  12. Fang, X.; Zhang, L.; Chen, G.; Dang, X.; Huang, K.; Wang, L.; Lu, B. Correlations between Microstructure Characteristics and Mechanical Properties in 5183 Aluminium Alloy Fabricated by Wire-Arc Additive Manufacturing with Different Arc Modes. Materials 2018, 11, 2075. [Google Scholar] [CrossRef] [PubMed] [Green Version]
  13. Cong, B.; Ding, J.; Williams, S. Effect of arc mode in cold metal transfer process on porosity of additively manufactured Al-6.3%Cu alloy. Int. J. Adv. Manuf. Technol. 2014, 76, 1593–1606. [Google Scholar] [CrossRef]
  14. Ayarkwa, K.F.; Williams, S.; Ding, J. Investigation of pulse advance cold metal transfer on aluminium wire arc additive manufacturing. Int. J. Rapid Manuf. 2015, 5, 44. [Google Scholar] [CrossRef]
  15. Gu, J.; Cong, B.; Ding, J.; Williams, S.W.; Zhai, Y. Wire-Arc Additive Manufacturing of Aluminium. In Proceedings of the 25th Annual International Solid Freeform Fabrication Symposium, Austin, TX, USA, 4–6 August 2014; pp. 451–458. Available online: http://utw10945.utweb.utexas.edu/sites/default/files/2014-038-Gu.pdf (accessed on 1 March 2021).
  16. Derekar, K.; Lawrence, J.; Melton, G.; Addison, A.; Zhang, X.; Xu, L. Influence of Interpass Temperature on Wire Arc Additive Manufacturing (WAAM) of Aluminium Alloy Components. MATEC Web Conf. 2019, 269, 05001. [Google Scholar] [CrossRef]
  17. Ryan, E.M.; Sabin, T.J.; Watts, J.F.; Whiting, M.J. The influence of build parameters and wire batch on porosity of wire and arc additive manufactured aluminium alloy 2319. J. Mater. Process. Technol. 2018, 262, 577–584. [Google Scholar] [CrossRef]
  18. Köhler, M.; Fiebig, S.; Hensel, J.; Dilger, K. Wire and arc additive manufacturing of aluminum components. Metals 2019, 9, 608. [Google Scholar] [CrossRef] [Green Version]
  19. Zhao, Y.; Xiao, J.; Chen, S. Comparison of Microstructure and Mechanical Properties of Aluminum Components Manufactured by CMT. Mater. Sci. Forum 2017, 898, 1318–1324. [Google Scholar] [CrossRef]
  20. StarGold Aluminum StarGold Aluminum Safety Data Sheet E-6501. 2016, pp. 1–9. Available online: https://wapitigravel.ca/KnowledgeBaseBuilder/uploads/MSDS/Praxair%20Gases/E-6501%20%20StarGold%20Aluminum%20MSDS%20%202016.pdf (accessed on 22 March 2021).
Figure 1. Manufacturing equipment.
Metals 11 00524 g001
Figure 2. Deposition strategies of the study.
Metals 11 00524 g002
Figure 3. (a) Dimensions of tensile specimens in mm and (b) schematic representation of the vertical and horizontal specimens in the part.
Metals 11 00524 g003
Figure 4. Cross-sections of single weld beads with cold metal transfer (CMT) and Argon Q1 shielding gas.
Metals 11 00524 g004
Figure 5. Cross-sections of single weld beads with CMT and Stargold® shielding gas.
Metals 11 00524 g005
Figure 6. Single weld bead dimensions comparison.
Metals 11 00524 g006
Figure 7. 20-layer aluminium wall by CMT Argon circling deposition strategy with 18 L/min (left), 25 L/min (middle), and 30 L/min (right) shielding gas flows.
Metals 11 00524 g007
Figure 8. Necking-effect correction in (a) Ar + hatching with 18 L/min gas flow without sequential reduction of welding parameters, (b) Ar + hatching with 18 L/min and sequential reduction, and (c) Ar + cirlcing with 30 L/min gas flow.
Metals 11 00524 g008
Figure 9. Porosity in AA5356 wire-arc additive manufacturing (WAAM) walls built with Argon Q1 shielding gas.
Metals 11 00524 g009
Figure 10. Porosity in AA5356 WAAM walls built with Stargold® shielding gas.
Metals 11 00524 g010
Figure 11. Aligned porosity with low shielding gas protection (18 L/min) and good protection (30 L/min).
Metals 11 00524 g011
Figure 12. Mean melt pool temperature evolution in different layers of parts built with 30 L/min shielding flow rate.
Metals 11 00524 g012
Figure 13. Nineteenth layer temperature representation for Argon Q1 shielding gas at 30 L/min gas flow.
Metals 11 00524 g013
Figure 14. Nineteenth layer temperature representation for Stargold® shielding gas at 30 L/min gas flow.
Metals 11 00524 g014
Figure 15. Porosity histogram of WAAM walls manufactured for testing of mechanical properties. Naming sequence: Shielding gas_Deposition strategy_Gas flow rate_Specimen testing direction.
Metals 11 00524 g015
Figure 16. Mean melt pool temperature of layers in parts manufactured to test mechanical properties with Argon Q1 + 18 L/min + hatching condition.
Metals 11 00524 g016
Figure 17. Thermocouple temperatures of layers in parts manufactured to test mechanical properties with Argon Q1 + 18 L/min + hatching condition.
Metals 11 00524 g017
Figure 18. Mechanical properties of AA5356 with CMT.
Metals 11 00524 g018
Figure 19. Example of tensile test sample extracted in horizontal direction and manufactured with Argon 30 L/min + circling with Portevin–Le Chatelier effect.
Metals 11 00524 g019
Figure 20. Microstructural structure example of part manufactured with Argon Q1 30 L/min gas flow + hatching (a) bottom zone, (b) middle zone, and (c) top zone.
Metals 11 00524 g020
Table 1. Chemical composition of welding materials.
AlloyChemical Composition (wt%)
AlCrCuFeMgMnSiTi
AA5356_(ER5356)Bal.0.05–0.20≤0.10≤0.404.5–5.50.05–0.20≤0.250.06–0.20
Al6082-T6Bal.≤0.25≤0.10≤0.500.60–1.200.40–1.00.70–1.30≤0.10
Table 2. Shielding gases composition percentage (%) [20].
Shielding GasArgonOxygenNitrous Oxide
Argon Q199.999--
Stargold®96–99.9998<2<0.1
Table 3. Welding intensity for hatching and circling deposition strategies.
LayerHatchingCircling
1st layer130 A130 A
2nd layer95 A77 A
3rd layer85 A77 A
Rest of layers77 A77 A
Table 4. Porosity area percentage (%) with different fabrication configurations.
Shielding GasDeposition StrategyShielding Gas Flow Rate
18 L/min25 L/min30 L/min
ArgonCircling3.6620.1620.056
Hatching2.9180.9320.557
Stargold®Circling1.1010.2780.426
Hatching0.8110.2240.121
Table 5. Porosity area percentage (%) of WAAM walls manufactured for testing of mechanical properties.
Shielding GasDeposition StrategySpecimen DirectionPorosity (%)Maximum Pore Diameter (µm)
Argon 18 L/minHatchingHorizontal2.865259
Vertical0.393180
Argon 30 L/minHatchingHorizontal0.480253
Vertical0.241184
CirclingHorizontal0.01977
Vertical0.02894
Stargold® 30 L/minHatchingHorizontal0.03190
Vertical0.034165
Table 6. Anisotropy percentage (%) values from the mechanical properties.
Shielding GasDeposition
Strategy
Anisotropy (%)
Yield StressTensile StrengthElongation
Argon 18 L/minHatching4111
Argon 30 L/minHatching013
Circling902
Stargold® 30 L/minHatching009
Publisher’s Note: MDPI stays neutral with regard to jurisdictional claims in published maps and institutional affiliations.

