Article

Influence of Deposition Patterns on Distortion of H13 Steel by Wire-Arc Additive Manufacturing

1
Faculty of Materials and Manufacturing, Beijing University of Technology, Beijing 100124, China
2
Shougang Research Institute of Technology, Beijing 100043, China
*
Author to whom correspondence should be addressed.
Metals 2021, 11(3), 485; https://doi.org/10.3390/met11030485
Submission received: 20 February 2021 / Revised: 3 March 2021 / Accepted: 11 March 2021 / Published: 15 March 2021

Abstract

:
Wire-arc additive manufacturing (WAAM) has been considered as one of the potential additive-manufacturing technologies to fabricate large components. However, its industrial application is still limited by the existence of stress and distortion. During the process of WAAM, the scanning pattern has an important influence on the temperature field, distortion and final quality of the part. Four kinds of deposition patterns, including sequence, symmetry, in–out and out–in, were designed to deposit H13 steel in this study. An in situ measurement system was set up to record the temperature history and the progress of accumulated distortion of the parts during deposition. An S value was proposed to evaluate the distortion of the substrate. It was shown that the distortion of the part deposited by sequence was significantly larger than those of other parts. The distortion deposited by the out–in pattern decreased by 68.6% compared with sequence. The inherent strain method and strain parameter were introduced to expose the mechanism of distortion reduction caused by pattern variation.

1. Introduction

Additive manufacturing (AM) integrates digital technology, mechanical machining technology, materials science and other advanced technological achievements, as reported by Michel et al. [1], Ding et al. [2], Gu et al. [3] and Amaia et al. [4]. Compared with conventional manufacturing technologies, the advantages of AM include saving of materials and time, which is more significant when fabricating complex components [5]. In recent years, wire-arc additive manufacturing (WAAM) has increasingly attracted attention due to its advantages of high production efficiency, high material utilization ratio, high technology integration and low equipment cost compared to powder feedstock and alternative heat sources, such as laser and electron beams [6]. A welding arc is employed as the heat source to melt the wire that was deposited layer-by-layer according to a three-dimensional (3D) CAD model until the part is finally formed. A variety of engineering materials, such as titanium, aluminum, steel and nickel-based alloy, have been successfully manufactured through WAAM [7]. H13 steel was widely implemented to produce injection molding, casting and forging molds because of its excellent behaviors in red hardness, impact toughness and resistance to thermal-fatigue cracks. Through WAAM technology, it is possible to manufacture H13 molds with an internal channel to realize the function of synchronous cooling, which is difficult for traditional machining methods.
While the advantages of WAAM have been widely accepted, there still exist several technical challenges that hinder its industrial application. One of the obstacles is the undesirable thermal distortion induced by repeatedly rapid heating and cooling, imposing an impact on the dimensional accuracy of the printed parts or even cracks. Therefore, the mechanism of the generation and mitigation of distortion must be studied to guide its implementation in industry. Aurrekoetxea et al. [8] proposed a method for bulk stress characterization. Lu et al. [9] investigated the effect of laser power and scanning speed on residual stress and distortion in LSFed (Laser Solid Forming) Ti6Al4V parts. Denlinger et al. [10] selected Ti6Al4V and Inconel® 625 to discuss the effect of dwell time between layers on bending distortion. The contribution of individual pass to total distortion was captured through in situ distortion measurement. Lu et al. [11] performed in situ distortion measurement and temperature measurement simultaneously to study the mechanical response of the substrate with temperature. It was found that distortion in particular accumulates during the cooling phase. Xie et al. [12] reported that a digital image correlation method was used to capture the strain and distortion evolution during the deposition of Ti6Al4V. He found that the distribution of strain was nonuniform along vertical and longitudinal directions. It is also critical to predict the thermal state and internal stress field of the part to guide techniques before deposition. A simulation study was conducted by Cheng et al. [13] to investigate the distribution of internal stress and the temperature field of SLMed (Selective Laser Melting) parts under different scanning patterns. A numerical simulation study was carried out by Chen et al. [14] on the temperature field of WAAM under water-cooled conditions. The results showed that the cooling conditions helped reduce the high-temperature area of the substrate and volume of the molten pool.
The distortion of parts manufactured by different AM technics are summarized in Table 1. In comparison with block and cylindrical parts, the heat generated during the deposition process of thin-walled parts is smaller due to less heat accumulation. Besides, the smaller area of heat affected zone in thin-walled parts was considered to be another reason for less distortion. The thickness of the substrate is also an important factor affecting the magnitude of thermal distortion. Regardless of the deposition process in thin-walled or block parts, the substrate with larger thickness tended to produce less thermal distortion. Similar to welding, the distortion generated in WAAM is also affected by the heat input [15]. A higher wire-feeding speed and lower traveling speed tend to produce greater distortion.
As demonstrated above, the dimension accuracy of the part was decreased by accumulated distortion. It should be controlled during the process of deposition, rather than removing it after manufacturing. To address this issue, Wu et al. [19] employed interpass cooling to mitigate thermal distortion, which can decrease longitudinal distortion up to 81% more than natural cooling. Li et al. [20] presented a flexible multipoint support fixture to control the distortion by adjusting the constrained force during the manufacturing process. Denlinger et al. [21] proposed that the thermal distortion could be mitigated through deposition of sacrificial materials by balancing the bending moment about the neutral axis of the substrate. Mukherjee et al. [22] integrated heat input, material properties, geometric structure and heat dissipation, and proposed that thermal distortion was related to the strain parameter.
Four scanning strategies were designed in this study. An in situ distortion measurement system was built to record the distortion evolution under four scanning strategies, and a concurrent temperature measurement was performed. A postprocess distortion measurement was also conducted to calculate the final distortion of the substrate. The effects of scanning patterns on temperature field and substrate distortion were both discussed.

2. Materials and Methods

2.1. Materials and Equipment

A Fronius TransPlus Synergic 5000 CMT (FRONIUS Inc., Pettenbach, Austria) was employed as the welding power source. A commercially available H13 filler wire with a diameter of 1.2 mm was used for the deposition material. After a series of experiments for substrate selection, the base metal used in this study was a Q345 steel plate with a size of 150 mm × 150 mm × 8 mm. The nominal chemical composition of the substrate and deposited wire material are listed in Table 2
Before deposition, the plate plane was polished by a grinding machine and then cleaned with acetone to remove contaminates and oxides. The shielding gas used for this work was a mixture of 2.5% CO2 and 97.5% Ar, and the gas flow was 15 L/min. A set of preliminary design-of-experiments were carried out for the process parameters selection. The deposition parameters chosen from preliminary experiments are listed in Table 3.

2.2. Experiment Setup

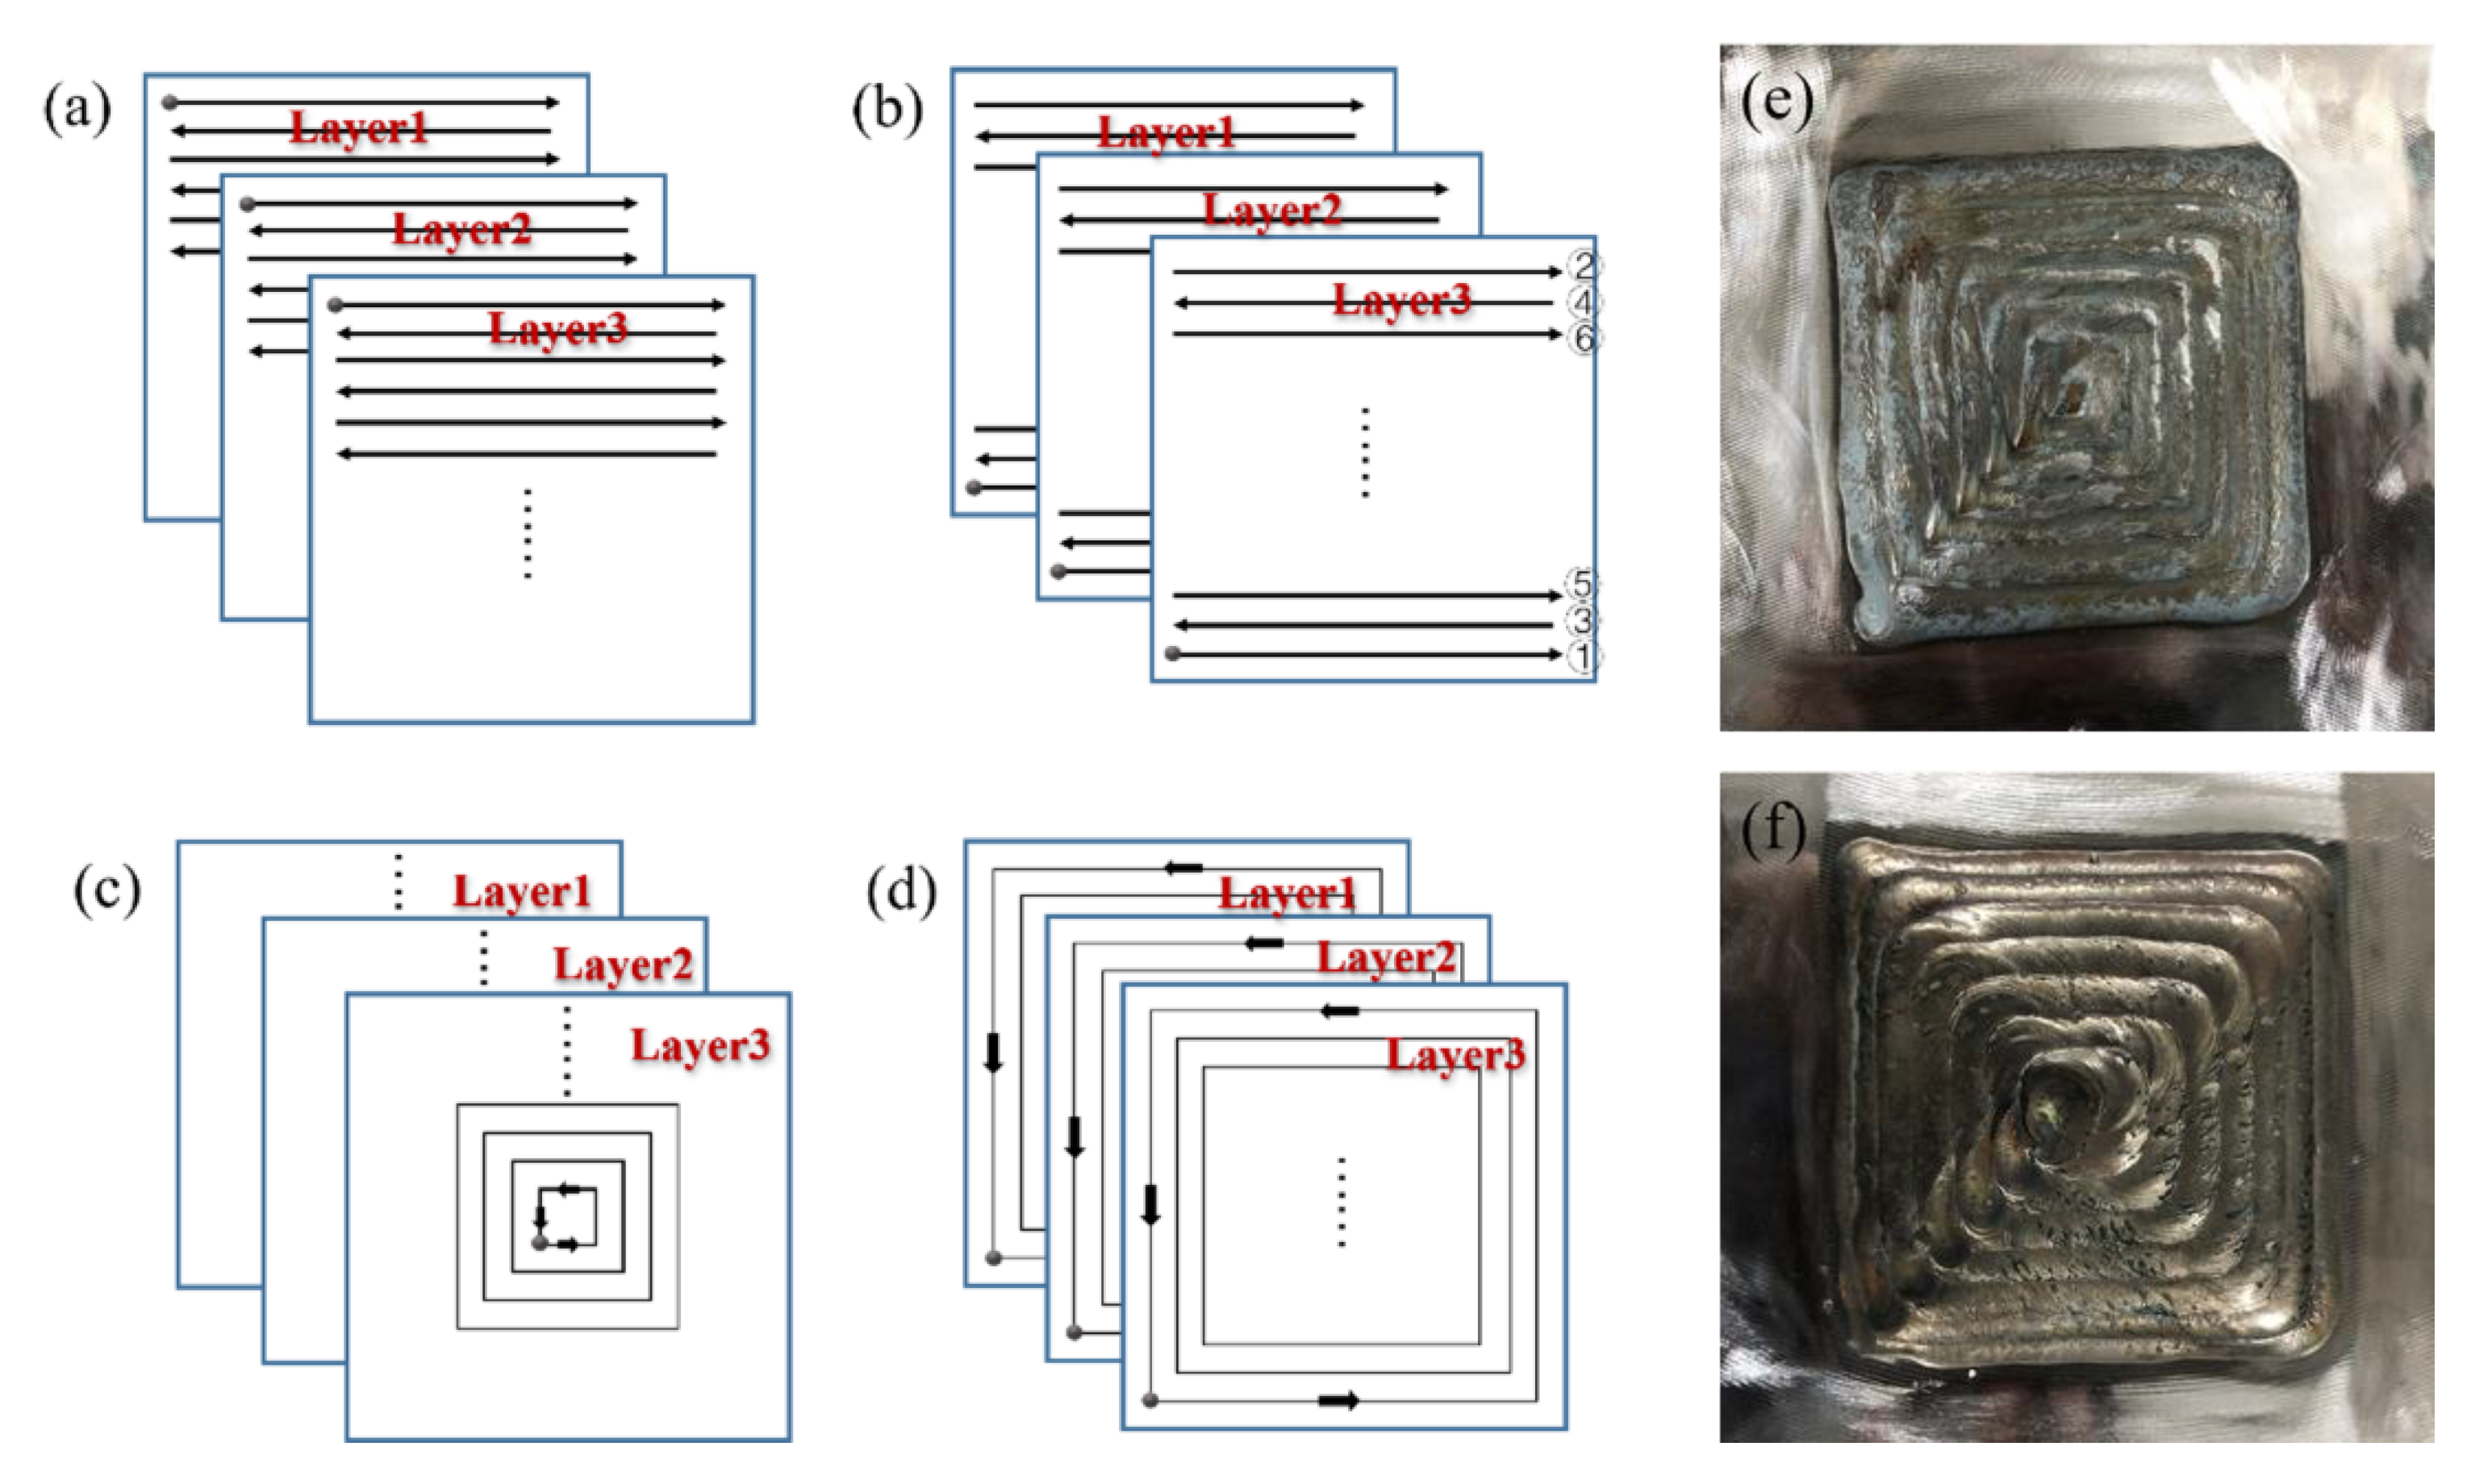
As shown in Figure 1, three Type-K thermocouples (TC1–TC3, YOUDI Inc., Dongtai, Jiangsu, China) with a diameter of 0.5 mm were installed at the underside of the substrate to record the temperature history. In order to investigate the influence of deposition patterns on distortion of the substrate, four kinds of scanning patterns sequence, symmetry, in–out and out–in were designed, as shown in Figure 2a–d, respectively. The first pass for each layer was marked by a point.
The substrate was clamped on one end to the fixture, allowing a free distortion at the opposite end. A digital indicator with a diameter of 2 mm, a range of 30 mm and a resolution of 0.02 mm was used to capture the displacement in the z-direction. As shown in Figure 3, it was positioned near the edge of the free end, at about 3 mm. An alternative design with a comblike shape was also conducted by Rodríguez-Barrero et al. [23].
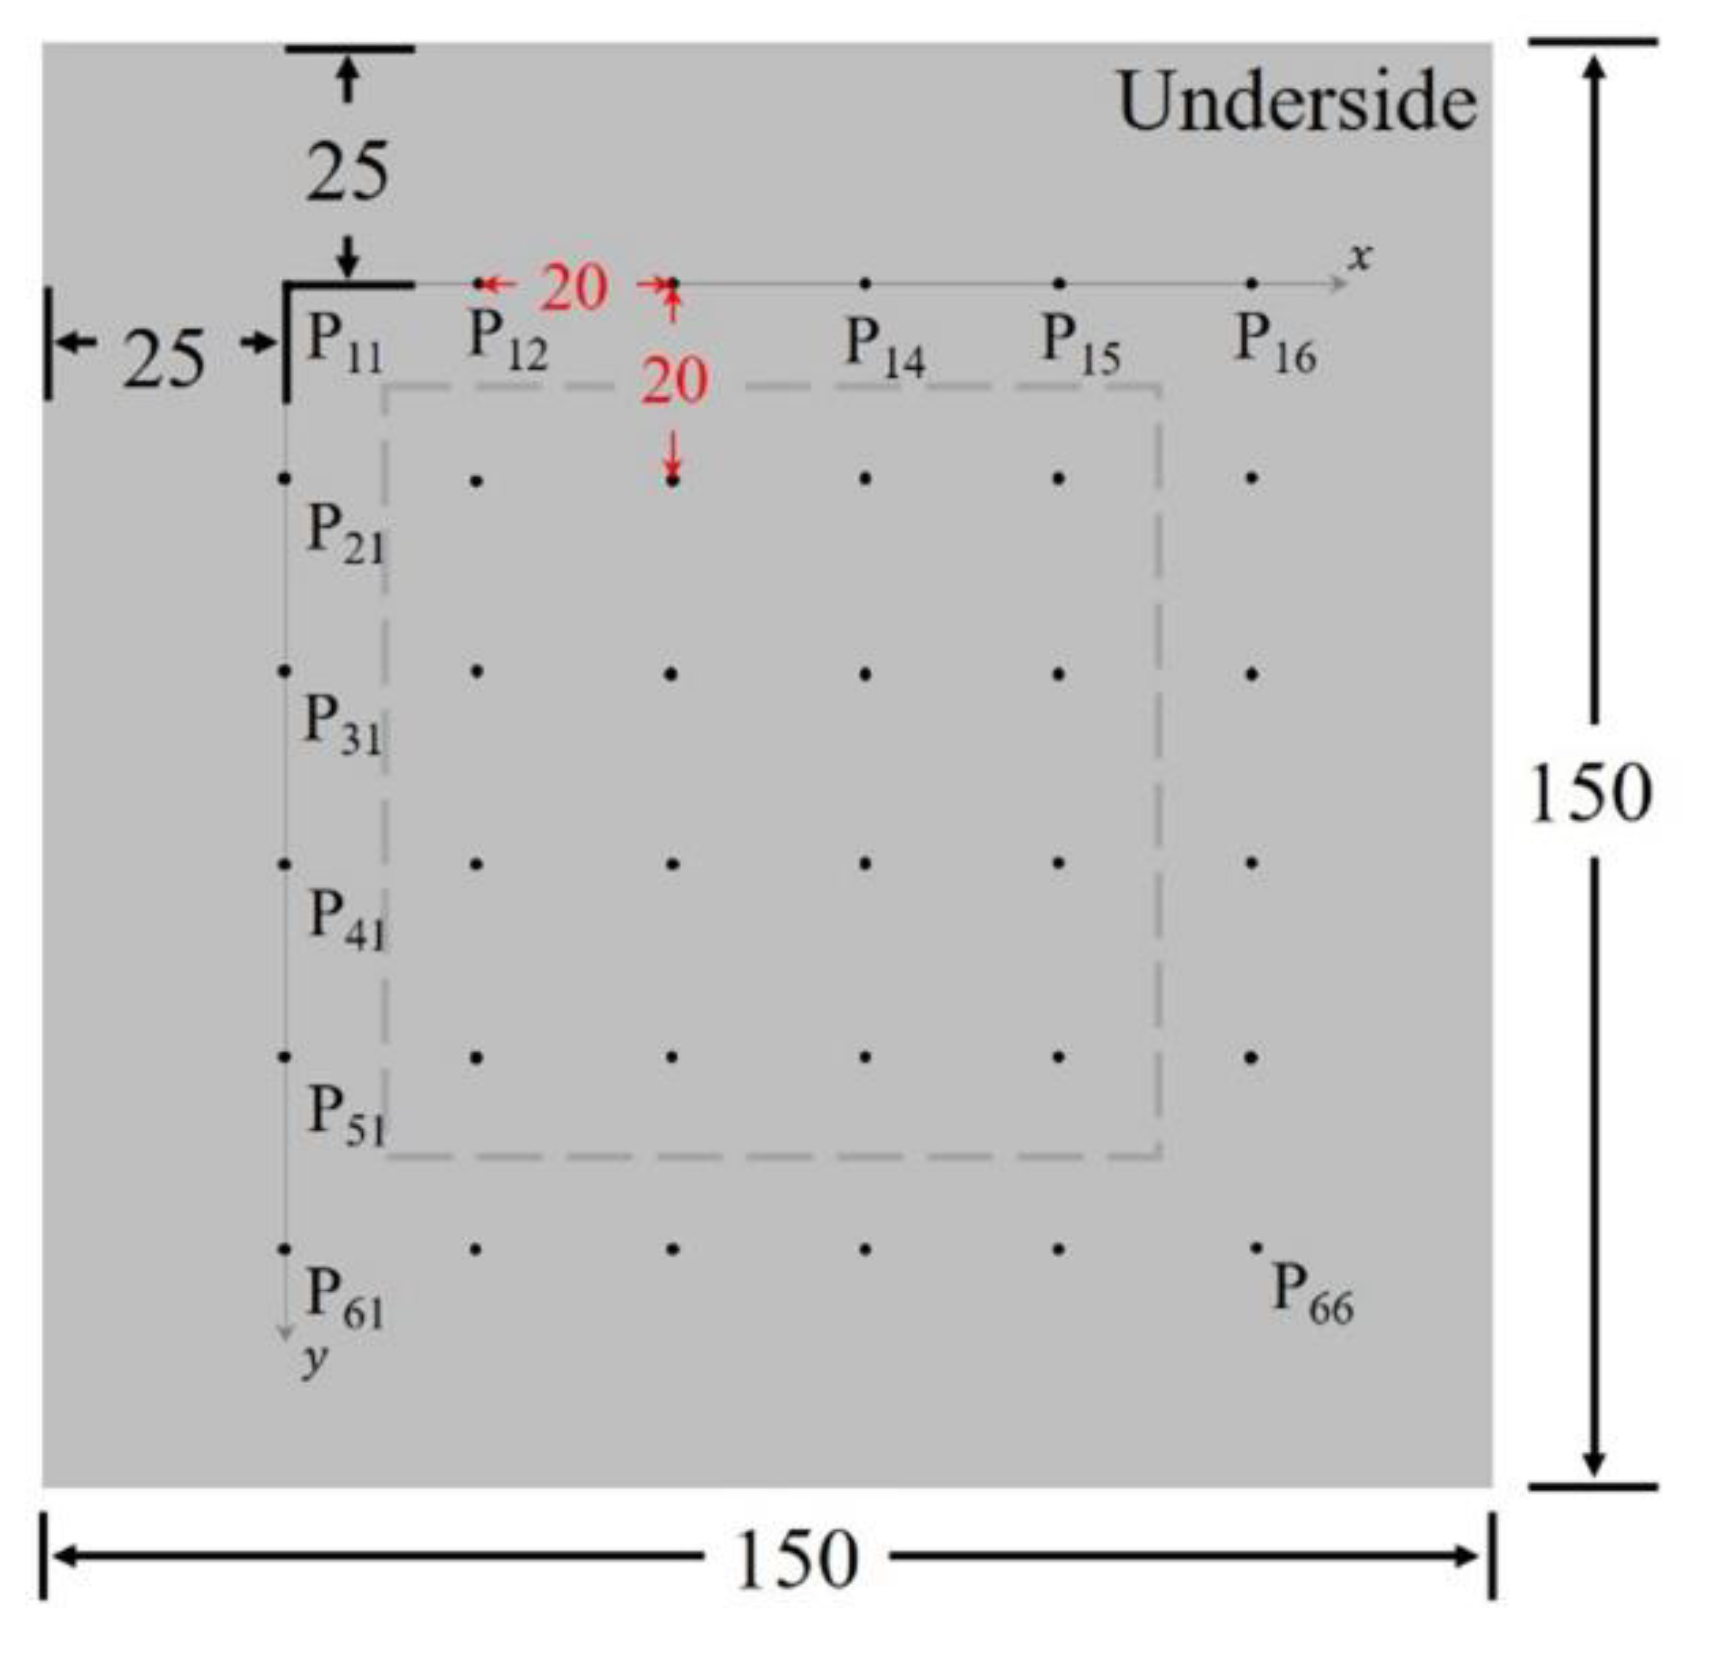
In addition to the in situ distortion measurements during WAAM, the profile of the bottom plane of each substrate was also detected after WAAM. A series of three-dimensional coordinates were obtained by measuring the displacement in the z-direction of 36 data points, as shown in Figure 4. We transferred the data points to an ideal plane in MATLAB and calculated the distance from each point to the plane. The comprehensive distance from each scattered point to the fitted plane could be calculated according to Equation (3), which was taken to evaluate the total distortion of the substrate.
For a series of points in space, the coordinates are:
(xi, yi, zi), i = 0, 1, …, n − 1 (n ≥ 3)
There will be an ideal plane expressed by Equation (2) so that the shortest distance occurs from the scattered points to the plane. A, B, C and D are constants to describe the spatial characteristics of the plane:
Ax + By + Cz + D = 0
The comprehensive distance from each data point to fitted plane could be calculated by Equation (3) to obtain the S value, which was applied to evaluate the distortion of the substrate, so that the distortion accumulated during the deposition could be quantitatively compared under different scanning patterns.
S = i = 1 36 | A x i + B y i + C z i + D | A 2 + B 2 + C 2

3. Results

3.1. Temperature History

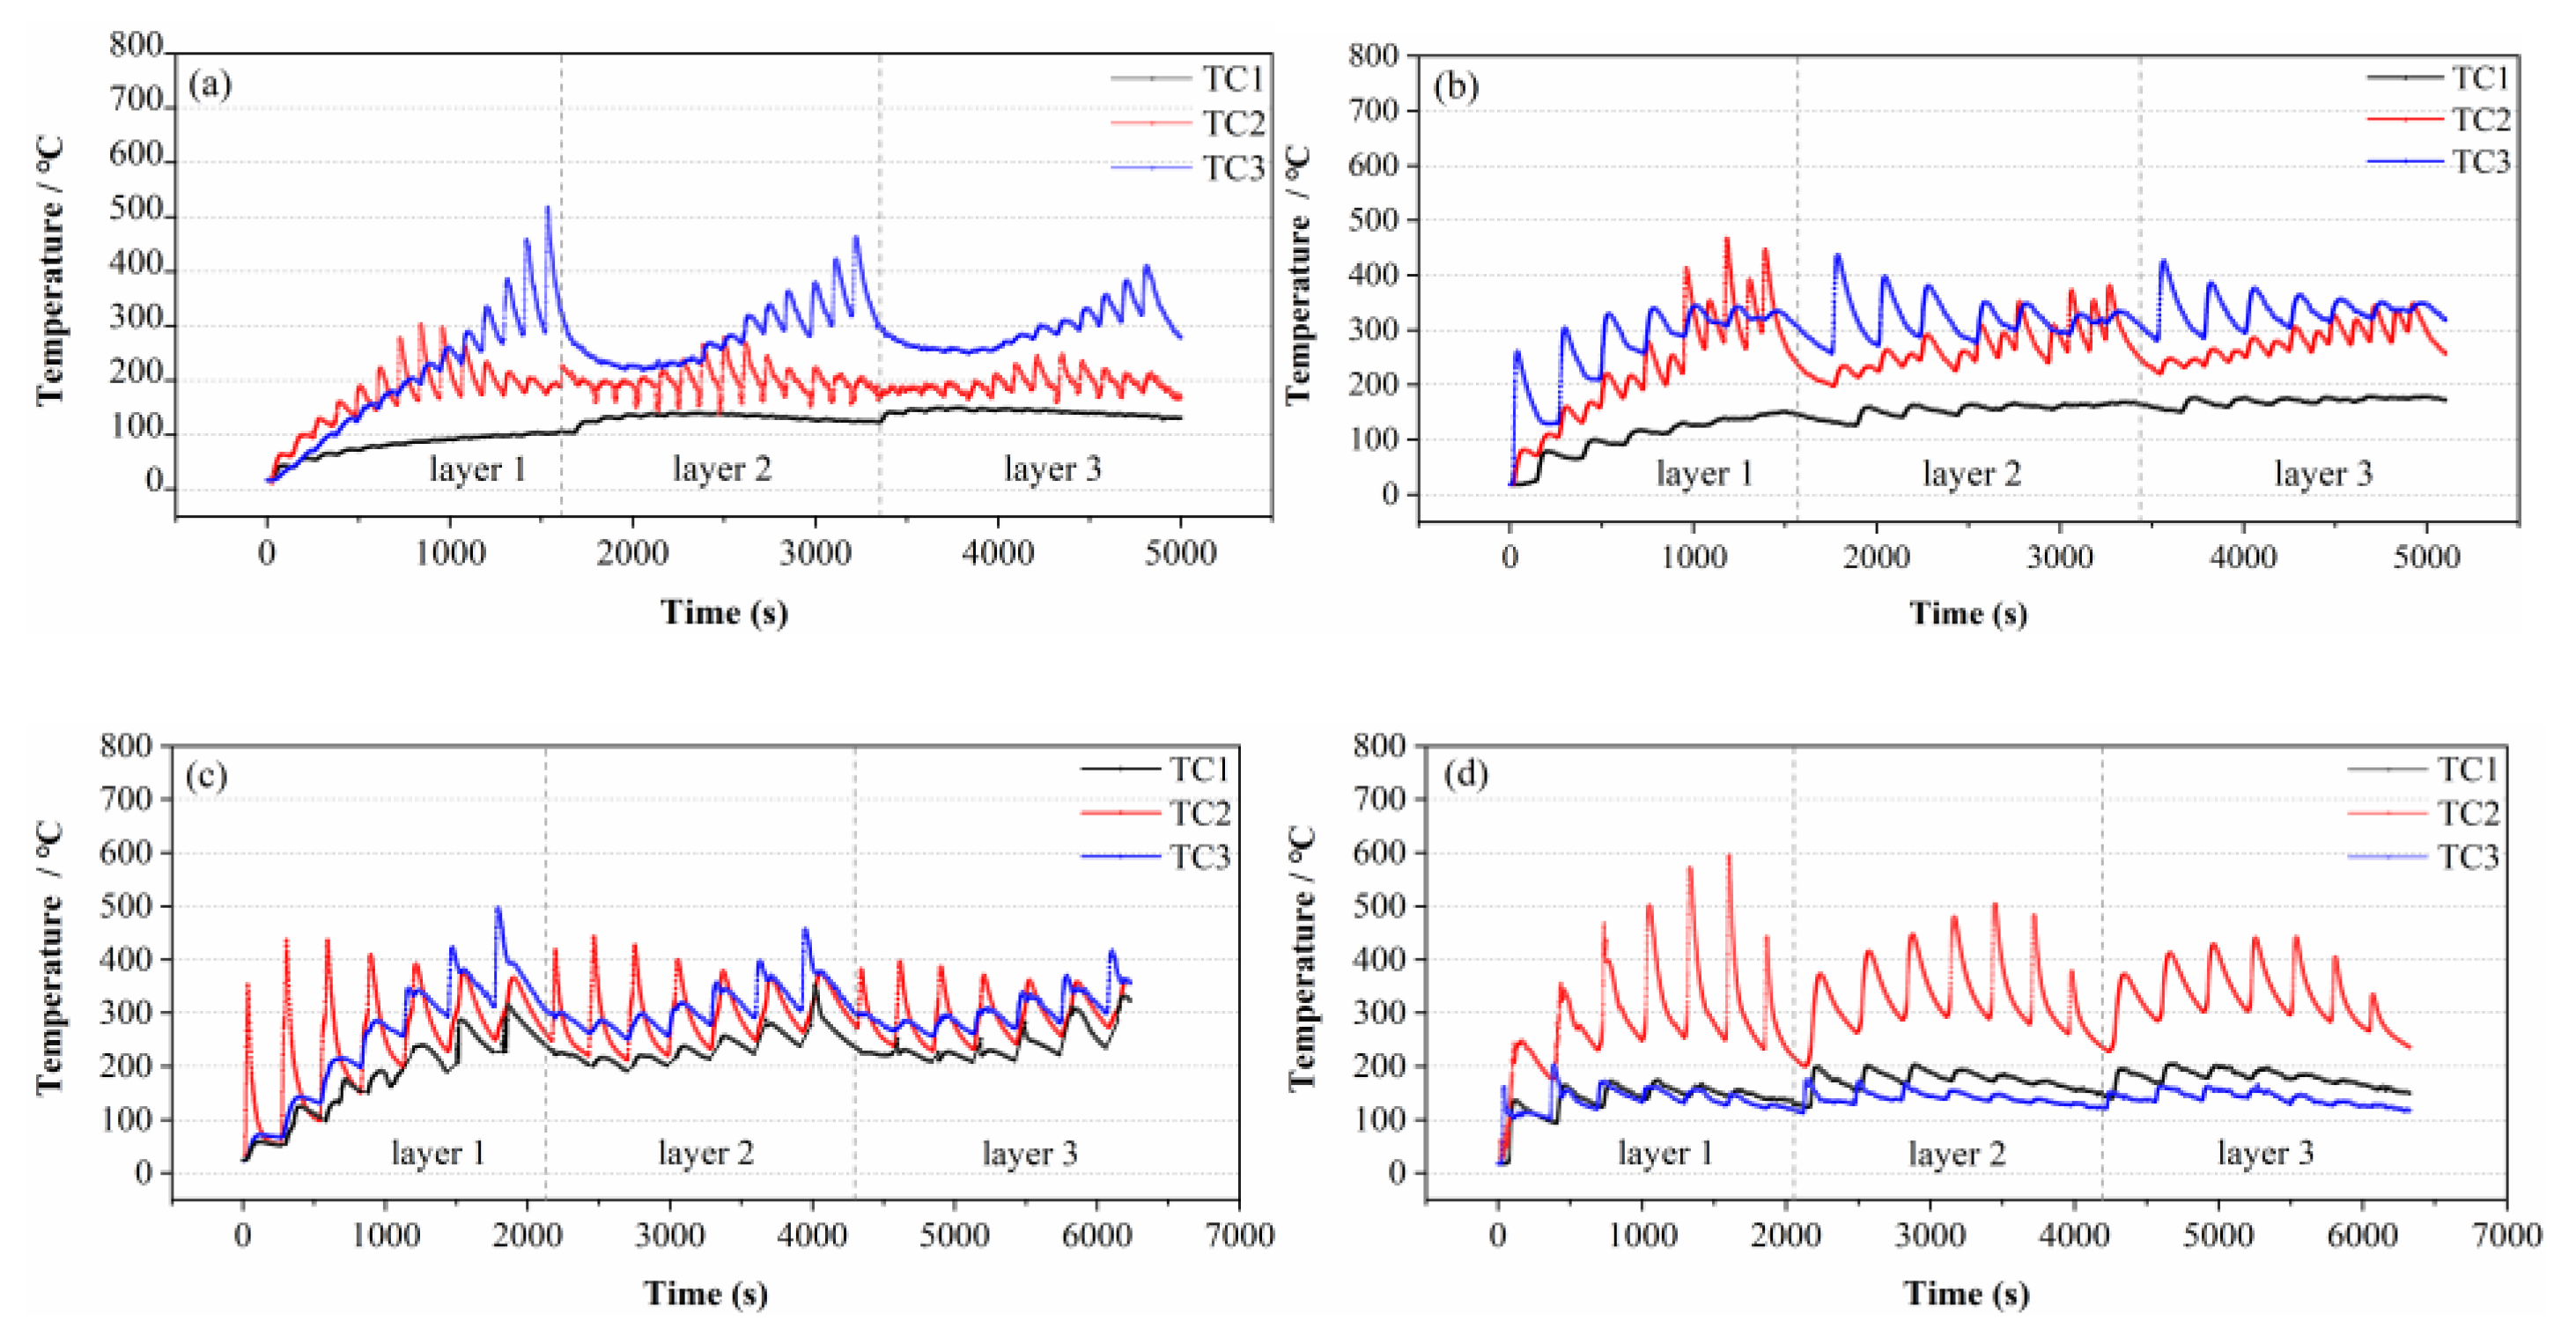
Temperature variation curves at selected locations captured by thermocouples are presented in Figure 5. In all cases, the 5 min dwell between layers allowed the heat to diffuse, resulting in a similar curve oscillation for each layer. The following results can be obtained from Figure 5:
(1) For any one of the four patterns, TC1 showed a lower temperature than the others due to it being close to the fixture. In addition to heat radiation, heat exchange with fixture was conducive for heat dissipation.
(2) For Cases 2 and 4, the temperature in TC2 gradually increased in each layer with the deposition time due to the effect of heat accumulation. While for Cases 1 and 3, the temperature measured in TC2 reached a peak when the arc passed nearby, and maintained a stable fluctuation until the end of each layer.
(3) Compared with TC2, TC3 showed a completely different temperature fluctuation. For Cases 1 and 3, the effect of heat accumulation allowed the temperature to increase with the deposition time until the end of each layer; while for Cases 2 and 4, the temperature did not decrease significantly after the peak. This is because the substrate was preheated after the first pass was deposited.

3.2. In Situ Measurements of Distortion

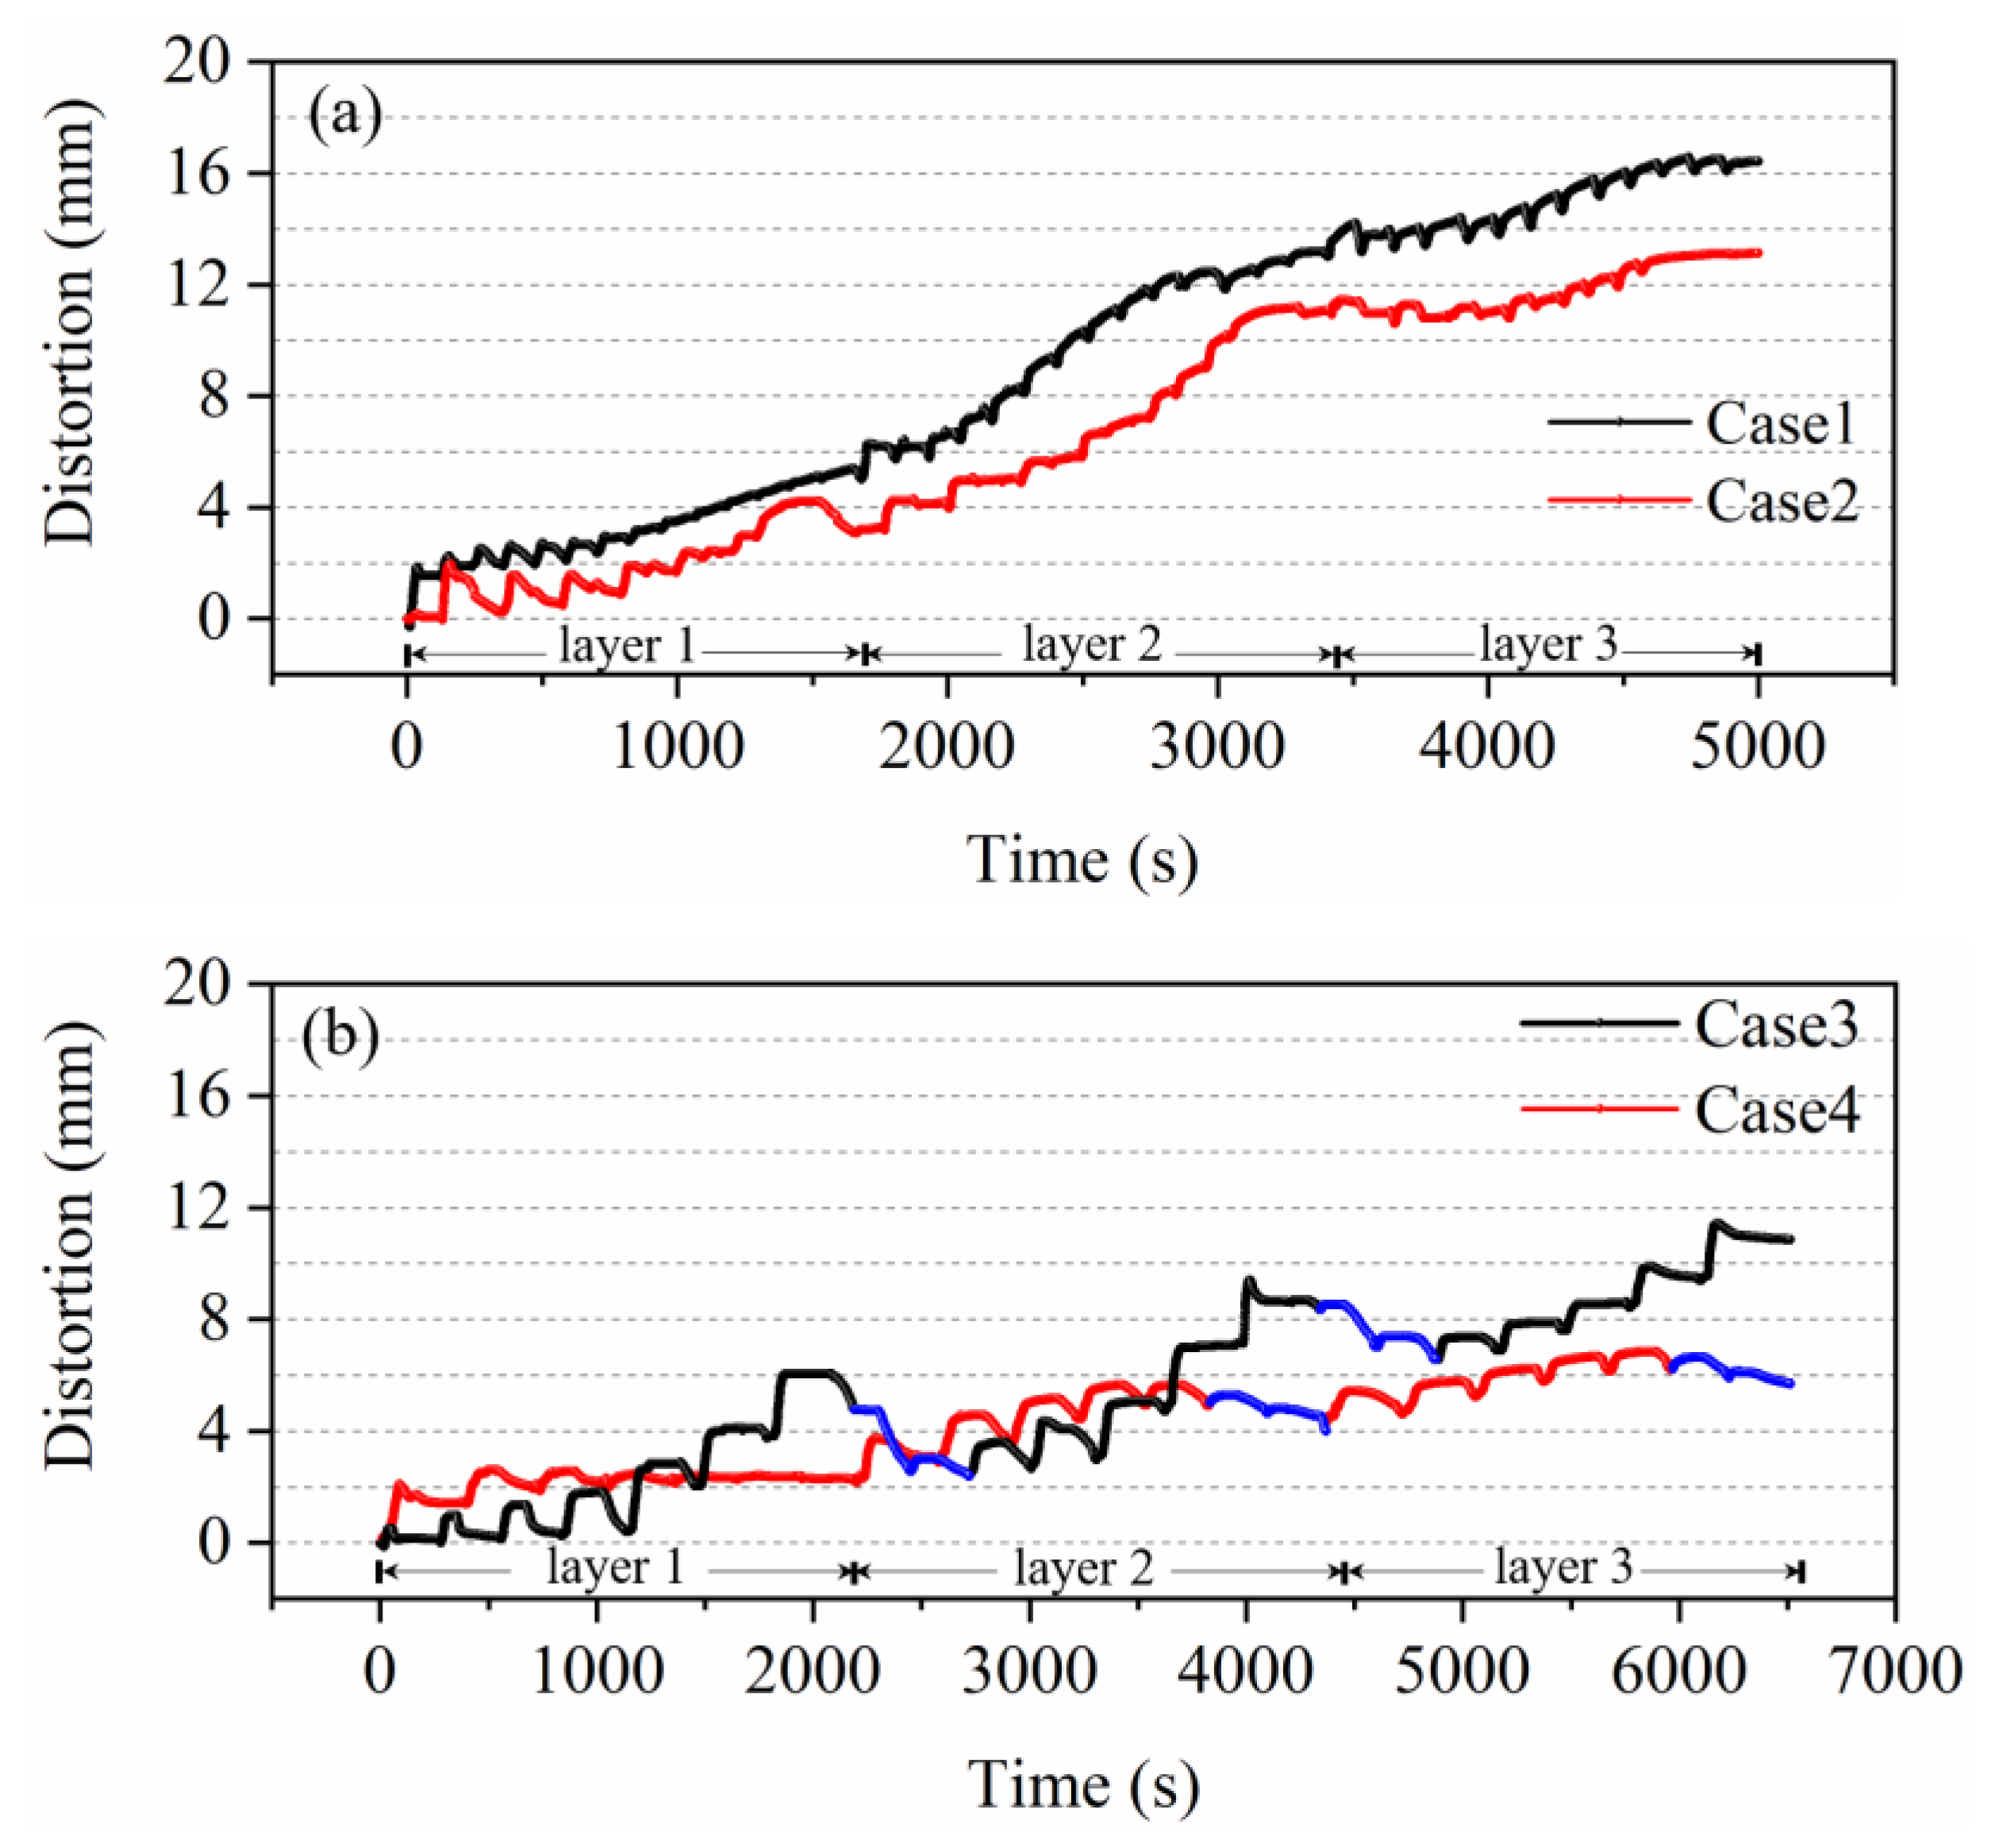
A digital indicator was used to monitor the distortion of the substrate to obtain the progression that the substrate encountered. Figure 6 provides the results of the in situ measurements of distortion for all cases. With the increasing of deposition time, the mechanical response of the substrate became more prominent. There was a significant difference in accumulation mode and amount of distortion between the raster patterns (Cases 1 and 2) and spiral patterns (Cases 3 and 4).
Accumulated distortion was the general trend in all cases analyzed here, and was particularly prevalent in raster patterns (Cases 1 and 2). In Case 1, each pass experienced basically the same distortion accumulation at the beginning of the first layer. After completion of half of the first layer (seven passes), the distortion accumulation of each pass continued to increase until completion of the first layer. During the deposition of the following layers, the regular of distortion accumulation was consistent with the first layer except for the accumulating rate. As shown in Figure 6a, the rate of accumulation of distortion in the second layer increased slightly after first layer, while it decreased during the deposition of the third layer. Viewing Case 2 as a whole, the trend of accumulated distortion was consistent with Case 1, while the amount of distortion in Case 2 was about 3 mm less than Case 1. The smaller distortion of substrate was due to the smaller stress concentration area, which was caused by the dispersed heat sources. After the three-layer deposition was completed, the maximum distortion of the free end was 16.56 mm for Case 1 and 13.03 mm for Case 2.
The most prominent observation from Figure 6b was the different modes of accumulated distortion between the in–out and out–in patterns. Besides, the first layer behaved in a different mode from the subsequent layers for both cases. During the deposition of the first layer in Case 3, the distortion accumulated at the free end as a result of the increasing length of each pass, whereas when the following layers were deposited, the distortion accumulated from the first layer was decreased during the first two passes of deposition, as shown in the blue segment in Figure 6b. The distortion decreased about 14.1% after the first two passes of deposition in the second layer, and then it began to accumulate again with the increasing length of the latter passes. The deposition of Case 4 displayed an opposite distortion behavior from Case 3. The first three passes contributed to most of the accumulated distortion for each layer. Lower distortion accumulated in the next few passes as the passes became shorter. Furthermore, similar to Case 3, the accumulated distortion could be mitigated by the passes deposited near the center of the substrate, which is presented in the blue segment in Figure 6b.

3.3. Postprocess Distortion

In addition to the in situ distortion captured by the digital indicator, the postprocess distortion of the substrate was also conducted to reflect the degree of distortion for all cases, and the results are presented in Figure 7. Through MATLAB programming, plane fitting was performed on 36 data points to obtain the spatial expression of the fitted plane, which is shown in Table 4. The S value was also calculated using Equations (2) and (3). It is clear from Figure 7 that the distortion mode of substrate was angular distortion when sequence and symmetry patterns were used. The sequence pattern experienced much higher levels of distortion than the other patterns. Compared with the S value in Table 4, the postprocess distortion in Cases 3 and 4 were lower than Case 1 by 66.2% and 68.6%, respectively.

4. Discussion

4.1. Contribution of Single Pass to the Total Distortion

The in situ distortion measurements allowed for the distortion attributable to every single pass to be captured, and displayed that different mechanical responses depend on deposition patterns. In order to evaluate the contribution of a single pass to the total distortion, the following relationship was used:
% distortion = δ i δ max × 100 %
where δi is the distortion captured by the digital indicator after deposition of the pass i, and δmax is the maximum distortion captured during the whole process of deposition.
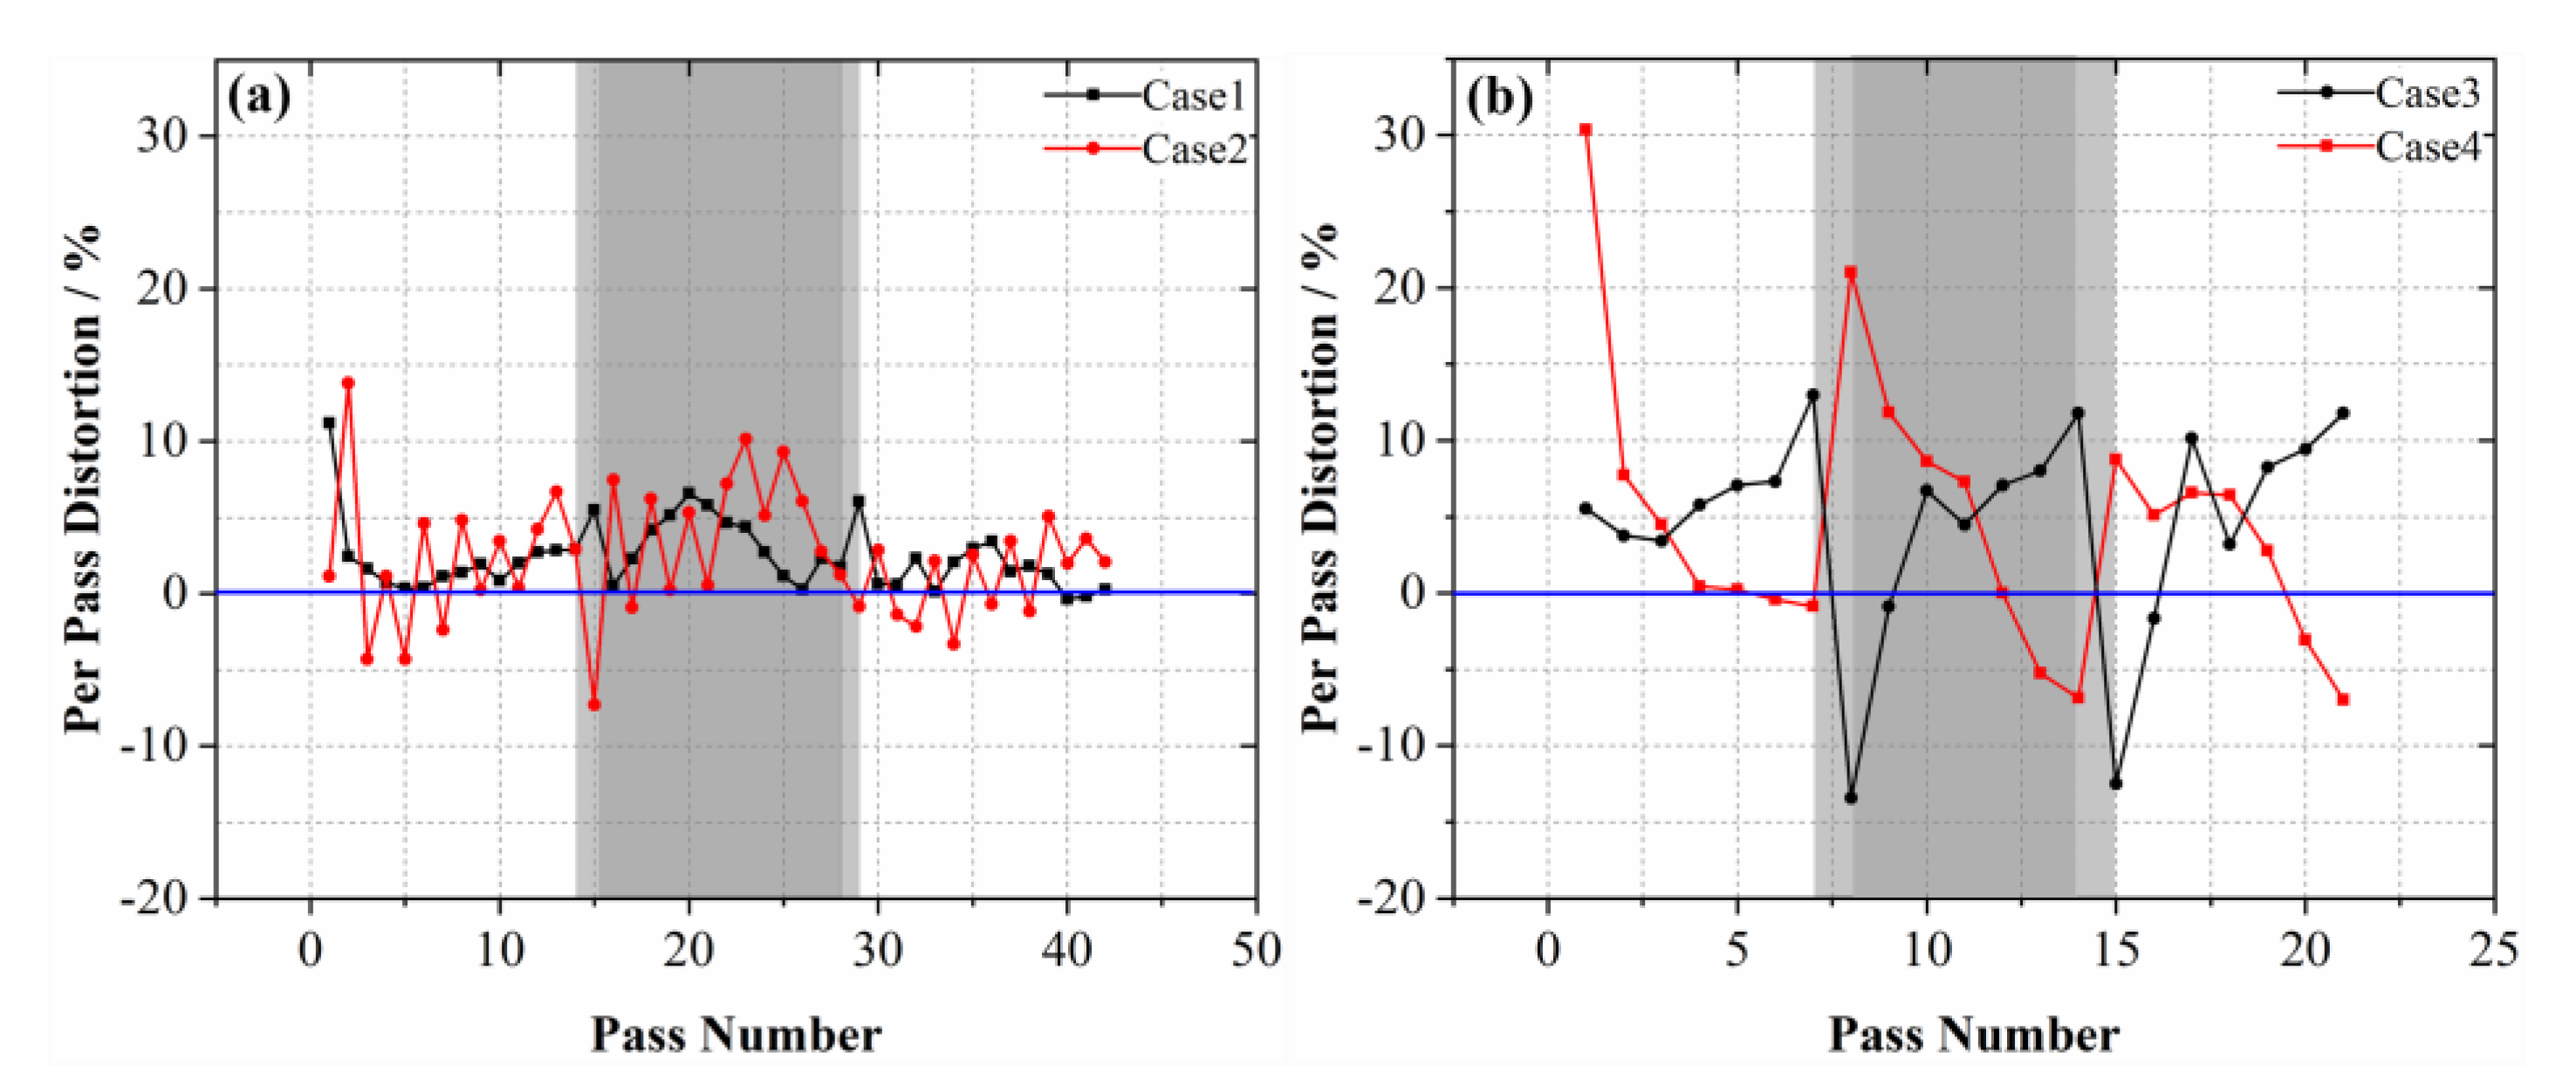
The contribution of each deposited pass to the maximum distortion using four deposition patterns are presented in Figure 8. Deposition was completed after 42 passes (14 passes and 3 layers) in raster patterns (Cases 1 and 2) and 21 passes (7 closed-shape passes and 3 layers) in spiral patterns (Cases 3 and 4).
Figure 8a illustrates the cumulative distortion due to the completion of individual passes for Case 1 and Case 2. Each single pass continued to accumulate distortion during the deposition in Case 1, while the changes in sequential order of passes resulted in different accumulated distortion modes in Case 2. The odd and even passes in Case 2 were symmetrical to the central line, and even-numbered passes were farther from the free end of the substrate. Tensile stress formed by local shrinkage after completion of even-numbered passes would drive the free end to wrap, while the odd-numbered passes had relatively little influence on the free end. During deposition of the second layer, the distortion accumulated by a single pass increased for both cases, which meant that the second layer contributed to the majority of the total distortion. In absolute terms, after deposition of the second layer, the cumulative distortion increased from 5.37 mm to 13.18 mm in Case 1, and from 4.23 mm to 11.18 mm in Case 2. After the completion of the second layer, Case 1 and Case 2 reached 79.6% and 85.8% of the total distortion, respectively.
The cumulative distortion of each individual pass in Case 3 and Case 4 are presented in Figure 8b. Except for different modes of accumulating distortion in Case 3 and Case 4, it was noticed that the passes deposited in the center of the substrate could relieve the distortion to a certain extent after the first layer. The corresponding passes caused little shrinkage due to smaller lengths, which contributed little to the distortion. Furthermore, the temperature of TC2 during the deposition of certain passes in the center of the substrate was about 400 °C, as shown in Figure 5c,d. The substrate was annealed to relieve residual stress during the deposition, which was shown as a reduction in cumulative distortion.
Contribution of a single pass to the total distortion could be provided with the use of in situ methods, which would remain uncaptured if only postprocess measurements were used. It is important to comprehend the progress that the substrate goes through during WAAM and identify the important deposited components for distortion. As demonstrated above, cumulative distortion of the second layer in Case 1 and Case 2 accounted for 47.2% and 53.3% of the total distortion, respectively. When the second layer is deposited, measures should be taken to suppress distortion, such as reducing heat input and increasing constrains. Additionally, the S value can evaluate postprocess distortion more comprehensively than [16,20].

4.2. Effect of Sequence of Heat Source

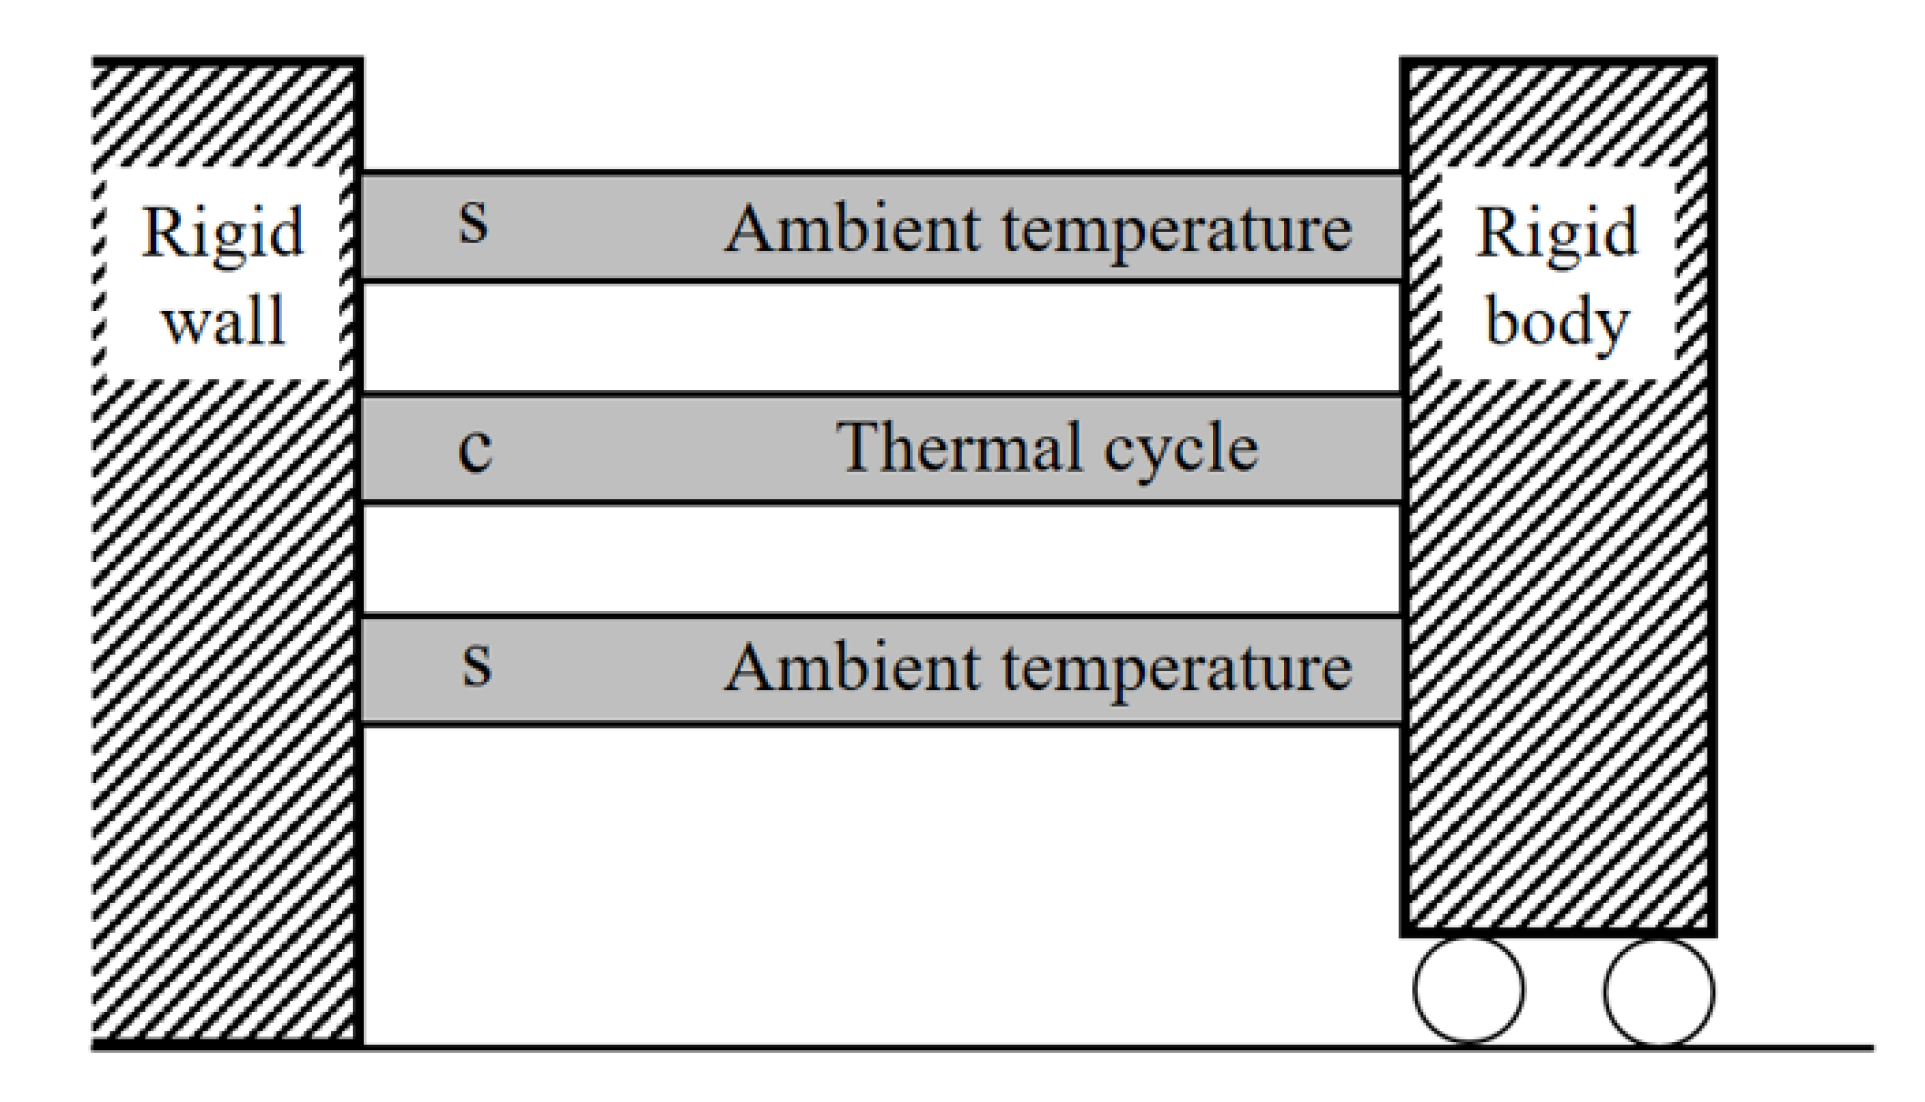
The WAAM process can be divided into two stages: heating and cooling. Stress and strain will evolve during these two stages. The thermal expansion coefficient for H13 steel is 1.3 × 10⁵ °C−1 and the melting point is 1452 °C, so there will be a large amount of strain during the heating stage. In order of convenience, the specimens were simplified by a constrained bar model as shown in Figure 9. C-bar represented the area affected by thermal recycle, which was shown as deposition pass and the adjacent region in WAAM. S-bar represented the base metal, which restricted the expansion and shrinkage of c-bar during heating and cooling. The cross-sectional areas of c-bar and s-bar were A and A0/2, respectively.
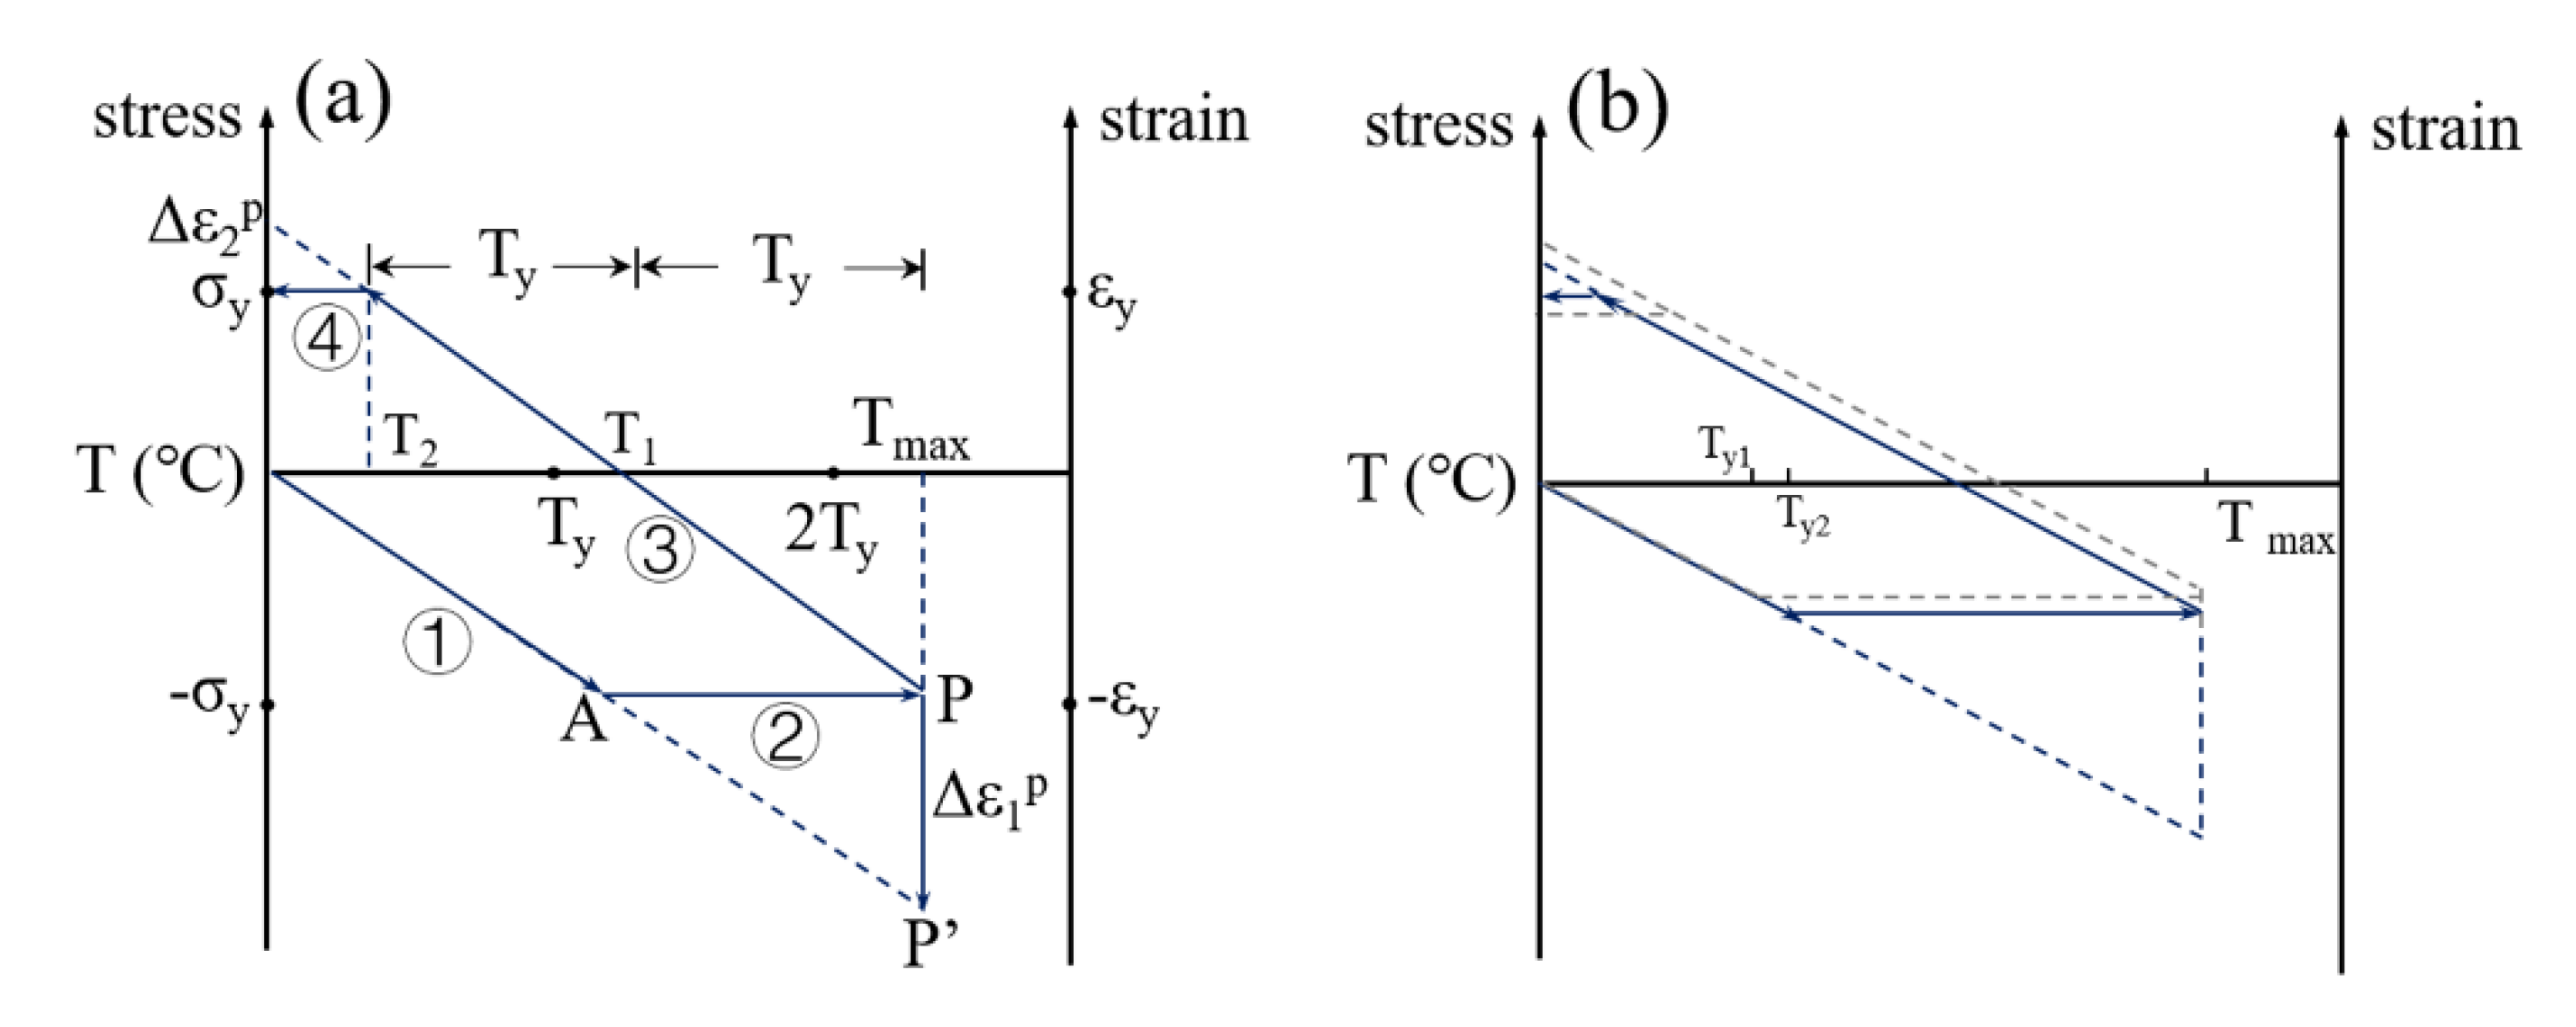
The stress and strain evolution with respect to temperature are presented in Figure 10a. During the deposition of individual passes, as shown in Figure 10a, a compressive elastic strain was generated until the c-bar yielded at temperature Ty (step 1). The yield temperature could be calculated by the following relationship:
T y = σ y β E A + A 0 A 0
The c-bar had already yielded when the temperature reached Tmax and the thermal strain was transformed into compressive plastic strain (Step 2) due to constraint of the s-bar. The plastic strain generated in the heating stage was:
Δ ε 1 p = β ( T max T y )
The c-bar would shrink during the cooling stage, as shown in steps 3 and 4. The compressive stress gradually relieved until the temperature cooled down to T1. Afterwards, tensile stress increased until cooling down to T2 (Step 3). The c-bar had already yielded in Step 4, which resulted in the thermal strain becoming plastic tensile strain due to constraint from the s-bar. The plastic strain generated in this stage was:
Δ ε 2 p = β ( T max 2 T y )
During the whole thermal cycle of the c-bar, compressive plastic strain and tensile plastic strain were generated in the heating and cooling stages, respectively. Eventually, the sum of the compressive and tensile strain was retained as the residual plastic strain, which was called inherent strain by Ma et al. [24,25].
ε = Δ ε 1 p + Δ ε 2 p = β T y
It can be seen from Equation (8) that ε* is a function of yield temperature Ty.
Different thermal behaviors in the heating stage resulted in different cumulative distortion between Case 1 and Case 2. When the part was deposited using the sequence pattern, temperature between the adjacent passes was higher than that using the symmetry pattern. When the first pass was deposited, the area around the pass was heated up before the deposition of the subsequent passes. The adjacent region of the first pass was heated up again due to inadequate heat dissipation during the deposition of subsequent pass in Case 1, which resulted in the two passes experiencing almost the same thermal recycle in a short period of time, while a relatively lower temperature between adjacent passes resulting from sufficient heat dissipation occurred in Case 2. Therefore, the cross-sectional area Acase1 of the c-bar in Case 1 (shown in Figure 9) was greater than that of Acase2 in Case 2 during deposition of every single pass. According to Equations (5) and (8), yield temperature (Ty) increased with the cross-sectional Acase1 in the c-bar, and thus resulted in a higher ε in Case 1, as shown in Figure 10b. The higher S value of Case 1 than Case 2 listed in Table 4 could be explained by the increase of ε .

4.3. Effect of Structure Features

Spiral patterns accumulated more heat than raster patterns, while the S value of Case 4 decreased about 68% more than Case 1. The existence of passes along the y-direction in the spiral patterns (Cases 3 and 4) was the most significant difference compared with raster patterns (Cases 1 and 2). Mukherjee et al. [22] proposed that the thermal distortion was related to strain parameter, ε0:
ε 0 = β Δ TtH 3 / 2 EIF ρ
F = α τ w 2 = α V L
The process parameters and materials used in this study were the same for all cases, which meant that the ε0 was determined by the characteristic time (t) and the moment of inertia of the substrate (I), which was usually used to describe the nature of the section to resist bending. Taking Case 1 and Case 4 as examples, the deposition time of Case 1 was 30% longer than Case 4, while the moment of inertia of Case 4 was larger by more than 11% over Case 1 after the deposition of each pass. For example, by calculating after the deposition of the first pass, the moments of inertia of Case 1 and Case 4 were 9.04 × 106 mm4 and 10.07 × 106 mm4, respectively. After completing half of the first layer, the moments of inertia of Case 1 and Case 4 were 9.51 × 106 mm4 and 10.97 × 106 mm4, respectively. The ability of the substrate to resist bending distortion was enhanced by the increased moment of inertia of the substrate. By balancing the bending moment of the work piece, a 91% reduction in longitudinal distortion could be obtained in large AM parts [21]. In addition, yield temperature (Ty) would be reduced by the increase of resistance of substrate to thermal distortion, as proposed by Li et al. [15]. Therefore, the inherent strain would be lower, resulting in smaller distortion when spiral patterns were used to deposit.
As demonstrated above, a 68.6% reduction in distortion could be obtained using the out–in pattern, which is higher than the 62.7% reduction by using an island pattern [26] but lower than the 83.2% reduction by using the rolling technique [5]. Although this technique is effective in reducing distortion, the accuracy of the part is decreased due to post-treatment.

4.4. Application of Inherent Strain Analysis

Three groups of different cooling conditions (natural cooling, 25 °C water-cooling and 5 °C water-cooling) were set up for the cooling experiment. The substrate was mounted on the water-cooling fixture, as shown in Figure 11. A thermostatic water tank was used to keep a constant temperature of the cooling water. Sequence pattern was used in the water-cooling experiment for distinct distortion.
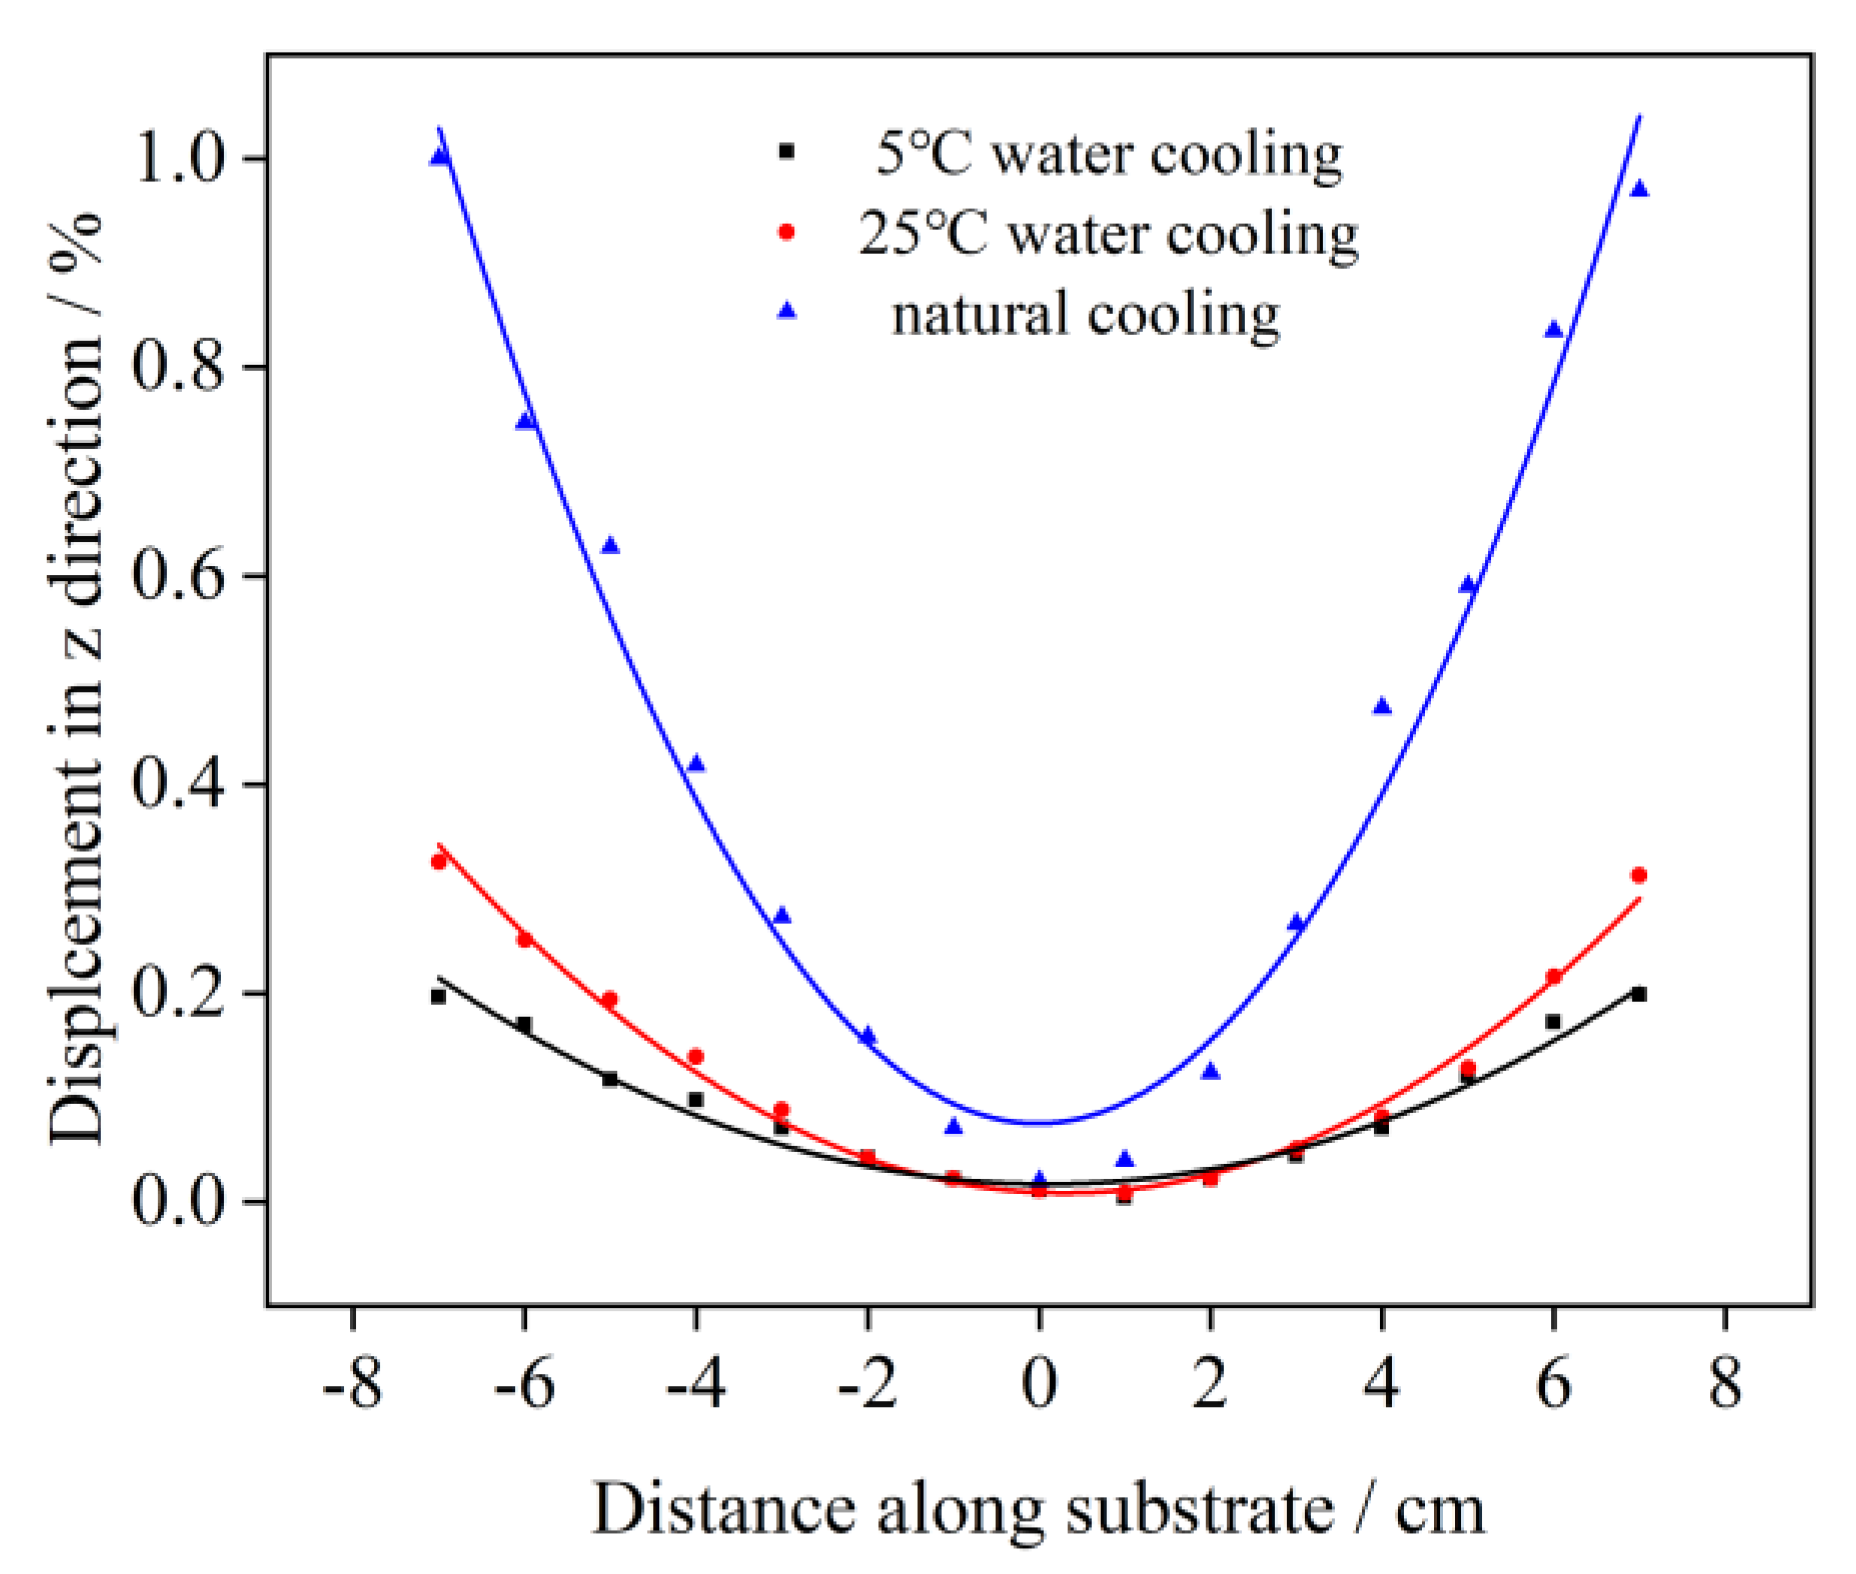
Figure 12 shows the results for the distortion of the specimens in different conditions. The displacement in the z-direction was normalized in order to visually compare the difference in distortion. Compared with natural cooling, distortion could be reduced by 77.6% when 5 °C water-cooling was employed. Owing to the rapid cooling produced by circulating water, the effect of direct cooling helped accelerate the cooling rate of the molten pool, contributing to a lower temperature in the molten pool and surrounding area, and thus a narrower weld bead (area A). According to Equations (5) and (8), inherent strain decreases with reduction of the cross-sectional area of the c-bar, as shown in Figure 10b.

5. Conclusions

Part distortion was investigated by WAAM technology under four kinds of deposition patterns: sequence, symmetry, in–out and out–in. The thermal behavior, in situ distortion and postprocess distortion were studied. The effect of inertia moment and inherent strain theory were introduced to explain the reason for the reduction in distortion when symmetry, in–out and out–in deposition patterns were used to deposit. The conclusions are summarized as follows:
  • The highest peak temperature of 598 °C was obtained in the center of the substrate when the out–in pattern was employed, and severe temperature fluctuations occurred near the free end of the substrate in the sequence pattern.
  • The distortion accumulated with deposition time using raster patterns (Cases 1 and 2). For spiral patterns (Cases 3 and 4), the distortion accumulated from previous layers could be decreased by about 14%, caused by the passes deposited near the center of the substrate.
  • The S value was proposed to evaluate the distortion for all cases. For raster patterns, the distortion could be decreased by reducing the heated area. A 39.1% reduction of distortion could be obtained by the symmetry pattern. For spiral patterns, the existence of the passes along the y-direction increased the moment of inertia, resulting in enhancement of the ability of the substrate to resist bending distortion. A 68.6% reduction of distortion could be obtained by the out–in pattern.
  • Additional water-cooling lead to the least distortion. By reducing the heated area and forming a narrower weld bead, a 77.6% maximum reduction of distortion could be obtained when 5 °C cooling water was used.

Author Contributions

Conceptualization, J.L. and Z.X.; methodology, J.L.; software, X.L.; formal analysis, X.L.; investigation, X.L.; resources, J.L. and H.F.; data curation, X.L.; writing—original draft preparation, X.L.; writing—review and editing, X.L., J.L. and Z.X.; visualization, X.L.; supervision, Y.Z.; project administration, J.L.; funding acquisition, J.L. All authors have read and agreed to the published version of the manuscript.

Funding

This research was funded by the National Key Research and Development Program of China (2017YFB1104803), the National Natural Science Foundation of China (51005004) and the Beijing Natural Science Foundation (3212001).

Institutional Review Board Statement

Not applicable.

Informed Consent Statement

Not applicable.

Data Availability Statement

The data presented in this study are available in the article.

Conflicts of Interest

The authors declare no conflict of interest.

Nomenclature

ε*Inherent strain
εyYield strain
σyYield stress
βCoefficient of thermal expansion
TyYield temperature
Ty1Yield temperature for Case 1
Ty2Yield temperature for Case 2
ACross-sectional areas of c-bar
A0/2Cross-sectional areas of s-bar
EYoung’s modulus
TmaxMaximum temperature
ρDensity of the alloy wire
αThermal diffusivity
tCharacteristic time
HHeat input per unit length
IMoment of inertia of the substrate
FFourier number
ΔtMaximum rise in temperature

References

  1. Michel, F.; Lockett, H.; Ding, J.; Martina, F.; Marinelli, G. A modular path planning solution for Wire + Arc Additive Manufacturing. Robot. Comput. Int. Manuf. 2019, 60, 1–11. [Google Scholar] [CrossRef]
  2. Ding, D.; Pan, Z.; Cuiuri, D.; Li, H. A tool-path generation strategy for wire and arc additive manufacturing. Int. J. Adv. Manuf. Technol. 2014, 73, 173–183. [Google Scholar] [CrossRef] [Green Version]
  3. Gu, J.; Ding, J.; Williams, S.W.; Gu, H.; Ma, P. The effect of inter-layer cold working and post-deposition heat treatment on porosity in additively manufactured aluminum alloys. J. Mater. Process. Technol. 2016, 230, 26–34. [Google Scholar] [CrossRef]
  4. Calleja, A.; Tabernero, I.; Ealo, J.A.; Campa, F.J.; Lamikiz, A.; de Lacalle, L.N.L. Feed rate calculation algorithm for the homogeneous material deposition of blisk blades by 5-axis laser cladding. Int. J. Adv. Manuf. Technol. 2014, 74, 1219–1228. [Google Scholar] [CrossRef]
  5. Hönnige, J.R.; Colegrove, P.A.; Ganguly, S.; Eimer, E. Control of residual stress and distortion in aluminium wire + arc additive manufacture with rolling. Addit. Manuf. 2018, 22, 775–783. [Google Scholar] [CrossRef] [Green Version]
  6. Wu, B.T.; Pan, Z.X.; Ding, D.; Cuiuri, D.; Li, H. A review of the wire arc additive manufacturing of metals: Properties, defects and quality improvement. J. Manuf. Process. 2018, 35, 127–139. [Google Scholar] [CrossRef]
  7. Panwisawas, C.; Tang, Y.T.; Reed, R.C. Metal 3D printing as a disruptive technology for superalloys. Nat. Commun. 2020, 11, 1–4. [Google Scholar] [CrossRef]
  8. Aurrekoetxea, M.; López De Lacalle, L.N.; Llanos, I. Machining Stresses and Initial Geometry on Bulk Residual Stresses Characterization by On-Machine Layer Removal. Materials 2020, 13, 1445. [Google Scholar] [CrossRef] [Green Version]
  9. Lu, X.F.; Lin, X.; Michele, C. In-situ measurements and thermo-mechanical simulation of Ti-6Al-4V laser solid forming processes. Int. J. Mech. Sci. 2019, 153–154, 119–130. [Google Scholar] [CrossRef]
  10. Denlinger, E.R.; Heigel, J.C.; Michaleris, P. Effect of inter-layer dwell time on distortion and residual stress in additive manufacturing of titanium and nickel alloys. J. Mater. Process. Technol. 2015, 215, 123–131. [Google Scholar] [CrossRef]
  11. Lu, X.F.; Lin, X.; Chiumenti, M.; Cervera, M.; Li, J.; Ma, L. Finite element analysis and experimental validation of the thermomechanical behavior in laser solid forming of Ti-6Al-4V. Addit. Manuf. 2018, 21, 30–40. [Google Scholar] [CrossRef]
  12. Xie, R.; Chen, G.; Zhao, Y.; Zhang, S.; Yan, W. In-situ observation and numerical simulation on the transient strain and distortion prediction during additive manufacturing. J. Manuf. Process. 2019, 38, 494–501. [Google Scholar] [CrossRef]
  13. Cheng, B.; Shrestha, S.; Chou, K. Stress and deformation evaluations of scanning strategy effect in selective laser melting. Addit. Manuf. 2016, 12, 240–251. [Google Scholar]
  14. Chen, K.; Wang, X.; Li, Y. Numerical Simulation of WAAM Temperature Field under Water Cooling. Mater. Rep. 2021, 35, 4165–4169. [Google Scholar]
  15. Tomków, J.; Sobota, K.; Krajewski, S. Influence of Tack Welds Distribution and Welding Sequence on the Angular Distortion of TIG Weld Joint. Facta. Univ. Ser. Mech. Eng. 2020, 18, 611–621. [Google Scholar]
  16. Nie, Z.; Wang, G.; Mcguffin-Cawley, J.D.; Narayanan, B.; Zhang, S. Experimental study and modeling of H13 steel deposition using laser hot-wire additive manufacturing. J. Mater. Process. Technol. 2016, 235, 171–186. [Google Scholar] [CrossRef]
  17. Yu, J.; Lin, X.; Ma, L.; Wang, J.; Fu, X. Influence of laser deposition patterns on part distortion, interior quality and mechanical properties by laser solid forming (LSF). Mater. Sci. Eng. A 2011, 528, 1094–1104. [Google Scholar] [CrossRef]
  18. Gao, M.; Wang, Z.; Li, X.; Zeng, X. The effect of deposition patterns on the deformation of substrates during direct laser fabrication. J. Eng. Mater. Technol. 2013, 135, 034502. [Google Scholar] [CrossRef]
  19. Wu, B.T.; Pan, Z.; Chen, G.; Ding, D.; Yuan, L.; Cuiuri, D. Mitigation of thermal distortion in wire arc additively manufactured Ti6Al4V part using active interpass cooling. Sci. Technol. Weld. Join. Addit. Manuf. 3D Print. 2019, 24, 484–494. [Google Scholar] [CrossRef]
  20. Li, F.; Chen, S.; Shi, J.; Zhao, Y. In-process control of distortion in wire and arc additive manufacturing based on a flexible multi-point support fixture. Sci. Technol. Weld. Join. 2019, 24, 36–42. [Google Scholar] [CrossRef]
  21. Denlinger, E.R.; Michaleris, P. Mitigation of distortion in large additive manufacturing parts. Proc. Inst. Mech. Eng. Part B 2015, 231, 983–993. [Google Scholar] [CrossRef]
  22. Mukherjee, T.; Manvatkar, V.; De, A.; DeRoy, T. Mitigation of thermal distortion during additive manufacturing. Scr. Mater. 2017, 127, 79–83. [Google Scholar] [CrossRef] [Green Version]
  23. Rodríguez-Barrero, S.; Fernández-Larrinoa, J.; Azkona, I.; López De Lacalle, L.N.; Polvorosa, R. Enhanced Performance of Nanostructured Coatings for Drilling by Droplet Elimination. Mater. Manuf. Process. 2016, 31, 593–602. [Google Scholar] [CrossRef]
  24. Ma, N.; Wang, J.; Okumoto, Y. Out-of-plane welding distortion prediction and mitigation in stiffened welded structures. Int. J. Adv. Manuf. Technol. 2016, 84, 1371–1389. [Google Scholar] [CrossRef]
  25. Yukio, U.; Murakawa, H.; Ma, N. Introduction to Measurement and Prediction of Residual Stresses with the Help of Inherent Strains. In Welding Deformation and Residual Stress Prevention; Butterworth-Heinemann: Oxford, UK, 2012; pp. 35–53. [Google Scholar] [CrossRef]
  26. Lu, X.; Lin, X.; Ma, L.; Cao, Y. Effect of Scanning Path on Thermal-Mechanical Field of Laser Solid Forming TC4 Part. J. Mater. Eng. 2019, 47, 55–62. [Google Scholar]
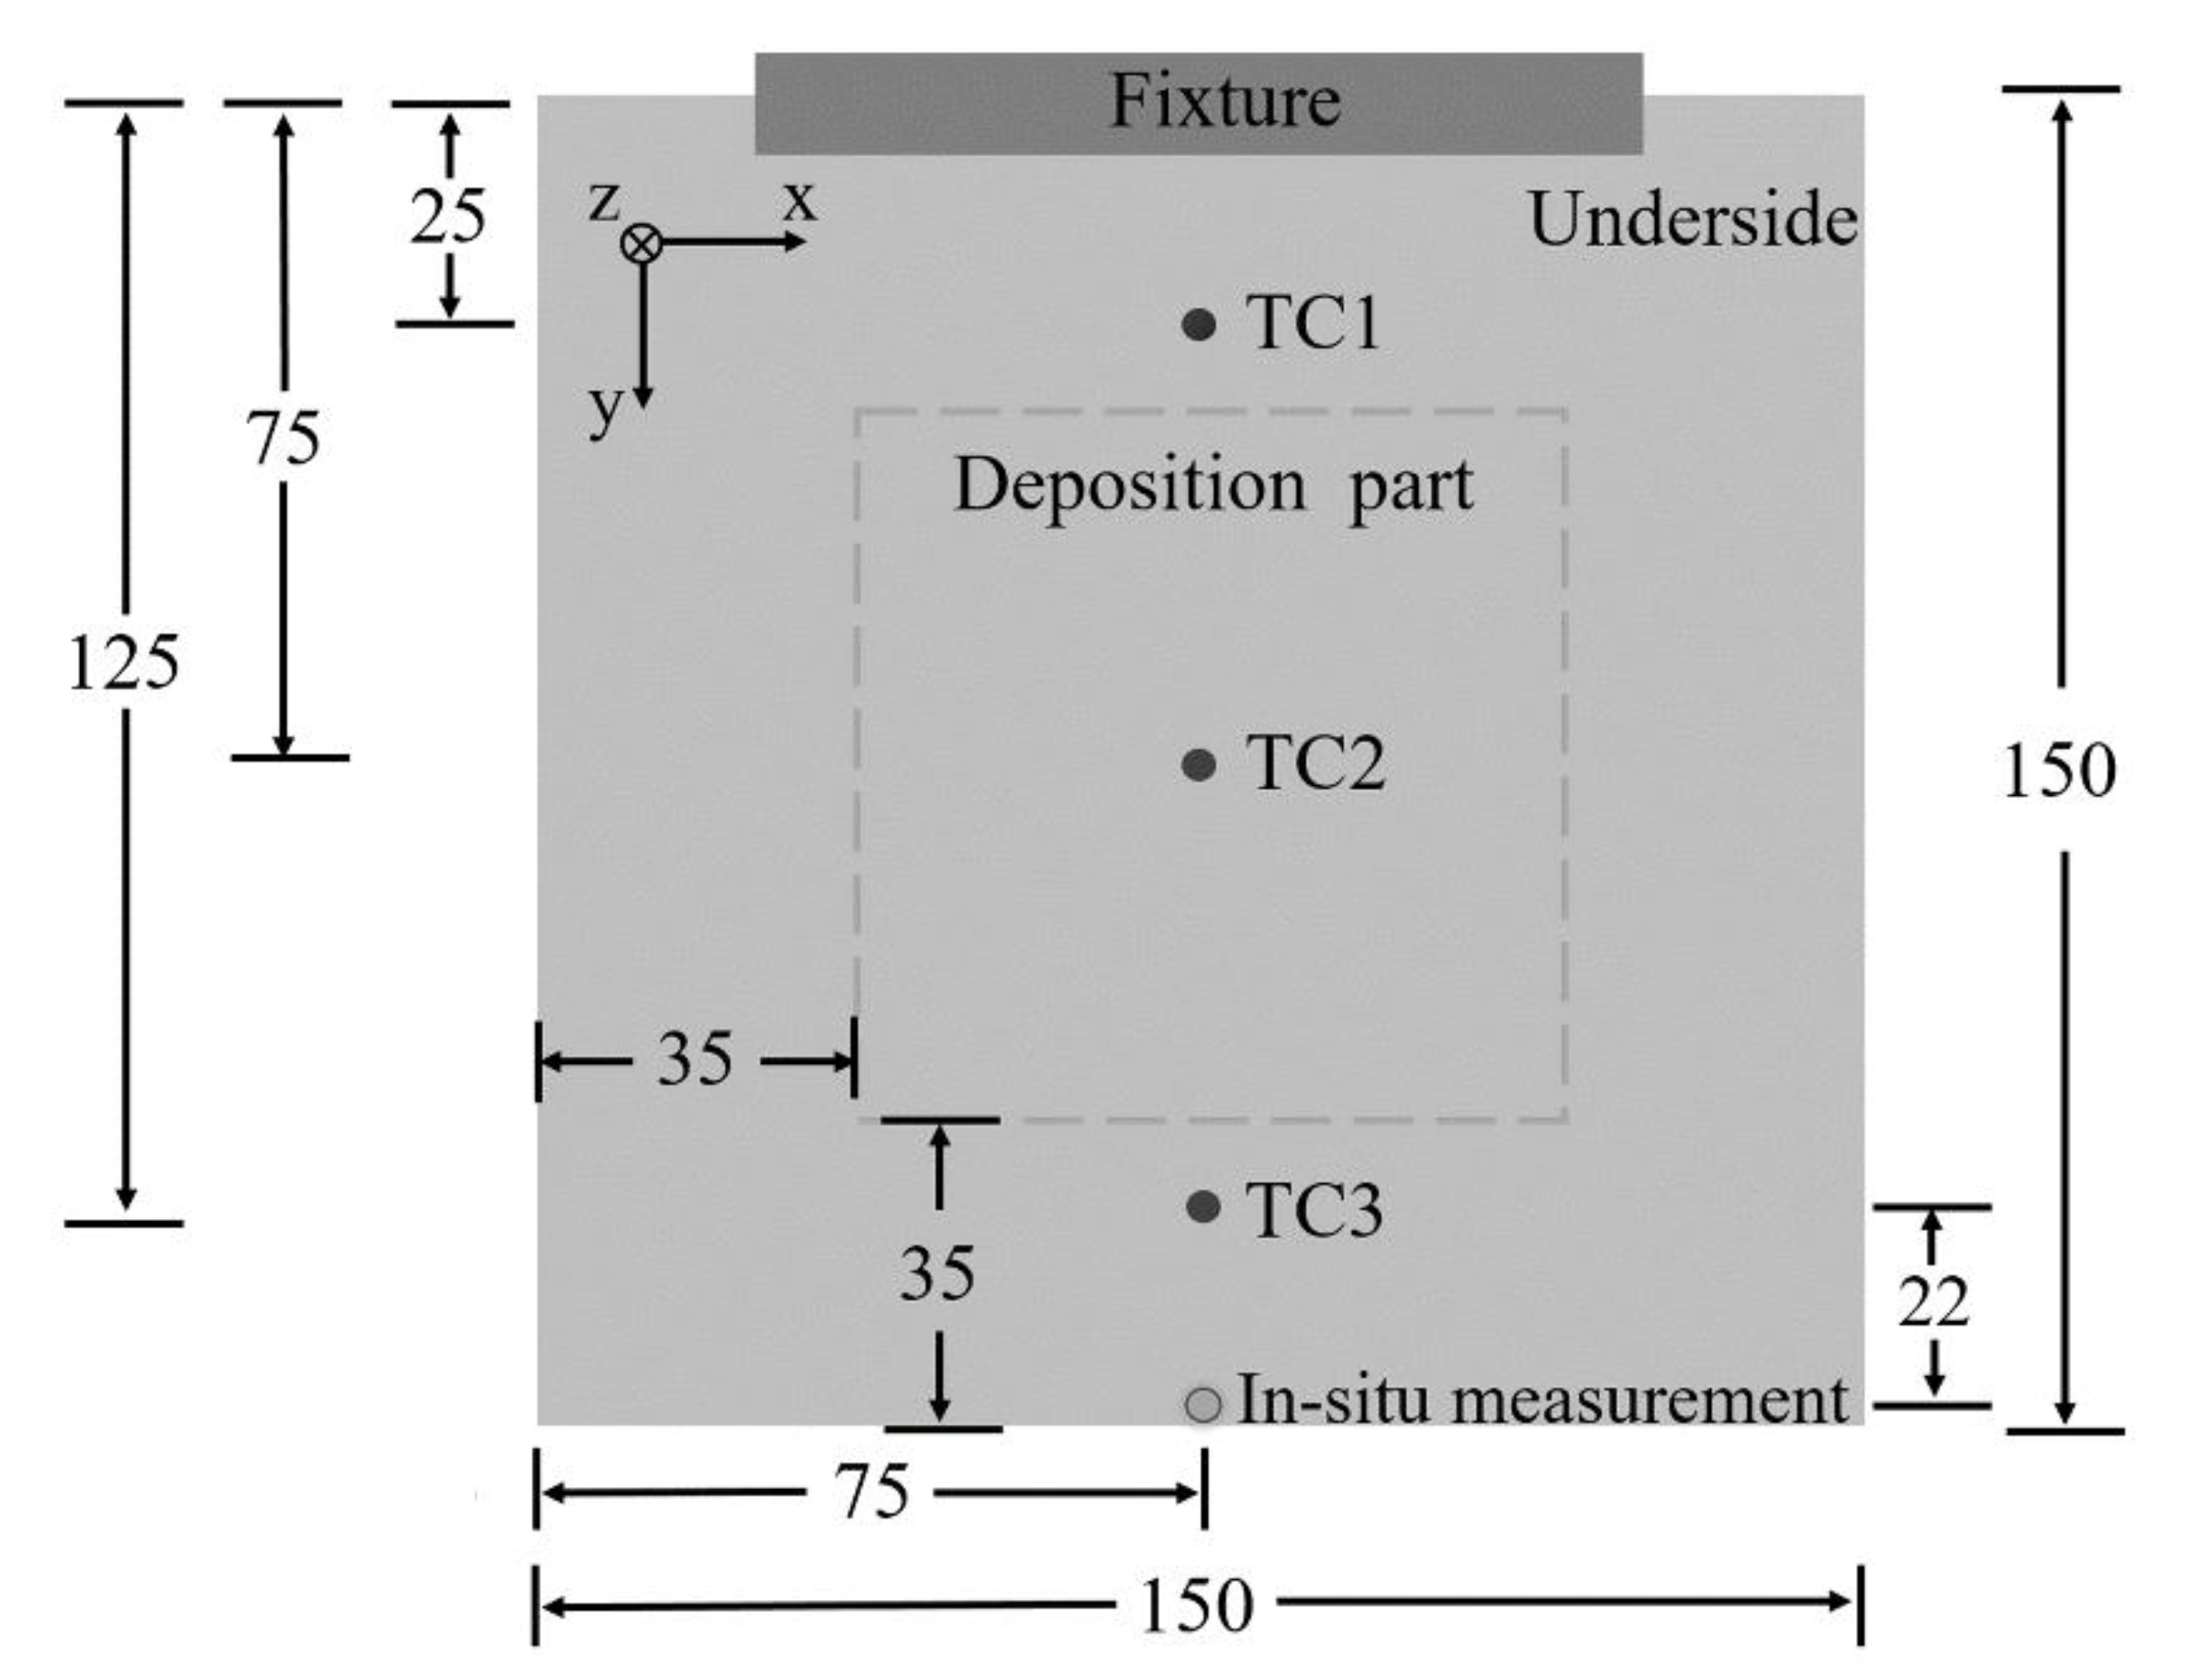
Figure 1. Position of temperature measurement and in situ measurement (unit: mm).
Metals 11 00485 g001
Figure 2. Schematic diagram of four deposition patterns (ad): sequence pattern, symmetry pattern, in–out pattern, out–in pattern; (e) part deposited by in–out pattern; (f) part deposited by out–in pattern).
Metals 11 00485 g002
Figure 3. Setup for the in situ measurement: (a) schematic diagram; (b) machine setup for in situ measurement of distortion.
Metals 11 00485 g003
Figure 4. Schematic diagram of measuring points of substrate distortion after deposition (unit: mm).
Metals 11 00485 g004
Figure 5. Temperature variation curves of four deposition patterns: (a) Case 1; (b) Case 2; (c) Case 3; (d) Case 4.
Metals 11 00485 g005
Figure 6. In situ distortion measurements of four deposition patterns: (a) Cases 1 and 2; (b) Cases 3 and 4.
Metals 11 00485 g006
Figure 7. Postprocess distortion of substrate of four patterns: (a) sequence pattern; (b) symmetry pattern; (c) in–out pattern; (d) out–in pattern.
Metals 11 00485 g007
Figure 8. Contribution of a single pass to the total distortion: (a) Case 1 and Case 2; (b) Case 3 and Case 4.
Metals 11 00485 g008
Figure 9. Simplified constrained bar model.
Metals 11 00485 g009
Figure 10. Stress and strain evolution with respect to temperature: (a) Case1; (b) Case2.
Metals 11 00485 g010
Figure 11. Schematic diagram for the water-cooling experiment.
Metals 11 00485 g011
Figure 12. Distortion in different cooling conditions.
Metals 11 00485 g012
Table 1. Distortion of substrate under different AM technics.
Deposited MaterialsAM TechnicsThickness of SubstrateStructure of PartMaximum Distortion Literature
H13LHW19 mmBlock2.52 mm[16]
Ti6Al4VLBM12.7 mmWall2.07 mm[10]
Inconel® 6252.76 mm
AlSi-316LLSM8 mmBlock7.03 mm[17]
Ti6Al4VLSM6 mmWall3.37 mm[11]
IN718DLF5 mmCylinder9.37 mm[18]
Table 2. Chemical composition of H13 wire and Q345 substrate.
ElementCSPSiMnCrMoVFe
Substrate0.1300.0060.0160.2900.6500.0160.0030.001Bal.
Wire0.4500.0300.0300.8200.5004.7501.1000.800Bal.
Table 3. Parameters during deposition process.
Depositing ParametersDepositing SpeedDepositing CurrentDepositing VoltageWire Feed SpeedDistance Per PassDwelling Time Per Layer
Value0.2 m/min144 A19 V5 m/min5.75 mm300 s
Table 4. Results of S value and equation of the fitted plane for all deposition patterns.
Case NumberEquation of the Fitting PlaneS Value/mm
Case 10.0121x − 0.0127y − 0.9998z − 5.1119 = 090.4
Case 2−0.0134x − 0.00024y + 0.9999z + 6.732 = 054.92
Case 30.0062x − 0.0031y + z + 5.2682 = 030.54
Case 4−0.0074x − 0.0102y + 0.9999z + 7.2311 = 028.38
Publisher’s Note: MDPI stays neutral with regard to jurisdictional claims in published maps and institutional affiliations.