Abstract
Surface defects decrease the fatigue limit of metals. In this study, the effects of surface defects on the fatigue limit of high-strength spring steel specimens were investigated. Several equations to predict the fatigue limit of specimens with surface defects were evaluated. Specimens with a semicircular slit with depths ranging from 30 to 400 µm were prepared. The Vickers hardness of the specimen was approximately 470 HV. Bending fatigue tests were performed at stress ratios ranging from −2 to 0.4. The fatigue test results showed that the fatigue limit decreased with an increase in the slit depth. Moreover, the maximum defect size that resulted in a decrease in the fatigue limit was dependent on the stress ratio. On comparing the predicted fatigue limits with the experimental results, it was confirmed that the predictions made based on the modified El-Haddad model were in good agreement with the experimentally obtained data. Thus, this model can be used to evaluate the fatigue limit of high-strength steels containing small surface defects with different stress ratios.
1. Introduction
There is an increasingly strong demand for improving the fuel efficiency of automobiles from the viewpoints of energy consumption and environmental pollution [1]. For this, reductions in the weight of automobile parts such as springs, gears, and axles are necessary. This in turn requires improving the fatigue limit of the metals used. For improving the fatigue limit of metals, surface hardening via peening [2], heat treatment [3,4,5,6], and electron-beam treatment [7] are considered to be effective methods. However, it is known that the fatigue strength of high-strength steel is reduced sharply by small defects [8,9]. This is because the defect sensitivity of materials generally increases with their strength. Most of the fatigue fractures of springs and other parts are caused by small defects and nonmetallic inclusions [10]. If the fatigue limit of high-strength steel with such small defects can be predicted with high accuracy, it is expected that the failure of springs and other parts can be controlled. Many studies on the prediction of the fatigue limit of metals have been conducted. Further details are provided in Section 2.
Thus far, the effects of surface defects larger than 100 µm on the fatigue strength have been elucidated in spring steels [11,12,13], welded joints [14], and aluminum alloys [15]. These defects correspond to the machining scratches generated during the manufacturing of mechanical parts. However, in reality, nonmetallic inclusions or surface defects smaller than 100 µm play a significant role in reducing the fatigue limit [16,17]. In addition, mechanical parts such as springs are used under different stress ratios. It has been reported that the stress ratio has a significant effect on the fatigue strength of numerous metals such as alloy steels [18,19], spring steel [20], turbine blade steel [21], and stainless steel [22]. Therefore, it is necessary to predict the fatigue limit under a range of stress ratios. Several equations have been proposed for predicting the fatigue limit of metals [23,24,25] as described in Section 2. However, the effectiveness of the equations under several stress ratios is not clear.
In this study, semicircular slits with depths ranging from 30 to 400 µm were introduced in spring steel specimens, which were then subjected to plane-bending fatigue tests at stress ratios ranging from −2 to 0.4. In addition, the applicability of the various fatigue limit prediction equations was evaluated for defects with a range of dimensions and different stress ratios.
2. Equations for Predicting Fatigue Limit
A number of studies have analyzed the relationship between the size of the surface defects and the fatigue limit of metals. Figure 1 shows the Kitagawa–Takahashi diagram for the relationship between the fatigue limit, ∆σw, and the defect size, a, on a log-log graph [26]. The numbers in parentheses in the figure correspond to the equation numbers. Smith proposed a fatigue limit evaluation method based on a horizontal line that represents the fatigue limit of a defect-free specimen (∆σw0) and a straight line with a slope of −1/2 based on linear fracture mechanics. This method is described by Equation (1) [23]:
where is the threshold-stress-intensity-factor range for specimens with long cracks, and F is the shape factor for a surface crack. However, in the vicinity of the intersection of these two straight lines, the fatigue limits predicted using this model are often incorrect.
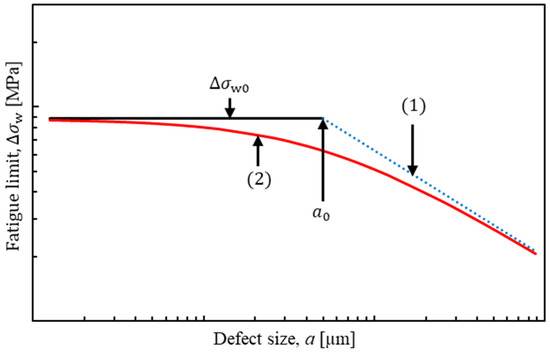
Figure 1.
Relationship between the fatigue limit and the defect size.
El-Haddad et al. proposed Equation (2), which describes a smooth transition from the fatigue limit of a smooth specimen (∆σw0) to the threshold for long cracks, , using a fictious intrinsic crack with the size [24]:
Murakami et al. proposed the prediction equation of fatigue limit called the parameter model. Based on this model, the fatigue limit of metals in the presence of small cracks and defects can be predicted using only three parameters: the square root of the projection area of a small crack or defect to the principal stress direction (), Vickers hardness (HV), and stress ratio (R) [25]. Equation (3) shows the corresponding fatigue-limit prediction equation for metals with surface cracks or defects:
where is the stress amplitude of the fatigue limit, HV is the Vickers hardness of the material, R is the stress ratio, and γ is the material constant. When the fatigue limit is defined by the stress range , Equation (3) is transformed into Equation (4):
Equation (4) is represented by the dashed line in Figure 2. The numbers in parentheses in the figure correspond to the equation numbers. The horizontal axis is expressed by . Murakami showed that there exists a relationship between the tensile stress σ, , and the maximum stress intensity factor for a surface crack, [27]:
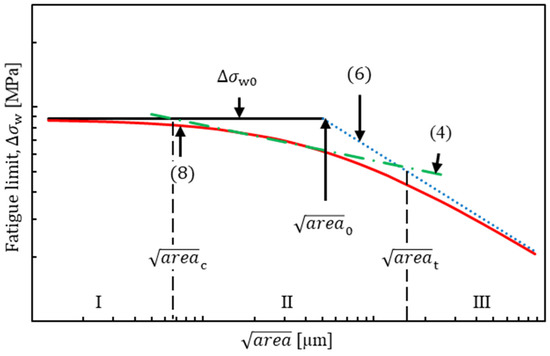
Figure 2.
Relationship between fatigue limit and of the defect.
For evaluating , in Equation (5) becomes , and σ is equal to . Therefore, Equation (5) is transformed into Equation (6), which is represented by the dotted line in Figure 2:
In this figure, c is the critical defect size, which causes a decrease in the fatigue limit of the smooth specimen , and is the transitional defect size, which lies between those of small and large defects. In other words, it is the size above, which the value of becomes a constant, . is determined by the hardness of the material and at R = −1 using Equation (7), regardless of the stress ratio [28]:
Equation (4) is applicable for values between and . Equation (2) can also be expressed as . Equation (8) is the modified El-Haddad model proposed by Beretta et al. [29]:
Using Equation (6), the intersection between and the threshold for long cracks corresponding to the so-called El-Haddad parameter,, can be described as follows:
The applicability of these equations for a wide range of stress ratios has not been verified. Thus, in this study, the applicability of Equations (4), (6), and (8) for a wide range of defect dimensions and stress ratios was verified.
When predicting the fatigue limit using Equation (8), and must be known, and these values change with the stress ratio, R. The stress ratio dependence of was evaluated using the modified Goodman line, which is described by Equation (10):
is the mean stress, and is the tensile strength of the metals. Because R depends on , can be derived for each R value by determining experimentally. In this study, the stress ratio dependence of was derived from the results of a plane-bending fatigue test. Then, the applicability of Equation (10) was evaluated. In addition, the following relationship exists between R and [30]:
where γ is the material constant mentioned in Equations (3) and (4). In this study, γ was derived from the results of a plane-bending fatigue test performed on a material with an artificial surface defect with a depth of 400 µm, as described later, and was predicted for each stress ratio.
3. Experimental Method
3.1. Material Used
The test material used was spring steel (JIS SUP9A). Table 1 shows the chemical composition of SUP9A as provided on the mill sheet prepared by the steel manufacturer. The process for fabricating the test specimens is shown in Figure 3. The shape and dimensions of the specimens are shown in Figure 4. The thickness of the specimens was 3 mm. The surfaces of the specimens were machined by grinding in the longitudinal direction. To introduce crack-like surface defects, a semicircular slit (see Figure 4) was formed through electric discharge machining on the surfaces of some of the specimens (one slit for each specimen). The depth of these semicircular slits was 30, 60, or 400 µm, and they were introduced perpendicular to the longitudinal direction on the surface of the smallest cross-section of the specimens. The aspect ratio a/c of the slits was 1.0. The width of the slits was 30 µm. Kondo et al. showed that the ΔKth of high-strength steel with a crack length larger than 400 µm could be regarded as the [31]. Thus, the 400-µm deep slit simulated a large defect for deriving . The specimens without a slit are hereafter called smooth specimens while those with a slit are called slit specimens. After the introduction of the slit, the specimens were heat-treated at 860 °C for 45 min in a vacuum and then quenched in oil. Subsequently, the specimens were tempered at 460 °C for one hour. The ultimate tensile strength () and 0.2% offset yield strength () of SUP9A after the heat treatment were 1580 and 1170 MPa, respectively.

Table 1.
Chemical composition of SUP9A (mass%).

Figure 3.
Flowchart of the process for fabricating test specimens.
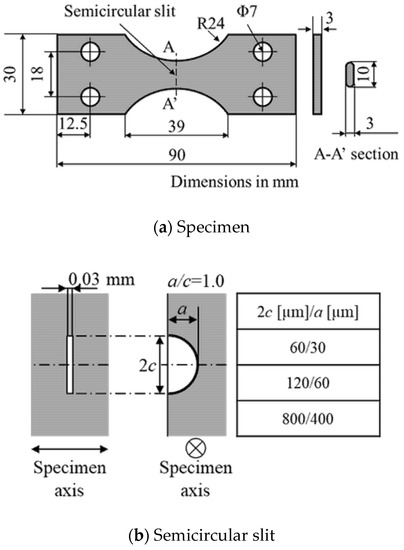
Figure 4.
Shape and dimensions of the test specimens and the semicircular slit. (a) specimen (b) semicircular slit.
3.2. Surface Hardness and Roughness
The hardness values of the specimens were measured using a micro Vickers hardness tester (HMV-G, Shimadzu Co., Kyoto, Japan). The test load was 9.8 N, and the test time was 15 s. In each case, measurements were performed three times on each smooth specimen before the fatigue test.
In addition, the surface roughness of the specimens was measured using a stylus-type surface roughness measuring machine (SE1200, Kosaka Laboratory Ltd., Tokyo, Japan). The surface roughness of all the smooth and slit specimens were evaluated seven times for an evaluation length of 2.0 mm at three different locations on each specimen. The average value was used as the measurement result. The measured parameters were the arithmetic mean roughness, Ra, and the maximum height of the roughness, Ry.
3.3. Fatigue Test
Using the above-described specimens, plane-bending fatigue tests were performed in air at room temperature. A displacement-controlled plane-bending fatigue test equipment (PBF-30, Tokyo Koki Co. Ltd., Tokyo, Japan) was used for the fatigue test. The stress ratios, R, used were −1, 0, 0.2, and 0.4. In addition to these ratios, an R value of −2 was also used for the 400-µm slit specimen to evaluate over a wider range of stress ratios. A total of 3 to 5 specimens were used for each of the 17 experimental conditions. The frequency of the cyclic stress was 20 Hz. The stress was defined as the nominal stress on the surface of the smallest cross-section of the specimen. The fatigue limit was defined as the maximum stress range for which the specimen could withstand 107 cycles.
3.4. Observations of Fracture Surface
To identify the origin of the fatigue crack, the fracture surface was observed. The fractured specimens were cut approximately 5 mm from the fracture surface and cleaned ultrasonically in ethanol. The fracture surfaces then were observed using scanning electron microscopy (SEM) (VE-8800, Keyence Ltd., Osaka, Japan).
4. Results and Discussion
4.1. Result of Surface Hardness and Roughness
The average Vickers hardness of the specimens was approximately 470 HV. The average values of the surface roughness, Ra and Ry, were 0.170 and 1.293 µm, respectively. Thus, the surface roughness was sufficiently smaller than the depths of the introduced slits, and the effect of the surface roughness on the fatigue limit could be ignored in this study.
4.2. Fatigue Test Results
Figure 5 shows the S–N curve for each stress ratio as determined from the plane-bending fatigue tests. It can be seen from the figure that the fatigue limit decreased as the slit size increased. Table 2 shows the ratio of the fatigue limits of the slit and smooth specimens, that is, /, for each stress ratio. It can be noted that the rate of decrease in the fatigue limit owing to the defects decreased as the stress ratio was increased. The fatigue limit of the 30-µm-slit specimen was lower than that of the smooth specimen at R = −1, 0, and 0.2; however, it was equivalent to that of the smooth specimen at R = 0.4. Therefore, it can be said that a semicircular slit with a depth of 30 µm did not decrease the fatigue limit of the smooth specimen at R = 0.4. Based on this, it can be concluded that the defect size that results in a decrease in the fatigue limit of smooth specimens is dependent on the stress ratio.
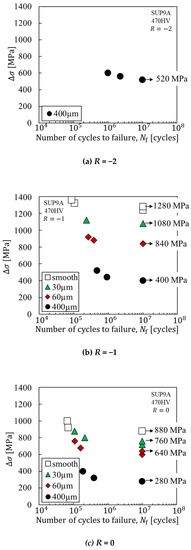
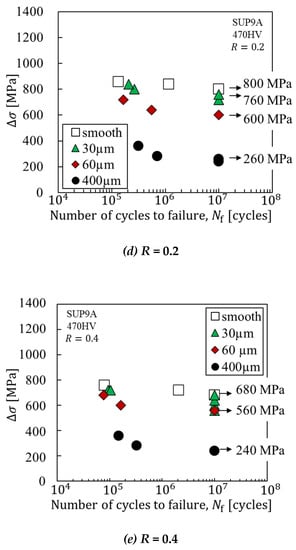
Figure 5.
S–N curves for plane-bending fatigue tests. (a) R = −2, (b) R = −1, (c) R = 0, (d) R = 0.2, (e) R = 0.4.

Table 2.
Ratios of the fatigue limits of the slit and smooth specimens .
4.3. Effect of Stress Ratio on Fatigue Limit and
The effects of the stress ratio on the fatigue limit of a smooth specimen and are discussed separately. Figure 6 is a fatigue-limit diagram showing the effects of the mean stress (stress ratio) on the fatigue limit. The plots in the figure show the value at each stress ratio. The solid line is the modified Goodman line evaluated by Equation (10). The dashed lines are the yield-limit lines. The and the tensile strength (,) used in the modified Goodman line are 640 and 1580 MPa, respectively. The 0.2% offset-yield strength () used for the yield-limit lines is 1170 MPa. It can be seen from the figure that the modified Goodman line is in good agreement with the experimental results. Thus, the value at each stress ratio can be predicted by the modified Goodman line.
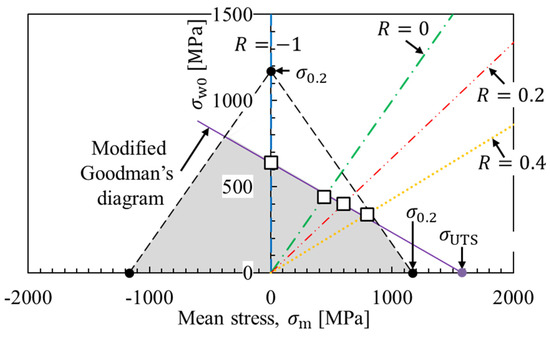
Figure 6.
Fatigue limit diagram for smooth specimens.
Fatigue tests on the 400 µm slit specimen, which simulated large defects, were also conducted to determine the at each stress ratio. The values of were calculated using the fatigue limits of the 400-µm-slit specimen and Equation (6). Figure 7 shows the relationship between the stress ratio and . It can be seen that there is a linear relationship between and (1-R) on the log-log graph. This relationship can be approximated using the following equation:
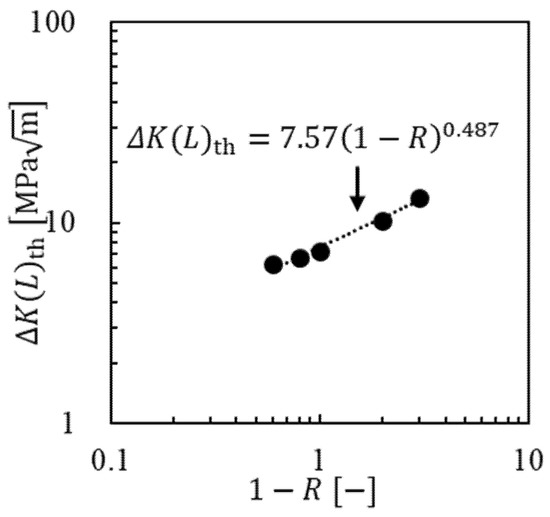
Figure 7.
Relationship between and (a = 400 µm).
From Equation (12), it can be seen that the value of at R = 0 is 7.57 MPa . This is close to the value (7.5 MPa ) obtained in a previous study ΔK decreasing test [11]. Therefore, the 400-µm-deep semicircular slit can be considered a macroscopic defect. The value of γ in Equation (11) was taken to be 0.483 in this study. On the other hand, Furuya et al. reported that γ = 0.5 for large cracks in two types of spring steels (SUP12 and SWOSC-V) [32]. The values obtained in this study were similar to those reported by Furuya et al. for the two spring steels.
4.4. Observations of Fracture Surface
Figure 8 shows SEM images of the fracture surfaces of the specimens fractured by the plane-bending fatigue test at R = −1. The fatigue crack was initiated at the slit in all the slit specimens, while for the smooth specimens the fatigue crack was initiated at the surface. No inclusions were observed on the fracture surfaces of the smooth specimens. Finally, similar results were obtained for R = −2, 0, 0.2, and 0.4.
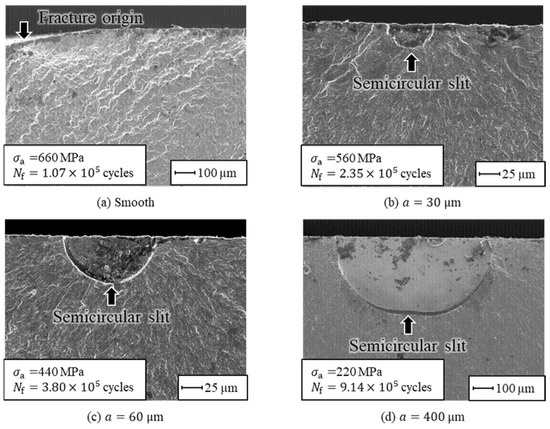
Figure 8.
Surfaces of fatigue-fractured specimens . (a) Smooth, (b) a = 30 µm, (c) a = 60 µm, (d) a = 400 µm.
5. Prediction of Fatigue Limit
The fatigue limit predictions were performed using Equations (4), (6), and (8). Table 3 shows the and values for each of the stress ratios used for the predictions. The values are the results of the fatigue tests of the smooth specimens. The values were calculated using Equation (12). Figure 9 shows the relationship between and the fatigue limit for each stress ratio. The experimental values are plotted. On the other hand, the values predicted by the parameter model (i.e., Equation (4)) are represented by the dashed line, those predicted by Equation (6) are represented by the dotted line, and those predicted by the modified El-Haddad equation (i.e., Equation (8)) are represented by the solid line. The diagonal lines indicate the fatigue limits for 100-, 200-, and 300-µm-slit specimens obtained in previous studies [11,12,33].

Table 3.
and values for various stress ratios.
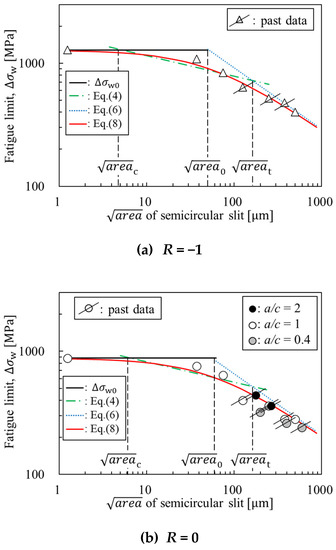
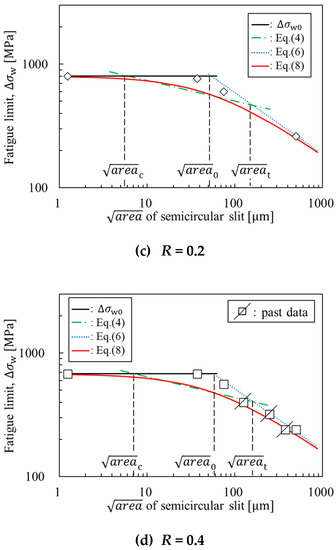
Figure 9.
Relationship between the fatigue limit and the for the specimens with a semicircular slit. (a) R = −1, (b) R = 0, (c) R = 0.2, (d) R = 0.4.
Table 4 shows the values of , , and . The values of and are the largest at R = 0.4. In addition, is determined by the hardness of the material and at R = −1 using Equation (7), regardless of the stress ratio used. For the spring steel (SUP9A) used in this study, =163 μm.

Table 4.
Values of the critical defect size intrinsic crack with size , and transitional defect size .
Equation (4) yielded values close to the experimental value for dimensions between and , but for the dimensions greater than , it yielded non-conservative values with respect to the experimental results. This equation is very useful for predicting the fatigue limit based on the hardness of the material, but it should be noted that there is a limit of applicability in the range of .
Furthermore, the values obtained using Equation (6) were close to the upper limit of the experimental data, and the obtained results for values close to were highly non-conservative with respect to the experimental results.
On the other hand, the values obtained using Equation (8) were close to the experimental data for a wide range of values. Thus, this model can be used to evaluate the fatigue limit of high-strength steels containing small surface defects.
The usefulness of the modified El-Haddad’s equation for fatigue-limit prediction has been reported by Beretta et al. [29]. However, the applicability of this equation to a wide range of stress ratios has not been clarified. In this study, the usefulness of the modified El-Haddad’s equation was clarified for a wide range of defect dimensions and stress ratios.
6. Conclusions
In this study, plane-bending fatigue tests were performed on specimens of spring steel SUP9A (470 HV) at various stress ratios wherein the specimens had semicircular slits with depths of 30 to 400 µm that simulated microsized surface defects. Furthermore, the fatigue limit was predicted based on three different fatigue limit prediction equations. The primary conclusions of the study can be summarized as follows:
- (1)
- As the stress ratio increased from −1 to 0.4, the fatigue limit decreased under all slit conditions due to mean stress. The rate of decrease in the fatigue limit owing to the defects decreased as the stress ratio was increased.
- (2)
- Based on the test results for the smooth specimen and the 400-µm slit specimen, the stress-ratio dependence of the fatigue limit of the smooth specimen, , and the threshold-stress-intensity factor range, , of the investigated spring steel could be determined.
- (3)
- The results of the fatigue tests showed that the fatigue limit decreased as the defect size was increased, irrespective of the stress ratio. In the case of the 30 µm slit specimen, the fatigue limit did not decrease from only at R = 0.4. Thus, we found that the dimensions of the surface defects that did not result in a decrease in the fatigue limit were dependent on the stress ratio.
- (4)
- The modified El-Haddad’s equation, i.e., Equation (8), yielded values close to the experimental data for a wide range of values and stress ratios. Murakami’s equation, that is, Equation (4), yielded values close to the experimental data between and , but above it yielded non-conservative values with respect to the experimental results. Smith’s equation, that is, Equation (6), yielded highly non-conservative values near . Thus, the usefulness of the modified El-Haddad’s equation was clarified for a wide range of defect dimensions and stress ratios.
Author Contributions
Conceptualization, K.T.; data curation, T.I.; investigation, T.I.; project administration, T.I. and K.T.; writing—original draft, T.I.; writing—review and editing, K.T. All authors have read and agreed to the published version of the manuscript.
Funding
This research received no external funding.
Data Availability Statement
Data are contained within the article.
Acknowledgments
The authors express our appreciation to Hideki Okada, NHK Spring Co., Ltd., for the fabricating test specimens.
Conflicts of Interest
The authors declare no conflict of interest.
Nomenclature
| stress range (twice stress amplitude) | |
| fatigue limit | |
| fatigue limit of smooth specimen | |
| mean stress | |
| ultimate tensile strength | |
| 0.2% offset yield strength | |
| maximum stress intensity factor | |
| threshold stress intensity factor range for long crack | |
| shape factor | |
| defect size | |
| intrinsic defect size | |
| square root of the area projected in the direction of principal stress | |
| of critical defects which decrease the fatigue limit | |
| of the transition defect between small and large defects | |
| of intrinsic defect | |
| HV | Vickers hardness |
| stress ratio | |
| material constant | |
| a/c | aspect ratio |
| arithmetic mean roughness | |
| maximum height of roughness |
References
- Zhang, Y.; Lai, X.; Zhu, P.; Wang, W. Lightweight design of automobile component using high strength steel based on dent resistance. Mater. Des. 2006, 27, 64–68. [Google Scholar] [CrossRef]
- Tekeli, S. Enhancement of fatigue strength of SAE 9245 steel by shot peening. Mater. Lett. 2002, 57, 604–608. [Google Scholar] [CrossRef]
- Misaka, Y.; Kawasaki, K.; Komotori, J.; Shimizu, M. Fatigue strength of ferritic ductile cast iron hardened by super rapid induction heating and quenching. Mater. Trans. 2004, 45, 2930–2935. [Google Scholar] [CrossRef][Green Version]
- Akita, M.; Tokaji, K. Effect of carburizing on notch fatigue behaviour in AISI 316 austenitic stainless steel. Surf. Coat. Technol. 2006, 200, 6073–6078. [Google Scholar] [CrossRef]
- Sugimoto, K.; Hojo, T.; Mizuno, Y. Torsional fatigue strength of newly developed case hardening TRIP-aided steel. Metals 2017, 7, 375. [Google Scholar] [CrossRef]
- Yamada, Y.; Hirohito, E.; Takahashi, K. Influence of crystal structure of nitride compound layer on torsion fatigue strength of alloy steel. Metals 2019, 9, 1352. [Google Scholar] [CrossRef]
- Gromov, V.E.; Gorbunov, S.V.; Ivanov, Y.F.; Vorobiev, S.V.; Konovalov, S.V. Formation of surface gradient structural-phase states under electron-beam treatment of stainless steel. J. Surf. Investig. 2011, 5, 974–978. [Google Scholar] [CrossRef]
- Murakami, Y.; Yamashita, Y. Prediction of life and scatter of fatigue failure originated at nonmetallic inclusions. Procedia Eng. 2014, 74, 6–11. [Google Scholar] [CrossRef]
- Furuya, Y.; Matsuoka, S.; Abe, T. A novel inclusion inspection method employing 20 kHz fatigue testing. Metall. Mater. Trans. A 2003, 34, 2517–2526. [Google Scholar] [CrossRef]
- Das, S.K.; Mukhopadhyay, N.K.; Kumar, B.R.; Bhattacharya, D.K. Failure analysis of a passenger car coil spring. Eng. Fail. Anal. 2007, 14, 158–163. [Google Scholar] [CrossRef]
- Takahashi, K.; Amano, T.; Ando, K.; Takahashi, F. Improvement of fatigue limit by shot peening for high—Strength steel containing a crack-like surface defect. Int. J. Struct. Integr. 2011, 2, 281–292. [Google Scholar] [CrossRef]
- Yasuda, J.; Takahashi, K.; Okada, H. Improvement of fatigue limit by shot peening for high-strength steel containing a crack-like surface defect: Influence of stress ratio. Int. J. Struct. Integr. 2014, 5, 45–59. [Google Scholar] [CrossRef]
- Takahashi, K.; Nakagawa, M.; Koike, H.; Okada, H. Improvement of torsional fatigue limit and rendering surface defect harmless by shot peening for spring steel. J. Phys. Conf. Ser. 2017, 842, 12066. [Google Scholar] [CrossRef]
- Fueki, R.; Takahashi, K.; Handa, M. Fatigue limit improvement and rendering defects harmless by needle peening for high tensile steel welded joint. Metals 2019, 9, 143. [Google Scholar] [CrossRef]
- Takahashi, K.; Kogishi, Y.; Shibuya, N.; Kumeno, F. Effects of laser peening on the fatigue strength and defect tolerance of aluminum alloy. Fatigue Fract. Eng. Mater. Struct. 2020, 43, 845–856. [Google Scholar] [CrossRef]
- Liu, P.; Li, W.; Nehila, A.; Sun, Z.; Deng, H. High cycle fatigue property of carburized 20Cr gear steel under axial loading. Metals 2016, 6, 246. [Google Scholar] [CrossRef]
- Gu, C.; Wang, M.; Bao, Y.; Wang, F.; Lian, J. Quantitative analysis of inclusion engineering on the fatigue property improvement of bearing steel. Metals 2019, 9, 476. [Google Scholar] [CrossRef]
- Pallarés-Santasmartas, L.; Albizuri, J.; Avilés, A.; Avilés, R. Mean stress effect on the axial fatigue strength of DIN 34CrNiMo6 quenched and tempered steel. Metals 2018, 8, 213. [Google Scholar] [CrossRef]
- Pawliczek, R.; Rozumek, D. The effect of mean load for S355J0 steel with increased strength. Metals 2020, 10, 209. [Google Scholar] [CrossRef]
- Schuller, R.; Karr, U.; Irrasch, D.; Fitzka, M.; Hahn, M.; Bacher-Höchst, M.; Mayer, H. Mean stress sensitivity of spring steel in the very high cycle fatigue regime. J. Mater. Sci. 2015, 50, 5514–5523. [Google Scholar] [CrossRef]
- Kovacs, S.; Beck, T.; Singheiser, L. Influence of mean stresses on fatigue life and damage of a turbine blade steel in the VHCF-regime. Int. J. Fatigue 2013, 49, 90–99. [Google Scholar] [CrossRef]
- Schönbauer, B.M.; Yanase, K.; Endo, M. The influence of various types of small defects on the fatigue limit of precipitation-hardened 17–4PH stainless steel. Theor. Appl. Fract. Mech. 2017, 87, 35–49. [Google Scholar] [CrossRef]
- Smith, R.A. On the short crack limitations of fracture mechanics. Int. J. Fract. 1977, 13, 717–720. [Google Scholar] [CrossRef]
- El Haddad, M.H.; Topper, T.H.; Smith, K.N. Prediction of non propagating cracks. Eng. Fract. Mech. 1979, 11, 573–584. [Google Scholar] [CrossRef]
- Murakami, Y.; Endo, M. A geometrical parameter for the quantitative estimation of the effects of small defects on fatigue strength of metals. Trans. Jpn. Soc. Mech. Eng. 1983, 49, 127–136. [Google Scholar] [CrossRef]
- Kitagawa, H.; Takahashi, S. Fracture-mechanics study of the growth of small crack and its threshold. Trans. Jpn. Soc. Mech. Eng. 1979, 45, 1289–1303. [Google Scholar] [CrossRef]
- Murakami, Y. Analysis of stress intensity factors of modes I, II and III for inclined surface cracks of arbitrary shape. Eng. Fract. Mech. 1985, 22, 101–114. [Google Scholar] [CrossRef]
- Schönbauer, B.M.; Mayer, H. Effect of small defects on the fatigue strength of martensitic stainless steels. Int. J. Fatigue 2019, 127, 362–375. [Google Scholar] [CrossRef]
- Beretta, S.; Carboni, M.; Madia, M. Modelling of fatigue thresholds for small cracks in a mild steel by “Strip-Yield” model. Eng. Fract. Mech. 2009, 76, 1548–1561. [Google Scholar] [CrossRef]
- Klesnil, M.; Lukáš, P. Effect of stress cycle asymmetry on fatigue crack growth. Mater. Sci. Eng. 1972, 9, 231–240. [Google Scholar] [CrossRef]
- Yanagihara, K.; Ohyanagi, S.; Kubota, M.; Sakae, C.; Kondo, Y. Effect of crack size, stress ratio and hydrogen on the near threshold fatigue crack propagating strength steel. J. Soc. Mat. Sci. Jpn. 2005, 54, 1237–1243. [Google Scholar] [CrossRef]
- Furuya, Y.; Abe, T. Effect of mean stress on fatigue properties of 1800MPa-class spring steels. Mater. Des. 2011, 32, 1101–1107. [Google Scholar] [CrossRef]
- Nakagawa, M.; Takahashi, K.; Osada, T.; Okada, H.; Koike, H. Improvement in fatigue limit by shot peening for high-strength steel containing crack-like surface defect (influence of surface crack aspect ratio). Trans. Jpn. Soc. Spring 2014, 59, 13. [Google Scholar]
Publisher’s Note: MDPI stays neutral with regard to jurisdictional claims in published maps and institutional affiliations. |
© 2021 by the authors. Licensee MDPI, Basel, Switzerland. This article is an open access article distributed under the terms and conditions of the Creative Commons Attribution (CC BY) license (http://creativecommons.org/licenses/by/4.0/).