Article

Hot Deformation Behavior and Constitutive Analysis of As-Extruded Mg–6Zn–5Ca–3Ce Alloy Fabricated by Rapid Solidification

1
College of Material Science and Engineering, Chongqing University of Technology, Chongqing 400054, China
2
Southwest Technology and Engineering Research Institute, Chongqing 400039, China
*
Authors to whom correspondence should be addressed.
Metals 2021, 11(3), 480; https://doi.org/10.3390/met11030480
Submission received: 27 February 2021 / Revised: 10 March 2021 / Accepted: 11 March 2021 / Published: 14 March 2021

Abstract

:
The plasticity of Mg–6Zn–5Ca–3Ce alloy fabricated by rapid solidification (RS) at room temperature is poor due to its hexagonal-close-packed (HCP) structure. Therefore, hot deformation of RS Mg–6Zn–5Ca–3Ce alloy at elevated temperature would be a major benefit for manufacturing products with complex shapes. In the present study, hot deformation behavior of as-extruded Mg–6Zn–5Ca–3Ce alloy fabricated by RS was investigated by an isothermal compression test at a temperature (T) of 573–673 K and strain rate ( ε ˙ ) of 0.0001–0.01 s−1. Results indicated that the flow stress increases along with the declining temperature and the rising strain rate. The flow stress behavior was then depicted by the hyperbolic sine constitutive equation where the value of activation energy (Q) was calculated to be 186.3 kJ/mol. This issue is mainly attributed to the existence of fine grain and numerous second phases, such as Mg2Ca and Mg–Zn–Ce phase (T’ phase), acting as barriers to restrict dislocation motion effectively. Furthermore, strain compensation was introduced to incorporate the effect of plastic strain on material constants ( α , Q , n , ln A ) and the predicted flow stresses under various conditions were roughly consistent with the experimental results. Moreover, the processing maps based on the Murty criterion were constructed and visualized to find out the optimal deformation conditions during hot working. The preferential hot deformation windows were identified as follows: T = 590–640 K, ε ˙ = 0.0001–0.0003 s−1 and T = 650–670 K, ε ˙ = 0.0003–0.004 s−1 for the studied material.

1. Introduction

Magnesium (Mg) alloys, which exhibit low density, high specific stiffness, high specific strength as well as good damping properties, have great potential for applications in many aspects, such as aerospace, automobile, and 3C industries [1,2,3]. Among them, Mg–Zn (Zinc) alloys have been termed as one of the most promising alloys, as they possess superior strength, plasticity and corrosion resistance owing to the formation of metastable phase (MgZn2 and Mg2Zn3) [4]. In recent years, alloying, known as a popular approach to improve the properties of magnesium alloys, has also been the focus of research on Mg–Zn alloys. Ping et al. [5] reported that Ca (calcium) element was beneficial to the refinement of grain size and its addition would significantly improve the mechanical properties and the bio-corrosion properties of Mg–Zn–Ca alloys. Moreover, the addition of Ce (Cerium) in Mg–Zn–Ca alloys resulted in the formation of a new Mg–Zn–Ce phase (T’ phase) in as-cast state, which contributes to high strength of Mg alloys [6,7]. Therefore, additions of Ca/Ce into Mg–Zn alloys surely possess great potential for practical applications of Mg alloy with enhanced mechanical properties.
Recently, rapid solidification (RS) has been treated as a superior method to refine the grain sizes and participations. Therefore, it benefits in modifying the comprehensive properties of Mg alloys. According to the previous study, the grain size of RS Mg–6Zn–5Ca alloy was refined significantly and the number of finely dispersed particles increased substantially, contributing to the compressive strength of the alloy up to 408 MPa at ambient temperature [8]. In addition, RS improved the mechanical properties of the Mg–Zn–Ca–Ce alloys at elevated temperatures due to the formation of meta-stable phases, such as Mg2Ca and Mg12Ce [4]. The aforementioned merits made RS Mg–6Zn–5Ca–3Ce alloy a potential Mg alloy. However, the subsequent processing capability of RS Mg–Zn–Ca–Ce alloy is still limited due to inadequate slip systems at ambient temperature [9,10,11] and plentiful hard-brittle phases [4]. Fortunately, as the temperature increases, the workability of Mg alloys will be improved greatly owing to the activation of non-basal slip [12] and grain boundary slip [13]. Nowadays, many studies have been performed to investigate the hot deformation behavior of Mg–Zn–X alloy [14,15,16,17,18,19,20,21]. Liu et al. [17] calculated the activation energy of the casted Mg–3Zn–Ca–0.5Sr alloy (250.44 kJ/mol) and drew the processing map with a peak power dissipation efficiency of 42%, which was observed at 603–633 K and 0.005–0.03 s−1. Gao et al. [18] researched the stress–strain curves of the Mg–2.3Zn–0.4Mn–0.2Ce alloy and concluded that the alloy exhibited a typical dynamic recrystallization (DRX) behavior with a single peak stress. Ma et al. [19] studied the thermal deformation mechanism of an extruded Mg–16Al alloy and identified the appropriate deformation window, where the temperature range was 633–673 K and the strain rate range was 0.001–0.1 s−1. Wang et al. [20] reported that many fine grains were introduced by DRX around the coarse grains at 200 °C and 1 s−1, increasing the engineering strain and promoting the work hardening.
However, few research works have been conducted previously with respect to flow behavior and workability of Mg–Zn–Ca–Ce alloys during hot deformation, especially for RS Mg–Zn–Ca–Ce alloys, which hinders their engineering application. Thus, understanding the hot deformation behavior and formulating some appropriate hot working conditions of RS Mg–Zn–Ca–Ce alloys are of great importance. In the present study, the true strain-stress curves of RS Mg–Zn–Ca–Ce alloy were firstly obtained by thermal compression experiments. Afterwards, constitutive equations and processing maps were calculated and constructed to investigate the deformation behavior and to identify the optimal processing window of the studied material.

2. Material and Methods

The Mg alloy with a composition of Mg–6Zn–5Ca–3Ce was produced by RS using pure (99.9%) magnesium, calcium, zinc, and cerium, and its chemical composition is shown in Table 1. The as-received RS flakes were hot pressed at 573 K in an Ar (Argon) atmosphere. Then, the hot-pressed billets were extruded in a YJ32-315A four-column hydraulic press (Jiangdong Machinery Co., Ltd., Chongqing, China) through a cylindrical die of 50 mm inner diameter at an extrusion speed of 0.1 mm/min, temperature of 653 K, and an extrusion ratio of 39:1.
The compressive specimens were machined with a diameter of 7 mm and a height of 10.5 mm along the extrusion direction. The process of thermal hot compression and the dimensions of specimen were schematically illustrated in Figure 1. Uniaxial compression tests were conducted at the temperature of 573 K, 623 K and 673 K as well as the strain rates of 0.0001 s−1, 0.001 s−1 and 0.01 s−1 on the Gleeble-1500 thermo-mechanical simulator (Data Science International, INC, St. Paul, MN, USA). Graphite lubricant was applied on surfaces between the specimen and press parts to guarantee good friction condition. All specimens were then deformed to the total true strain of 0.7. Before compression, the specimens were heated to deformation temperatures at a heating rate of 5 K/s and then held for 300 s in order to obtain a stable and uniform temperature. In addition, for an easier understanding, the physical quantities and abbreviations encountered in this study are listed in Table 2.
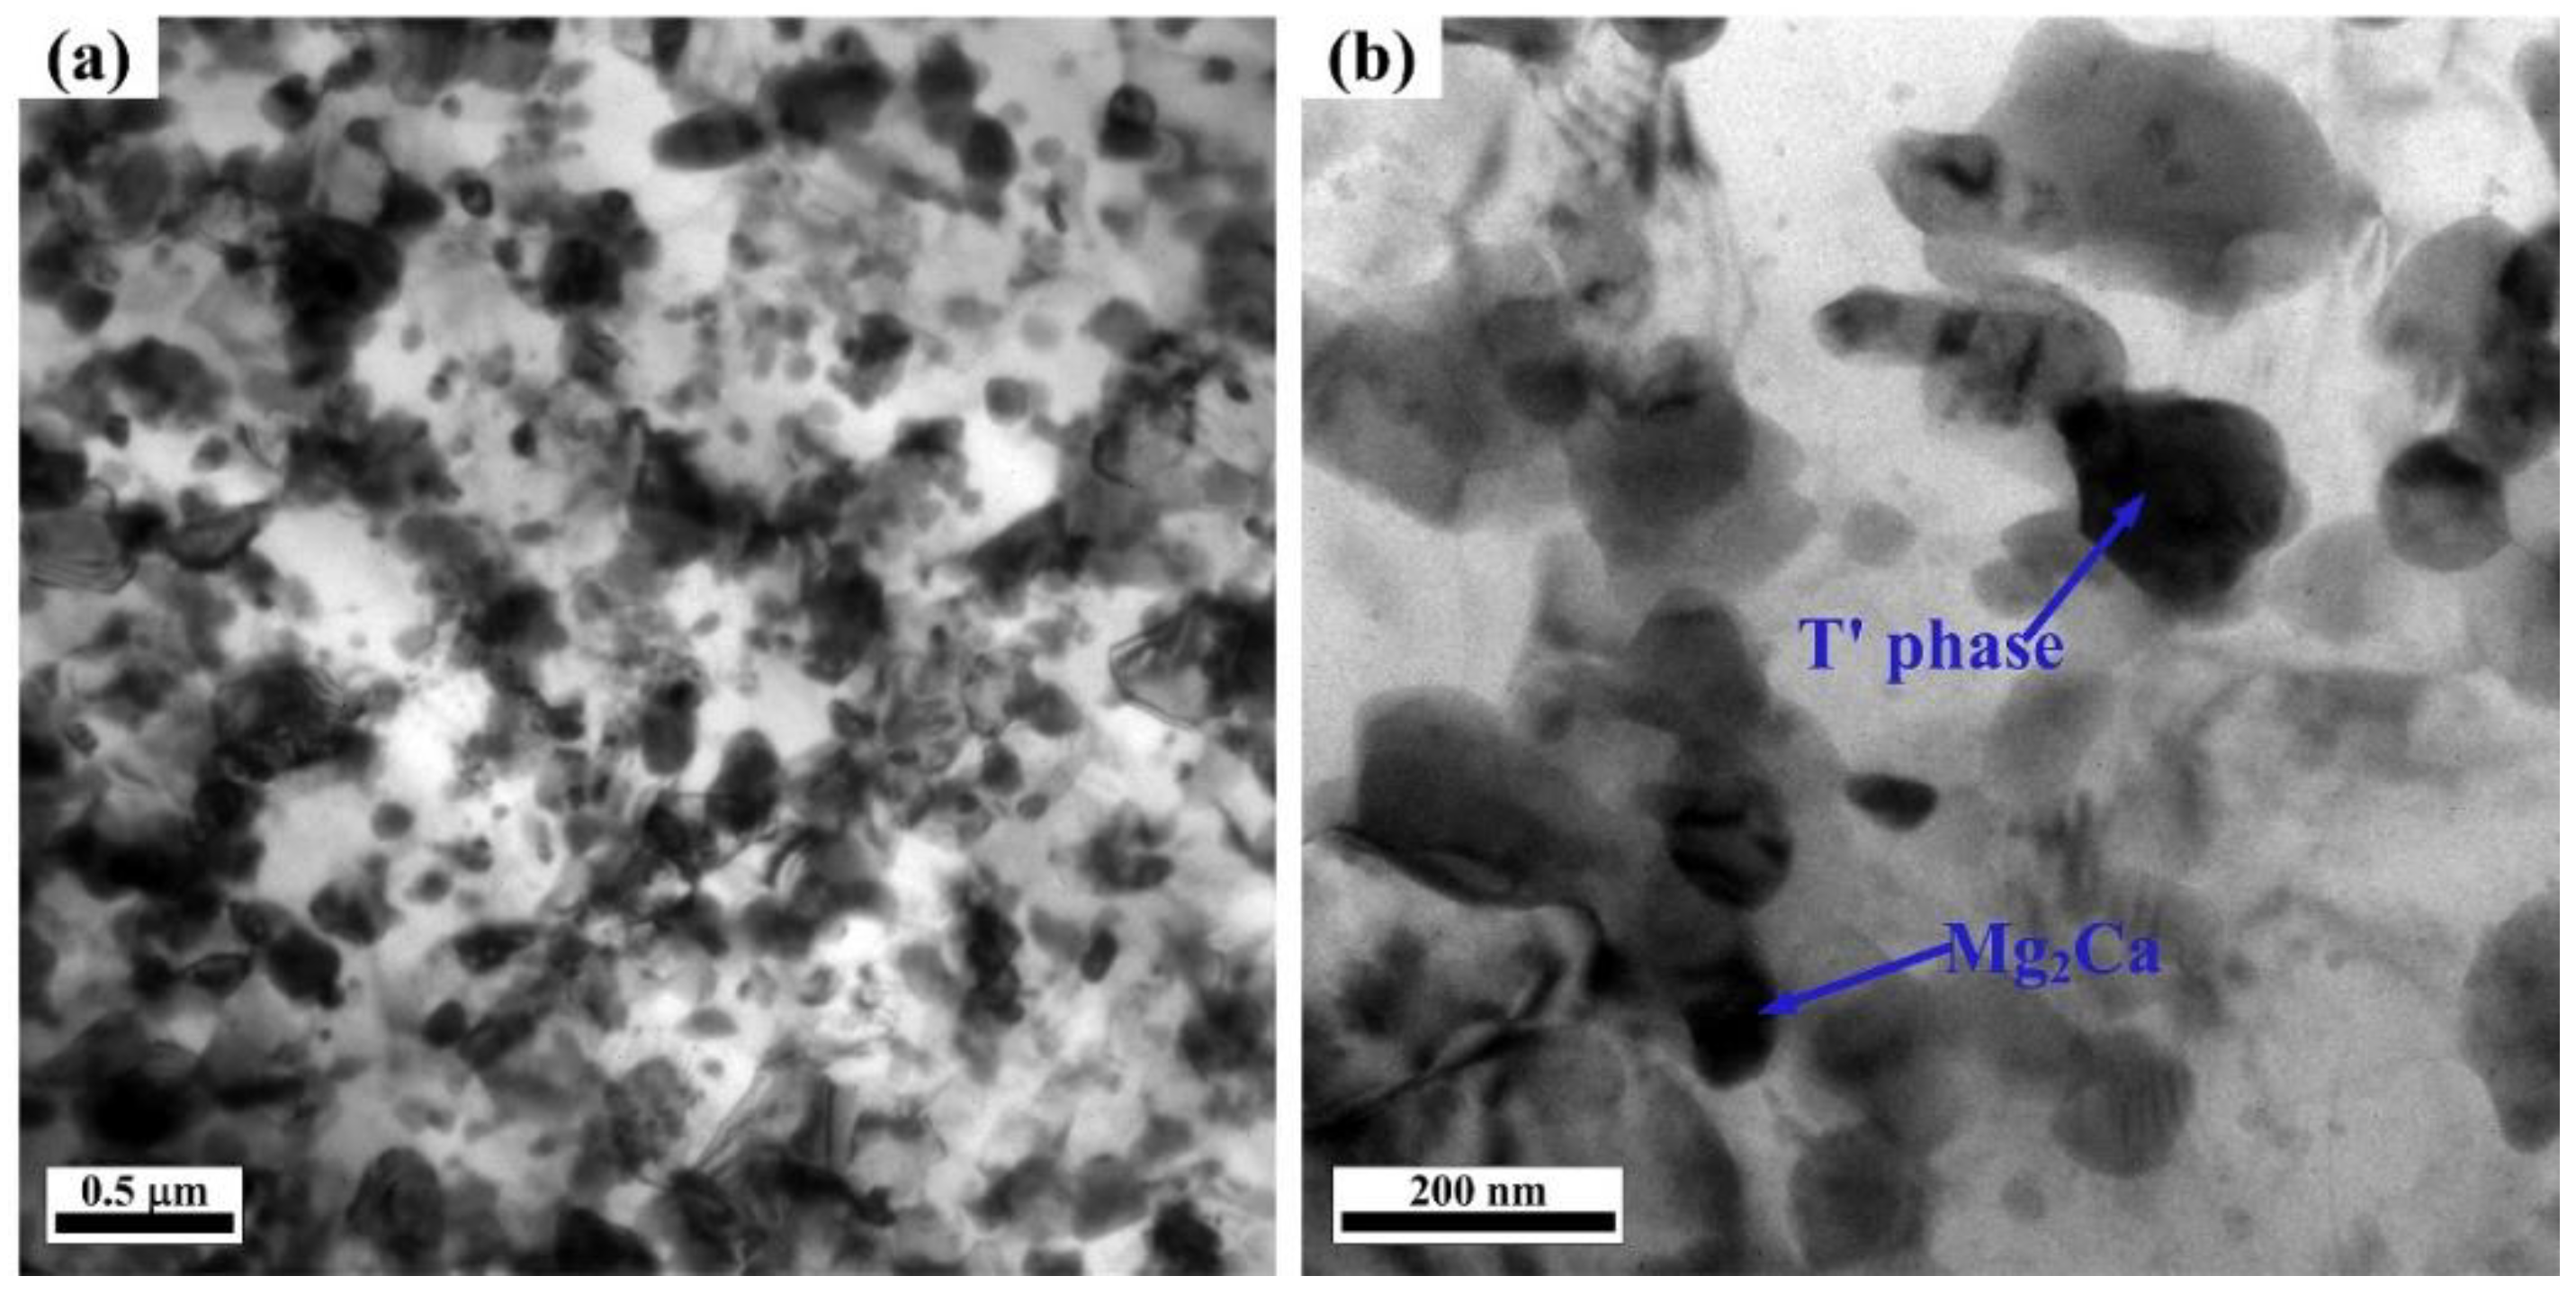
Microstructure characterization of the deformed specimens was conducted by transmission electron microscopy (TEM, Tecnai G220, FEI Company, Hillsboro, OR, USA) operated at 200 kV. The specimens for TEM observation were twin-jet electropolished using a solution of 11.6 g magnesium perchlorate, 5.3 g lithium chloride, 500 mL methanol and 100 mL 2-butoxyethanol, at −55 °C and 85 V, followed by ion milling. The TEM micrographs of as-extruded Mg–6Zn–5Ca–3Ce alloy fabricated by RS were shown in Figure 2. It is clear that after hot extrusion, the grain size was refined into the range of 350–1000 nm (compared with RS Mg–6Zn–5Ca–3Ce alloy [4]), which can be estimated directly from the TEM micrographs. Moreover, a host of particles with various sizes were distributed at the grain boundary and in the grain interior. Furthermore, the morphology of particles is quite different from each other, including spherical, elliptic and block particles. It was reported that these particles were Mg2Ca and Mg–Zn–Ce phase (T’ phase) [22].

3. Results and Discussion

3.1. Flow Stress Behavior

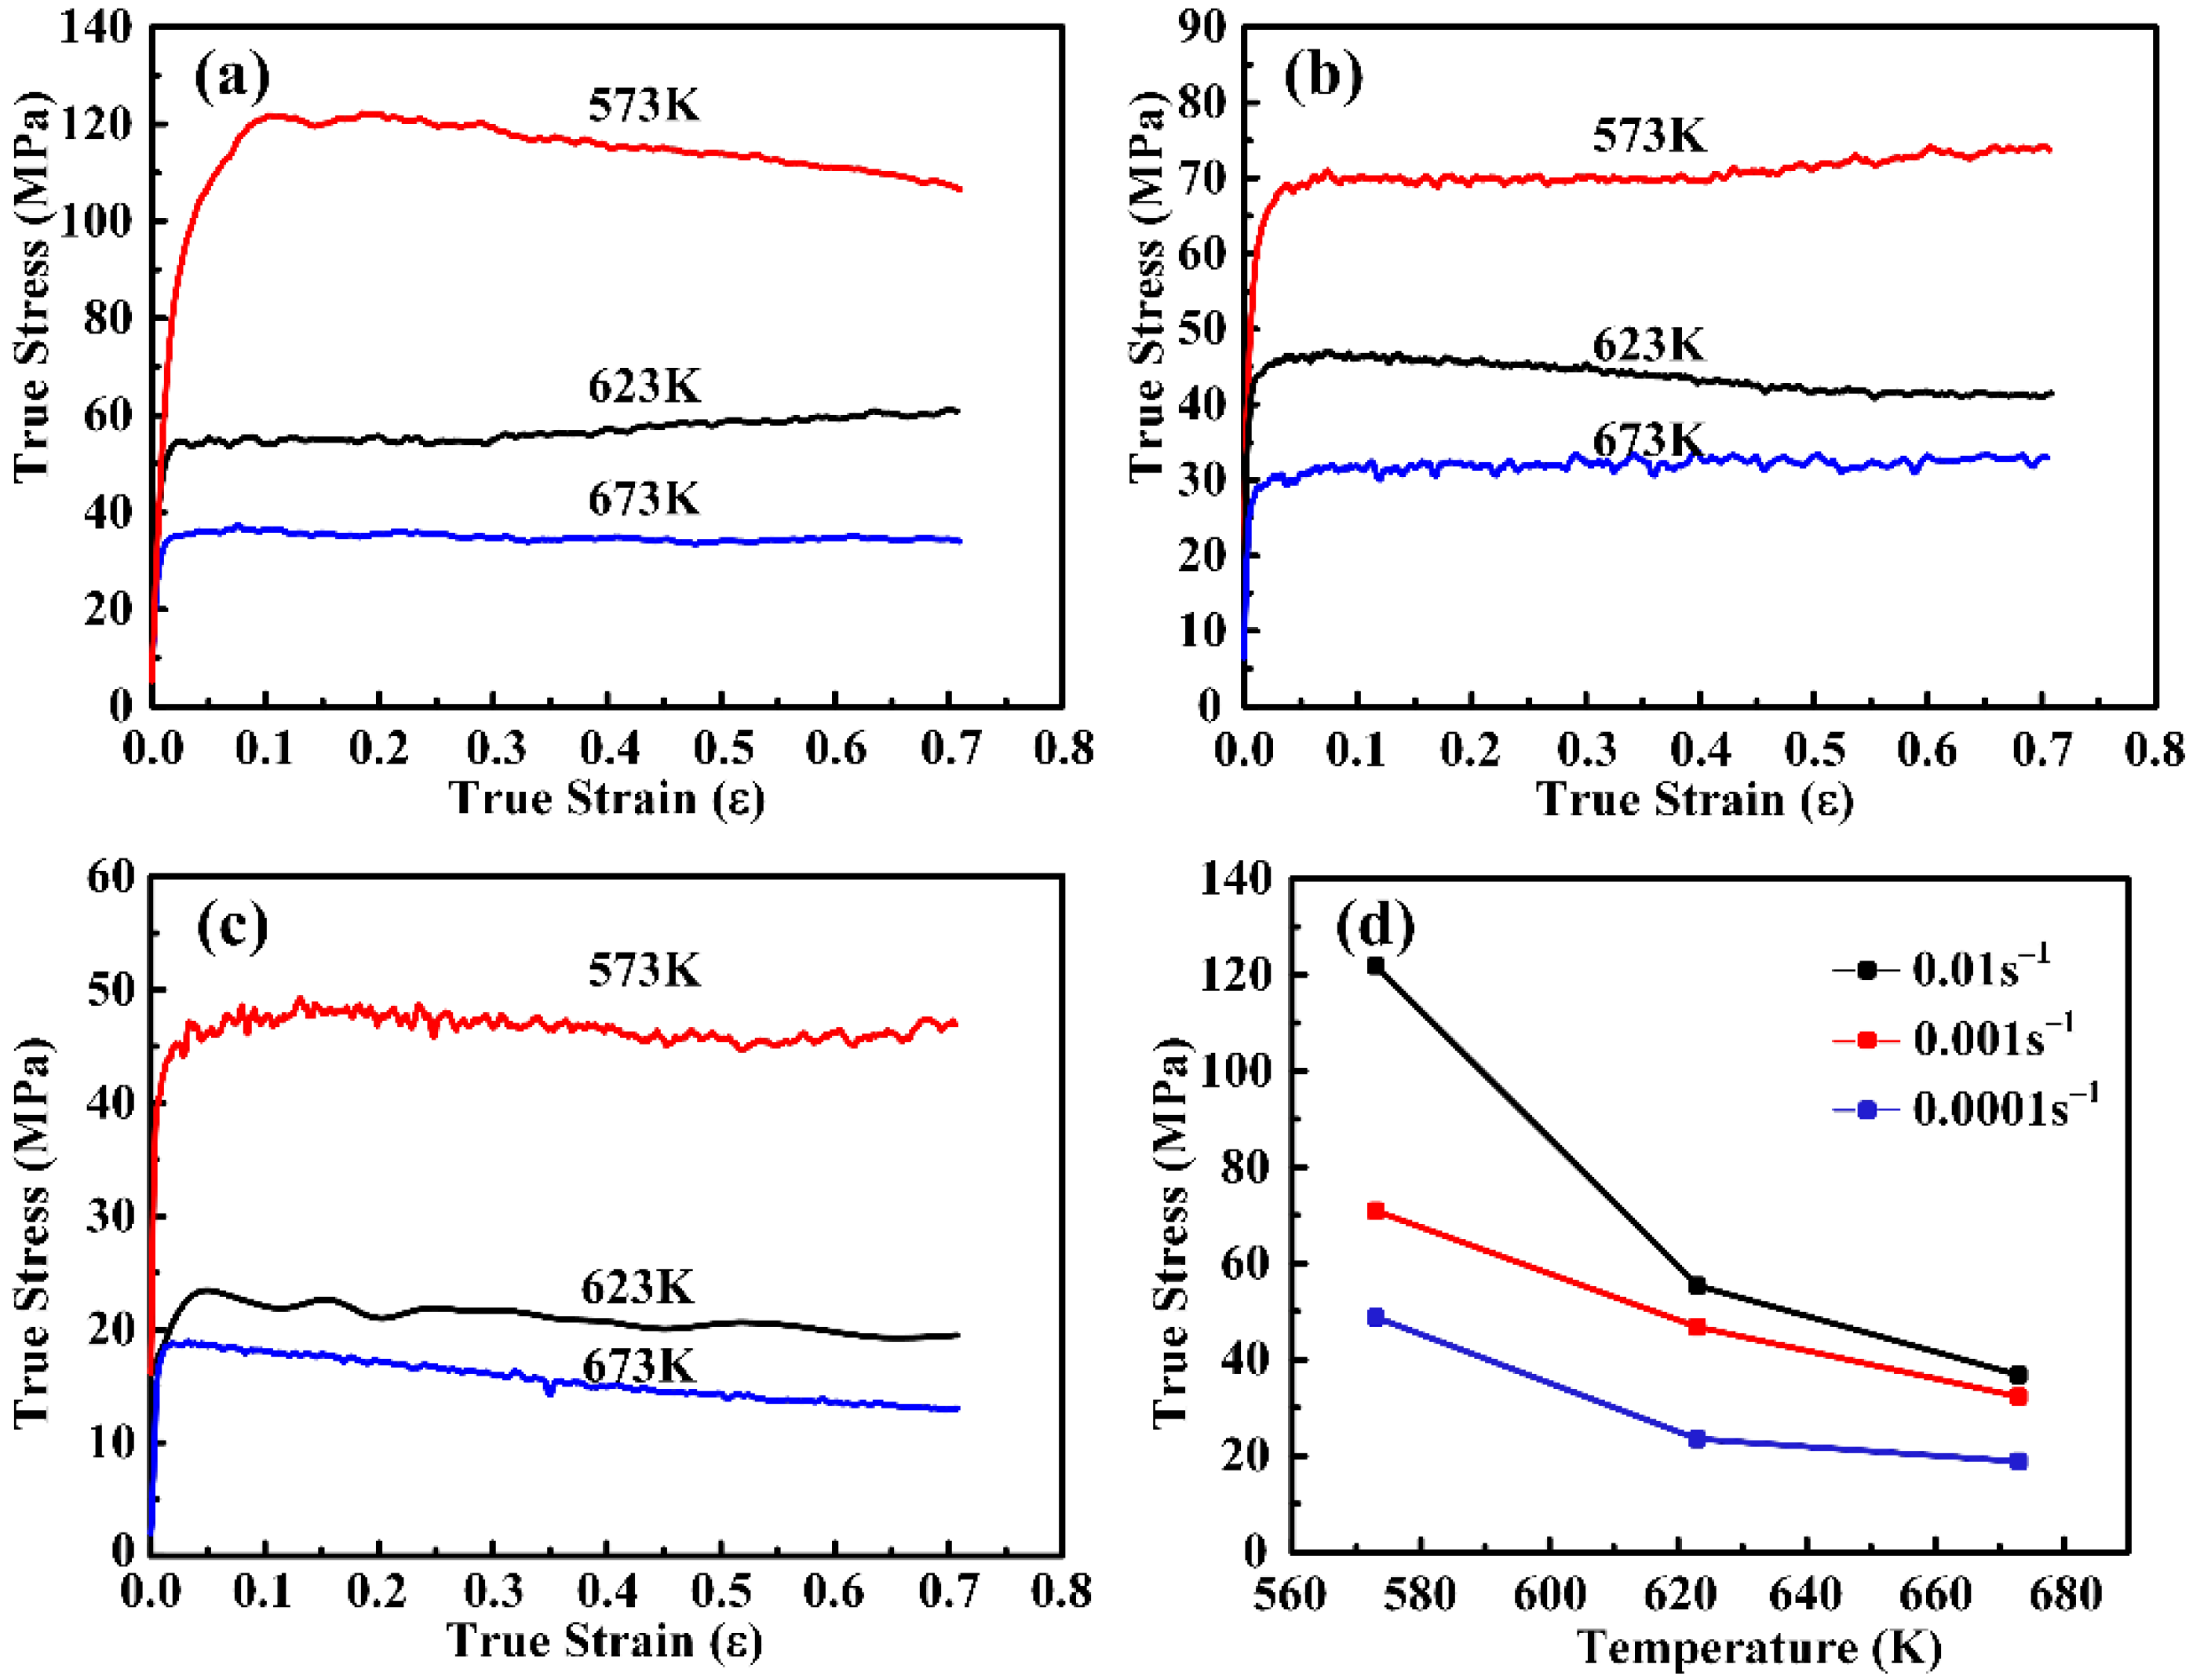
The true stress–strain curves for as-extruded Mg–6Zn–5Ca–3Ce alloy fabricated by RS at different deformation temperatures ranging from 573 K to 673 K and different strain rates varying from 0.0001 s−1 to 0.01 s−1 are shown in Figure 3. Evidently, the flow stress exhibits an increasing tendency with increasing strain rate and decreasing temperature, especially at a low temperature (Figure 3d). Moreover, the peak stress appears under an extremely low strain (even less than 0.05), indicating that the significant work-hardening effect appears at the initial deformation stage. Furthermore, the peak stress at a low temperature is higher than that of high temperature at a certain strain rate since it has more severe strain hardening in a low temperature. At the initial stage of plastic deformation, flow stress rises rapidly but does not reach the peak stress due to working hardening introduced by dislocation multiplication, pileup and tangle [23,24]. Afterwards, it increases to the peak stress slightly indicating a steady state which is a dynamic competition process between work hardening and softening by the dynamic recovery (DRV) and DRX. After that, some serrations in the stress–strain curve are observed due to the discontinuous dynamic recrystallization (DDRX) [25]. It is worth noting that when the strain rate is 0.0001 s–1, an evident decreasing trend occurs at a high temperature (623 K and 673 K), implying that dynamic softening dominates the mechanical response after reaching the peak value.

3.2. Constitutive Analysis Based on Arrhenius Equation

In order to predict the hot workability behavior of metallic materials, different constitutive models have been constructed in order to describe the relationship between the deformation parameters. Among them, the Arrhenius constitutive model has been termed as the prevailing one due to its straightforward format and high prediction accuracy [26]. The key equation for this model would be depicted by the hyperbolic sine equation:
ε ˙ = A [ sinh ( α σ ) ] n exp ( Q R T )
For the low stress level (ασ < 0.8), the value of sinh(ασ) is similar to its argument ασ; While for the high stress level (ασ > 1.2), the value of sinh(ασ) is similar to the exp(βσ)/2. Thus Equation (1) can be converted into the following equations:
ε ˙ = A 1 ( α σ ) n 1 exp ( Q R T ) ( α σ < 0.8 )
ε ˙ = A 2 exp ( β σ ) exp ( Q R T ) ( α σ > 1.2 )
where ε ˙ is strain rate (s−1), R is the universal gas constant (8.314 J/(mol*K)), Q is the deformation activation energy, T is the absolute temperature (K), σ is the peak stress (MPa), and A, A1, A2, α (α = β/n1), β and n are material constants [27,28].
To simplify the equations, natural logarithms are introduced into both sides of Equations (1)–(3), which conform to the following equations:
ln ε ˙ = ln A + n ln [ sinh ( α σ ) ] Q R T
ln ε ˙ = ln A 1 + n 1 ln σ Q R T
ln ε ˙ = ln A 2 + β σ Q R T
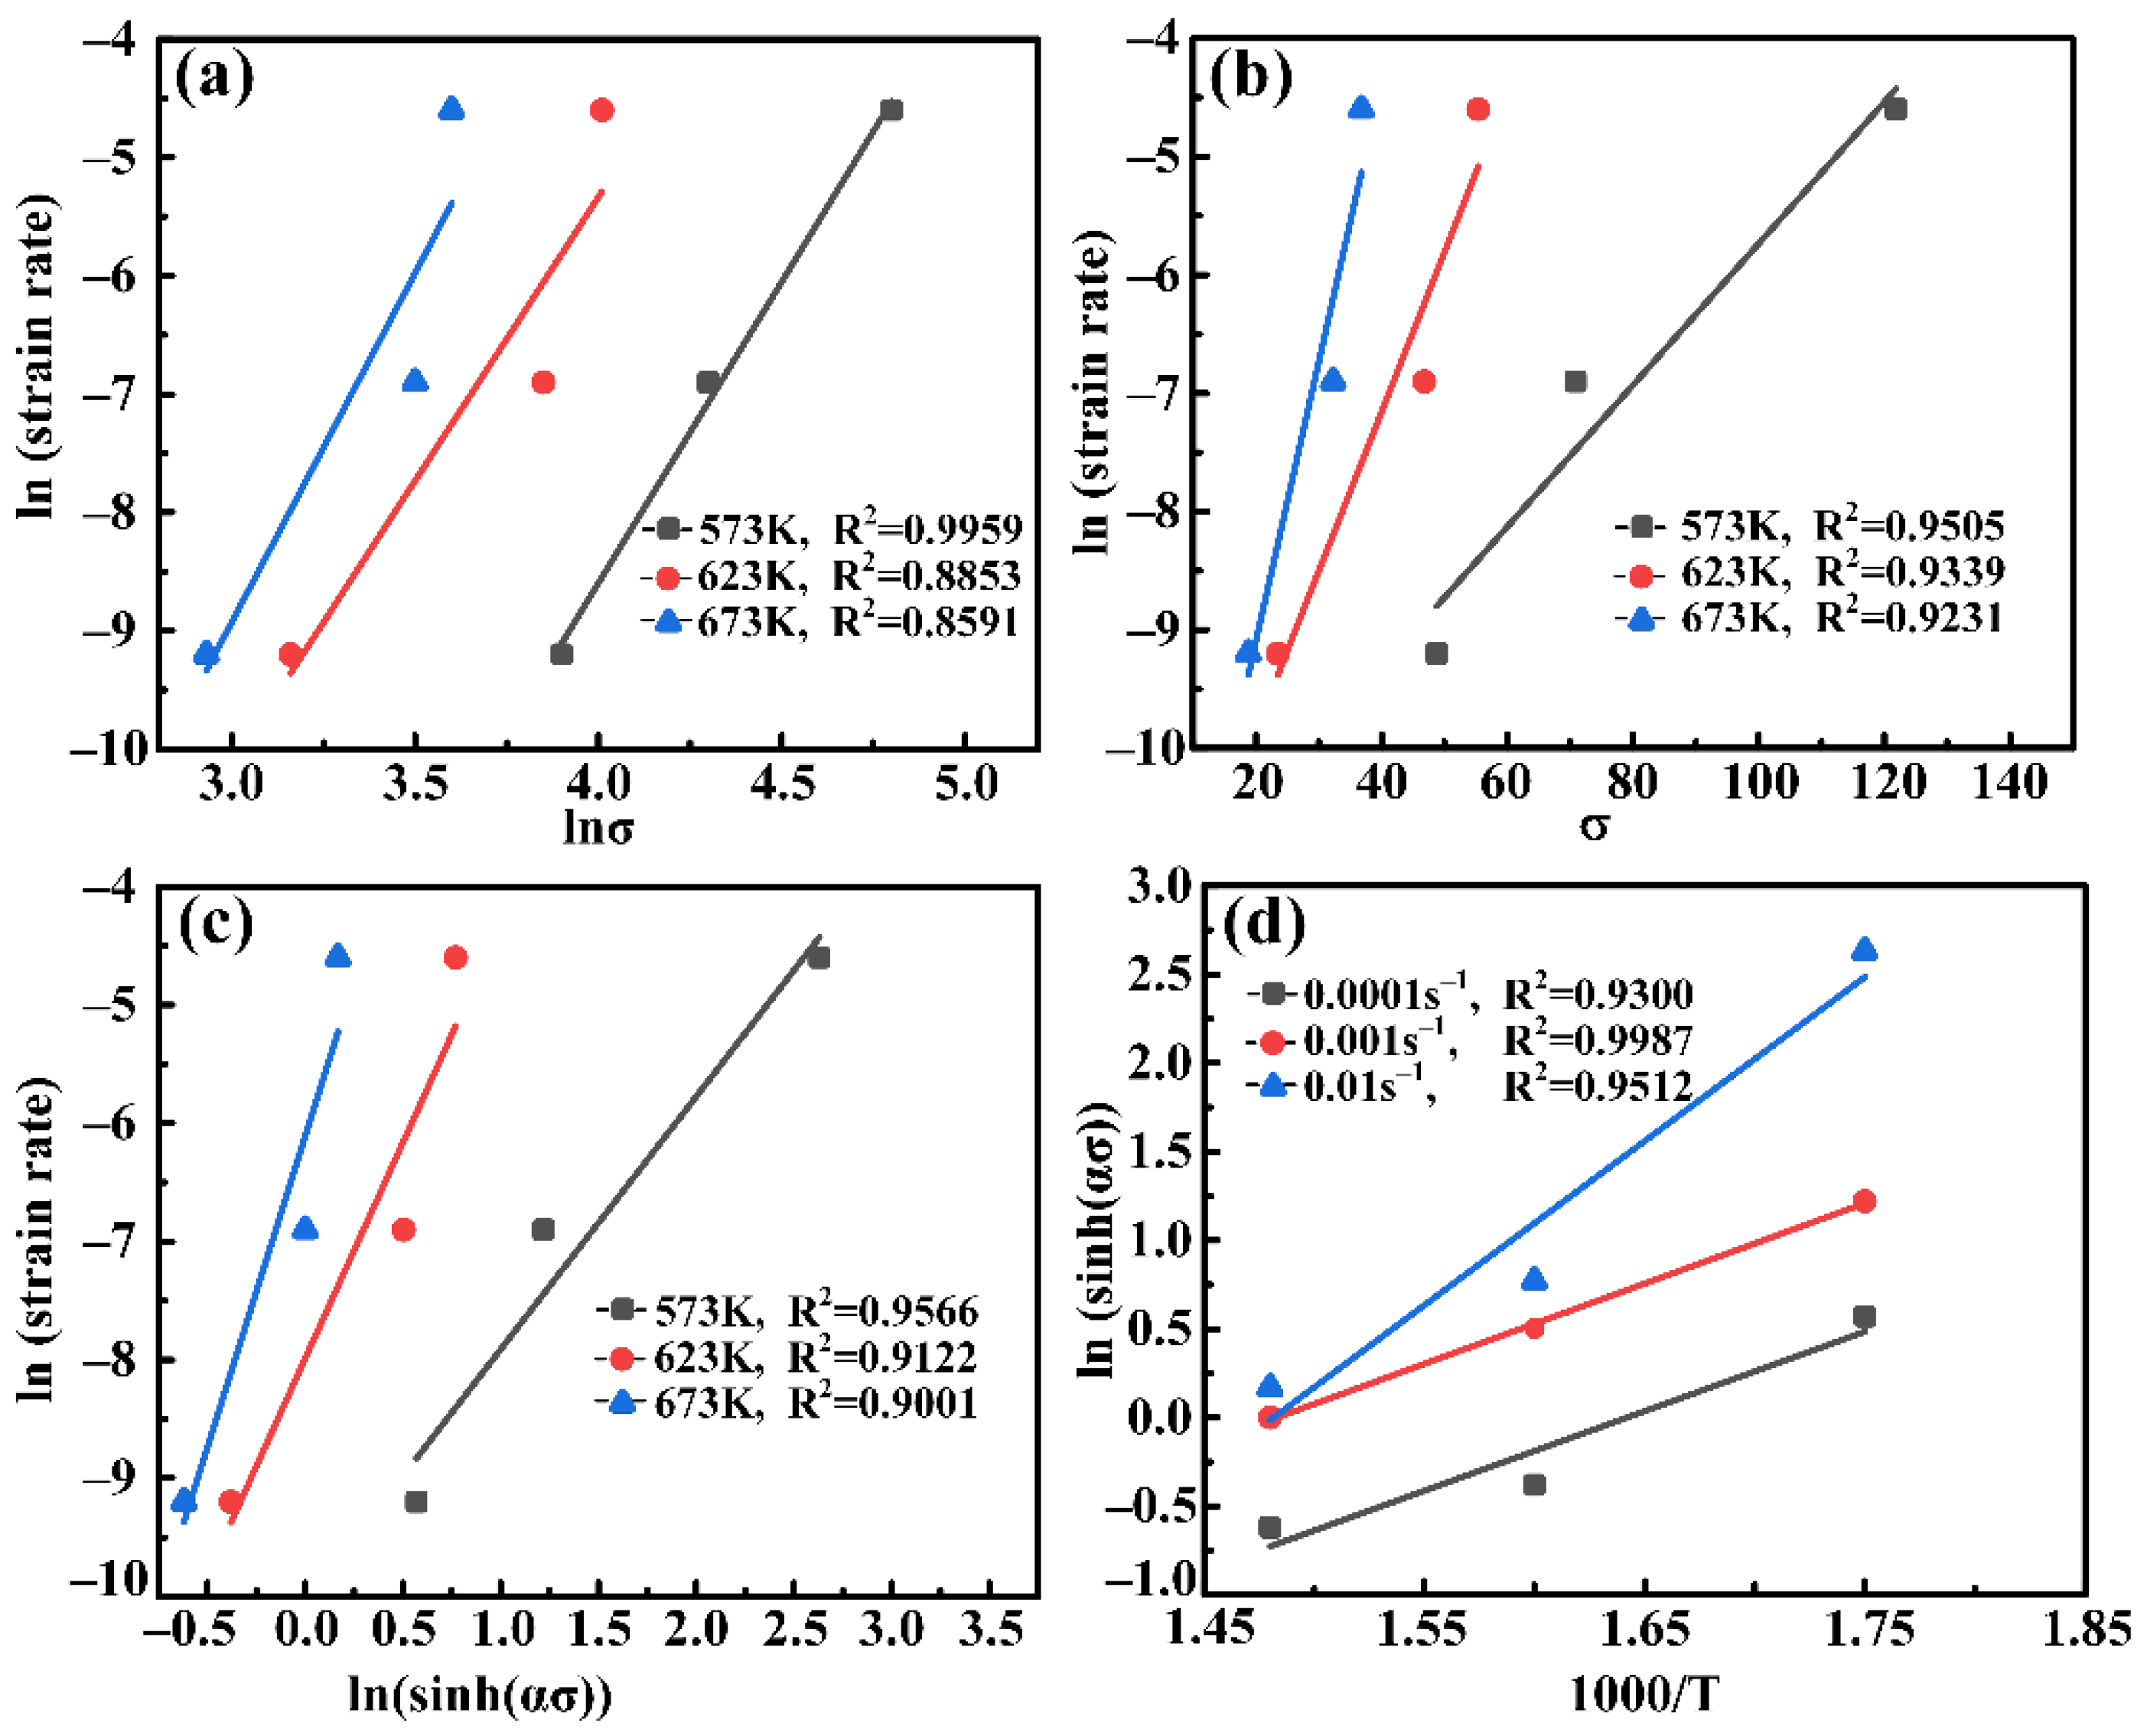
In accordance with Equations (5) and (6), ln ε ˙ is linearly related to ln σ and σ, respectively. Thus, the average slope of ln ε ˙ ln σ and ln ε ˙ σ , n1 and β, can be achieved, where n 1 = 5.26 , β = 0.1435 . Afterwards, α (α = β/n1), can be calculated as 0.0273. The relationships of ln ε ˙ ln σ and ln ε ˙ σ are depicted in Figure 4a,b).
Because there are three variations in Equation (4), by calculating partial differential for temperature and strain rate, respectively, the linear relationship of ln [ sinh ( α σ ) ] 1000 T and ln ε ˙ ln [ sinh ( α σ ) ] are drawn in Figure 4c,d. Therefore, the activation energy Q can be obtained:
Q = R [ ln ε ˙ ln ( sinh ( α σ ) ) ] T [ ln ( sinh ( α σ ) ) ( 1000 T ) ] ε ˙
In the above equation, [ ln ε ˙ ln ( sinh ( α σ ) ) ] T is the slop of ln ε ˙ ln [ sinh ( α σ ) ] and [ ln ( sinh ( α σ ) ) ( 1000 T ) ] ε ˙ is that of ln [ sinh ( α σ ) ] 1000 T . It can be calculated that the mean slope of ln [ sinh ( α σ ) ] 1000 T is 6.09 and that of ln ε ˙ ln [ sinh ( α σ ) ] is 3.68. Accordingly, the current activation energy, Q, is estimated to be 186.3 kJ/mol, which is higher than that of the self-diffusion in pure Mg. Zheng et al. [29] researched the effect of the addition of MgO on the plastic deformation behavior of Mg alloy and indicated that the lower activation energy (150.3 kJ/mol) can be attribute to the fine grains and second phases. In this study, the moderate Q value can be attributed to the exceptional fine grain size and the occurrence of numerous second phases, such as Mg2Ca and Mg–Zn–Ce phases (T’ phase). These precipitations with good thermal stability could act as barriers to restrict dislocation motion effectively [2].
For the purpose of reflecting the influence of deformation temperature and strain rate, the Zener–Holloman parameter (Z) will be introduced. Combined with the hyperbolic sine function (Equation (1)), the Z parameter is shown in Equation (8).
Z = ε ˙ exp ( Q R T ) = A [ sinh ( α σ ) ] n
The relationship of ln [ sinh ( α σ ) ] and ln Z can be illustrated in Figure 5. Based on linear fitting, the intercept ( ln A ) can be obtained and subsequently the A can be calculated as 8.8 × 10 11 . Ultimately, the σ can be calculated by the following equation:
σ = 1 α ln { ( Z A ) 1 n + [ ( Z A ) 2 n + 1 ] 1 2 }
Substitute the calculated value, α , Q , n and A into Equation (1), and the constitutive equation for hot compression of as-extruded Mg–6Zn–5Ca–3Ce fabricated by the RS alloy can be calculated as:
ε ˙ = 8.8 × 10 11 [ sinh ( 0.0273 σ ) ] 3.13 exp ( 186300 8.314 T )
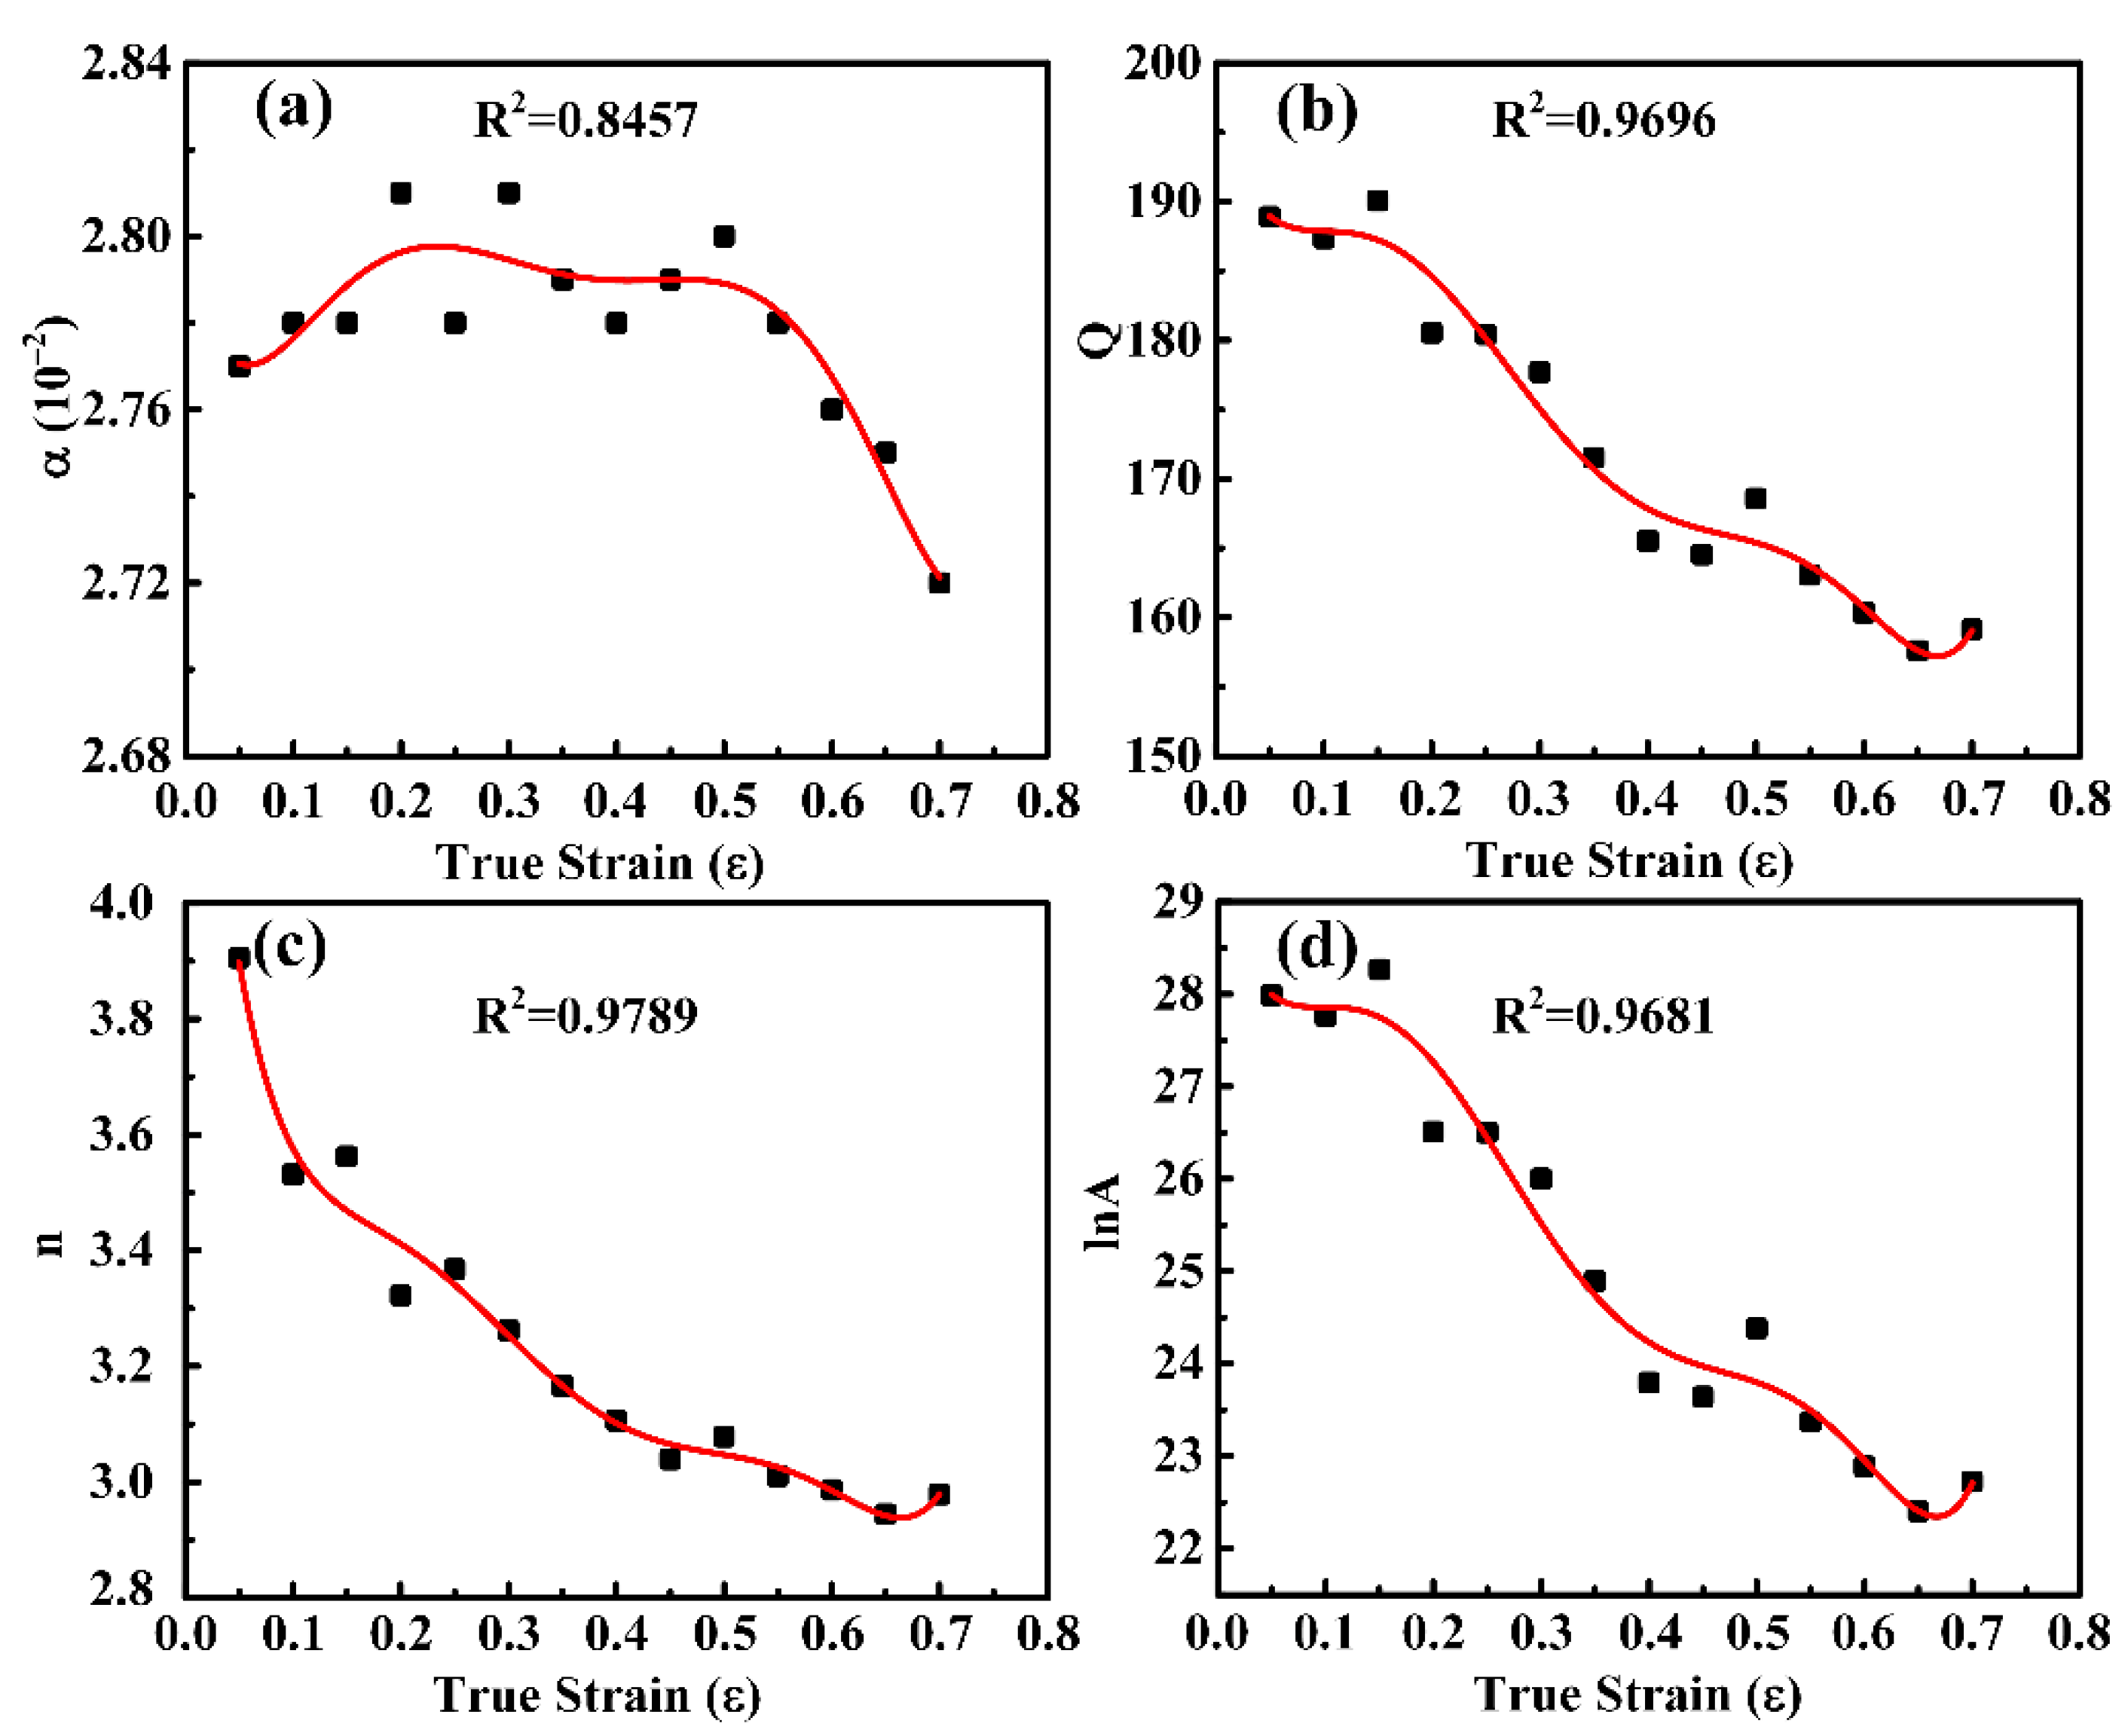
However, intensive research has demonstrated that plastic strain significantly influences material constants within the entire strain range [30,31]. In order to predict the hot deformation behavior and flow stress more accurately, the material constants ( α , Q , n and ln A ) in various strains at an interval of 0.05 are calculated via the coded Matlab program. The corresponding calculated results are shown in Table 3. Clearly, there indeed exists an obvious difference in strain varying from 0.05 to 0.7. Thus, it is necessary to take the strain effect into account.
According to the principle of regression analysis, the relationship between the material constants and ε could be depicted by polynomial fitting. In the present study, a sixth order polynomial is applied and the containing terms are shown in Table 4 as well as the specific constitutive equations of as-extruded Mg–6Zn–5Ca–3Ce alloy fabricated by RS. Moreover, the regression curves of material constants are presented in Figure 6.
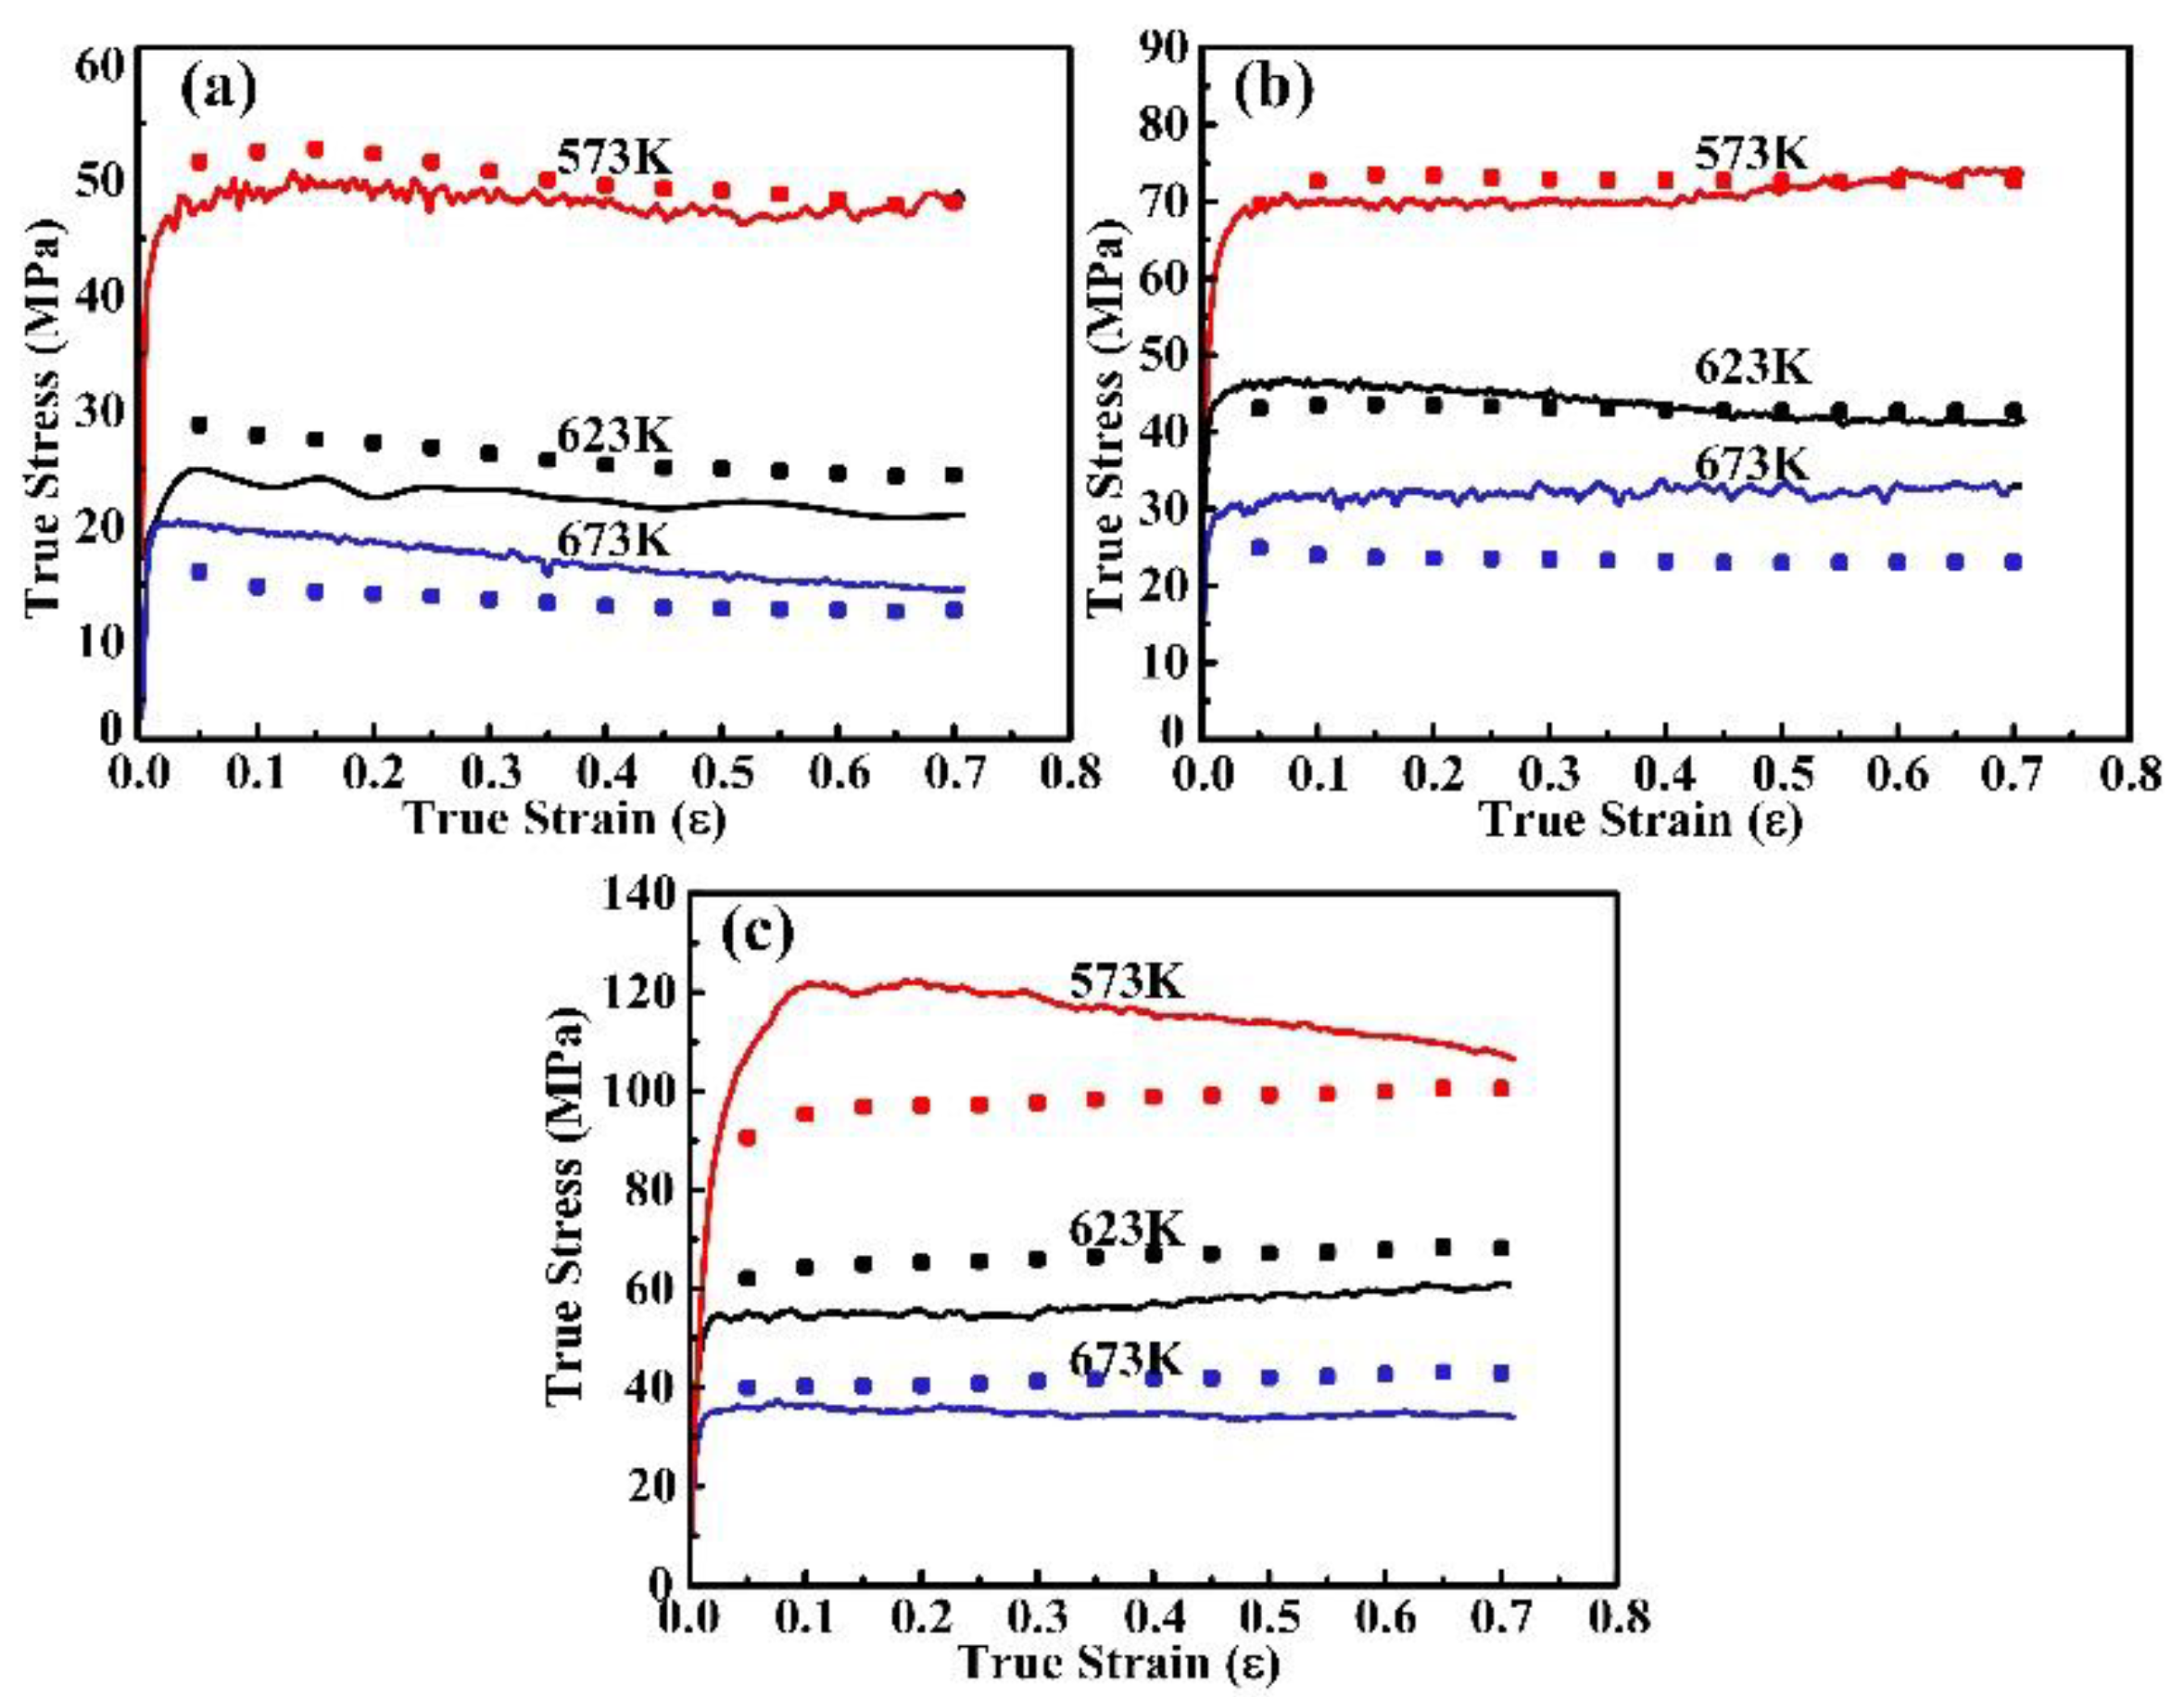
Based on material constants under different strains in Table 3 and Table 4, the flow stress at a specific deformation condition can be calculated using Equation (10) and the calculated stress–strain curves of as-extruded Mg–6Zn–5Ca–3Ce alloy fabricated by RS can be obtained, as shown in Figure 7. These calculated flow stresses under various deformation conditions globally agree with the correspondingly experimental results.

3.3. Processing Maps

The power dissipation map is usually applied to describe the microstructure evolution during the hot deformation. The thermal deformation material is considered as a non-linear energy dissipation unit in the dynamic material model (DMM) [12,16,32]. During hot deformation, the total power P is converted into the G content and J co-content, where G is dissipation energy consumed by plastic deformation and J is consumed by microstructure evolution Thus, the total power P can be expressed as:
P = σ ε ˙ = G + J = 0 ε ˙ σ d ε ˙ + 0 σ ε ˙ d σ
The relationship among flow stress σ, the strain rate stress ε ˙ and the dynamic constitutive equation under a given temperature can be depicted as:
σ = K ε ˙ m
where m represents the strain rate sensitivity index and K is the material constant. Moreover, m is the proportion of dissipative power between G and J, which is defined as:
m = d J d G = [ ( ln σ ) ( ln ε ˙ ) ] ε ˙ , T
Supposing that the material is an ideal linear dissipation body, J obtains to the maximum as m = 1 (that is ideally plastic flow):
J max = 1 2 σ ε ˙
As for a complicated alloy system, the relationship between flow stress and strain rate will be more consistent with the Murty criterion which is widely applicable to various σ ε ˙ versus. Thus, the G content can be written as:
G = 0 ε ˙ σ d ε ˙ = 0 ε ˙ min σ d ε ˙ + ε ˙ min ε ˙ σ d ε ˙ = ( σ ε ˙ m + 1 ) ε ˙ = ε ˙ min + ε ˙ min ε ˙ σ d ε ˙
where ε ˙ min means the minimum strain rate during hot deformation.
The power dissipation coefficient, η, is defined as J J max which is a dimensionless parameter to access the power dissipation. Thus, η can be expressed as:
η = J J max = P G J max = 2 ( 1 1 σ ε ˙ 0 ε ˙ σ d ε ˙ ) = 2 [ 1 - ( [ σ ε ˙ m + 1 ] ε ˙ = ε ˙ min + ε ˙ min ε ˙ σ d ε ˙ ) / σ ε ˙ ]
On account of the maximum principles of irreversible thermodynamics, an instability criterion was constructed by Murty et al. to predict the sprout of flow instability as follows [32,33,34]:
2 m < η
The unstable flow caused by the adiabatic shear will occur when all power is converted into viscoplastic heat (J = 0), which means η = 0. Thus, only when the domains locate in 0 < η < 2 m and 0 < m 1 , will the stable material flow with DRX or DRV appear.
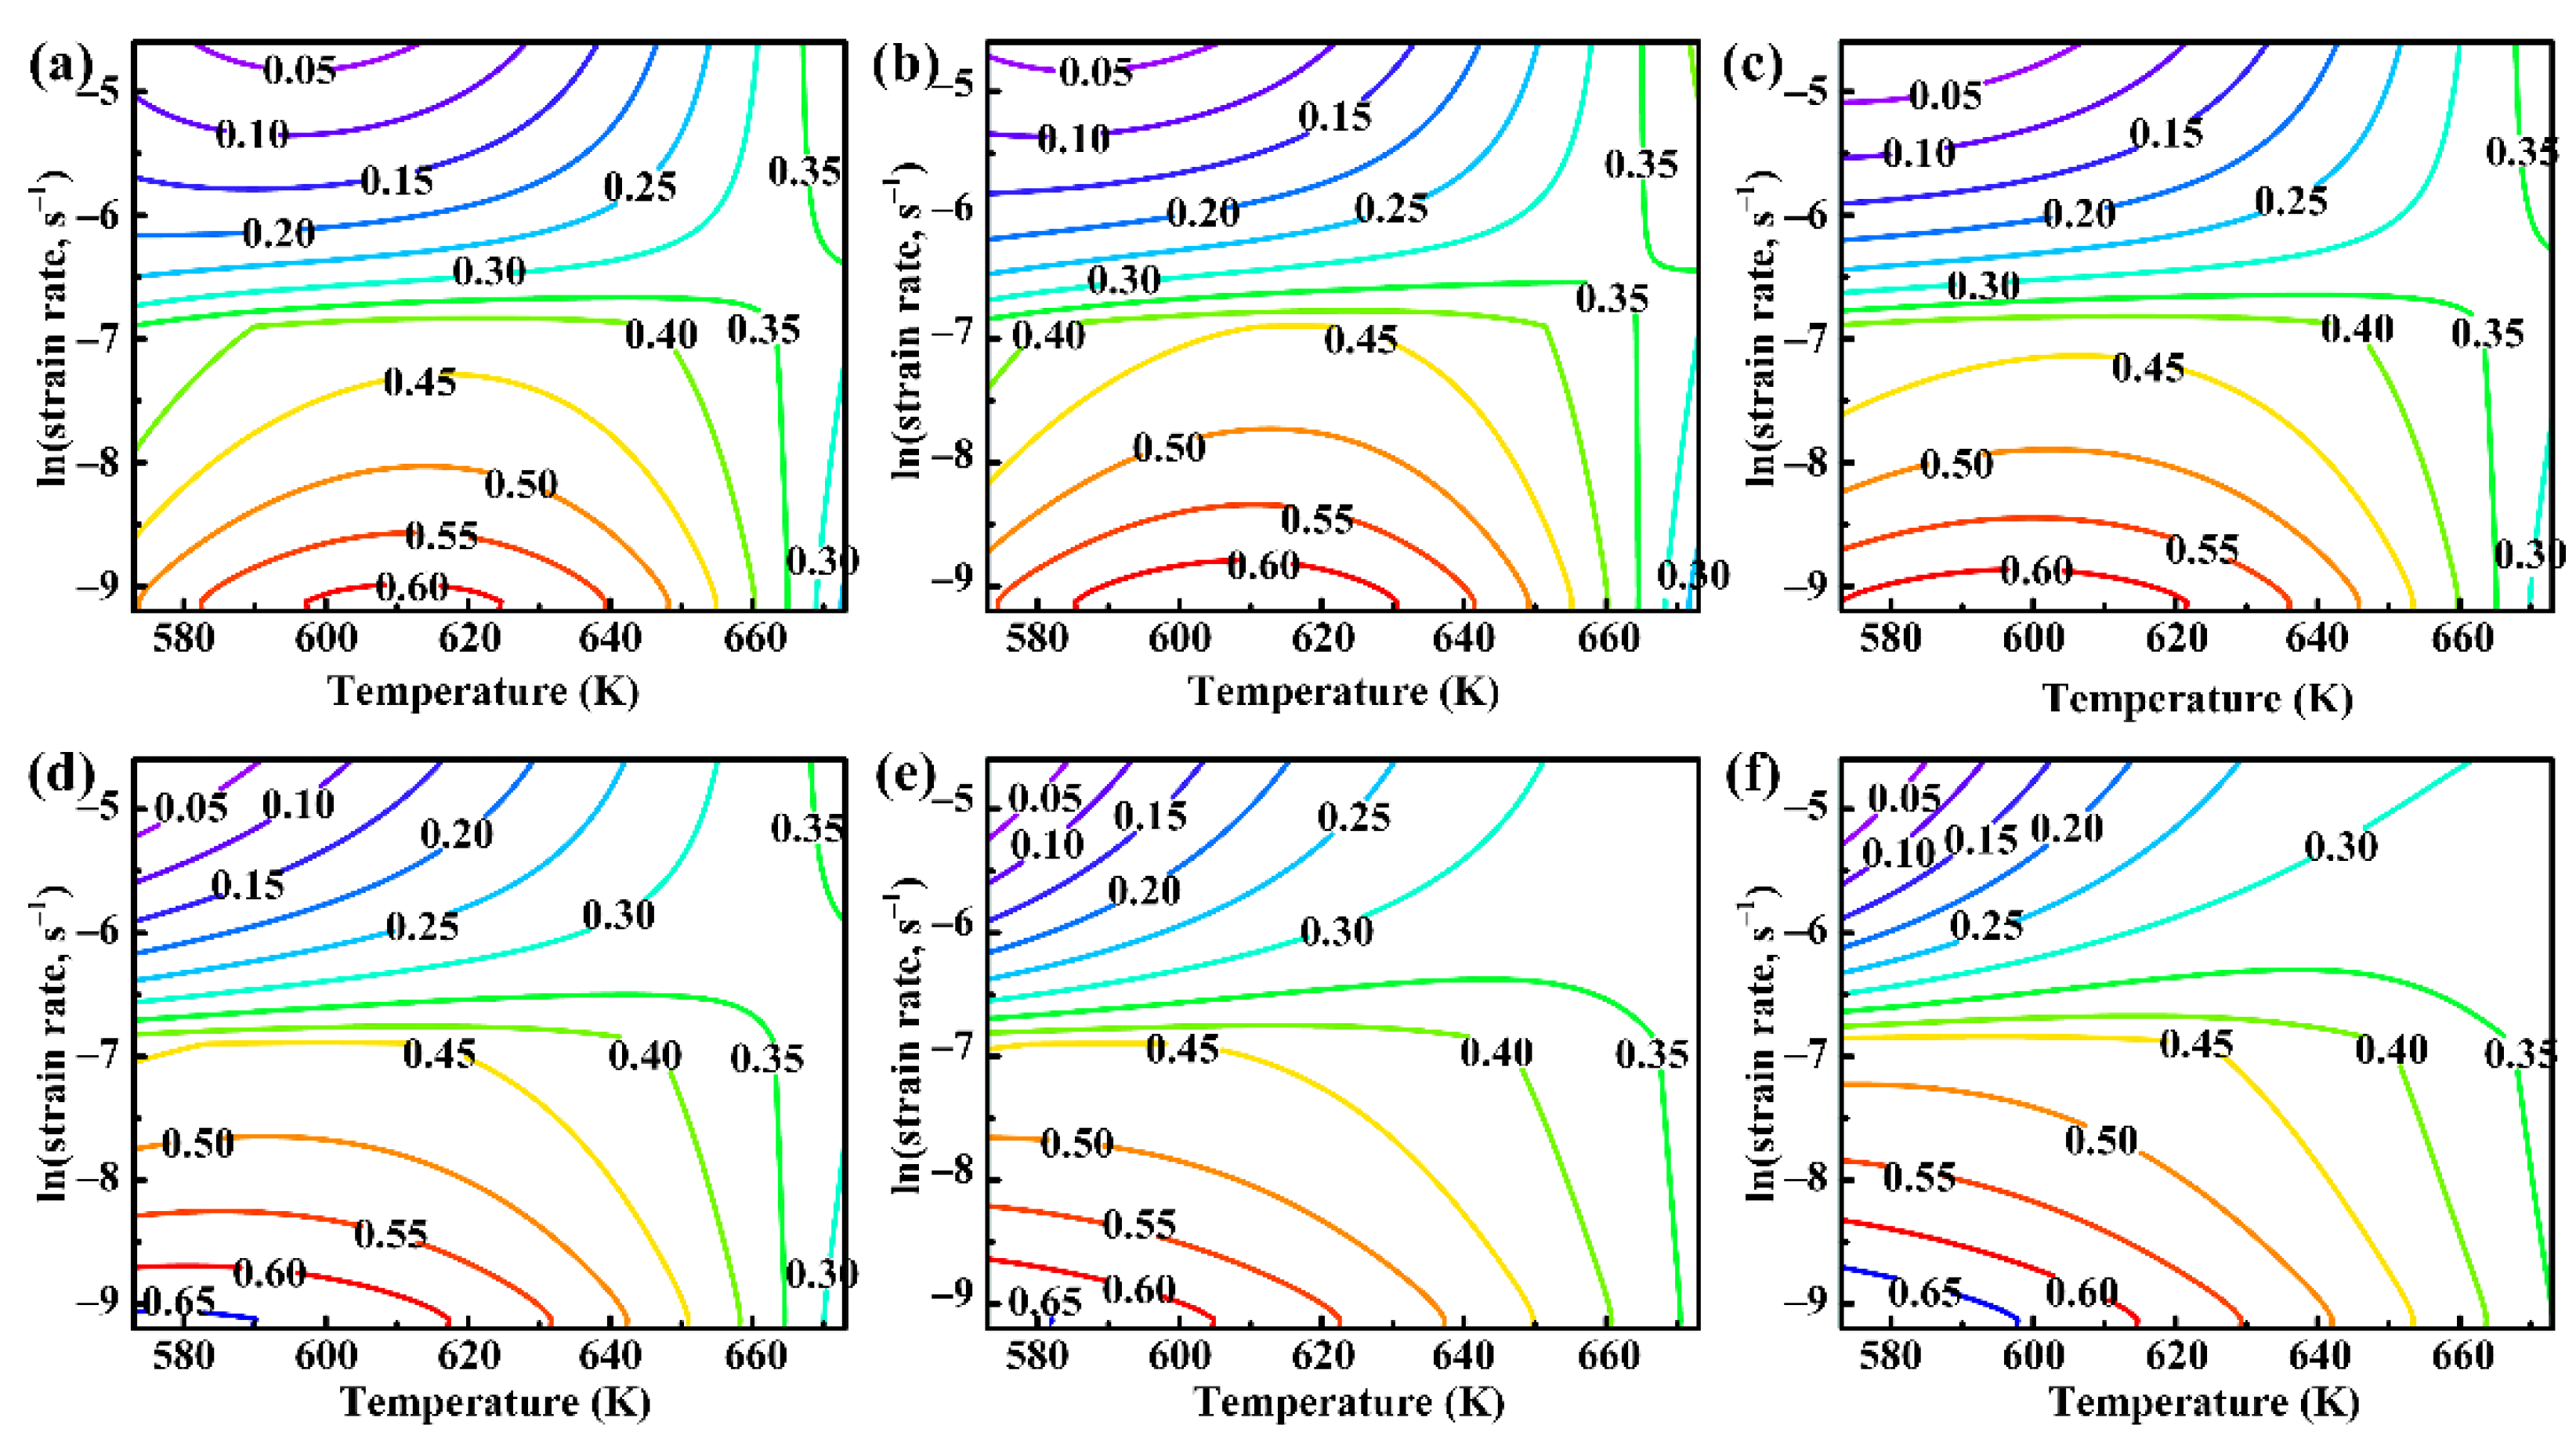
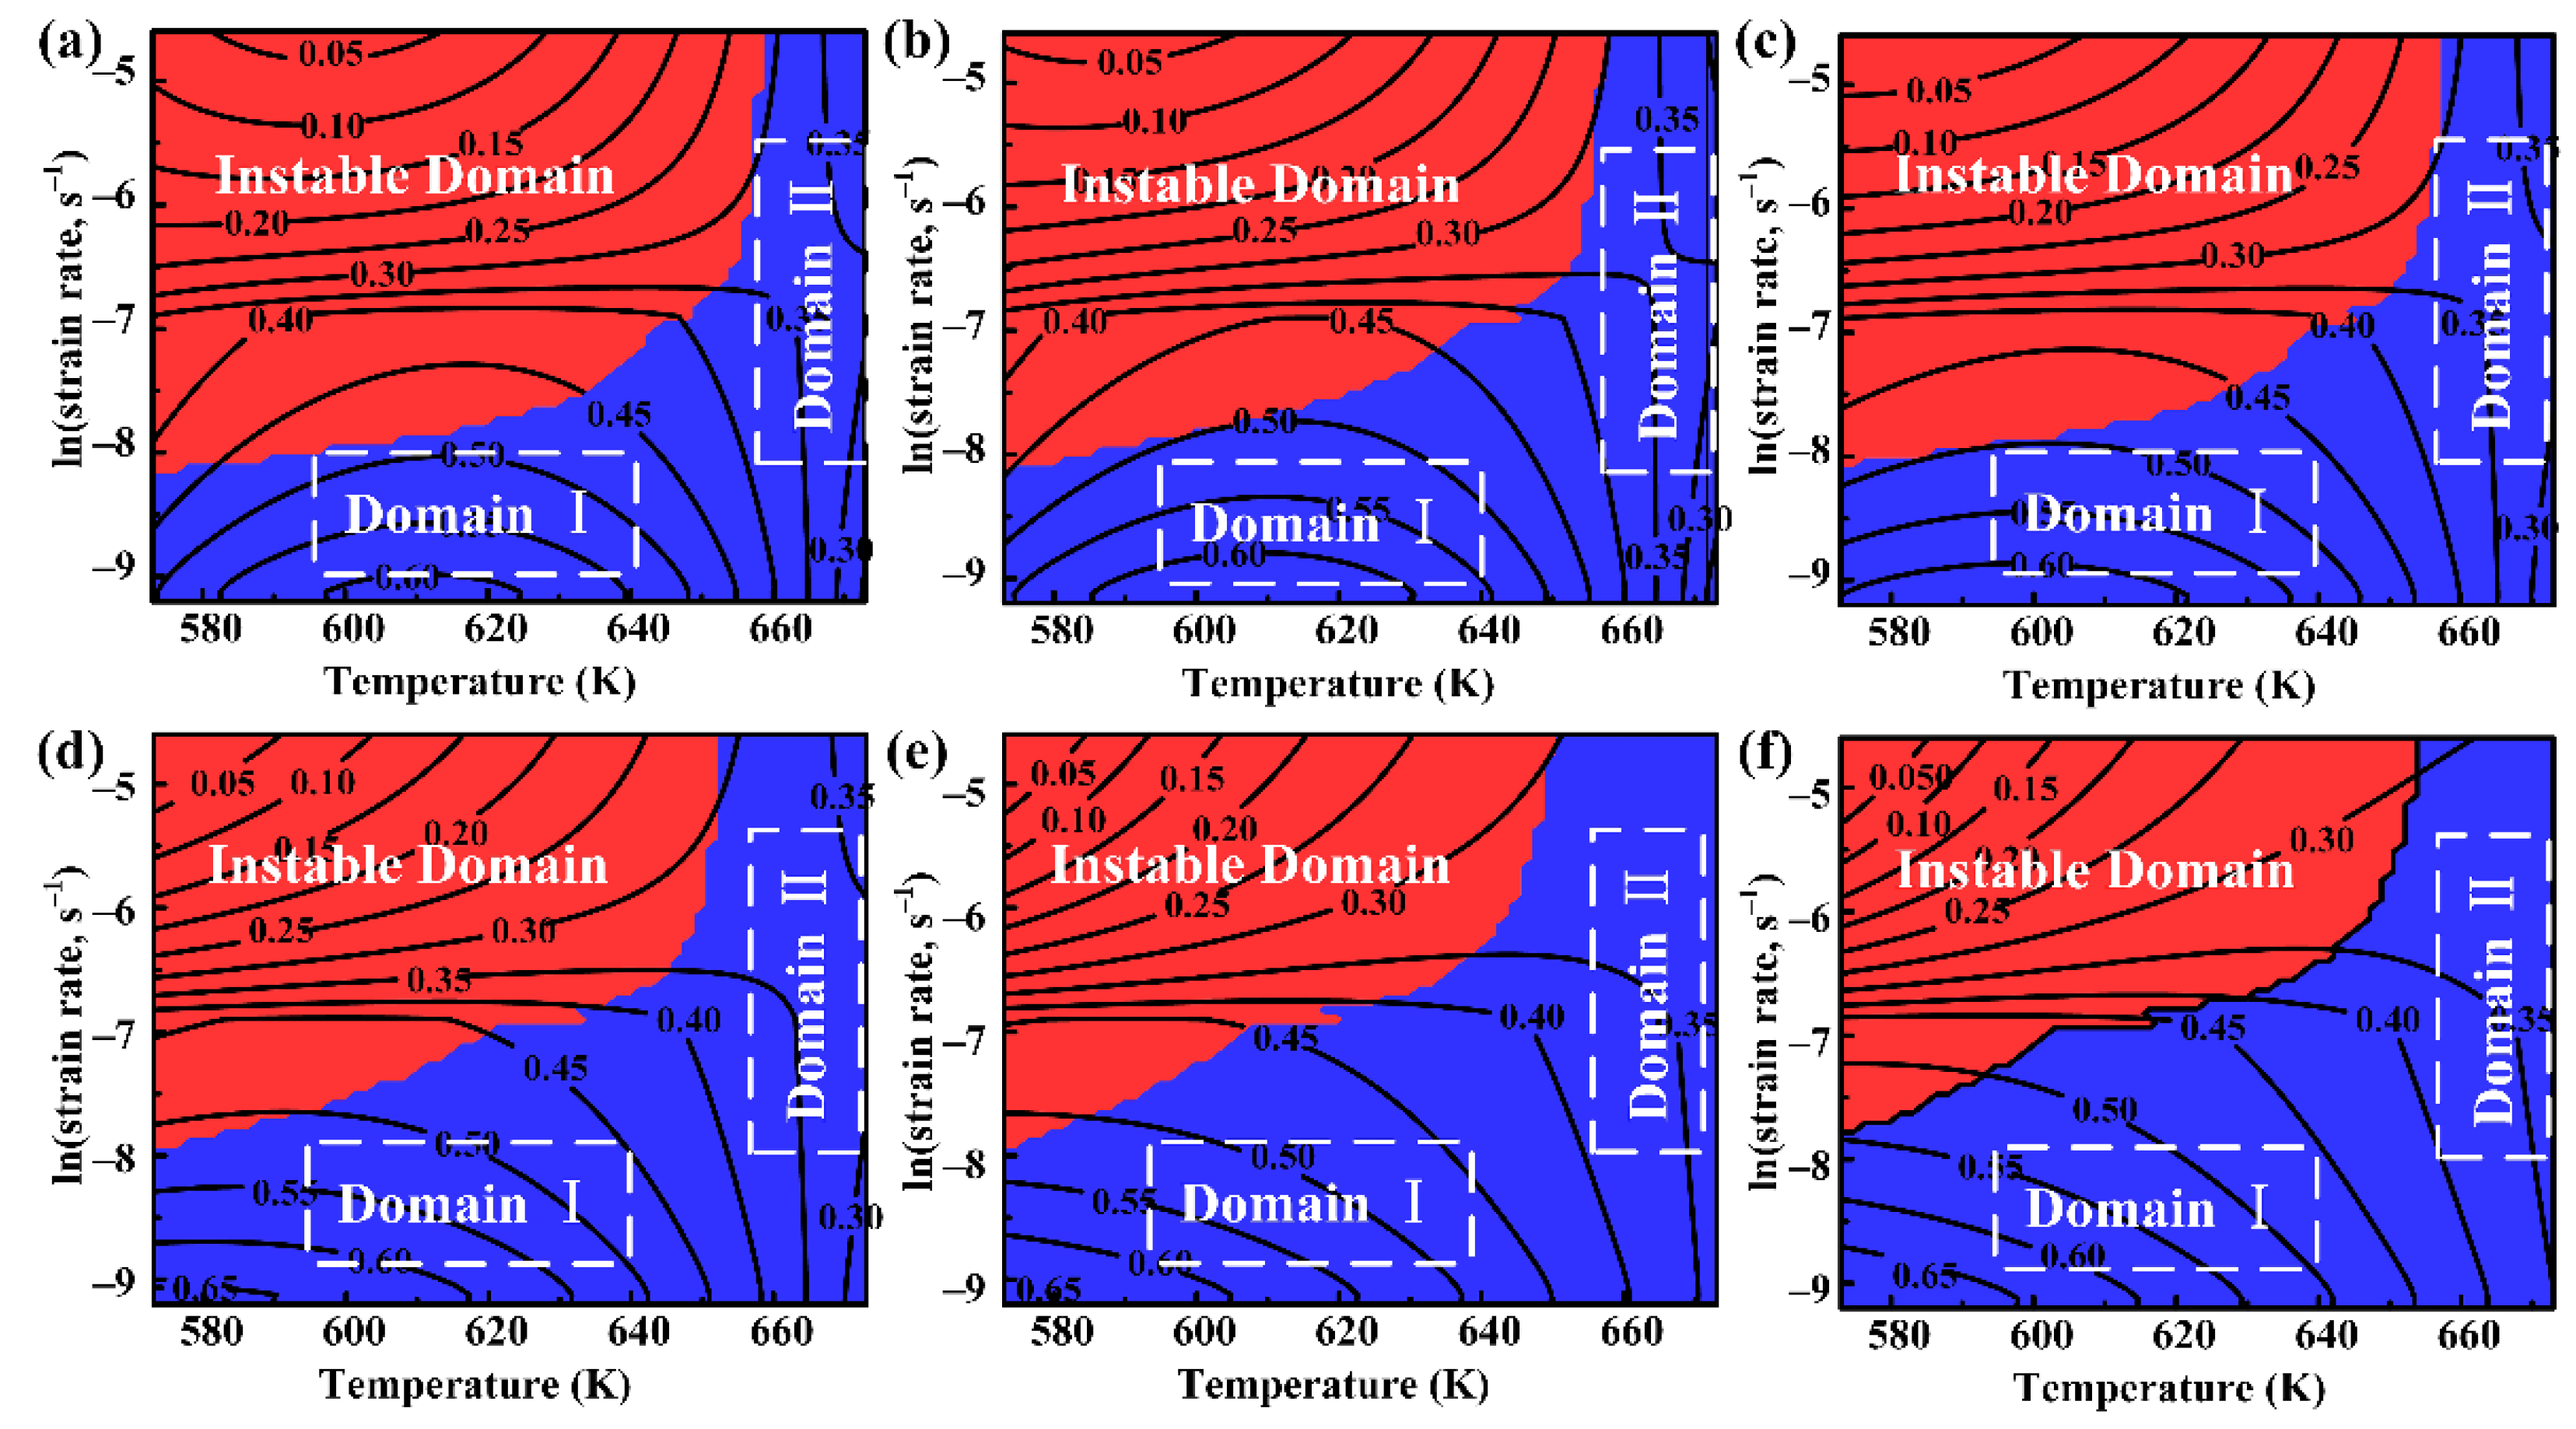
Finally, the power dissipation maps were established and the processing maps could be constructed by superimposing the power dissipation maps and instable maps using Matlab 2020 and Origin 8.0, as shown in Figure 8 and Figure 9. The values on counter lines symbolize the power dissipation efficiency (η) which can describe the microstructure evolution during hot deformation [35]. The shaded areas highlighted by red color mean the unstable regions while the areas in blue represent stable areas. It is clear that lower power dissipation efficiency lies in regions with lower temperature and higher strain rate, which exhibits the typically unstable flow. In the case of a relatively low temperature, DRX can hardly happen, and thus extensive dislocations are inevitably accumulated with increasing plastic deformation, causing severe working hardening [36]. Therefore, this condition trends to induce unstable flow of metallic materials. Moreover, it is too fast for a sufficient DRX to occur at a high strain rate, which contributes to dislocation multiplication, pile-ups and tangle. Consequently, this condition is also unfavorable for the hot working of metallic materials. Thus, choosing appropriate hot deformation conditions is a perquisite for ensuring that sufficient DRX occurs in the material and it possesses enough power dissipation efficiency. For the studied material, there exist two optimal deformation domains, which are the domain Ⅰ (T = 590–640 K, ε ˙ = 0.0001–0.0003 s−1) and domain Ⅱ (T = 650–670 K, ε ˙ = 0.0003–0.004 s−1), as shown in Figure 9. The power dissipation efficiency of these two domains is relatively large, where DRX would take place more completely.

4. Conclusions

The present study focused on the hot deformation behavior of as-extruded Mg–6Zn–5Ca–3Ce alloy fabricated by RS via isothermal compression tests at different temperatures and strain rates. Based on true stress–strain curves, the constitutive equations, power dissipation maps and processing maps using Murty criteria were established and the optimal deformation parameters were identified. Finally, the preferable process conditions were identified. The conclusions are as follows:
  • During isothermal compression, the flow stress of the alloy increases significantly with the increasing strain rate and the declining temperature.
  • The Arrhenius constitutive equation of the studied material can be described as ε ˙ = 8.8 × 10 11 [ sinh ( 0.0273 σ ) ] 3.13 exp ( 186300 8.314 T ) . Strain compensation is considered to introduce the effect of plastic strain on material parameters. The calculated flow stresses at various deformation conditions are generally consistent with the experimental results.
  • The dissipation maps and processing maps of as-extruded Mg–6Zn–5Ca–3Ce alloy fabricated by RS in the temperature range of 573–673 K and the strain rate range of 0.0001–0.01 s−1 were constructed. The preferential processing domains can be identified, which lie in the domain Ⅰ (T = 590–640 K, ε ˙ = 0.0001–0.0003 s−1) and domain Ⅱ (T = 650–670 K, ε ˙ = 0.0003–0.004 s−1).

Author Contributions

Conceptualization, methodology, visualization and writing—original draft preparation, C.B.; data curation and software, T.Z.; validation and writing—review and editing, L.S., L.H.; formal analysis, M.L.; supervision, M.Y. and Q.C. All authors have read and agreed to the published version of the manuscript.

Funding

This work was supported by the National Natural Science Foundation of China (Grant Nos. 51805064, 51701034, 51822509), the Scientific and Technological Research Program of Chongqing Municipal Education Commission (Grant No. KJQN201801137), the Basic and Advanced Research Project of Chongqing Science and Technology Commission (Grant Nos. cstc2017jcyjAX0062, cstc2018jcyjAX0035), the Chongqing University Key Laboratory of Micro/Nano Materials Engineering and Technology (Grant No. KFJJ2003).

Institutional Review Board Statement

Not applicable.

Informed Consent Statement

Not applicable.

Data Availability Statement

The data presented in this study are available on request from the corresponding author. The data are not publicly available due to privacy.

Conflicts of Interest

The authors declare no conflict of interest.

References

  1. He, J.J.; Mao, Y.; Fu, Y.J.; Jiang, B.; Xiong, K.; Zhang, S.M.; Pan, F.S. Improving the room-temperature formability of Mg-3Al-1Zn alloy sheet by introducing an orthogonal four-peak texture. J. Alloys Compd. 2019, 797, 443–455. [Google Scholar] [CrossRef]
  2. Li, K.; Chen, Z.Y.; Chen, T.; Shao, J.B.; Wang, R.K.; Liu, C.M. Hot deformation and dynamic recrystallization behaviors of Mg-Gd-Zn alloy with LPSO phases. J. Alloys Compd. 2019, 792, 894–906. [Google Scholar] [CrossRef]
  3. Shao, J.B.; Chen, Z.Y.; Chen, T.; Wang, R.K.; Liu, Y.L.; Liu, C.M. Texture evolution, deformation mechanism and mechanical properties of the hot rolled Mg-Gd-Y-Zn-Zr alloy containing LPSO phase. Mater. Sci. Eng. A 2018, 731, 479–486. [Google Scholar] [CrossRef]
  4. Zhou, T.; Chen, D.; Chen, Z.H.; Chen, J.H. Investigation on microstructures and properties of rapidly solidified Mg–6wt.% Zn–5wt.% Ca–3wt.% Ce alloy. J. Alloys Compd. 2009, 475, L1–L4. [Google Scholar] [CrossRef]
  5. Yin, P.; Li, N.F.; Lei, T.; Liu, L.; Ouyang, C. Effects of Ca on microstructure, mechanical and corrosion properties and biocompatibility of Mg–Zn–Ca alloys. J. Mater. Sci. Mater. M 2013, 24, 1365–1373. [Google Scholar] [CrossRef]
  6. Du, Y.Z.; Zheng, M.Y.; Qiao, X.G.; Wu, K.; Liu, X.D.; Wang, G.J.; Lv, X.Y. Microstructure and mechanical properties of Mg–Zn–Ca–Ce alloy processed by semi-continuous casting. Mater. Sci. Eng. A 2013, 582, 134–139. [Google Scholar] [CrossRef]
  7. Du, Y.Z.; Liu, D.J.; Ge, Y.F. Effects of Ce addition on mechanical and corrosion properties of the as-extruded Mg-Zn-Ca Alloy. J. Mater. Eng. Perform. 2020, 30, 488–496. [Google Scholar] [CrossRef]
  8. Zhou, T.; Yang, M.B.; Zhou, Z.M.; Hu, J.J.; Chen, Z.H. Microstructure and mechanical properties of rapidly solidified/powder metallurgy Mg–6Zn and Mg–6Zn–5Ca at room and elevated temperatures. J. Alloys Compd. 2013, 560, 161–166. [Google Scholar] [CrossRef]
  9. You, J.; Huang, Y.J.; Liu, C.M.; Zhan, H.Y.; Huang, L.X.; Zeng, G. Microstructural study of a Mg–Zn–Zr alloy hot compressed at a high strain rate. Materials 2020, 13, 2348. [Google Scholar] [CrossRef]
  10. Kang, Q.; Jiang, H.T.; Kuai, Z.; Zhang, Y.; Wang, Y.J.; Cai, Z.X. Optimization of the hot compression constitutive equation and processing map of Mg–4Zn–0.8Ca (wt%) alloy. Mater. Res. Express 2019, 6, 086526–086543. [Google Scholar] [CrossRef]
  11. Papillon, J.; Salero, P.; Mercier, F.; Fabrègue, D.; Maire, É. Compressive deformation behavior of dendritic Mg–Ca(–Zn) alloys at high temperature. Mater. Sci. Eng. A 2019, 763, 138180–138187. [Google Scholar] [CrossRef]
  12. Zhang, Z.M.; Yan, Z.M.; Du, Y.; Zhang, G.S.; Zhu, J.X.; Ren, L.Y.; Wang, Y.D. Hot deformation behavior of homogenized Mg-13.5Gd-3.2Y-2.3Zn-0.5Zr alloy via hot compression tests. Materials 2018, 11, 2282. [Google Scholar] [CrossRef] [Green Version]
  13. Koike, J.; Ohyama, R.; Kobayashi, T.; Suzuki, M.; Maruyama, K. Grain-boundary sliding in AZ31 magnesium alloys at room temperature to 523K. Mater. Trans. 2003, 44, 445–451. [Google Scholar] [CrossRef] [Green Version]
  14. Zhang, H.X.; Chen, S.F.; Cheng, M.; Zheng, C.; Zhang, S.H. Modeling the dynamic recrystallization of Mg–11Gd–4Y–2Zn–0.4Zr alloy considering non-uniform deformation and LPSO kinking during hot compression. Acta Metall. Sin. Engl. Lett. 2019, 32, 1122–1134. [Google Scholar] [CrossRef] [Green Version]
  15. Alizadeh, R.; Mahmudi, R.; Ruano, O.A.; Ngan, A.H.W. Constitutive analysis and hot deformation behavior of fine-grained Mg-Gd-Y-Zr alloys. Metall. Mater. Trans. A 2017, 48, 5699–5709. [Google Scholar] [CrossRef] [Green Version]
  16. Li, B.; Teng, B.G.; Xu, W.C. Hot deformation characterization of homogenized Mg-Gd-Y-Zn-Zr alloy during isothermal compression. JOM 2019, 71, 4059–4070. [Google Scholar] [CrossRef]
  17. Liu, H.N.; Li, Y.J.; Zhang, K.; Li, X.G.; Ma, M.L.; Shi, G.L.; Yuan, J.W.; Wang, K.K. Microstructure, hot deformation behavior, and textural evolution of Mg–3wt%Zn–1wt%Ca–0.5wt%Sr Alloy. J. Mater. Sci. 2020, 55, 12434–12447. [Google Scholar] [CrossRef]
  18. Lei, G.; Luo, A.A. Hot deformation behavior of as-cast Mg–Zn–Mn–Ce alloy in compression. Mater. Sci. Eng. A 2013, 560, 492–499. [Google Scholar]
  19. Ma, Z.W.; Hu, F.Y.; Wang, Z.J.; Fu, K.J.; Wei, Z.X.; Wang, J.J.; Li, W.J. Constitutive equation and hot processing map of Mg-16Al magnesium alloy bars. Materials 2020, 13, 3107. [Google Scholar] [CrossRef] [PubMed]
  20. Wang, J.H.; Li, S.P.; Ma, H.B. Evolution of microstructure, texture, and mechanical properties of as-extruded ND/ZK60 composite during hot compression deformation. Metals 2020, 10, 1191. [Google Scholar] [CrossRef]
  21. Li, M.A.; Xiao, S.L.; Xu, L.J.; Chen, Y.Y.; Tian, J.; Zhang, B.Y. Mechanical properties, deformation behavior and microstructure evolution of Ti-43Al-6Nb-1Mo-1Cr alloys. Mater. Charact. 2017, 136, 69–83. [Google Scholar] [CrossRef]
  22. Zhou, T.; Song, D.H.; Chen, Z.H. Microstructures, Mechanical and creep properties of rapidly solidification/powder metallurgy Mg-6wt.%Zn alloys with 5wt.%Ce and 1.5wt.%Ca additions. Mater. Sci. Forum 2016, 861, 253–263. [Google Scholar] [CrossRef]
  23. Shao, Z.W.; Zhu, X.R.; Wang, R.; Wang, J.; Xu, Y.D.; Zhao, B.R.; Ling, G.P. Hot deformation and processing map of as-homogenized Mg–9Gd–3Y–2Zn–0.5Zr alloy. Mater. Des. 2013, 51, 826–832. [Google Scholar] [CrossRef]
  24. Xu, C.; Pan, J.P.; Nakata, T.; Qiao, X.G.; Chi, Y.Q.; Zheng, M.Y.; Kamado, S. Hot compression deformation behavior of Mg-9Gd-2.9Y-1.9Zn-0.4Zr-0.2Ca (wt%) alloy. Mater. Charact. 2017, 124, 40–49. [Google Scholar] [CrossRef]
  25. Xue, Y.; Zhang, Z.M.; Lu, G.; Xie, Z.P.; Yang, Y.B.; Cui, Y. Study on flow stress model and processing map of homogenized Mg-Gd-Y-Zn-Zr alloy during thermomechanical processes. J. Mater. Eng. Perform. 2014, 24, 964–971. [Google Scholar] [CrossRef]
  26. Zhang, C.S.; Ding, J.; Dong, Y.Y.; Zhao, G.Q.; Gao, A.J.; Wang, L.J. Identification of friction coefficients and strain-compensated Arrhenius-type constitutive model by a two-stage inverse analysis technique. Int. J. Mech. Sci. 2015, 98, 195–204. [Google Scholar] [CrossRef]
  27. Zhou, H.; Wang, Q.D.; Ye, B.; Guo, W. Hot deformation and processing maps of as-extruded Mg–9.8Gd–2.7Y–0.4Zr Mg alloy. Mater. Sci. Eng. A 2013, 576, 101–107. [Google Scholar] [CrossRef]
  28. Chen, B.; Zhou, W.M.; Li, S.; Li, X.L.; Lu, C. Hot compression deformation behavior and processing maps of Mg-Gd-Y-Zr alloy. J. Mater. Eng. Perform. 2013, 22, 2458–2466. [Google Scholar] [CrossRef]
  29. Zheng, H.R.; Yu, L.T.; Lyu, S.Y.; You, C.; Chen, M.F. Insight into the role and mechanism of nano MgO on the hot compressive deformation behavior of Mg-Zn-Ca alloys. Metals 2020, 10, 1357. [Google Scholar] [CrossRef]
  30. Lin, Y.C.; Xia, Y.C.; Chen, X.M.; Chen, M.S. Constitutive descriptions for hot compressed 2124-T851 aluminum alloy over a wide range of temperature and strain rate. Comput. Mater. Sci. 2010, 50, 227–233. [Google Scholar] [CrossRef]
  31. Wang, Y.J.; Peng, J.; Zhong, L.P.; Pan, F.S. Modeling and application of constitutive model considering the compensation of strain during hot deformation. J. Alloys Compd. 2016, 681, 455–470. [Google Scholar] [CrossRef]
  32. Xu, W.C.; Jin, X.Z.; Shan, D.B.; Chai, B.X. Study on the effect of solution treatment on hot deformation behavior and workability of Mg-7Gd-5Y-0.6Zn-0.8Zr magnesium alloy. J. Alloys Compd. 2017, 720, 309–323. [Google Scholar] [CrossRef]
  33. Murty, S.V.S.N.; Rao, B.N. Instability map for hot working of 6061 Al-10 vol% metal matrix composite. J. Phys. D Appl. Phys. 1998, 31, 3306–3311. [Google Scholar] [CrossRef]
  34. Murty, S.V.S.N.; Rao, B.N. On the development of instability criteria during hot working with reference to IN 718. Mater. Sci. Eng. A 1998, 254, 76–82. [Google Scholar] [CrossRef]
  35. Xia, X.S.; Chen, Q.; Li, J.P.; Shu, D.Y.; Hu, C.K.; Huang, S.H.; Zhao, Z.D. Characterization of hot deformation behavior of as-extruded Mg–Gd–Y–Zn–Zr alloy. J. Alloys Compd. 2014, 610, 203–211. [Google Scholar] [CrossRef]
  36. Ullmann, M.; Kittner, K.; Prahl, U. Hot deformation and dynamic recrystallisation behaviour of twin-roll cast Mg-6.8Y-2.5Zn-0.4Zr magnesium alloy. Materials 2021, 14, 307. [Google Scholar] [CrossRef] [PubMed]
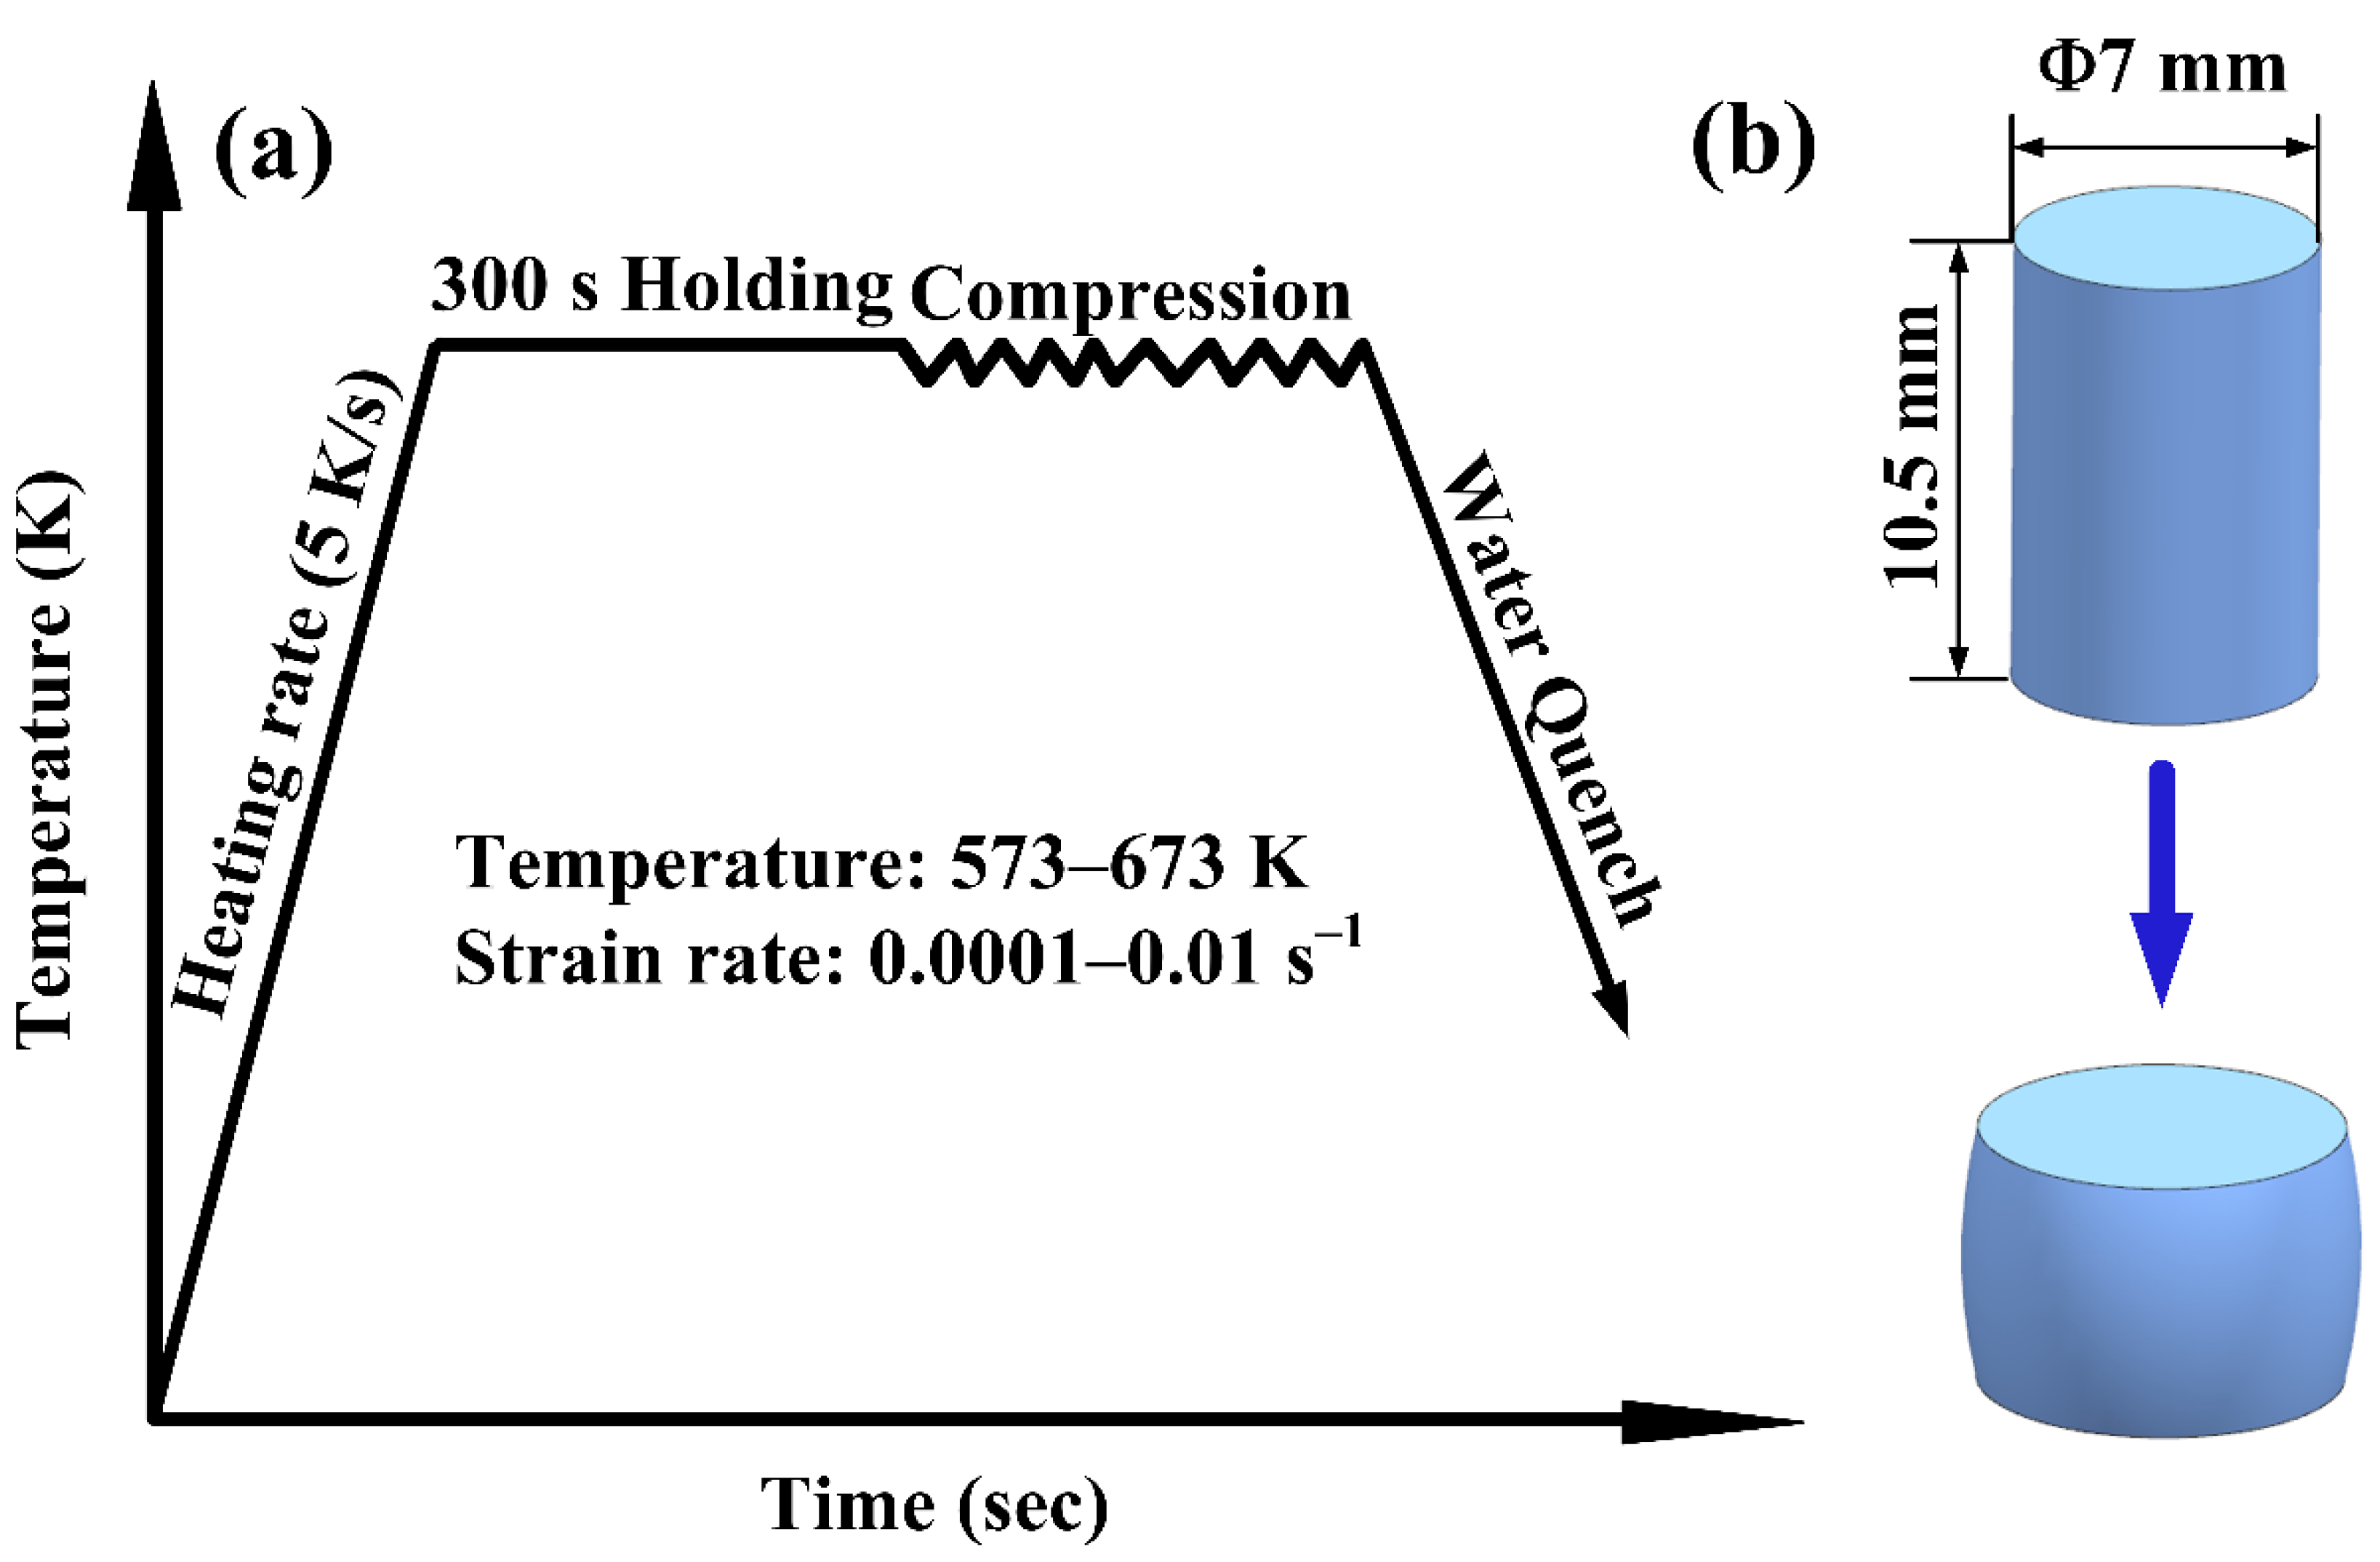
Figure 1. Schematic diagram of (a) hot compression process and (b) the dimensions of specimens.
Metals 11 00480 g001
Figure 2. Transmission electron microscope (TEM) images of as-extruded Mg–6Zn–5Ca–3Ce alloy fabricated by RS: (a) bright image with low magnification; (b) bright image with high magnification.
Metals 11 00480 g002
Figure 3. True stress–strain curves of as-extruded Mg–6Zn–5Ca–3Ce alloy fabricated by rapid solidification (RS) at (a) 0.01 s−1; (b) 0.001 s−1; (c) 0.0001 s−1 and (d) variation of the peak stress under different deformation conditions.
Metals 11 00480 g003
Figure 4. The linearly fitting relationship of as-extruded Mg–6Zn–5Ca–3Ce alloy fabricated by RS: (a) ln ε ˙ ln σ ; (b) ln ε ˙ σ ; (c) ln ε ˙ ln [ sinh ( α σ ) ] and (d) ln [ sinh ( α σ ) ] 1000 T .
Metals 11 00480 g004
Figure 5. Relationship between the Zenner–Hollomon parameter ( ln Z ) and ln [ sinh ( α σ ) ] .
Metals 11 00480 g005
Figure 6. The polynomial fitting results of the material constants: (a) α ε ; (b) Q ε ; (c) n ε and (d) ln A ε .
Metals 11 00480 g006
Figure 7. Measured and calculated flow stresses of as-extruded Mg–6Zn–5Ca–3Ce alloy fabricated by RS under various deformation conditions: (a) 0.0001 s−1; (b) 0.001 s−1 and (c) 0.01 s−1.
Metals 11 00480 g007
Figure 8. The power dissipation maps of as-extruded Mg–6Zn–5Ca–3Ce fabricated by RS at various strains: (a) 0.1; (b) 0.2; (c) 0.3; (d) 0.4; (e) 0.5; (f) 0.6.
Metals 11 00480 g008
Figure 9. The processing maps of as-extruded Mg–6Zn–5Ca–3Ce fabricated by RS at various strains: (a) 0.1; (b) 0.2; (c) 0.3; (d) 0.4; (e) 0.5; (f) 0.6.
Metals 11 00480 g009
Table 1. Nominal chemical composition of RS Mg–6Zn–5Ca–3Ce alloy.
AlloyZn (wt%)Ca (wt%)Ce (wt%)Mg
Mg–6Zn–5Ca–3Ce653Balance
Table 2. Nomenclatures of the physical quantities and abbreviations.
ε ˙ Strain rate(s−1)
ε Strain
QActivation energy (kJ/mol)
Rthe universal gas constant (8.314 J/(mol*K))
σFlow stress (MPa)
ATemperature-independent constant
αStress level parameter
βHyperbolic sine exponent
nStress exponent
ZZener-Holloman parameter
ηPower dissipation coefficient
PTotal power
GConsumption of plastic deformation
JConsumption of microstructural evolution
mStrain rate sensitivity index
TEMTransmission electron microscopy
DRXDynamic recrystallization
DRVDynamic recovery
DDRXDiscontinuous dynamic recrystallization
Table 3. Calculated material constants ( α , Q , n and ln A ) of as-extruded Mg–6Zn–5Ca–3Ce alloy fabricated by RS.
Material Constant α Q ( J / m o l ) n l n A
ε ε ˙ = A [ sinh ( α σ ) ] n exp ( Q R T )
0.050.0277188,9103.905627.9870
0.10.0278187,3603.531627.7654
0.150.0278190,0603.562628.2665
0.20.0281180,5403.322426.5097
0.250.0278180,4203.367426.5022
0.30.0281177,7103.262026.0034
0.350.0279171,5203.166324.8966
0.40.0278165,5203.106023.7974
0.450.0279164,5403.039023.6428
0.50.0280168,5803.078224.3824
0.550.0278163,0703.009923.3730
0.60.0276160,3402.986422.8882
0.650.0275157,6002.944222.4021
0.70.0272159,1402.978622.7239
Table 4. The relationship between material constants and ε using sixth degree polynomial.
MaterialMg–6Zn–5Ca–3Ce
constant Z = ε ˙ exp ( Q R T )
σ = 1 α ln { ( Z A ) 1 n + [ ( Z A ) 2 n + 1 ] 1 2 }
α 0 . 02797 0 . 0111 ε + 0 . 15334 ε 2 0 . 79727 ε 3 + 1.95385 ε 4 2.27157 ε 5 + 1.0031 ε 6
Q 197 . 3 315 . 3 ε + 3979 . 9 ε 2 23050 . 1 ε 3 + 60675.7 ε 4 73992.7 ε 5 + 34052.1 ε 6
n 4 . 75 25 . 59 ε + 209 . 6 ε 2 887 . 1 ε 3 + 1939.8 ε 4 2097.3 ε 5 + 887.6 ε 6
ln A 29 . 3 51 . 9 ε + 679 . 6 ε 2 4024 . 6 ε 3 + 10717.1 ε 4 13164.3 ε 5 + 6090.1 ε 6
Publisher’s Note: MDPI stays neutral with regard to jurisdictional claims in published maps and institutional affiliations.