Article

Effect of the Fe2O3 Addition Amount on Dephosphorization of Hot Metal with Low Basicity Slag by High-Temperature Laboratorial Experiments

1
State Key Laboratory of Advanced Special Steel, School of Materials Science and Engineering, Shanghai University, Shanghai 200444, China
2
HBIS Handan Iron and Steel Group Co., LTD, Handan City, Hebei 056015, China
*
Author to whom correspondence should be addressed.
Metals 2021, 11(3), 417; https://doi.org/10.3390/met11030417
Submission received: 7 February 2021 / Revised: 21 February 2021 / Accepted: 28 February 2021 / Published: 4 March 2021

Abstract

:
In this paper, the influence of the Fe2O3 addition amount on the dephosphorization of hot metal at 1623 K with the slag of the low basicity (CaO/SiO2) of about 1.5 was investigated by using high-temperature laboratorial experiments. With increasing the Fe2O3 addition amount from 5 to 30 g, the contents of [C], [Si], [Mn] and [P] in the hot metal at the end of dephosphorization are decreased and the corresponding removal ratios increase. In dephosphorization slags, the phosphorus mainly exists in the form of the nCa2SiO4–Ca3(PO4)2 solid solution in the phosphorus-rich phase and the value of coefficient n decreases from 20 to 1. Furthermore, the oxygen potential and activity at the interface between the slag and hot metal are increased. When the oxygen potential and the oxygen activity at the interface are greater than 0.72 × 10⁻¹² and 7.1 × 10⁻³, respectively, the dephosphorization ratio begins to increase rapidly. When the Fe2O3 addition amount is increased to 30 g, the ratio of the Fe2O3 addition amount to theoretical calculation consumption is around 175%, and the dephosphorization ratio reaches the highest value of 83.3%.

1. Introduction

The NDSP (new double slag converter steelmaking process) is mainly divided into two stages: in the first stage, the desiliconization and dephosphorization are carried out simultaneously at low temperature with low basicity, and then the multiphase slag containing the phosphorus (P)-rich phase is poured out [1]. In the second stage, the decarburization is carried out in the same converter, and the decarburization slag with high basicity (CaO/SiO2) is left in the furnace to be reused for dephosphorization in the next heat. Therefore, the lime consumption and the amount of waste slag can be greatly reduced.
In the NDSP, the total iron (T.Fe) content in the slag is very important for the supply of the oxidant, as well as for the slag viscosity and the interfacial oxygen potential, P O 2 , to promote the dephosphorization reaction of hot metal in the dephosphorization period [1,2,3,4,5,6,7]. When the T.Fe content in the slag is too low, the viscosity of the molten slag tends to increase, which inhibits the mass transfer in the slag to reduce the dephosphorization efficiency of the hot metal [7]. In addition, the P O 2 at the interface between the molten slag and hot metal will also decrease, which decreases the oxidation rate of the phosphorus in the hot metal [6]. However, when the T.Fe content in the slag is too high, the reaction between carbon and oxygen in the hot metal proceeds obviously after desiliconization, which results in a large amount of slag splashed out of the furnace and the increased iron loss.
Therefore, it is extremely meaningful to study the effect of the T.Fe content in the slag on the equilibrium partition ratio of phosphorus (LP) between the molten slag and the carbon-saturated hot metal at low temperature with low basicity. There are some studies which investigated the influence of T.Fe content on LP based on the laboratorial equilibrium experiments [1,4,8,9,10]. For instance, Jeoungkiu et al. studied the LP between CaO–SiO2–FetO slags and iron foil at 1573 K, showing that the LP slightly decreases when the T.Fe content is increased from 18~24 to 55% with the basicity (CaO/SiO2) of around unity (0.9~1.1) [4]. The LP between CaO–FeO–SiO2–Al2O3–Na2O–TiO2 slag and iron foil were also investigated with the slag basicity of 0.8~1.3 at 1573, 1623 and 1673 K, respectively [8]. It was found that the LP first increases slightly and then decreases with increasing the FeO content, and the effect of FeO content on the LP is weaker than those of the slag basicity and temperature.
Furthermore, some industrial experiments have been conducted to study the effect of the T.Fe content in the slag on the dephosphorization of hot metal in the NDSP [1,11,12,13]. For example, Ogawa et al. reported that the rate of dephosphorization is increased by increasing P O 2 due to the increase in the iron oxide concentration and the mass transfer because of stronger agitation of the slag layer resulted from the enhanced rate of CO gas formation. However, there was no distinguishable correlation between the rate of dephosphorization and the iron oxide concentration in the slag [1]. It can also be found from the experimental results that the relationship between LP and the FeO content in the dephosphorization slag is not obvious at 1600~1700 K with the slag basicity of 1.2~2 [12].
There are some studies on the micro-morphologies and main compositions in the different phases of dephosphorization slag at low temperature with low basicity [6,10,14,15,16,17,18,19,20,21]. It was reported that the phase of dephosphorization slag is mainly composed of Fe (iron)-rich phase including metal oxide and Ca3Fe2O5, P-rich phase including 2CaO·SiO2 (C2S), Ca3(PO4)2 (C3P) and nCa2SiO4–Ca3(PO4)2 (nC2S–C3P), and matrix phase [6]. Zhou et al. showed that there are mainly two kinds of P-rich phases with different phosphorus contents [10]. One is the low-phosphorus phase (6C2S-mC3P, m = 0.6294~1.3400) and the other is the high-phosphorus phase (C2S-nC3P, n = 1.1064~1.4303) in multiphase CaO-FeOt-SiO2-P2O5 (6%~13%) slags.
As mentioned above, there are few laboratorial investigations on the effect of the Fe2O3 addition amount on the dephosphorization of hot metal with CaO-FeO-SiO2-MgO-Al2O3 molten slag at 1623 K with the lower slag basicity of about 1.5, which is just corresponding to the dephosphorization conditions of the NDSP [12,22,23]. In our previous papers, the effects of basicity and temperature on the dephosphorization in the NDSP were investigated [20,21]. In the present work, the effect of the Fe2O3 addition amount on the dephosphorization of hot metal at 1623 K with a low basicity slag of about 1.5 was studied by using the high-temperature laboratorial experiments. The effects of the Fe2O3 addition amount on the contents of oxides in the slag, the contents of elements in the hot metal and the corresponding removal ratios of impurity elements were studied. The effects of the Fe2O3 addition amount on the measured LP and P O 2 were also investigated. The determination of the optimal Fe2O3 addition amount was discussed. Moreover, the mineralogical phases and the compositions of different phases in dephosphorization slag were further studied by using SEM-EDS (scanning electron microscopy-energy dispersive spectrometer) with the different Fe2O3 addition amounts.

2. Experimental Procedure

2.1. Preparation of Decarbonization Slag and Pig Iron

In the present work, the decarburization slag reused for the next heat dephosphorization was prepared by the target components as listed in Table 1, which have the similar compositions to the slag at the end of the industrial decarburization process. The basicity, R, is the mass ratio of CaO to SiO2. In order to study the dephosphorization in the NDSP, we simulate the industrial process to use the premelted decarburization slag, which is used in the industrial dephosphorization in the NDSP. The use of premelted decarburization slag can accelerate the lime melting and improve the utilization efficiency of lime.
The reagent-grade CaO, FeO, SiO2, Ca3(PO4)2, MgO and MnO were first put into the magnesium oxide crucible with the inner diameter, the outer diameter and the height of 56, 62 and 120 mm, respectively. Then they were heated to 1873 K with the holding time of 1 h to make the slag melt evenly in an electric resistance furnace under Ar gas atmosphere. Figure 1 shows the equilibrium solidification curve of this premelted slag with the target basicity of 2.98 as shown in Table 1, which is drawn with Factsage 7.3. RO-1 and RO-2 in Figure 1 represent two kinds of RO (metal oxide) phases, respectively. It is noticed that the content of C2S–C3P solid solution reaches the maximum value at the temperature of about 1573 K. In the practical experiments, as the temperature was dropped to about 1573 K at the rate of 3 K min−1 and then kept the temperature with the holding time of 15 min in the electrical furnace, much more C2S–C3P solid solution should be precipitated. Then, the molten slag together with the crucible was taken out from the furnace and quenched in water, and the molten slag was used as the decarburization slag for the dephosphorization experiment. The actual compositions of this decarburization slag which are similar to the target compositions are shown in Table 1. The detailed component error analysis between the actual and target compositions can refer to the author’s previous papers [20].
All the pig irons were prepared by premelting mixtures of pure iron, carbon blocks, ferrophosphorus, silicon and manganese powders, which is described in detail in our previous paper [20].

2.2. Experimental Procedure and Analysis Method

In each experiment, about 300 g pig irons were put into the alumina crucible and heated to 1623 K. Then the initial hot metal sample was taken with a small silica tube by suction. Thereafter, the decarburization slags of 18 g mixed with a certain amount of reagent-grade Fe2O3 from 5 to 30 g were added immediately. The theoretical basicities of dephosphorization slags calculated by mass balance were about 1.5. The reaction time was 15 min, which began to be counted after adding all the raw materials.
In the present work, the effect of the Fe2O3 addition amount on the dephosphorization of hot metal with decarburization slag was studied in NDSP. The carbon monoxide gas produced by the violent reaction between the carbon in the hot metal and the oxidant in the slag strongly stirred the melt and molten slag during the dephosphorization process, which played an important role in agitation in the reaction. Therefore, the reaction time was all set to be 15 min for each experiment at the same reaction temperature. The detailed experimental procedure and experiment apparatus can refer to our previous papers [20,21].
When the reaction was ended, the alumina crucible was taken out from the furnace and quenched in water immediately. The detailed preparation process and the analysis of the metal and slag samples can refer to our previous paper [20]. It should be noted that the contents of FeO in the slags were measured by the potassium dichromate titration method according to Yb/T140-2009 standard.

3. Results

The results of the SEM image (Carl Zeiss Microscopy Ltd, Cambridge, UK), XRD analysis (Brooke AXS Ltd, Karlsruhe, Germany) and line scan of decarburization slag are shown in Figure 2. The corresponding compositions of each phase in the slag are shown in Table 2. From Figure 2, combined with the compositions of each phase in Table 2, it can be concluded that the decarburization slag is mainly composed of P-rich phase A, metal oxide phase B and C, and a small amount of iron particles phase D. The content of Fe in phase D is analyzed to be close to 100%. These results are consistent with the compositions precipitated at 1573 K containing RO-1, RO-2 and C2S–C3P phases, as shown in Figure 1, because the decarburization slag is quenched after taking out from the furnace at the temperature of 1573 K. It illustrates that the C2S particles in the slag can combine with C3P to form the nC2S–C3P solid solution. Furthermore, the crystallization ratio of nC2S–C3P can be calculated by Image-Pro Plus software, which is defined as the proportion of P-rich phase area in SEM image at the magnification of 100 times. The estimated value of the area fraction of nC2S–C3P is about 53%, which is also in good agreement with the result in Figure 1 at the temperature of 1573 K. This indicates that a large amount of unsaturated nC2S–C3P solid solution in phase A with a lower P2O5 content as shown in Table 2 are generated in the slag, which can further combine with C3P in the liquid slag to form the nC2S–C3P solid solution with a higher P2O5 content.
Table 3 shows the compositions of the slag and hot metal after dephosphorization as well as the compositions of the initial hot metal. F5 indicates the sample of the Fe2O3 addition amount of 5 g, the same are from F10 to F30. It can be seen from Table 3 that the initial compositions of hot metal are basically the same, and the Fe2O3 addition amount was increased from 5 to 30 g, respectively. The FeO contents in the slag are very close to the theoretical conversion values from the T.Fe contents. Therefore, it can be considered that the iron element in the slag mainly exists in the form of FeO.

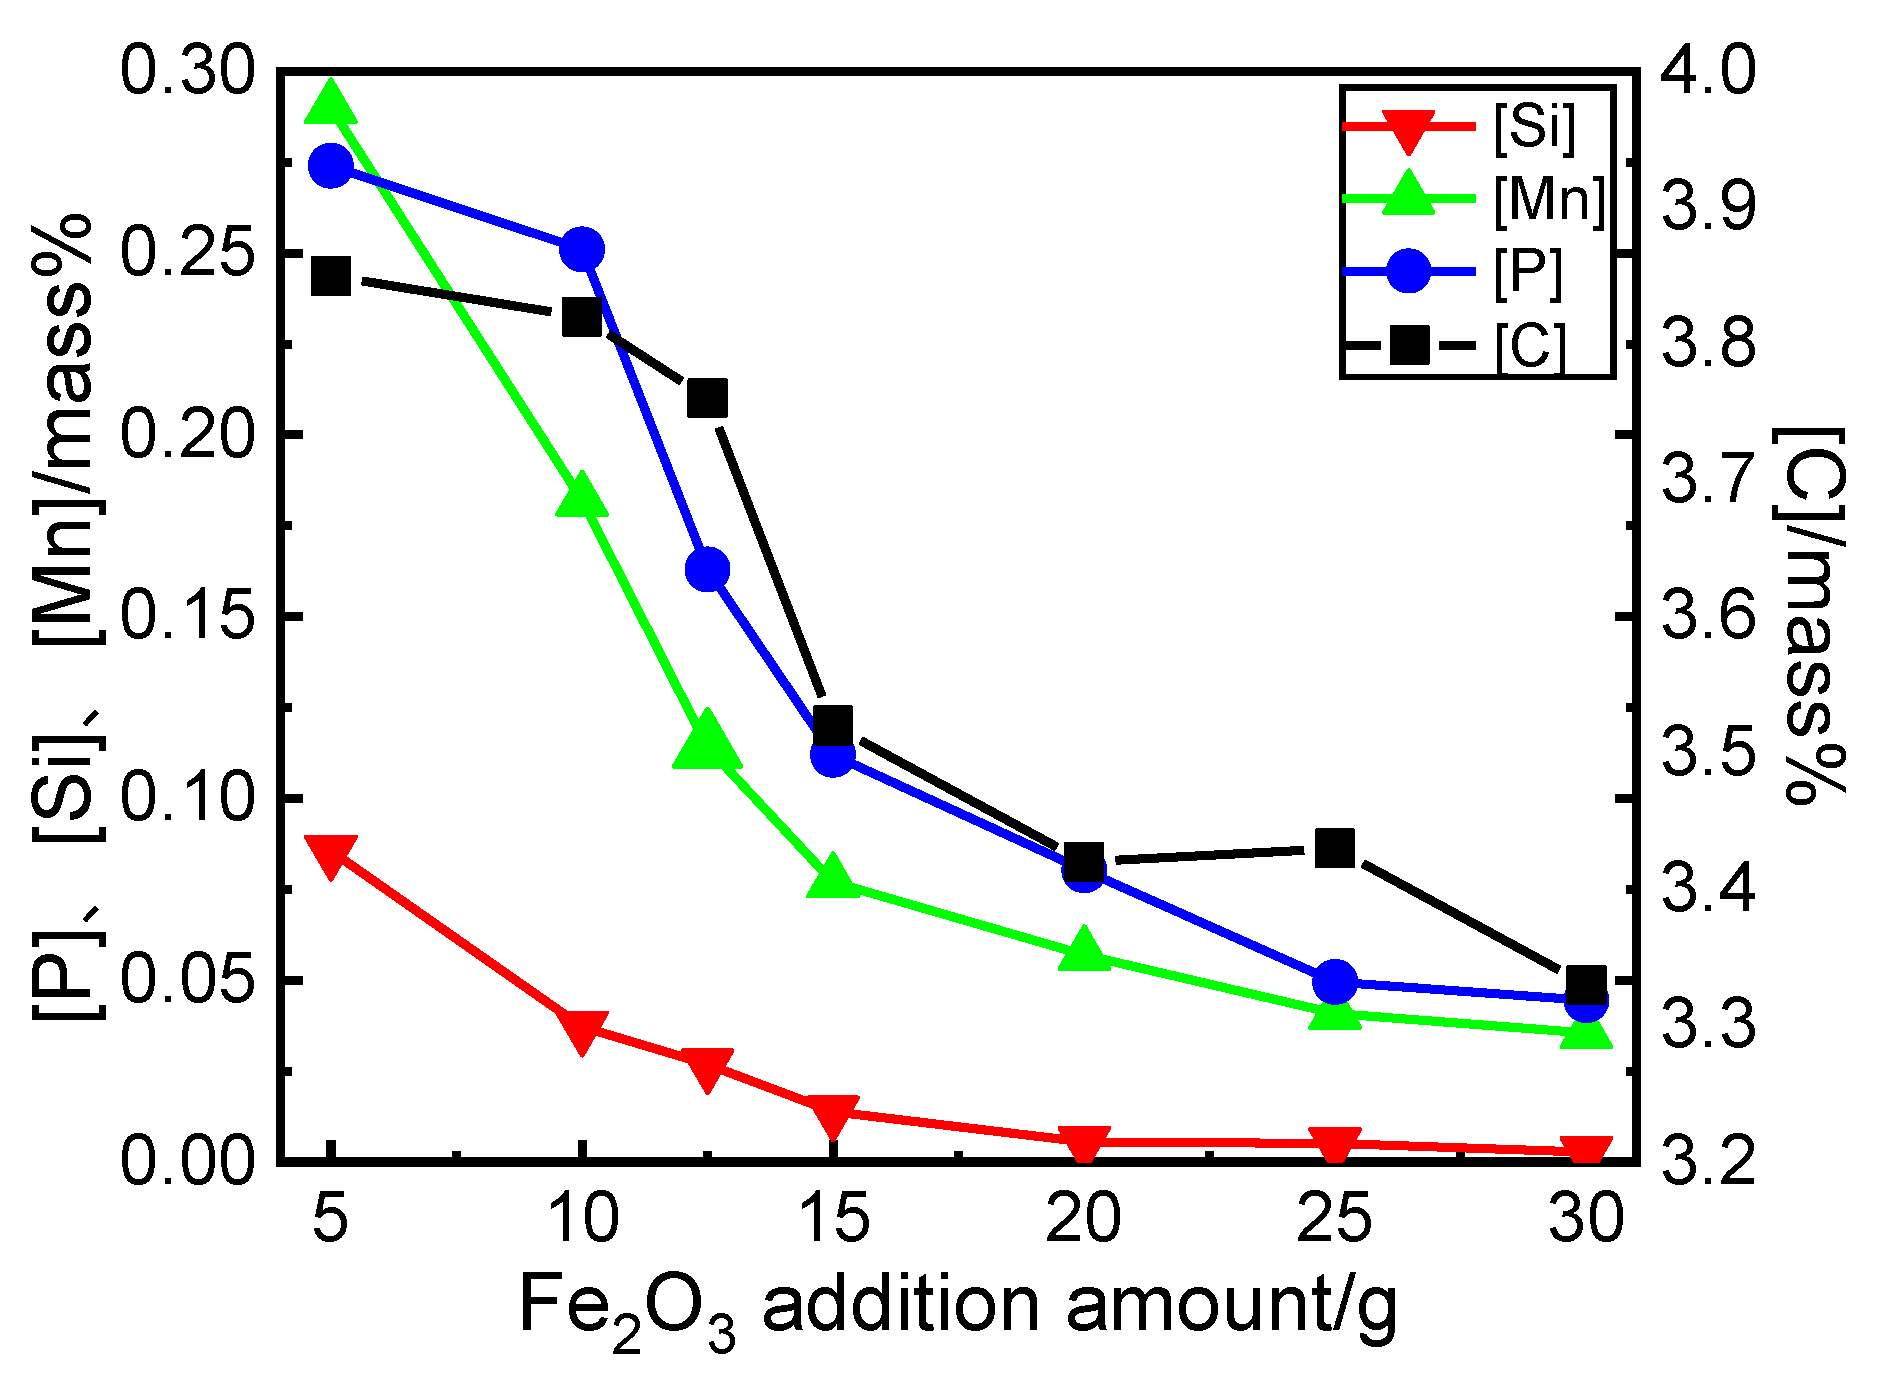
3.1. Effect of the Fe2O3 Addition Amount on the Contents of Elements in the Hot Metal after Dephosphorization

Figure 3 shows the effect of the Fe2O3 addition amount on the contents of elements in the hot metal after dephosphorization. It can be seen that the [C], [Si], [Mn] and [P] contents in the hot metal after dephosphorization steadily decrease with the increase in the Fe2O3 addition amount, because the increase in the Fe2O3 addition amount will promote the oxidation of elements in the hot metal. When the Fe2O3 addition amount is increased to 15 g, the [Si] content in the hot metal after dephosphorization decreases to trace. This is because the silicon in the hot metal is more easily oxidized than other elements.

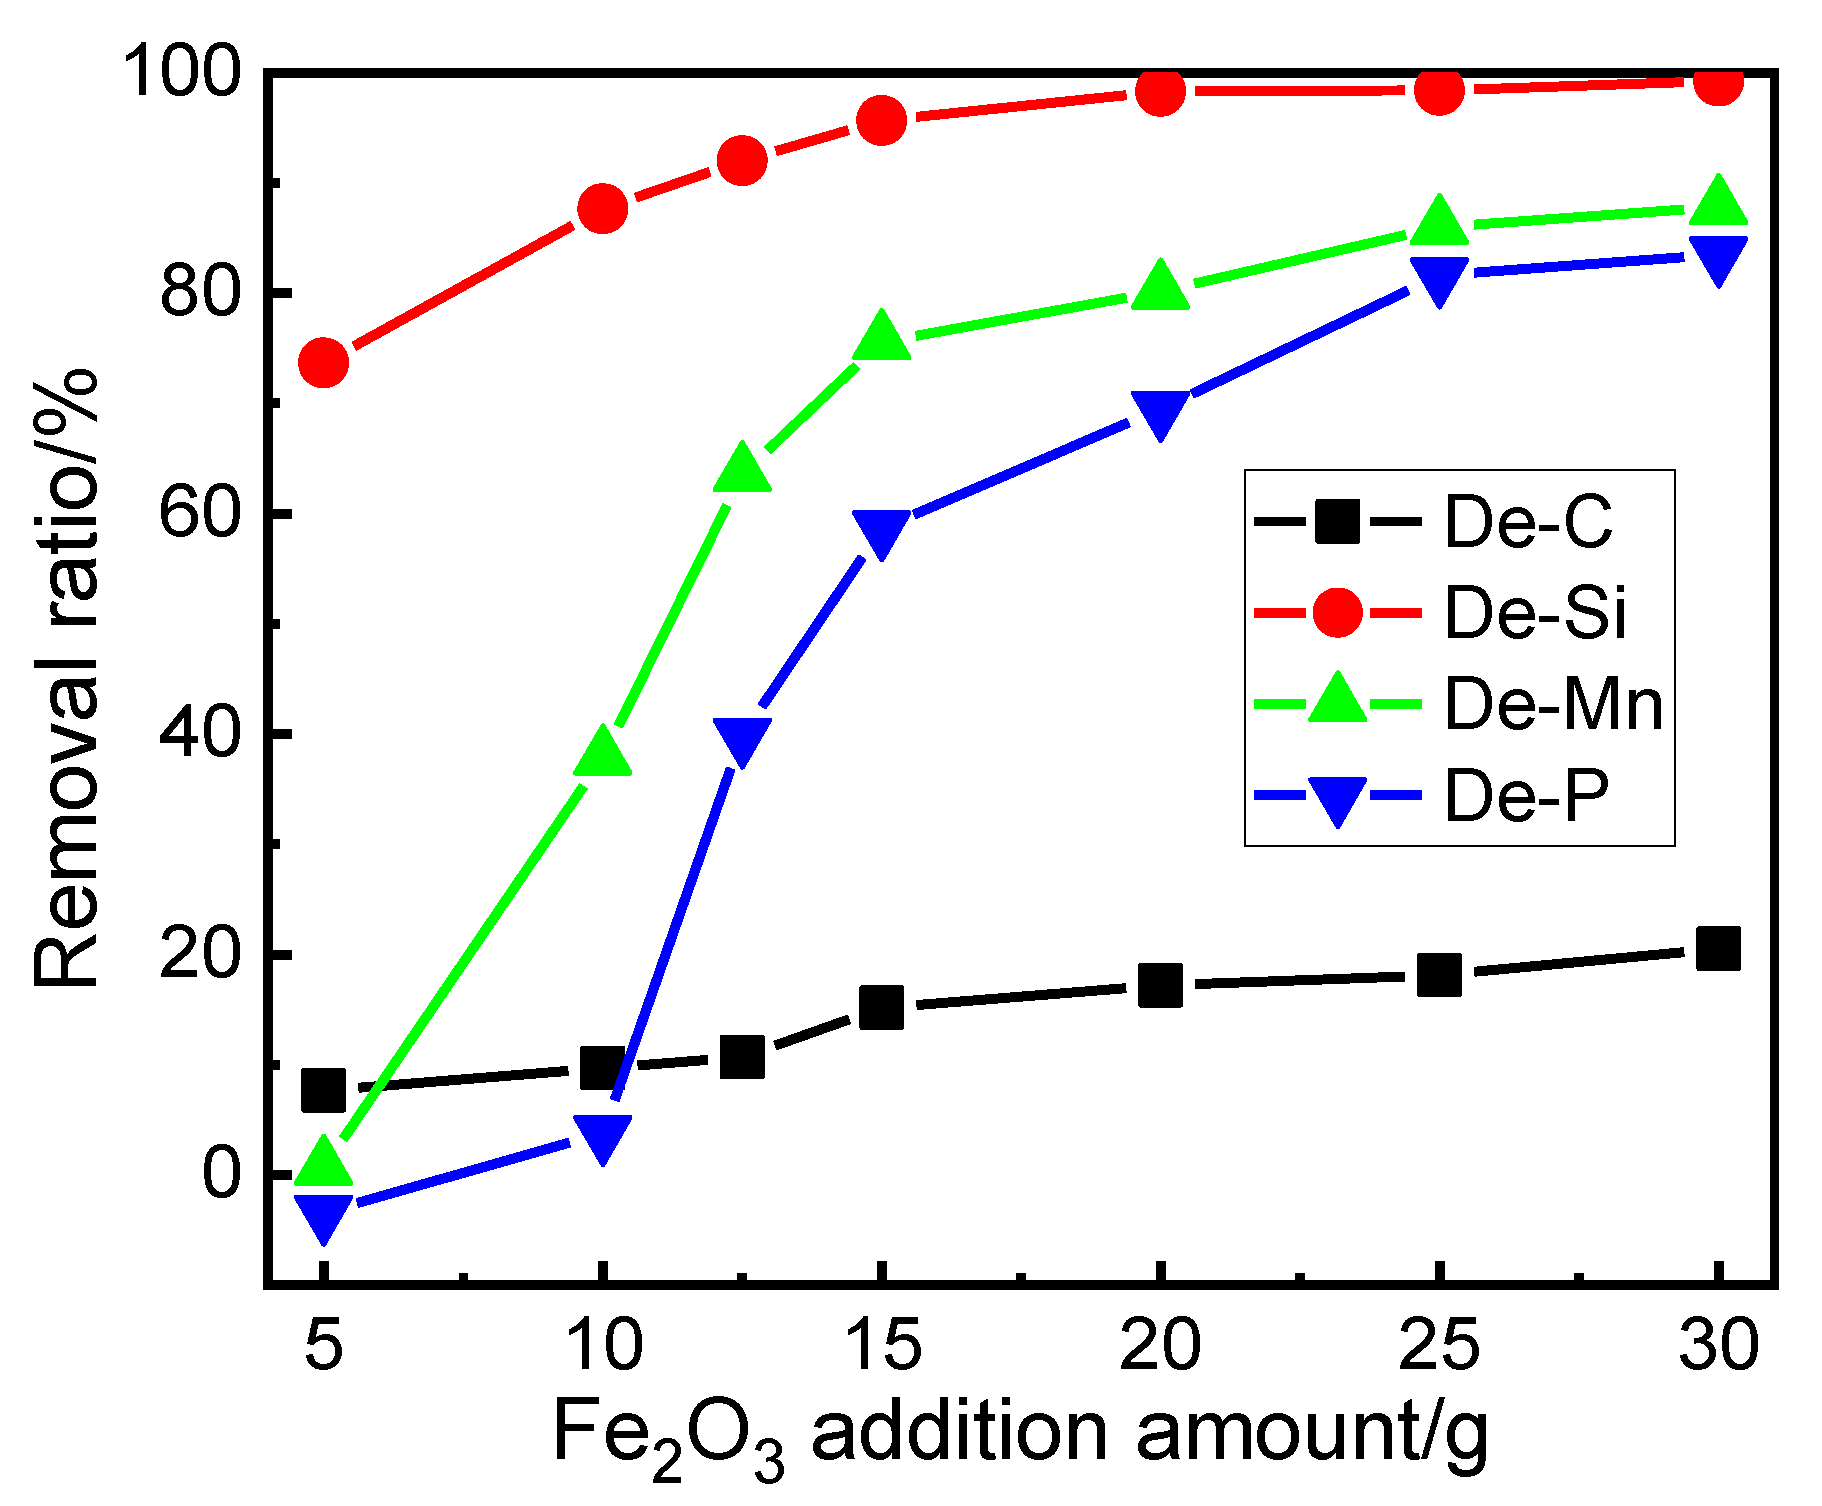
3.2. Effect of the Fe2O3 Addition Amount on the Removal Ratios of the Element Contents in the Hot Metal

Figure 4 shows the effect of the Fe2O3 addition amount on the removal ratios of the element contents in the hot metal after dephosphorization. It clearly demonstrates that the removal ratios of [C], [Si], [Mn] and [P] increase with the increase of the Fe2O3 addition amount. When the Fe2O3 addition amount is 25 and 30 g, the dephosphorization ratios reach to 81.6% and 83.3%, respectively. With the Fe2O3 addition amount reduced from 12.5 to 10 g, the dephosphorization ratios decrease sharply from 39.8% to 3.8%. When the Fe2O3 addition amount is further reduced to 5 g, the desiliconization and dephosphorization ratios decrease to 73.7% and −3.4%, respectively. These change trends are consistent with the results as shown in Figure 3.

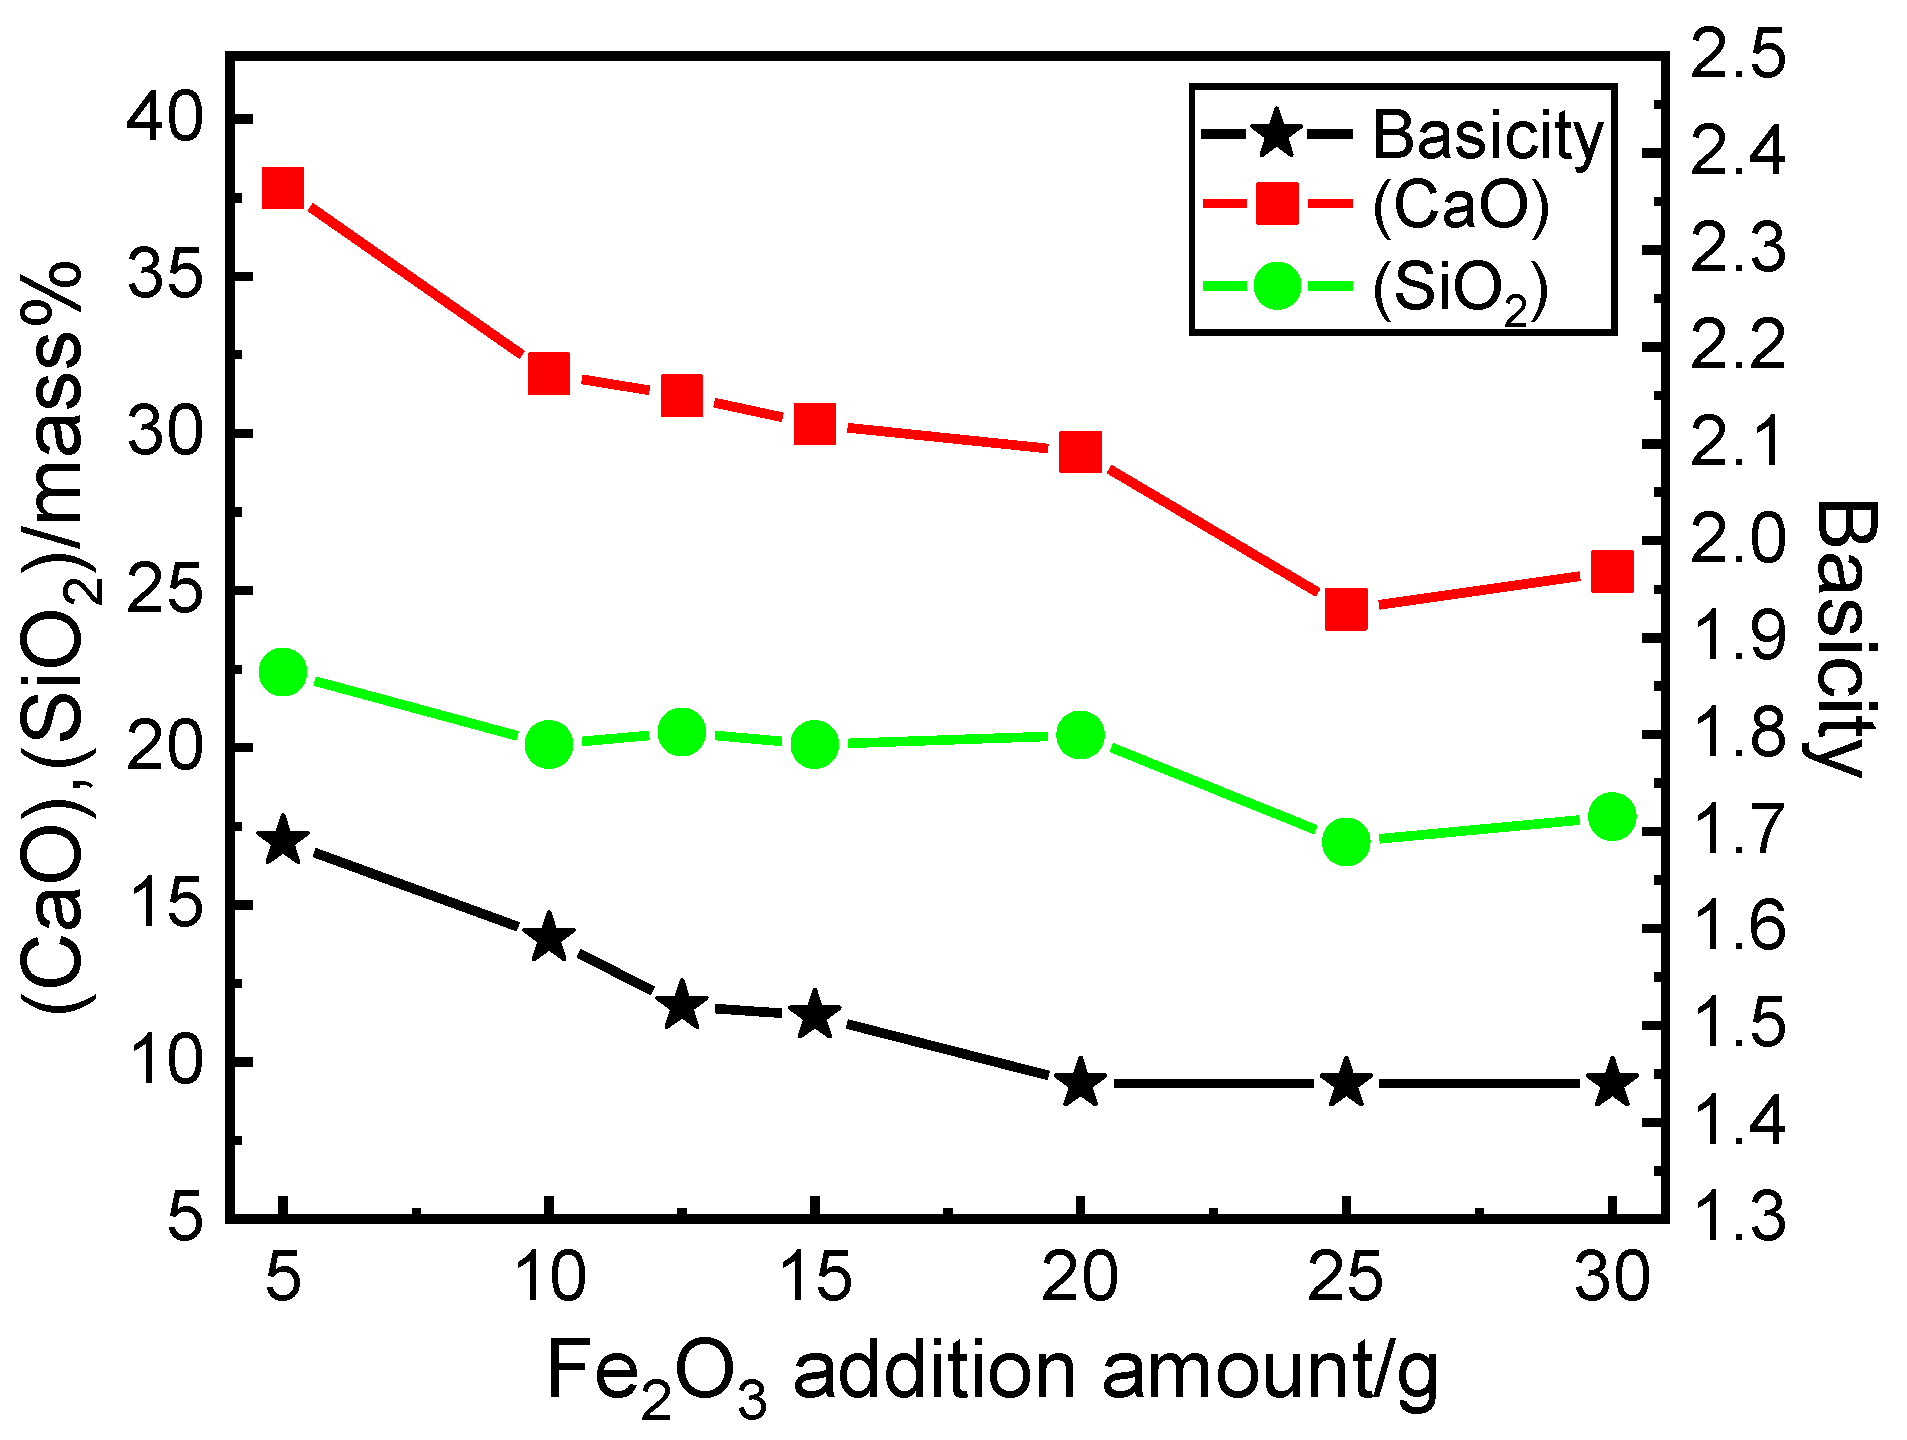
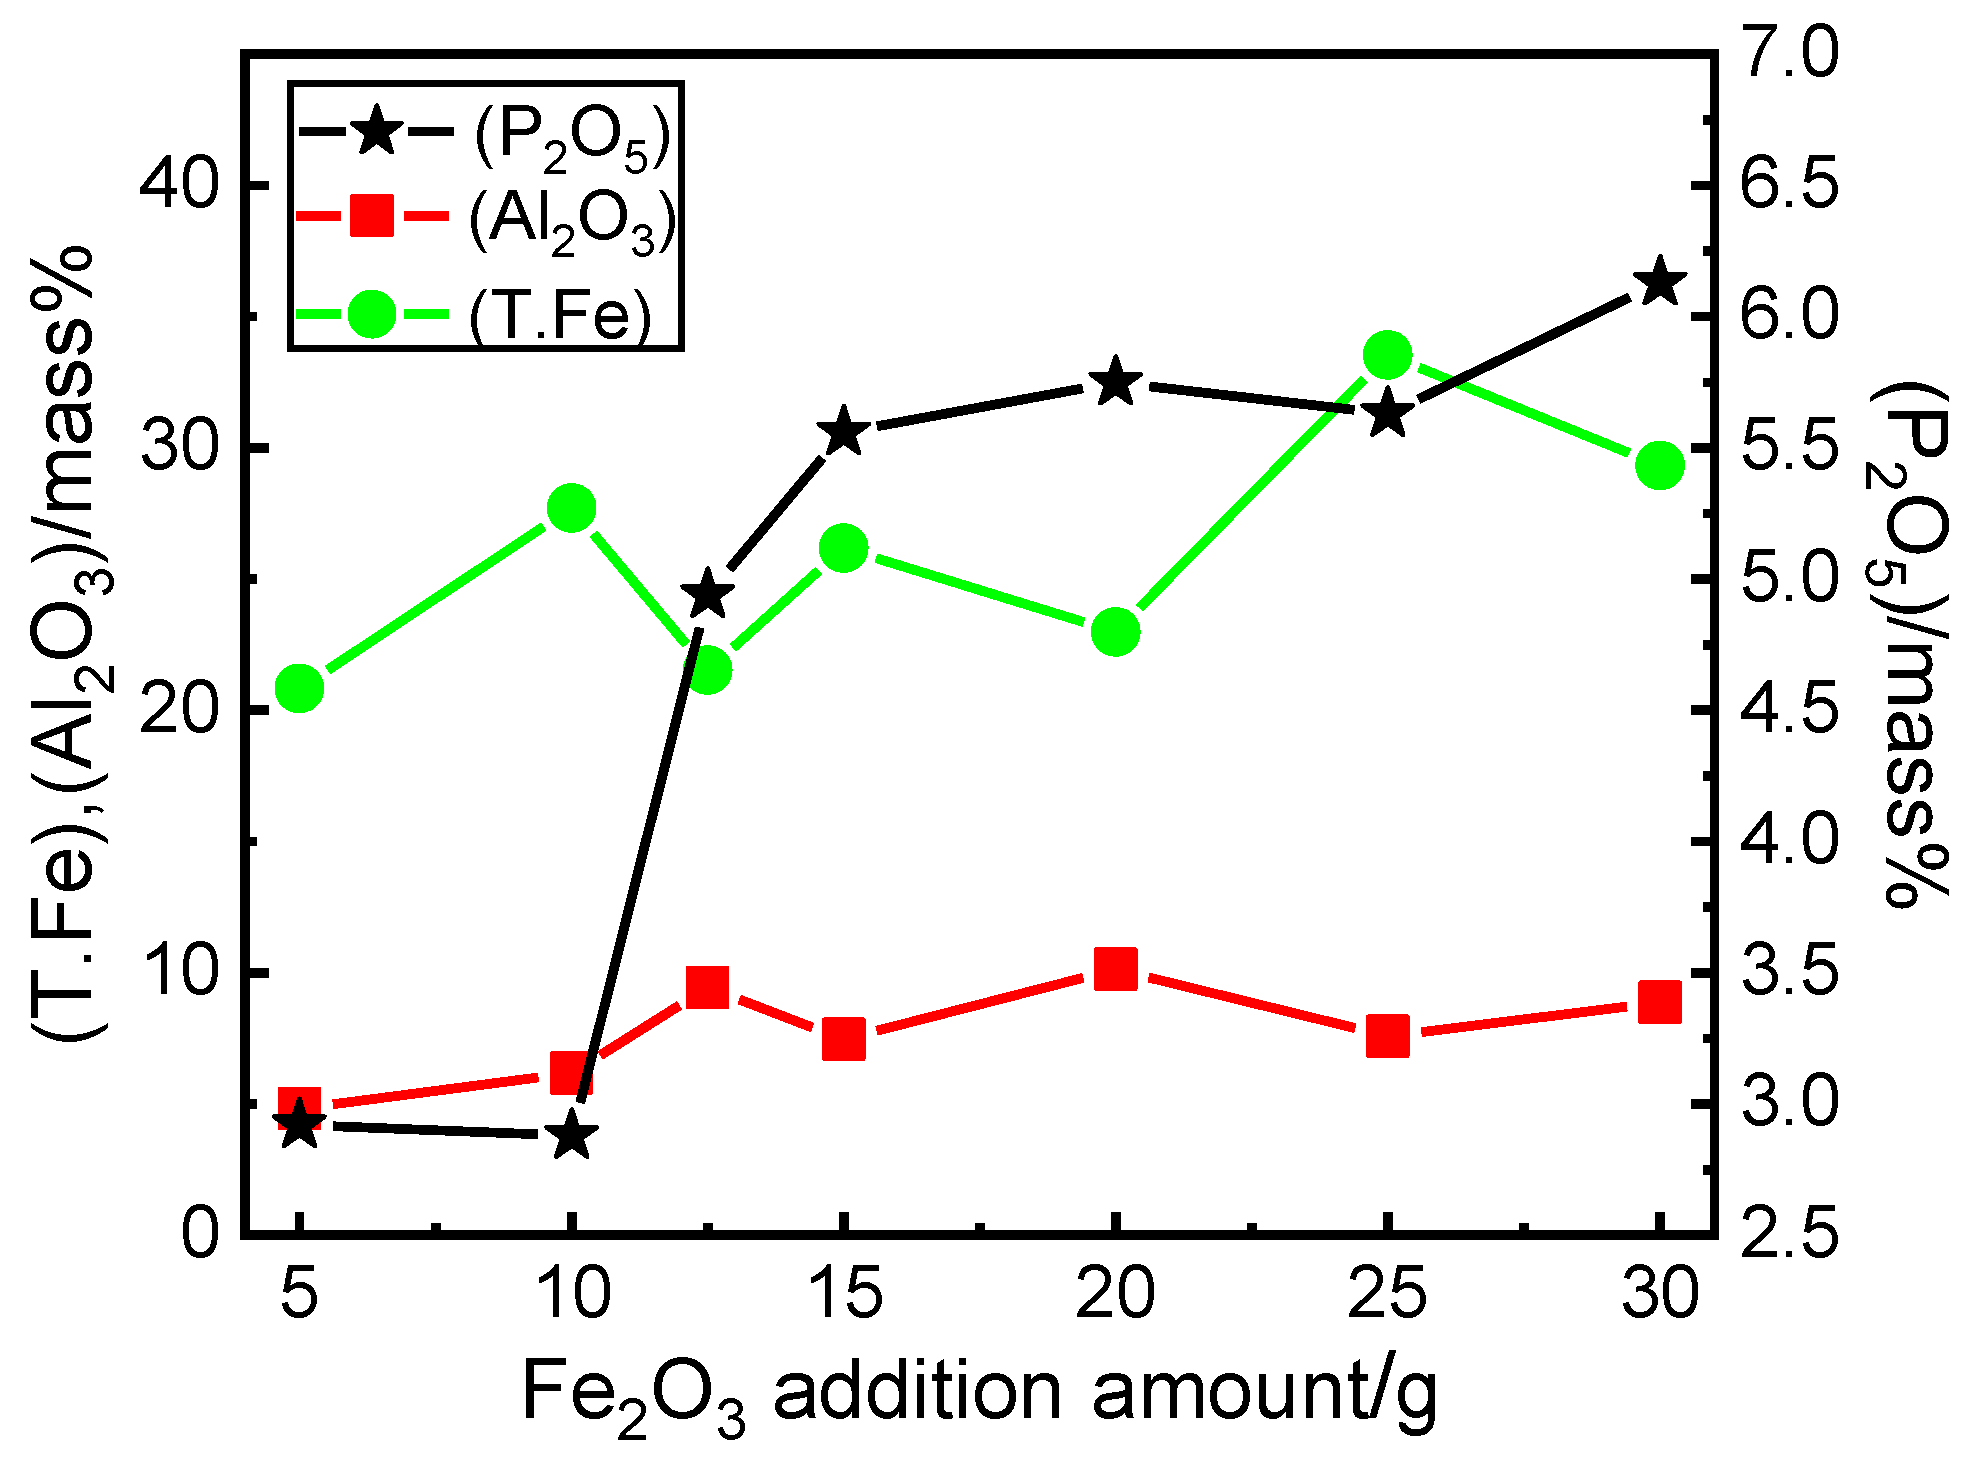
3.3. Effect of the Fe2O3 Addition Amount on the Contents of Oxides in the Slag

Figure 5 shows the effect of the Fe2O3 addition amount on the contents of the CaO and SiO2 in the slag and the basicity after dephosphorization. It can be seen that the contents of CaO and SiO2 in the slag decrease gradually. The basicities of dephosphorization slags firstly decrease and then maintain to be about 1.44. Since the initial addition amount of CaO remains unchanged, it can be inferred that with the increase of the Fe2O3 addition amount, the amount of slag increase so that the contents of CaO in the slag decrease. Since the amount of CaO in the slag remains unchanged, the value of basicity mainly depends on the amount of SiO2 in the slag. With the increase of the Fe2O3 addition amount, the amount of silicon in the hot metal that is oxidized into slag also increases. Therefore, the basicities of slag decrease gradually with increasing the Fe2O3 addition amount, which is corresponding to the results of the desiliconization ratio of hot metal in Figure 4.
Figure 6 shows the effect of the Fe2O3 addition amount on the contents of P2O5, Al2O3 and T.Fe in the slag after dephosphorization. With the increase of the Fe2O3 addition amount, the P2O5 content in the slag increases greatly, while the Al2O3 and T.Fe contents increase slightly on the whole. With increasing the Fe2O3 addition amount, the dephosphorization ratio increases obviously as shown in Figure 4. Therefore, the P2O5 content in the slag increases greatly. With the increase of the Fe2O3 addition amount, the erosion degree of crucible increases slightly, so that the Al2O3 content in the slag increases slightly. Although the increase of the Fe2O3 addition amount increases the T.Fe content in the slag, it also promotes the oxidation reaction of elements in the hot metal which leads to the consumption of more oxidants. Therefore, the T.Fe content in the slag increases slightly on the whole.

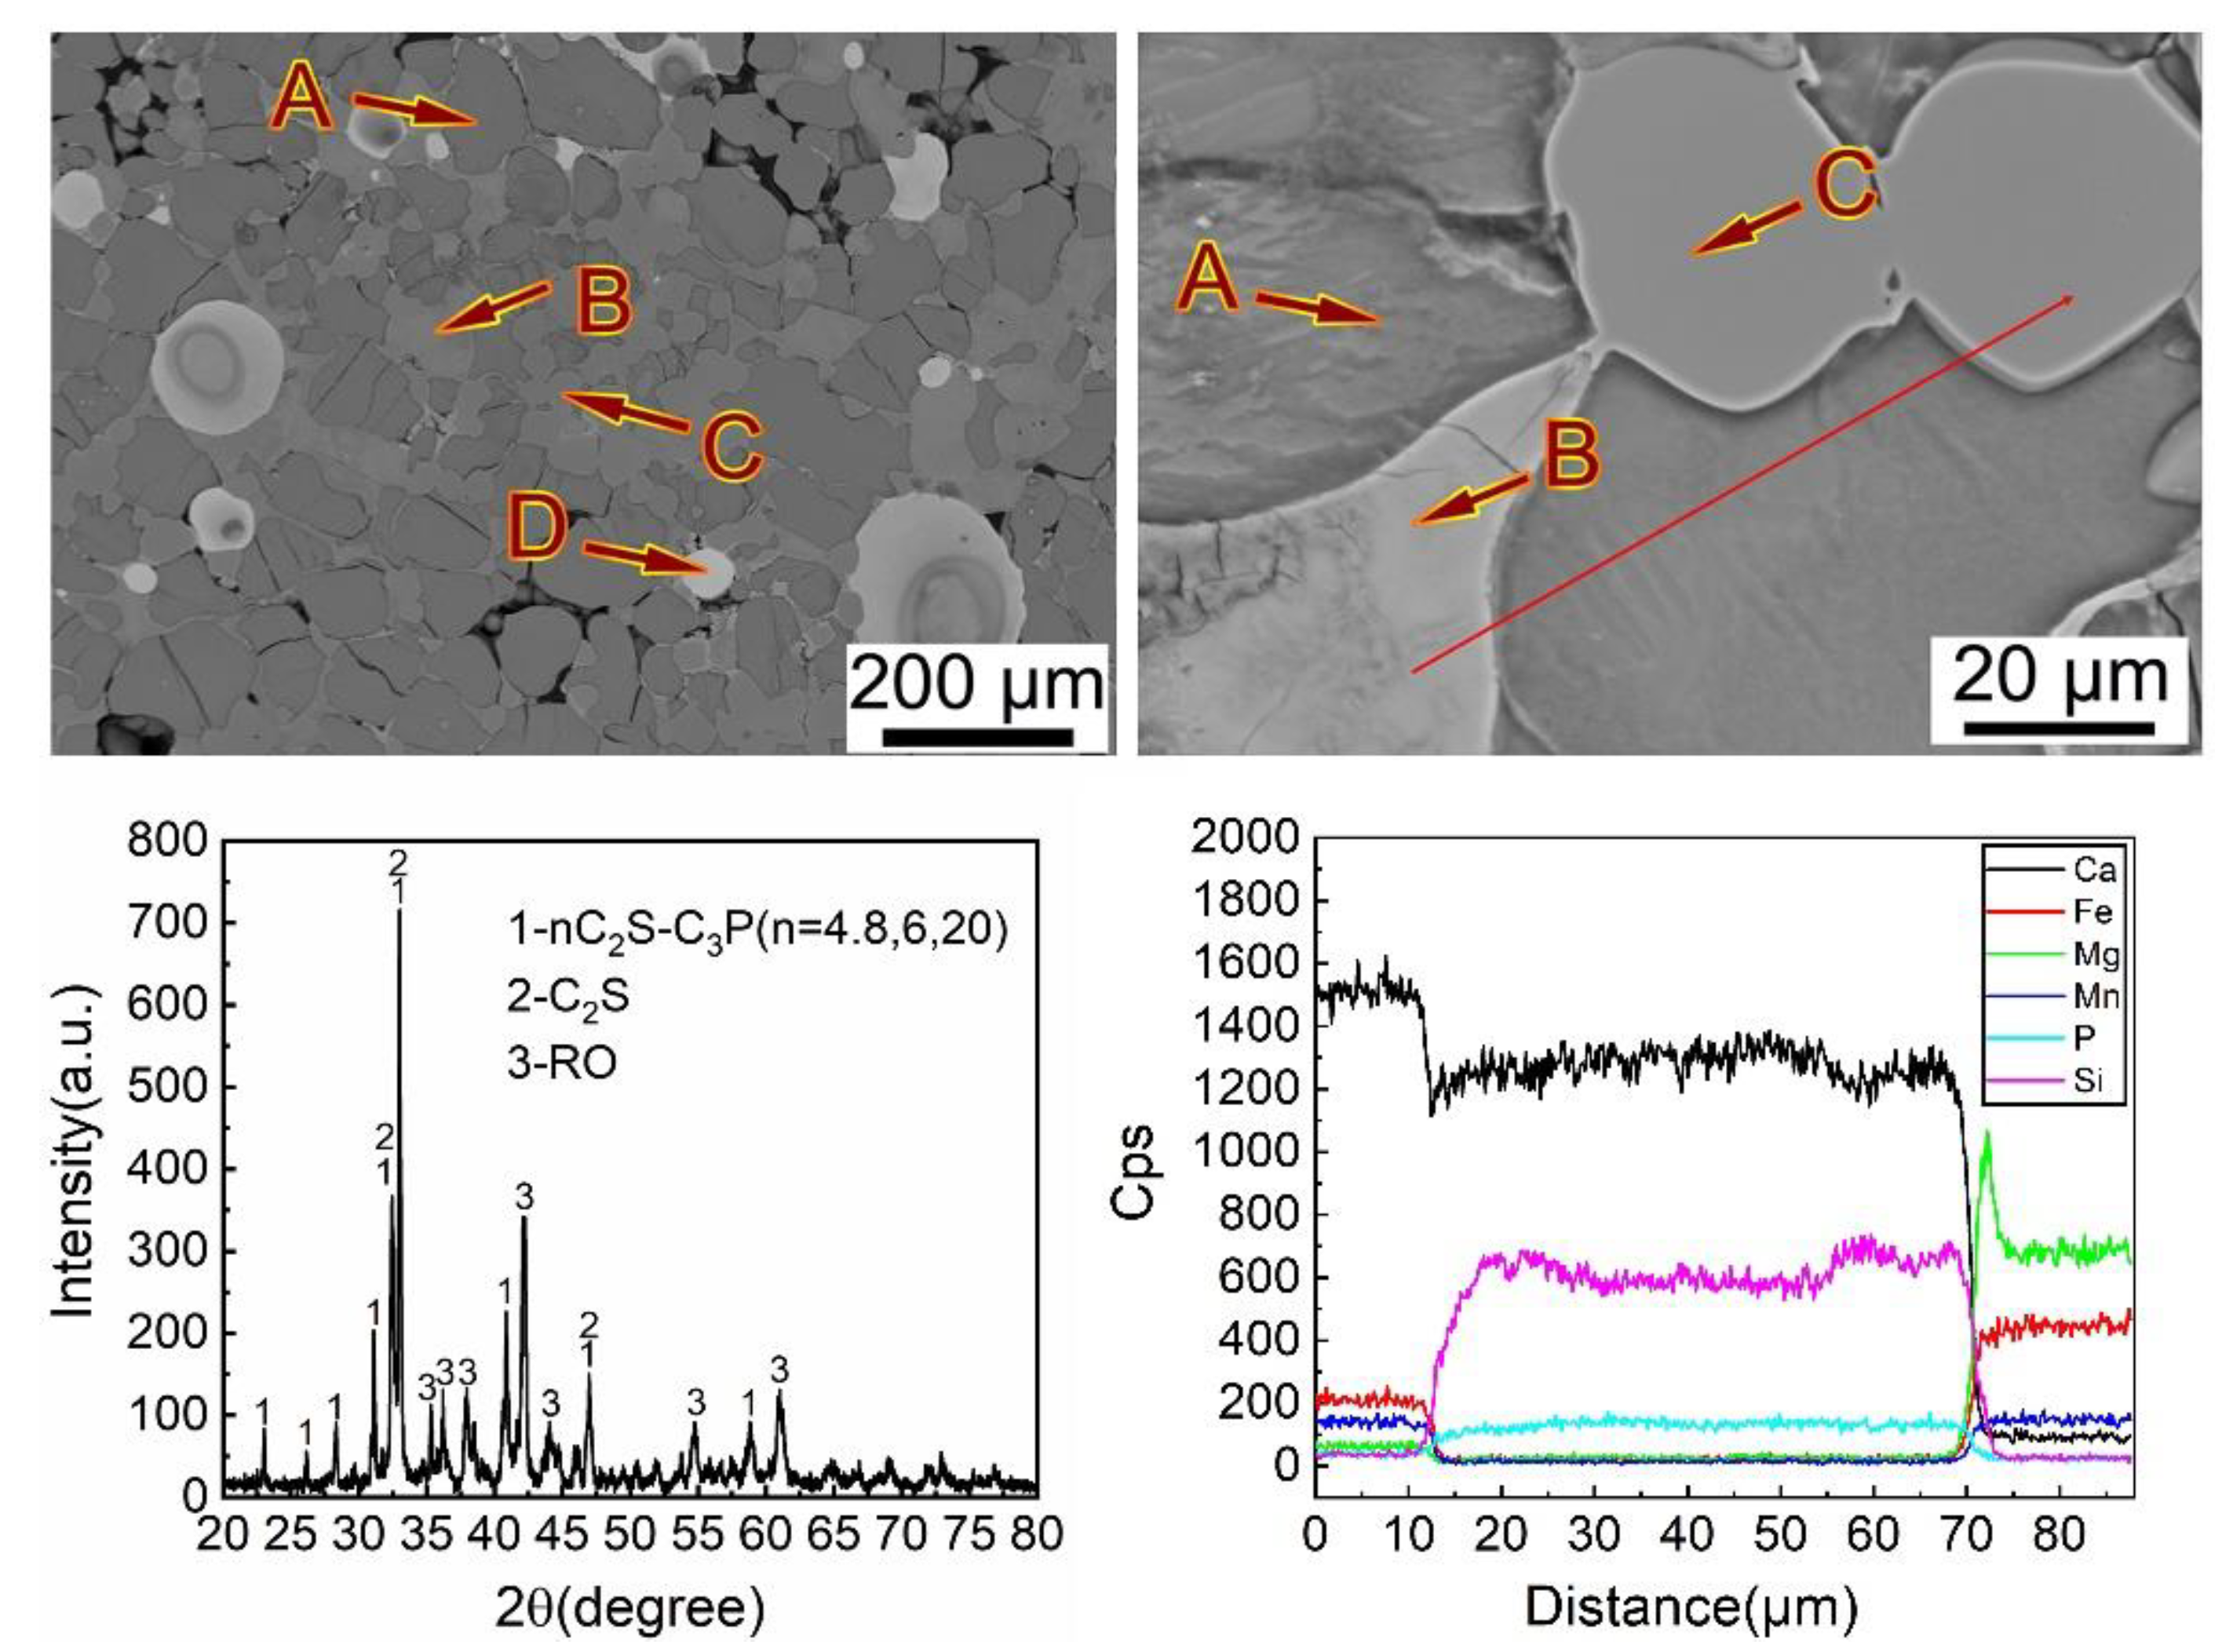
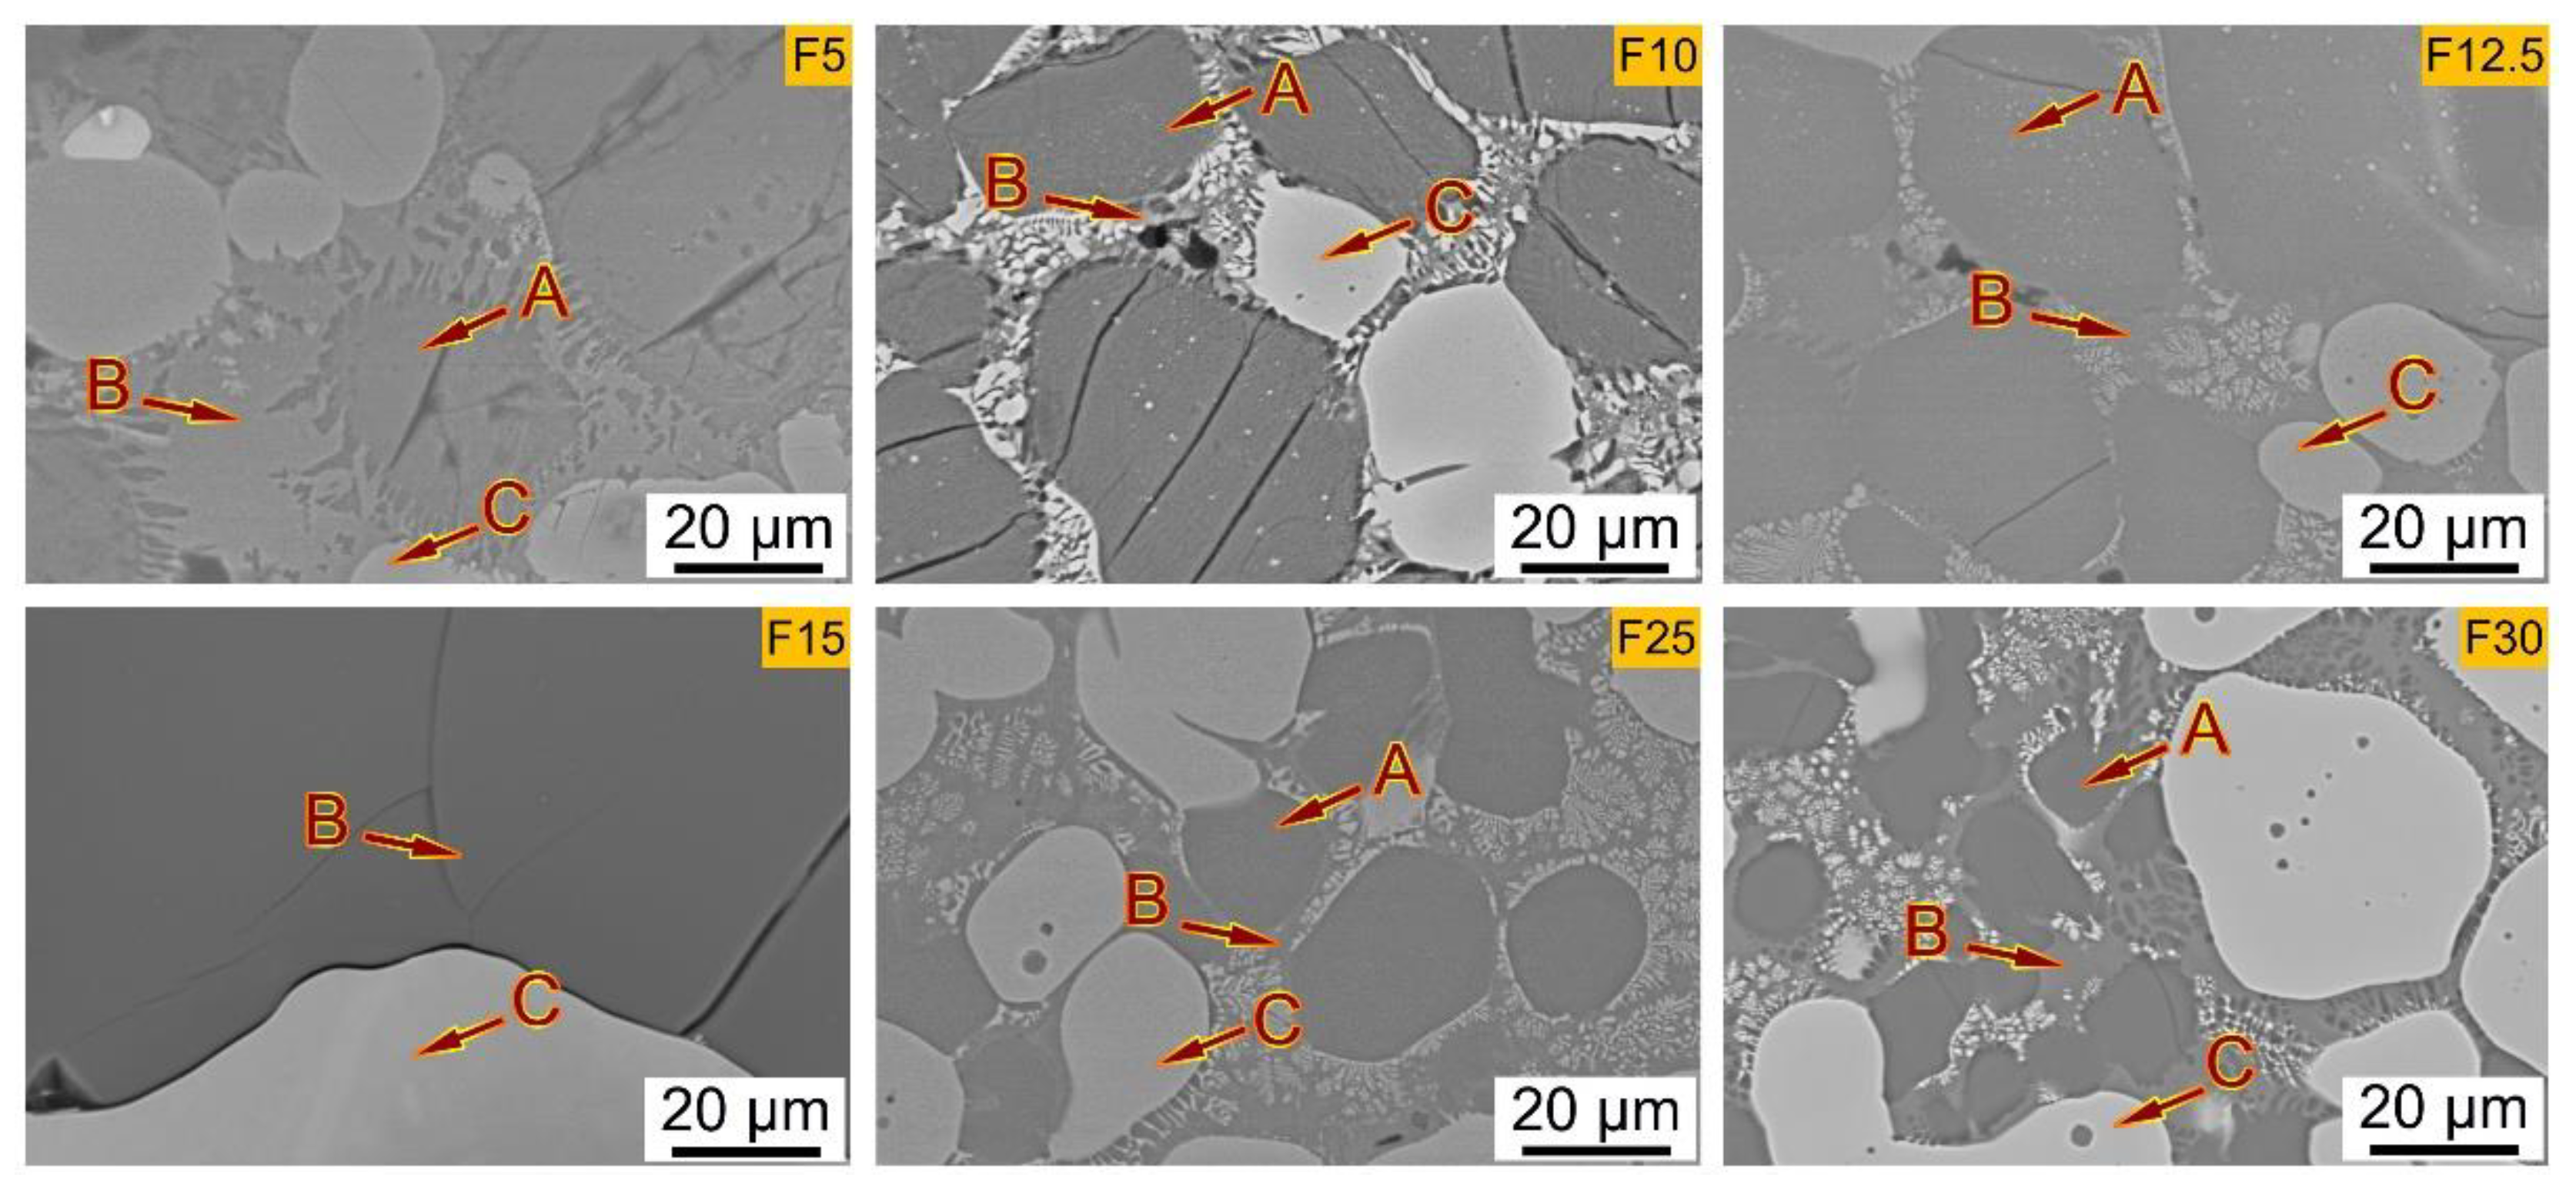
3.4. Analysis of Dephosphorization Slags with SEM-EDS

SEM images of samples with the Fe2O3 addition amount from 5 to 30 g are shown in Figure 7 and Figure 8. Because the SEM images are similar when the Fe2O3 addition amounts are 15 and 20 g, the SEM images for the sample of F20 is not listed in the figure. The corresponding compositions of each phase in each slag are shown in Table 4. From Figure 7 and Figure 8, it can be seen that when the Fe2O3 addition amount is 15 g, the dephosphorization slag mainly contains P-rich matrix phase B and RO phase C. However, when the Fe2O3 addition amount is the other values, the dephosphorization slags are mainly composed of P-rich solid solution phase A, matrix phase B and RO phase C.
In the sample of F5, by combining the SEM image in Figure 7 with the EDS results in Table 4, it is obvious that the surface of the dephosphorization slag is unevenly covered with a large amount of SiO2 to form phase D. The reason may be that the Fe2O3 addition amount is so insufficient that the oxidation reaction of silicon is very slow. Therefore, the residual silicon content in the hot metal is as high as 0.086%, as shown in Table 3. Thus, the decarburization reaction is inhibited, which leads to a weak agitation in the slag phase. As a result, the SiO2 cannot fully diffuse into the Ca(calcium)-rich RO phase in the slag to form phase D. With increasing the Fe2O3 addition amount in the F10 sample and F12.5 sample, the decarburization reaction is greatly strengthened, so that the produced SiO2 is more evenly distributed in the Ca-rich RO phase, and the phase D disappeared and the matrix phase B is obviously formed.
In the F15 sample and F20 sample, with the further increase of the Fe2O3 addition amount, the dephosphorization and desiliconization of hot metal are further improved, and the basicities of slags are reduced. By the combination of the SEM images in Figure 7 and Figure 8 with the EDS results in Table 4, it can be speculated that the P-rich solid solution phase and the matrix phase form a uniform P-rich phase B. Phase C is mainly composed of iron-rich phase.
In the F25 sample and F30 sample, the dephosphorization ratios of hot metal are higher than 80%, and the average area of single P-rich phase A decreases obviously compared with those for the F5 sample to F12.5 sample. The average diameter of a single P-rich phase in the F30 sample is the smallest, which is smaller than 15 μm. With increasing the Fe2O3 addition amount, the P2O5 contents in phase A increase from the results in Table 4.
The main compositions of the P-rich phases are listed in Table 4 for the different Fe2O3 addition amounts, respectively. It can be seen that the P-rich phase A is mainly composed of nC2S–C3P, in which the P2O5 content is varied. Through the electron microscope observation of slag samples, it is found that the phosphorus contents in different regions in the P-rich phase are quite different, such as in F25-A-1 and F25-A-2.

4. Discussion

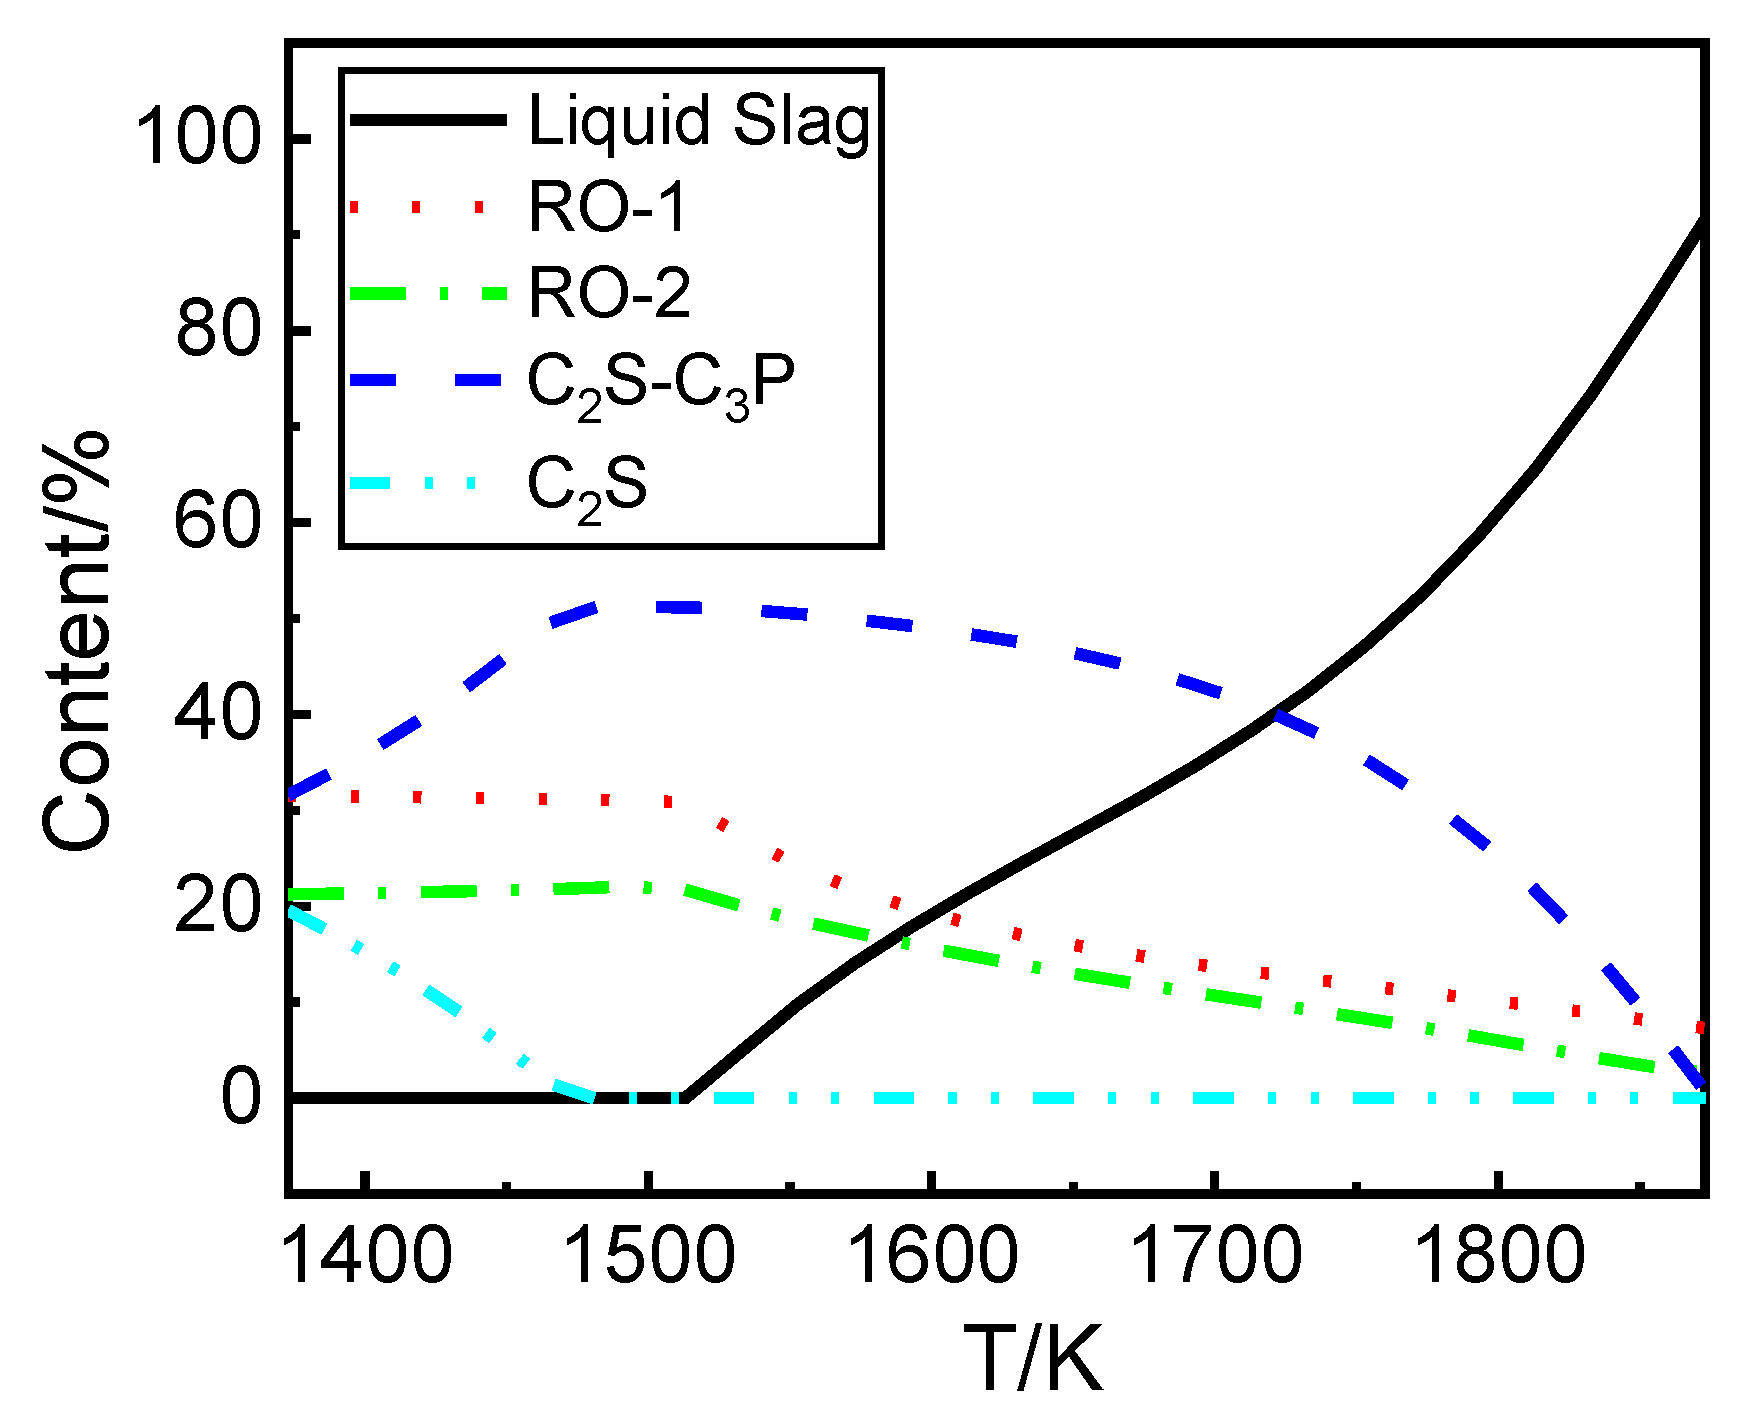
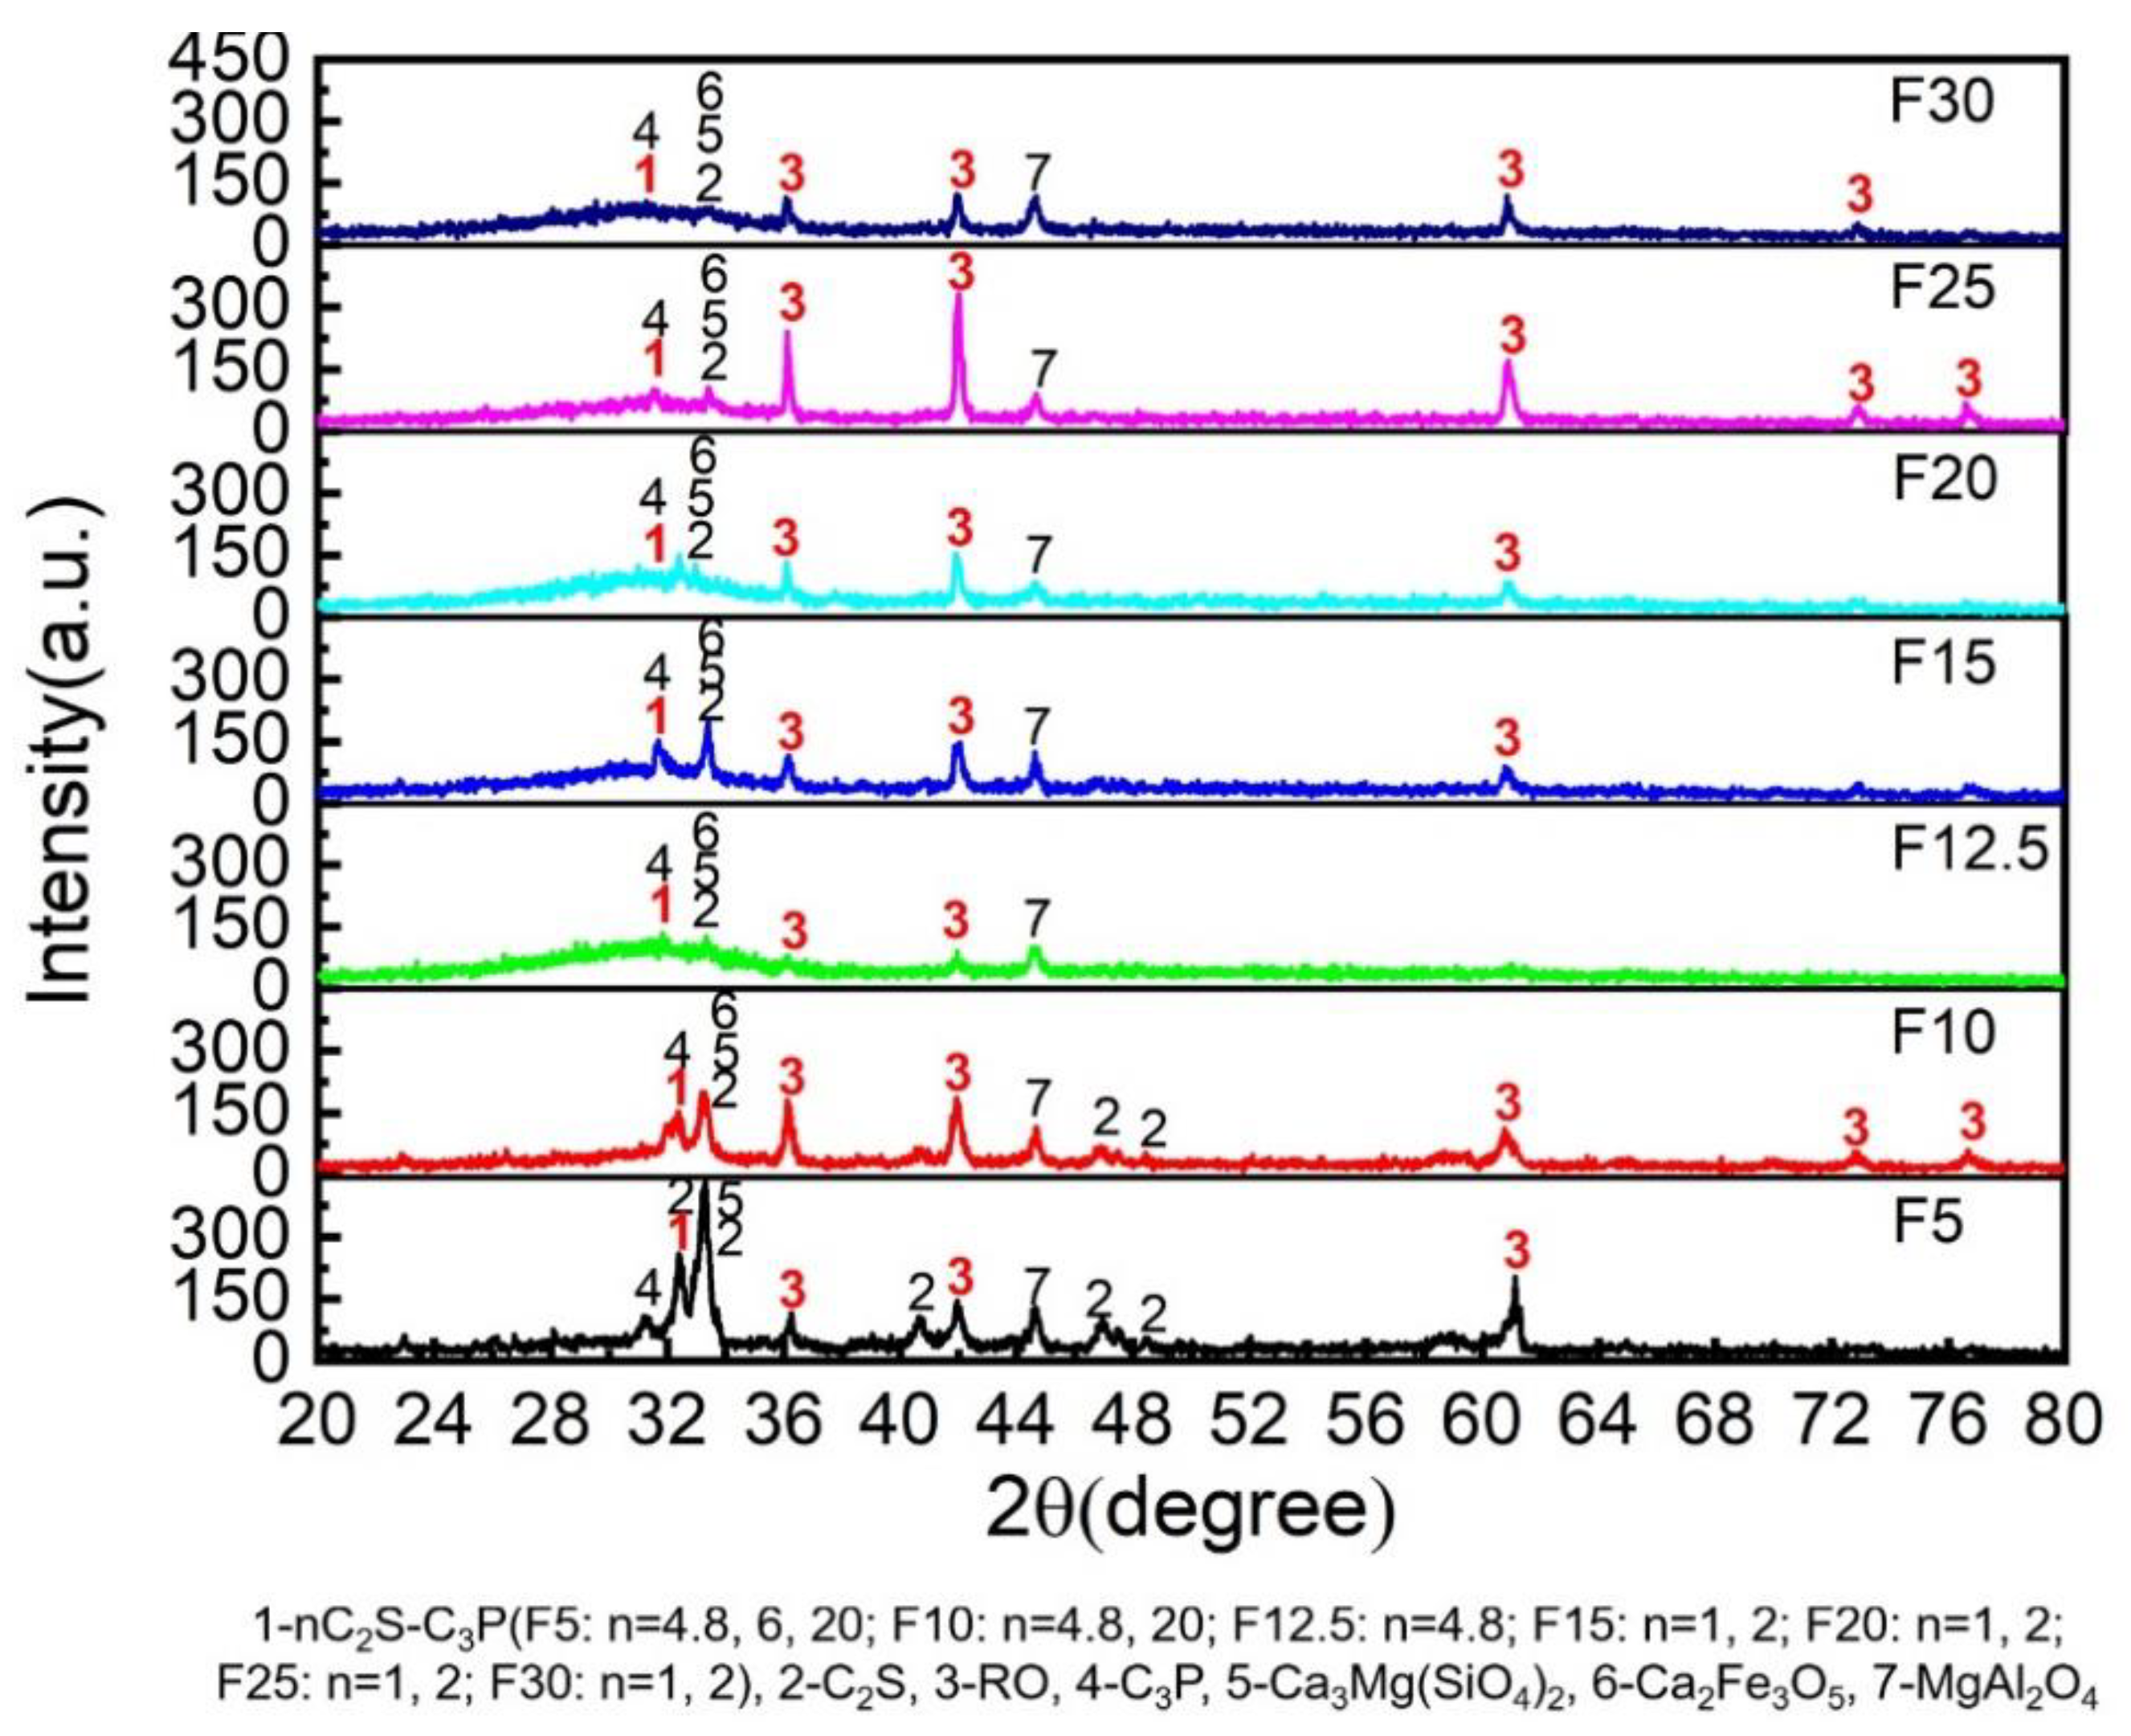
4.1. Effect of the Fe2O3 Addition Amount on Dephosphorization Slags from XRD Analysis Results

Figure 9 shows the XRD analysis results of dephosphorization slags for the samples from F5 to F30. The dephosphorization slags are mainly made up of nC2S–C3P, C2S, C3P, RO, Ca3Mg(SiO4)2, Ca2Fe3O5 and MgAl2O4. It can also be seen that when the Fe2O3 addition amount is 5 and 10 g, many characteristic peaks are corresponding to C2S. Because the amount of oxidation agent is very less, the phosphorus in the hot metal is rarely oxidized to P2O5 and transferred to the slag. As a result, the P2O5 contents in dephosphorization slags are almost the same as those in decarburization slag as shown in Table 1 and Table 3. The main P-rich phases in dephosphorization slags are nC2S–C3P (n = 4.8, 6, 20) with the relatively lower saturated phosphorus content so that there are more free C2S solid particles in the slag. With increasing the Fe2O3 addition amount, the P2O5 content in dephosphorization slag increases, which makes the P-rich phase mainly exist in the form of nC2S–C3P (n = 1, 2) with the relatively higher saturated phosphorus content. More C2S solid particles combine with C3P to form the nC2S–C3P solid solution. Therefore, the C2S contents in dephosphorization slags with the large Fe2O3 addition amount are significantly lower than those in the dephosphorization slags with the small Fe2O3 addition amount as shown in Figure 10.
In order to further understand the changing trend of coefficient n in nC2S–C3P solid solution in dephosphorization slag, the change of P2O5 contents in nC2S–C3P (n = 1, 2, 4.8, 6, 20) and in P-rich phase with the basicity of the P-rich phases are plotted in Figure 10. It can be seen from Figure 10 that with increasing the basicity of the P-rich phase, the coefficient n decrease, while the P2O5 contents in nC2S–C3P increase. This is because that the P2O5 content in the P-rich phase is increased with increasing the basicity of the P-rich phase. It was also indicated that the concentration of P2O5 in the solid solution was strongly influenced by the lime/silica ratio by Shimauchi et al. [24]. When the P2O5 content was high enough, the concentration of C3P in the solid solution can be increased to 100% [24,25]. As a result, the coefficient n in nC2S–C3P solid solution is decreased from 20 to 1.

4.2. Effect of the Fe2O3 Addition Amount on Interfacial Oxygen Potential

There are different oxidation reactions of elements between hot metal and CaO–FeO–SiO2–MgO–MnO–Al2O3 containing slag with Fe2O3 as the oxidant. The Fe2O3 in the slag diffuses to the slag–hot metal interface and then is reduced to FeO by the iron in the hot metal [5]. According to the distribution law, some FeO is dissolved into hot metal and the dissolved [O] is generated. According to the ability of each element combining with oxygen, the oxidation reactions of Si, Mn, P and C take place successively at the slag–hot metal interface. The generated SiO2 diffuses to the slag and makes the basicity of the slag decrease. The generated MnO forms the metal oxide phase with FeO and MgO. And the generated P2O5 is combined with CaO to form C3P, which is further combined with C2S particles in the slag to produce the nC2S–C3P solid solution.
Because the reaction rate of the slag–hot metal interface is very fast, the rate control step of the reaction is mainly determined by the mixed control of the mass transfer of elements from hot metal to slag–hot metal interface and the generated oxides from the slag–hot metal interface to molten slag [26]. According to the previous studies of the present authors and the other investigators, the dephosphorization ratio basically remains unchanged after the reaction time of 15 min [6,21]. Therefore, the dephosphorization reaction of hot metal can be considered to reach the quasi-equilibrium state after 15 min. The dephosphorization reaction of hot metal can be written in Equation (1), and the corresponding phosphate capacity is represented by Equation (2). It can be seen from Equation (1) that the increase in the dissolved oxygen is beneficial to the dephosphorization of the hot metal when the phosphorus content in the hot metal and the basicities of the slags have the same values. The Fe2O3 plays an important role in determining the oxidation ability of slag. The more Fe2O3 is added, the stronger is the oxidizability of slag. In this paper, the change in the interfacial oxygen potential, P O 2 , between FeO containing slag and hot metal with the Fe2O3 addition amount can be evaluated.
[ P ] + 5 2 [ O ] + 3 2 ( O 2 )   =   ( PO 4 3 )
C PO 4 3 = W ( % PO 4 3 ) f P W [ % P ] a [ O ] 5 / 2
where W ( % PO 4 3 - ) and W [ % P ] are PO 4 3 - content in the slag and P content in the hot metal, respectively. C PO 4 3 - is the phosphate capacity which is dissolved in the slag from the hot metal. f P is the activity coefficient of the phosphorus in the hot metal which can be calculated with Equation (3). a [ O ] represent the activity of oxygen in the hot metal at the slag–hot metal interface that can be obtained by the dissolution reaction of gaseous oxygen into the hot metal with Equations (4) and (5).
log f P = ( 2538 T 0 . 355 ) ( e P C [ % C ] + e P Si [ % Si ] + e P Mn [ % Mn ] + e P P [ % P ] )
1 2 O 2 ( g ) = [ O ]
log K [ O ] θ = 6118 T + 0 . 151 = log a [ O ] P O 2 1 / 2
where K [ O ] θ is the equilibrium constant of Equation (4), e P C = 0.13, e P Si = 0.12, e P Mn   =   0 , e P P   =   0 . 062 at 1873 K, respectively.
By combining Equations (1)–(5), P O 2 can be expressed as follows.
log P O 2 = 4 5 [ log 95 W ( % P ) 31 f P W [ % P ]     log C PO 4 3     log 5 2 K [ O ] θ ]
The phosphate capacity in this paper is evaluated by an empirical formula of Suito et al. as shown in Equation (7), which involves the effects of various components in multiphase slag and temperature on phosphate capacity [27].
log C PO 4 3 = 0 . 0938 [ ( % CaO ) + 0 . 5 ( % MgO ) + 0 . 3 ( % T . Fe ) + 0 . 35 ( % P 2 O 5 ) + 0 . 46 ( % MnO ) ] + 32500 / T     17 . 74
The changes in the P O 2 calculated as well as LP with the Fe2O3 addition amount at the end of dephosphorization are shown in Figure 11. It can be seen that the values of P O 2 calculated as well as the measured LP values all increase with increasing the Fe2O3 addition amount. This is because with the increase of the Fe2O3 addition amount, the oxidation ability of phosphorus in the hot metal is enhanced, as shown in Figure 4. So, the measured LP values gradually increase with increasing the Fe2O3 addition amount. It can be found from Equation (6) that the higher is the distribution ratio, the greater is the calculated value of P O 2 . Therefore, the P O 2 values increase with increasing the Fe2O3 addition amount. It is found that when the oxygen potential at the interface is greater than 0.72 × 10⁻¹², the dephosphorization ratio begins to increase sharply.

4.3. Effect of the Fe2O3 Addition Amount on the Oxygen Activity at the Slag–Hot Metal Interface and in the Hot Metal

During the dephosphorization process, a large number of CO bubbles will be generated during the oxidation of carbon after going through the heterogeneous nucleation stage. In fact, the decarburization reaction mainly originates from the interface between hot metal and the wall of the crucible. Accompanied by the CO bubbles floating up and escaping from the hot metal, the hot metal and molten slag will be strongly stirred. This will enhance the transfer of Si, Mn and P from the hot metal to the slag–hot metal interface and SiO2, MnO and P2O5 products from the slag–hot metal interface to the molten slag. Thus, the oxidation reaction of carbon in the hot metal is beneficial to the removal of Si, Mn and P from hot metal. The oxygen provided by iron oxide needs to pass through the slag–hot metal interface and transfer into hot metal, and the decarbonization is carried out as follows.
[ C ] + [ O ]   =   ( CO ) ( g )
Δ G 0   =   22200     38 . 34 T   =   2.303 R T log P C O a [ C ] a [ O ]
a [ C   ]   =   f [ C ]   ×   [ % C ]
where a [ C ] and f [ C ] are the activity and the activity coefficient of carbon in the hot metal. P CO is assumed to a value of 1. f [ C ] can be calculated through Wagner’s dilute solution interaction parameter approach [28]. The activity of oxygen in the hot metal, a [ O ] hot   metal , on the wall of the crucible can be calculated by Equations (8)–(10). The interfacial oxygen activity, a [ O ] slag - hot   metal , after dephosphorization can be calculated by combining the results of the P O 2 values in Section 4.2 with Equation (5).
Figure 12 shows the changes in oxygen activity at the slag–hot metal interface and in the hot metal with Fe2O3 addition amount. It can be seen that a [ O ] slag - hot   metal increases gradually with increasing Fe2O3 addition amount, while a [ O ] hot   metal changes little. The a [ O ] slag - hot   metal is much higher than a [ O ] hot   metal which results in the oxygen activity gradient increase gradually. With increasing Fe2O3 addition amount, the P O 2 of the slag–hot metal interface increases, which makes the a [ O ] slag - hot   metal increase. However, since the content of carbon in the hot metal is very high, the a [ O ] hot   metal calculated from Equations (8)–(10) is very low, being about 0.0001 in comparison with the a [ O ] slag - hot   metal . These results are consistent with those reported by Kitamura et al. [29]. With increasing the Fe2O3 addition amount, the oxygen activity gradient from the slag–metal interface to the hot metal will increase, which will accelerate the oxygen transfer from the slag–metal interface to the hot metal, so that the removal ratios of C, Si, Mn and P in the hot metal increase, as shown in Figure 4. It is seen that when the oxygen activity at the interface is greater than 7.1 × 10⁻³, the dephosphorization ratio begins to increase rapidly.

4.4. Theoretical Calculation of the Fe2O3 Addition Amount

The theoretical consumption of Fe2O3 ( W Fe 2 O 3 ,   cal   ) can be calculated according to the oxidation reactions and the main oxidation reactions of elements in the hot metal are as follows.
[ Fe ] + Fe 2 O 3 = 3 ( FeO )
[ Si ] + 2 ( FeO ) = ( SiO 2 ) + 2 [ Fe ]
[ Mn ] + ( FeO ) = ( MnO ) + [ Fe ]
2 [ P ] + 5 ( FeO ) = ( P 2 O 5 ) + 5 [ Fe ]
  3 [ C ] + 3 ( FeO ) = 3 CO + 3 [ Fe ]
W Fe 2 O 3 ,   cal   can be calculated by combining the end compositions of the hot metal after dephosphorization and the initial compositions of hot metal with Equations (11)–(15). The final slag amount (Wf-slag) of different Fe2O3 addition amounts can also be theoretically calculated and the addition amount of decarburization slag is 18 g. Figure 13 shows the changes in the ratios of the Fe2O3 addition amount ( W Fe 2 O 3 ) to W Fe 2 O 3 ,   cal   , and the Wf-slag to the addition amount of decarburization slag (WDe-C slag) as well as the dephosphorization ratio (De-P) with the Fe2O3 addition amount. It can be seen that the values of Wf-slag/WDe-C slag increase linearly with increasing the Fe2O3 addition amount. When the Fe2O3 addition amount is increased from 10 to 15 g, the value of W Fe 2 O 3 / W Fe 2 O 3 ,   cal   decreases. When the Fe2O3 addition amount is 5 g, the value of W Fe 2 O 3 / W Fe 2 O 3 ,   cal is about 80%, the amount of oxidant is insufficient, and the FeO in decarburization slag will also be consumed.
As analyzed in Section 4.2 and Section 4.3, when the Fe2O3 addition amount is increased from 5 to 10 g, the interface oxygen potential and the gradient between the oxygen activity at the interface and in the hot metal are still small, with the result that the oxidations of Si and Mn in the hot metal are still the main reactions, as they can combine with O more easily. The increment of Fe2O3 consumption is less than that of Fe2O3 addition, so that the value of W Fe 2 O 3 / W Fe 2 O 3 ,   cal   increases.
When the Fe2O3 addition amount is increased from 10 to 15 g, the reaction between carbon and oxygen in the hot metal is enhanced due to the increase in the oxygen potential at the interface and the gradient between oxygen activity at the interface and in the hot metal, which promote the oxidation reactions of Si, Mn and P in the hot metal. This can also be explained by the sharp increase of the dephosphorization ratio in this range in Figure 13. As a result, the increment of Fe2O3 consumption is larger than that of Fe2O3 addition, and the value of W Fe 2 O 3 / W Fe 2 O 3 ,   cal   decreases.
When the Fe2O3 addition amount is increased from 15 to 30g, because the activity of each element in the hot metal gradually decreases, the increment of removal ratios of Si, Mn and P gradually decreases, as shown in Figure 4. Therefore, the increment of Fe2O3 consumption is less than that of Fe2O3 addition, and the value of W Fe 2 O 3 / W Fe 2 O 3 ,   cal   gradually increases.
When the Fe2O3 addition amount is increased from 25 to 30 g, the values of W Fe 2 O 3 / W Fe 2 O 3 ,   cal   and Wf-slagT/WDe-C slag still increase greatly, but the increasing degree of dephosphorization ratio is relatively small. It is found that the molten slag starts to overflow the crucible during the high-temperature experiment. Therefore, when the value of W Fe 2 O 3 / W Fe 2 O 3 ,   cal is 175%, the dephosphorization ratio reaches the highest value of 83.3%.

5. Conclusions

By using the high-temperature laboratorial experiments, the effect of the Fe2O3 addition amount on the dephosphorization of hot metal at 1623 K with the slag of the lower basicity (CaO/SiO2) of about 1.5 was studied. The conclusions are as follows.
(1)
With increasing the Fe2O3 addition amount, the contents of [C], [Si], [Mn] and [P] in the hot metal at the end of dephosphorization decrease, and the corresponding removal ratios increase. When the Fe2O3 addition amount is 30 g, the phosphorus in the hot metal can be removed from 0.27% to 0.045% with the highest dephosphorization ratio of 83.3%.
(2)
With increasing the Fe2O3 addition amount, the P2O5 content in the slag increases, the CaO and SiO2 contents in the slag decrease, while the Al2O3 and T.Fe contents slightly increase. When the Fe2O3 addition amount is 30 g, the value of P2O5 content in the slag is as high as 6.13%, indicating a rather high dephosphorization ratio.
(3)
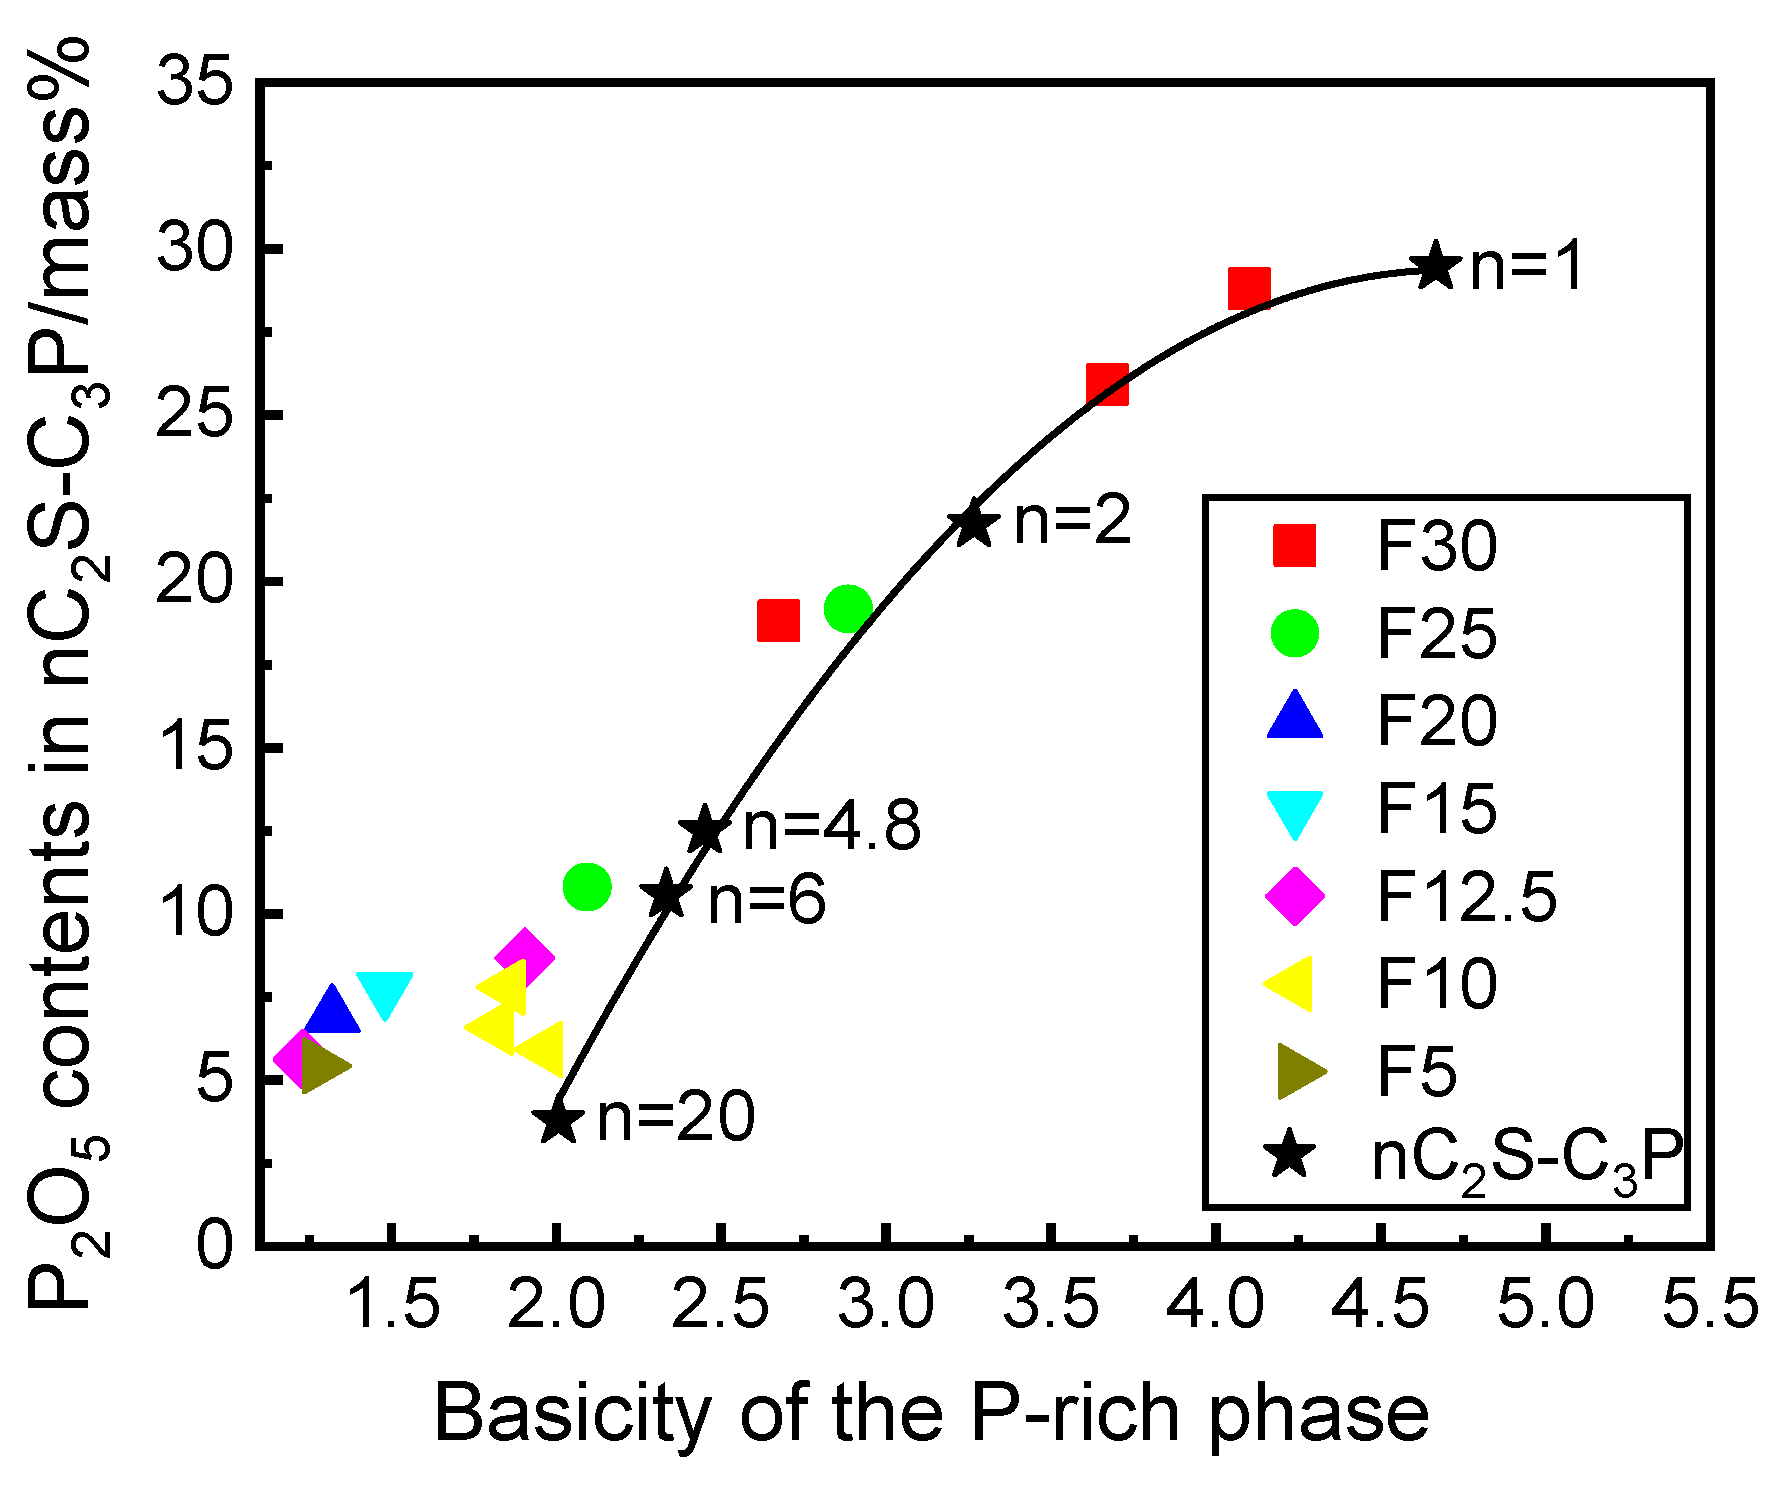
When the Fe2O3 addition amounts are 15 and 20 g, the dephosphorization slags mainly contain phosphorus-rich matrix phase and metal oxides phase. However, when the Fe2O3 addition amounts are the other values, the dephosphorization slags are mainly composed of phosphorus-rich solid solution phase, matrix phase and metal oxides phase. The phosphorus mainly exists in the form of the nCa2SiO4–Ca3(PO4)2 solid solution in the phosphorus-rich phase and the value of coefficient n decreases from 20 to 1 with increasing the Fe2O3 addition amount from 5 to 30 g.
(4)
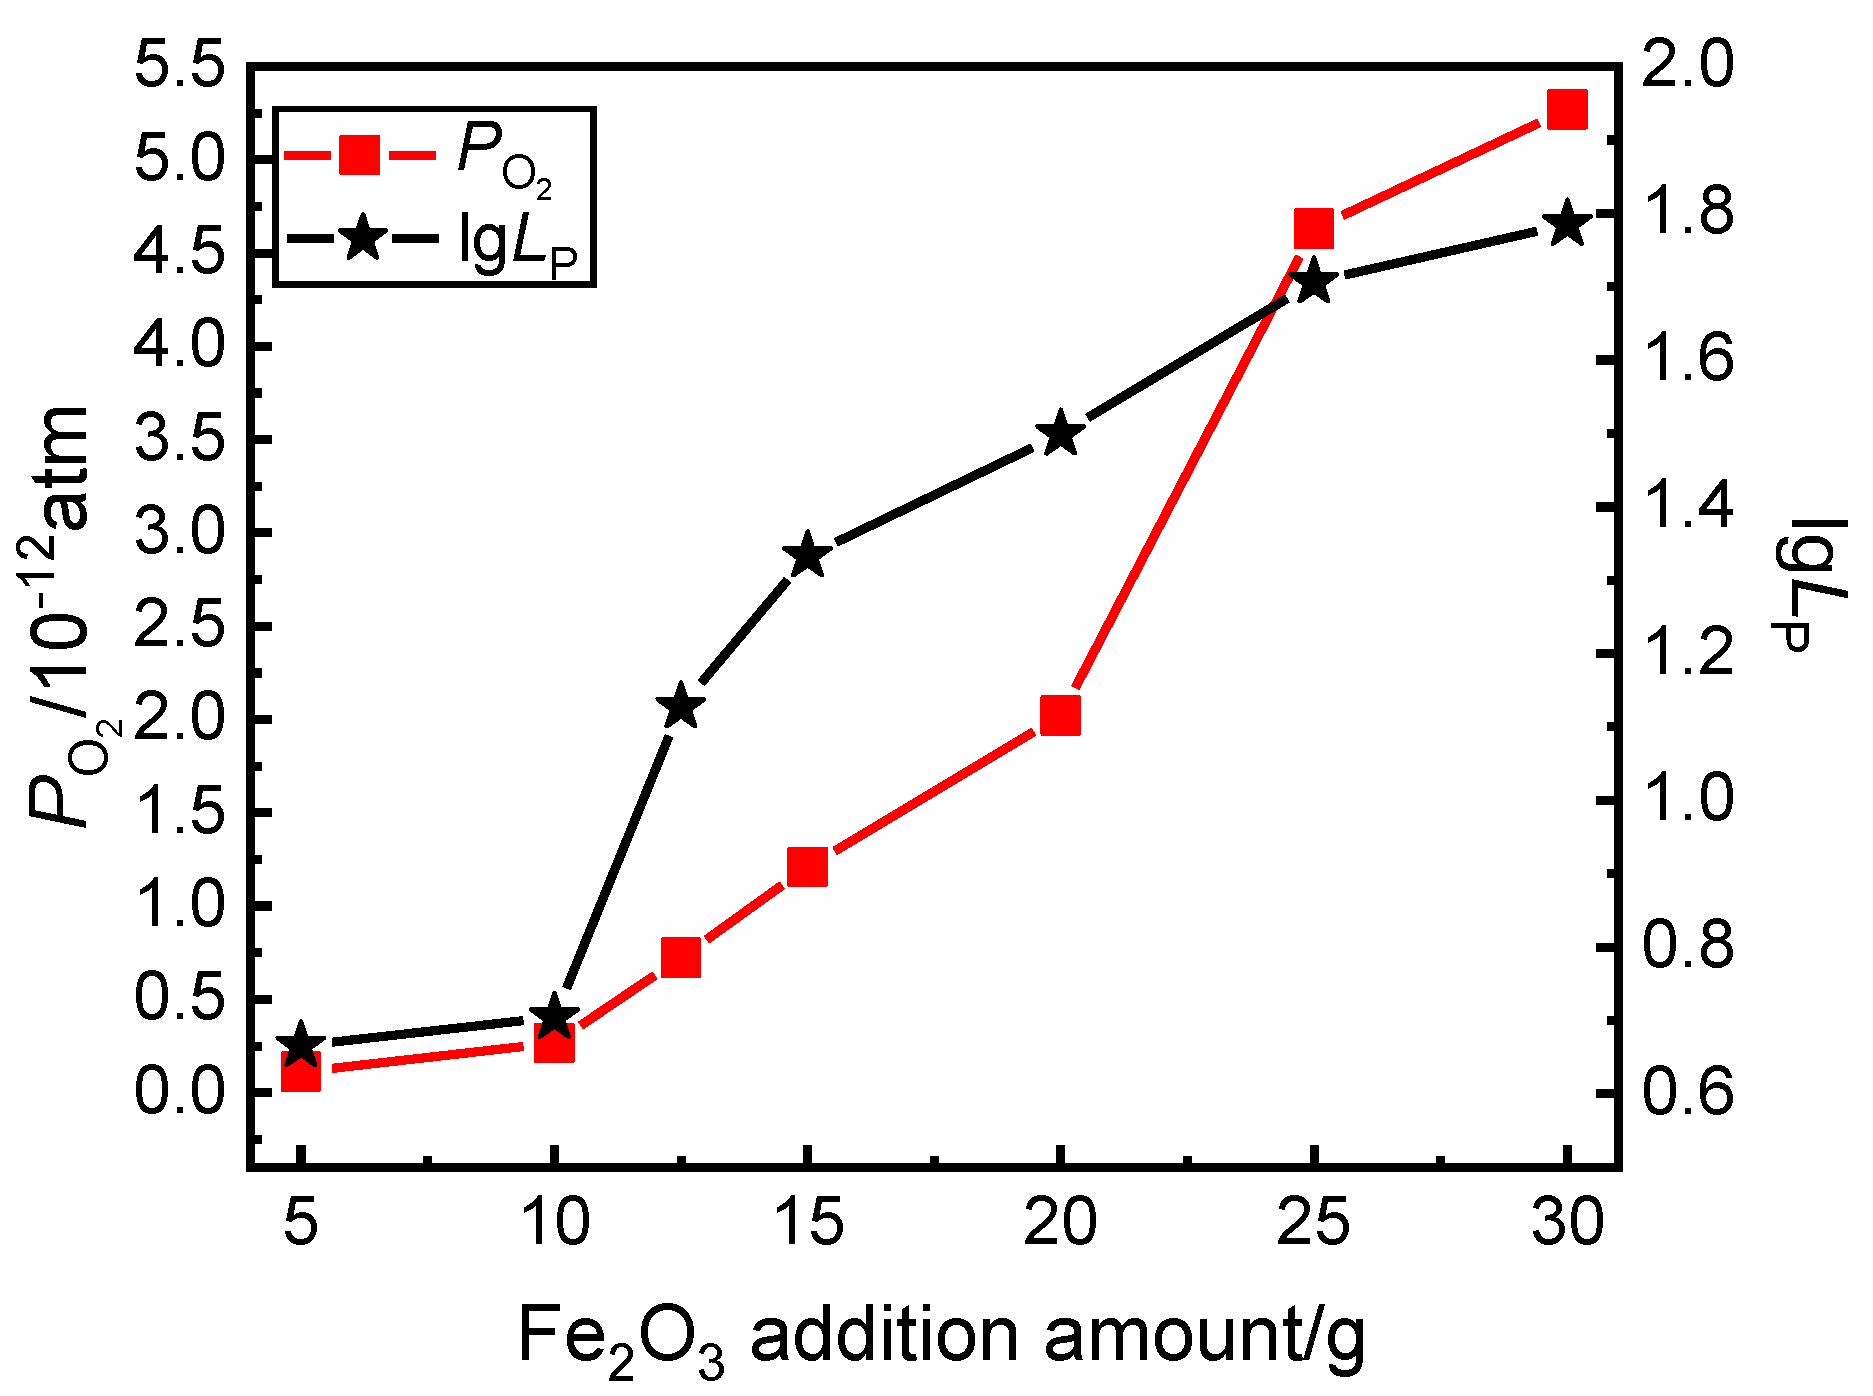
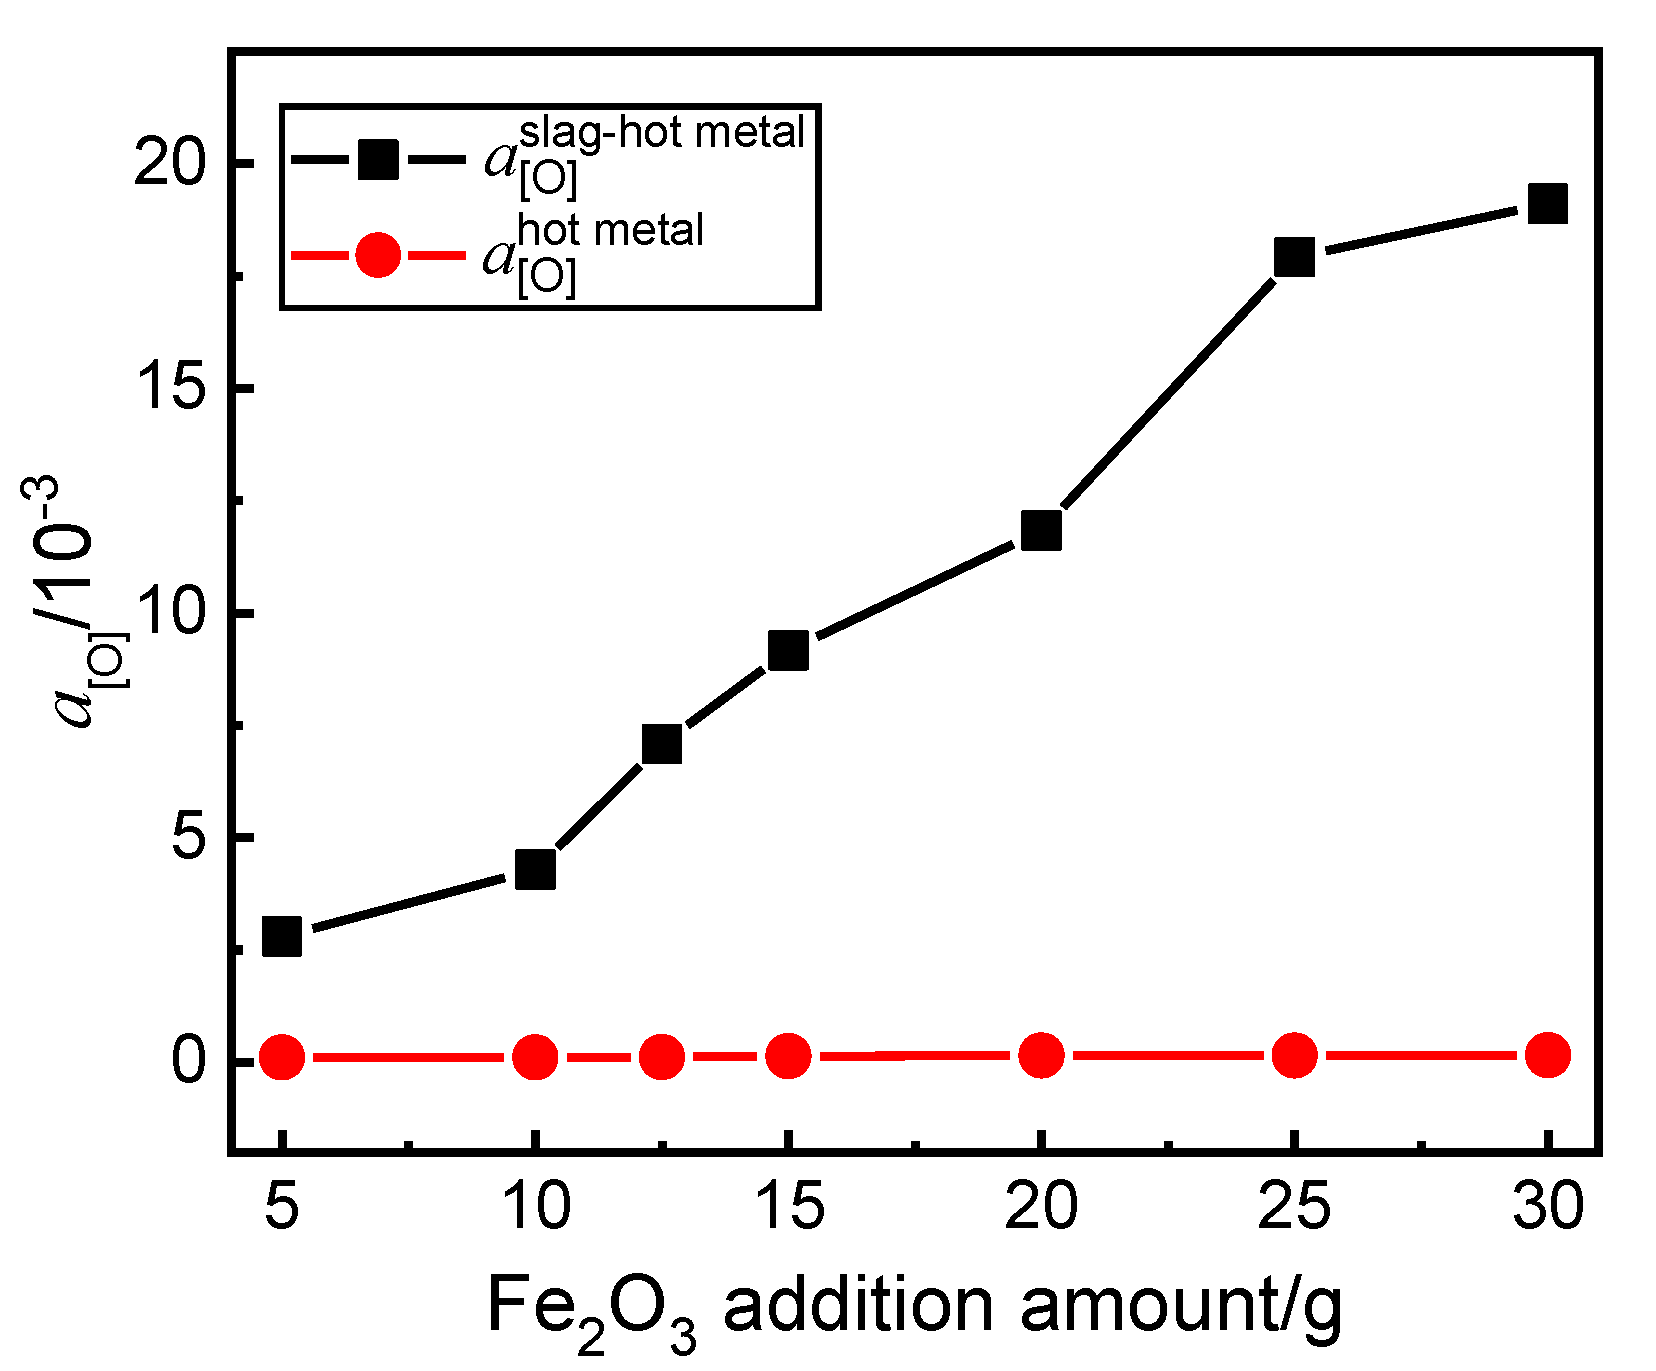
With increasing the Fe2O3 addition amount, the oxygen potential and activity at the interface between the slag and hot metal increase, and the gradient between the oxygen activity at the interface and in the hot metal increase. When the oxygen potential and the oxygen activity at the interface are greater than 0.72 × 10⁻¹² and 7.1 × 10⁻³, respectively, the dephosphorization ratio begins to increase rapidly.
(5)
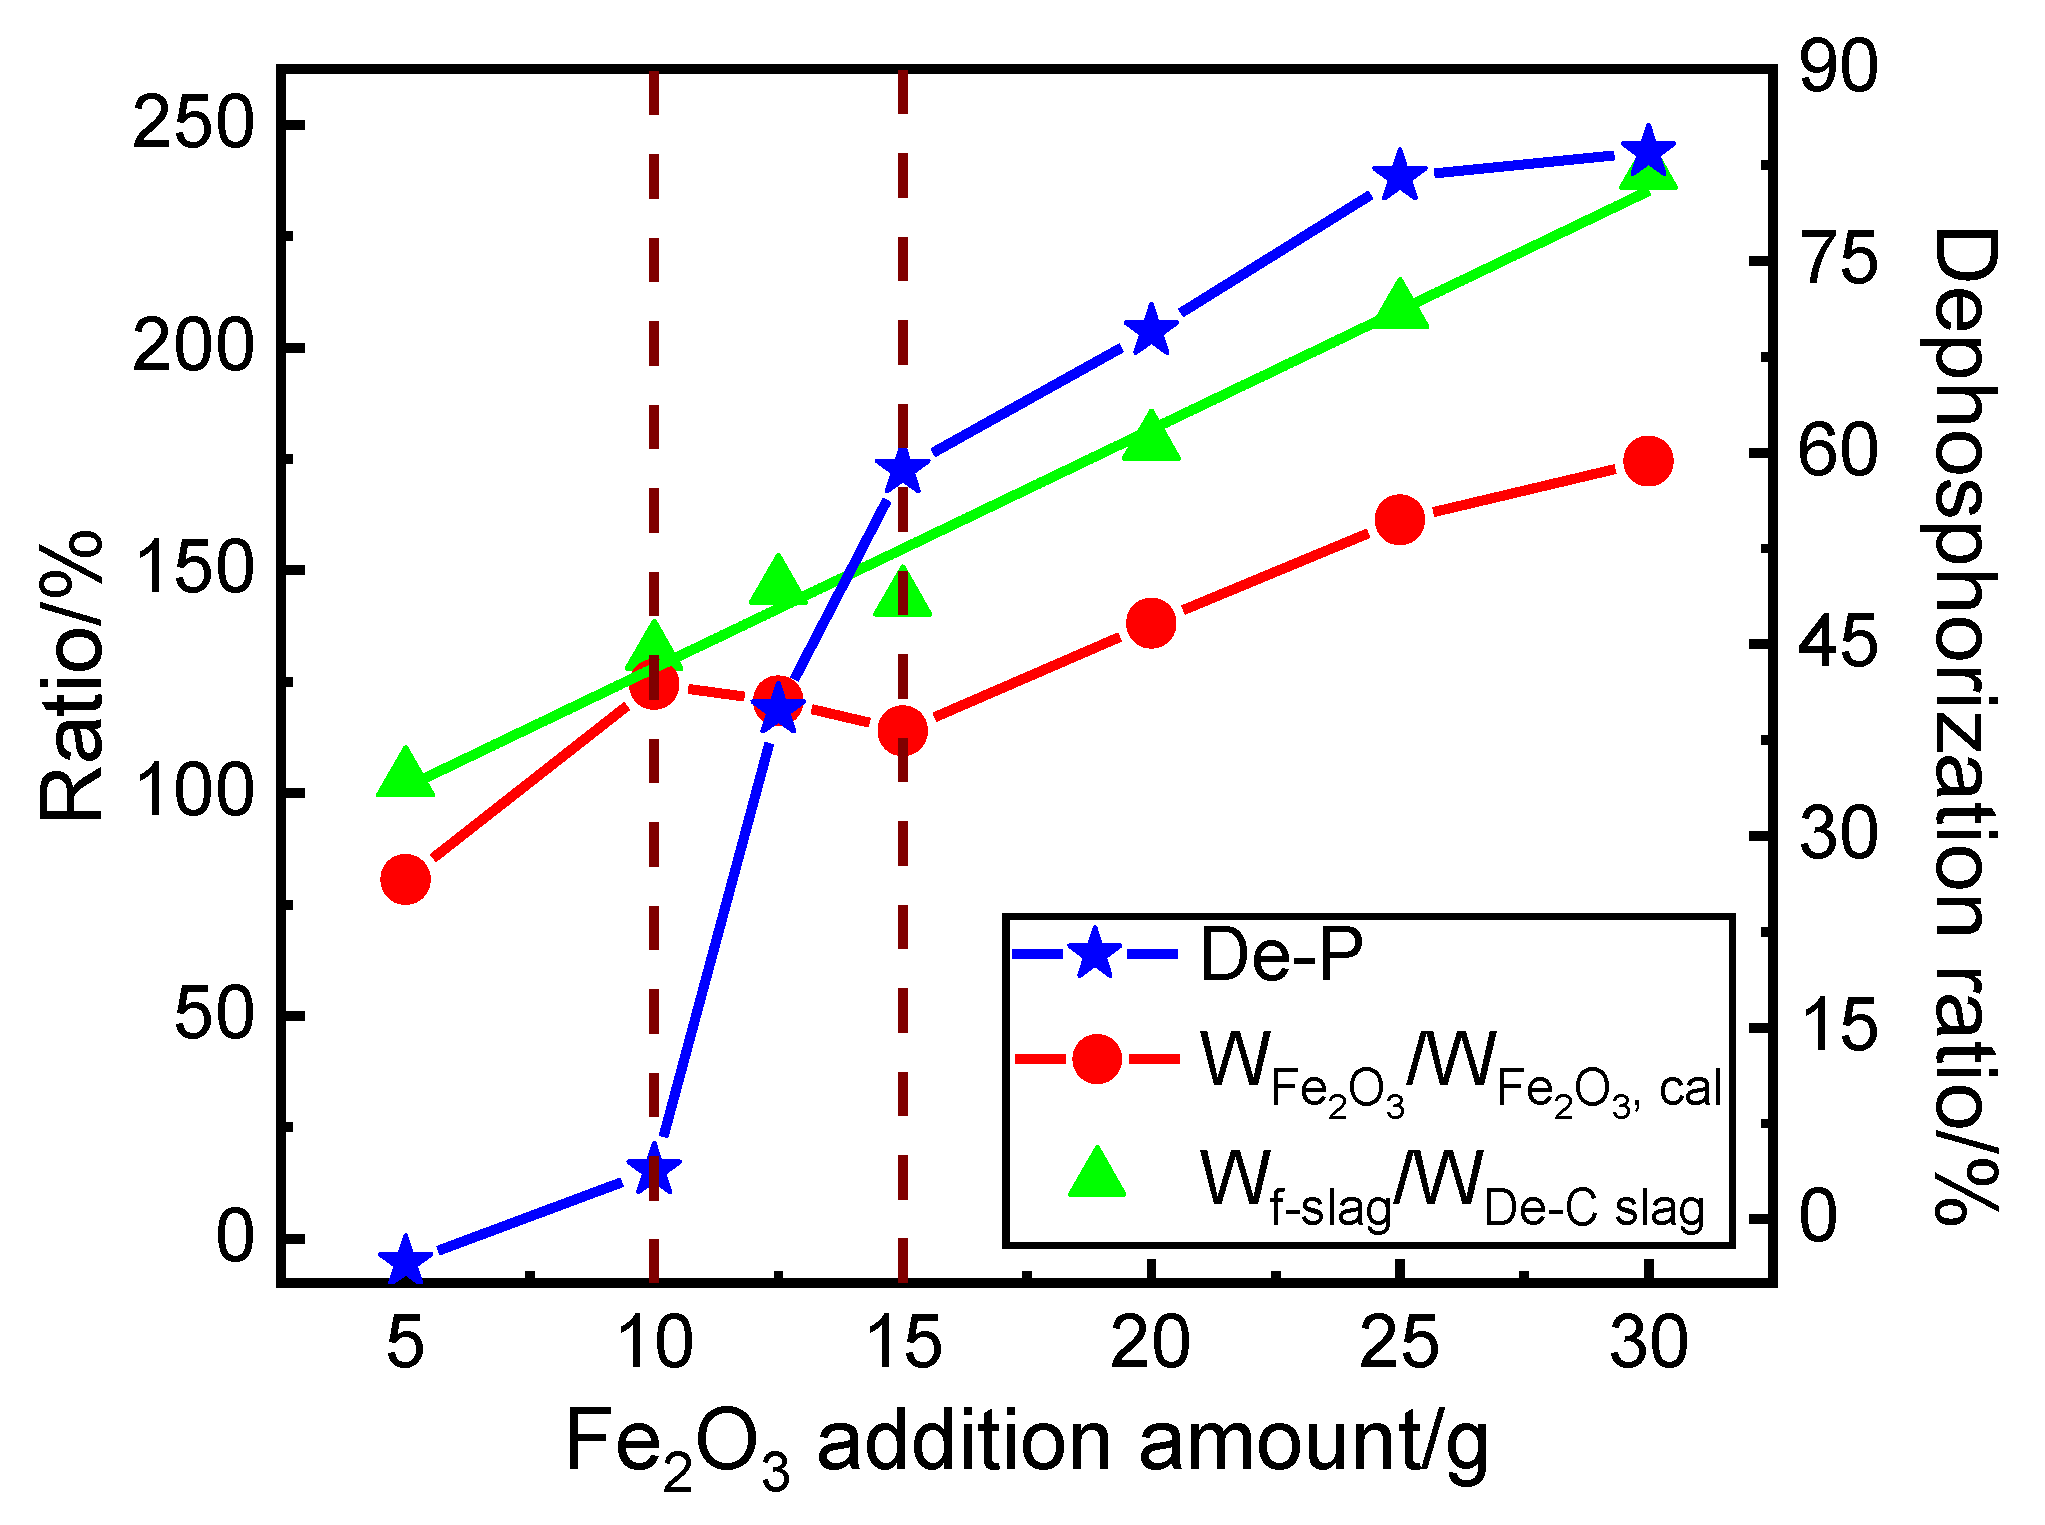
With increasing the Fe2O3 addition amount, the ratio of the amount of final dephosphorization slag to the addition amount of decarburization slag is increased steadily. The ratios of the Fe2O3 addition amount to theoretical calculation consumption increases at first, then decreases, and increases afterward. When it is around 175% with the Fe2O3 addition amount of 30 g, the dephosphorization ratio reaches the highest value of 83.3%.

Author Contributions

Conceptualization, W.Y. and J.Y.; methodology, J.Y.; validation, Y.S., Z.Y. and F.G.; formal analysis, W.Y.; investigation, W.Y.; resources, Y.S., Z.Y. and F.G.; data curation, R.Z. and H.S.; writing—original draft preparation, W.Y.; writing—review and editing, J.Y.; visualization, W.Y.; supervision, J.Y.; project administration, J.Y.; funding acquisition, J.Y. All authors have read and agreed to the published version of the manuscript.

Funding

This work is financially supported by the National Natural Science Foundation of China (Grant No. U1960202).

Institutional Review Board Statement

The study did not involve humans or animals.

Informed Consent Statement

The study did not involve humans or animals.

Data Availability Statement

Data supporting reported results can be found in this paper.

Conflicts of Interest

The authors declare no conflict of interest.

References

  1. Ogawa, Y.; Yano, M.; Kitamura, S.; Hirata, H. Development of the continuous dephosphorization and decarburization process using BOF. Tetsu-to-Hagané 2001, 87, 21–28. [Google Scholar] [CrossRef] [Green Version]
  2. Simeonov, S.R.; Sano, N. Manganese equilibrium distribution between carbon-saturated iron melts and lime based slags containing MnO, BaO, and Na2O. Trans. Iron Steel Inst. Jpn. 1985, 25, 1116–1121. [Google Scholar] [CrossRef]
  3. Pan, W.; Masamich, S.; Masahiro, H.; Kazum, M. Kinetics of phosphorus transfer between iron oxide containing slag and molten iron of high carbon concentration under Ar-O2 atmosphere. ISIJ Int. 1993, 33, 479–487. [Google Scholar]
  4. Jeoungkiu, I.M.; Kazuki, M.; Nobuo, S. Phosphorus distribution ratios between CaO-SiO2-FetO slags and carbon-saturated iron at 1573 K. ISIJ Int. 1996, 36, 517–521. [Google Scholar]
  5. Monaghan, B.; Pomfret, R.; Coley, K. The kinetics of dephosphorization of carbon-saturated iron using an oxidizing slag. Metall Mater. Trans. B 1998, 29, 111–118. [Google Scholar] [CrossRef]
  6. Xia, Y.; Guo, X.; Li, J.; Fan, D.; Wang, S. Effect of adding mode of iron oxide on dephosphorization behavior with the recycling of decarburization slag. Steel Res. Int. 2018, 89, 1800104. [Google Scholar] [CrossRef]
  7. Wang, Z.J.; Shu, Q.F.; Sridhar, S.; Zhang, M.; Guo, M.; Zhang, Z.T. Effect of P2O5 and FetO on the viscosity and slag structure in steelmaking slags. Metall. Mater. Trans. B 2015, 46, 758–765. [Google Scholar] [CrossRef]
  8. Li, F.; Li, X.; Yang, S.; Zhang, Y. Distribution ratios of phosphorus between CaO-FeO-SiO2-Al2O3/Na2O/TiO2 slags and carbon-saturated iron. Metall. Mater. Trans. B 2017, 48, 2367–2378. [Google Scholar] [CrossRef]
  9. Li, G.; Zhu, C.; Li, Y.; Huang, X.; Chen, M. The Effect of Na2O and K2O on the partition ratio of phosphorus between CaO-SiO2-FetO-P2O5 slag and carbon-saturated iron. Steel Res. Int. 2013, 84, 687–694. [Google Scholar] [CrossRef]
  10. Zhou, J.; Bi, X.; Yue, R.; Yang, F. Phosphorus distribution ratio between multi phase CaO-FeOt-SiO2-P2O5 (6%–13%) slags with MP near hot metal temperature and C-saturated molten iron at 1 573 K. ISIJ Int. 2017, 57, 706–712. [Google Scholar] [CrossRef] [Green Version]
  11. Wang, X.; Zhu, G.; Li, H.; Li, Y.C. Investigation on ‘slag-remaining+double-slag’ BOF steelmaking technology. China Metall. 2013, 23, 40–46. [Google Scholar]
  12. Liu, F.; Wang, G.; Zhao, Y.; Tan, J.; Zhao, C.; Wang, Q. Hot metal dephosphorization by low basicity slag in the early stage of converting process. Ironmak. Steelmak. 2019, 46, 392–403. [Google Scholar] [CrossRef]
  13. Tian, Z.H.; Li, B.H.; Zhang, X.M.; Jiang, Z.H. Double slag operation dephosphorization in BOF for producing low phosphorus steel. J. Iron Steel Res. Int. 2009, 16, 6–14. [Google Scholar] [CrossRef]
  14. Lin, Y.; Liu, Y.; Chou, K.; Shu, Q. Effects of oxygen atmosphere, FeOx and basicity on mineralogical phases of CaO-SiO2-MgO-Al2O3-FetO-P2O5 steelmaking slag. Ironmak. Steelmak. 2019, 46, 987–997. [Google Scholar] [CrossRef]
  15. Xie, S.; Wang, W.; Luo, Z.; Huang, D. Mass transfer behavior of phosphorus from the liquid slag phase to solid 2CaO·SiO2 in the multiphase dephosphorization slag. Metall. Mater. Trans. B 2016, 47, 1583–1593. [Google Scholar] [CrossRef]
  16. Zhao, B.; Wu, W.; Wu, W.; Meng, H.; Gao, Q.; Guo, Z. Study on the occurrence of phosphorus in the slag of hot metal dephosphorization for stainless steel production. Steel. Res. Int. 2020, 91, 2000021. [Google Scholar] [CrossRef]
  17. Han, X.; Li, J.; Zhou, C.G.; Shi, C.B.; Zheng, D.L.; Zhang, Z.M. Study on mineralogical structure of dephosphorization slag at the first deslagging in BOF steelmaking process. Ironmak. Steelmak. 2016, 44, 262–268. [Google Scholar] [CrossRef]
  18. Suzuki, M.; Nakano, S.; Serizawa, H.; Umesaki, N. In-situ phase identification of crystallized compound from 2CaO·SiO2-3CaO·P2O5 liquid. ISIJ Int. 2020, 60, 1127–1134. [Google Scholar] [CrossRef] [Green Version]
  19. Ye, G.F.; Jang, J.; Zhang, R.H.; Yang, W.K.; Sun, H. Behavior of phosphorus enrichment in dephosphorization slag at low temperature and low basicity. Int. J. Miner. Metall. Mater. 2021, 28, 66–75. [Google Scholar] [CrossRef]
  20. Yang, W.K.; Yang, J.; Shi, Y.Q.; Yang, Z.J.; Gao, F.B.; Zhang, R.H.; Ye, G.F. Effect of temperature on dephosphorization of hot metal in double slag converter steelmaking process by high-temperature laboratorial experiments. Steel Res. Int. 2020, 92, 2000438. [Google Scholar] [CrossRef]
  21. Yang, W.K.; Yang, J.; Shi, Y.Q.; Yang, Z.J.; Gao, F.B.; Zhang, R.H.; Ye, G.F. Effect of basicity on dephosphorization of hot metal with a low basicity slag at 1653 K. Ironmak. Steelmak. 2020. [Google Scholar] [CrossRef]
  22. Wu, W.; Dai, S.F.; Liu, Y. Dephosphorization stability of hot metal by double slag operation in basic oxygen furnace. J. Iron Steel Res. Int. 2017, 24, 908–915. [Google Scholar] [CrossRef]
  23. Xue, H.; Li, J.; Xia, Y.; Wan, Y.; Chen, L.; Lv, C. Mechanism of phosphorus enrichment in dephosphorization slag produced using the technology of integrating dephosphorization and decarburization. Metals 2021, 11, 216. [Google Scholar] [CrossRef]
  24. Shimauchi, K.I.; Kitamura, S.Y.; Shibata, H. Distribution of P2O5 between solid dicalcium silicate and liquid phases in CaO-SiO2-Fe2O3 system. ISIJ Int. 2009, 49, 505–511. [Google Scholar] [CrossRef] [Green Version]
  25. Pahlevani, F.; Kitamura, S.Y.; Shibata, H.; Maruoka, N. Distribution of P2O5 between solid solution of 2CaO·SiO2-3CaO·P2O5 and liquid phase. ISIJ Int. 2010, 50, 822–829. [Google Scholar] [CrossRef] [Green Version]
  26. Ogasawara, Y.; Miki, Y.; Uchida, Y.; Kikuchi, N. Development of high efficiency dephosphorization system in decarburization converter utilizing FetO dynamic control. ISIJ Int. 2013, 53, 1786–1793. [Google Scholar] [CrossRef] [Green Version]
  27. Suito, H.; Inoue, R. Thermodynamic assessment of hot metal and steel dephosphorization with MnO-containing BOF slags. ISIJ Int. 1995, 35, 258–265. [Google Scholar] [CrossRef] [Green Version]
  28. Wagner, C. The activity coefficient of oxygen and other nonmetallic elements in binary liquid alloys as a function of alloy composition. Acta Metall. 1973, 21, 1297–1303. [Google Scholar] [CrossRef]
  29. Kitamura, S.Y.; Yonezawa, K.; Ogawa, Y.; Sasaki, N. Improvement of reaction efficiency in hot metal dephosphorization. Ironmak. Steelmak. 2002, 29, 121–124. [Google Scholar] [CrossRef]
Figure 1. Equilibrium solidification curve of decarburization slag.
Metals 11 00417 g001
Figure 2. Results of the SEM image, XRD analysis and line scan of decarburization slag.
Metals 11 00417 g002
Figure 3. Effect of the Fe2O3 addition amount on the contents of elements in the hot metal after dephosphorization.
Metals 11 00417 g003
Figure 4. Effect of the Fe2O3 addition amount on the removal ratios of the element contents in the hot metal after dephosphorization.
Metals 11 00417 g004
Figure 5. Effect of the Fe2O3 addition amount on the contents of CaO and SiO2 in the slag and the basicity after dephosphorization.
Metals 11 00417 g005
Figure 6. Effect of the Fe2O3 addition amount on the contents of P2O5, Al2O3 and T.Fe in the slag after dephosphorization.
Metals 11 00417 g006
Figure 7. SEM images with the magnification of 200 times for the Fe2O3 addition amount of 5, 10, 12.5, 15, 25 and 30 g.
Metals 11 00417 g007
Figure 8. SEM images with the magnification of 1000 times for the Fe2O3 addition amount of 5, 10, 12.5, 15, 25 and 30 g.
Metals 11 00417 g008
Figure 9. XRD analysis results of dephosphorization slags for the samples from F5 to F30.
Metals 11 00417 g009
Figure 10. Change of P2O5 contents in nC2S–C3P (n = 1, 2, 4.8, 6, 20) and in P-rich phase with the basicity of the P-rich phase.
Metals 11 00417 g010
Figure 11. Changes in the P O 2 calculated as well as LP with the Fe2O3 addition amount at the end of dephosphorization.
Metals 11 00417 g011
Figure 12. Changes in oxygen activity at the slag–hot metal interface and in the hot metal with the Fe2O3 addition amount.
Metals 11 00417 g012
Figure 13. Changes in the ratios of the Fe2O3 addition amount to theoretical calculation consumption, the amount of final dephosphorization slag to the addition amount of decarburization slag as well as the dephosphorization ratio with the Fe2O3 addition amount.
Metals 11 00417 g013
Table 1. Target compositions and actual compositions of decarburization slag (mass%).
SampleCaOMgOMnOP2O5SiO2FeOR
Target46.58.23.73315.57222.98
Actual45.438.774.43.1117.0421.472.67
Table 2. Compositions of each phase in decarburization slag (mass%).
PositionMgOAl2O3SiO2P2O5CaOMnOFeO
A0.230.1432.06.7459.50.181.21
B3.140.020.450.0365.411.619.3
C46.10.000.370.023.0011.139.4
Table 3. Compositions of the slag and hot metal after dephosphorization as well as the compositions of initial hot metal (mass%).
No.T.FeFeOCaOSiO2Al2O3MgOMnOP2O5R[C]i[Si]i[Mn]i[P]i[C]f[Si]f[Mn]f[P]fFe2O3(g)
F516.220.837.822.44.826.974.712.921.694.170.3250.2920.2653.850.0860.2900.2745
F1021.827.731.920.16.175.674.452.881.594.230.3010.2930.2613.820.0370.1820.25110
F12.516.421.531.220.59.445.225.884.941.524.210.3350.3130.2713.760.0270.1140.16312.5
F1520.126.230.320.17.465.415.615.561.514.150.3170.3150.2713.520.0140.0770.11215
F2018.723.029.420.410.144.935.565.751.444.130.3200.2870.2633.420.0060.0570.08020
F2527.033.524.417.07.584.64.965.631.444.190.3140.2910.2693.430.0050.0410.05025
F3023.129.325.617.88.884.955.316.131.444.190.3510.2910.273.330.0030.0360.04530
Table 4. The compositions of each phase in the slag were analyzed by EDS (mass%).
PositionMgOAl2O3SiO2P2O5CaOMnOFeO
F5-A1.360.2039.45.4350.51.281.80
F5-B2.0023.222.30.3729.65.0817.5
F5-C29.60.457.960.021.1211.749.1
F5-D0.320.0992.30.25.640.220.53
F10-A-12.610.0828.87.8053.43.983.31
F10-A-23.590.1129.96.5854.32.622.97
F10-A-31.170.1530.15.9259.20.752.81
F10-B4.0211.425.51.1225.911.820.2
F10-C34.70.360.910.020.5918.844.6
F12.5-A-11.700.1229.38.6855.71.053.50
F12.5-A-21.540.1739.05.6348.11.424.15
F12.5-B2.3517.723.70.3931.73.2620.9
F12.5-C21.20.480.590.041.307.3869.1
F15-B5.979.5624.27.7435.96.4810.1
F15-C0.310.0612.40.110.150.0086.9
F20-B3.9612.122.06.9329.05.6520.3
F20-C0.130.063.160.050.120.0696.4
F25-A-12.080.7118.319.252.71.895.14
F25-A-21.400.0626.410.855.20.775.39
F25-B3.237.8828.01.6933.92.9122.5
F25-C6.222.8211.92.0615.73.5557.7
F30-A-11.740.0712.828.852.71.472.40
F30-A-21.060.1314.725.954.10.523.57
F30-A-31.400.0620.418.854.50.644.16
F30-B3.2111.124.12.9131.02.1725.5
F30-C14.70.570.480.020.714.1379.4
Publisher’s Note: MDPI stays neutral with regard to jurisdictional claims in published maps and institutional affiliations.

