Article

Effect of Alloying Elements on the Sr Modification of Al-Si Cast Alloys

1
Department of Applied Science and Technology (DISAT), Polytechnic of Turin, Viale T. Michel 5, 15121 Alessandria, Italy
2
Department of Applied Science and Technology (DISAT), INSTM c/o Polytechnic of Turin, Viale T. Michel 5, 15121 Alessandria, Italy
*
Author to whom correspondence should be addressed.
Metals 2021, 11(2), 342; https://doi.org/10.3390/met11020342
Submission received: 11 January 2021 / Revised: 11 February 2021 / Accepted: 13 February 2021 / Published: 19 February 2021

Abstract

:
Strontium-based modifier alloys are commonly adopted to modify the eutectic silicon in aluminum-silicon casting alloys by changing the silicon shape from an acicular to a spherical form. Usually, the modifier alloy necessary to properly change the silicon shape depends on the silicon content, but the alloying elements’ content may have an influence. The AlSr10 master alloy’s modifying effect was studied on four Al-Si alloys through the characterization of microstructural and mechanical properties (micro-hardness and impact tests). The experimental results obtained on gravity cast samples highlighted the interdependence in the modification of silicon between the Si content and the alloying elements. After modification, a higher microstructural homogeneity characterized by a reduction of up to 22.8% in the size of intermetallics was observed, with a generalized reduction in secondary dendritic arm spacing. The presence of iron-based polygonal-shaped intermetallics negatively affects Sr modification; coarser silicon particles tend to grow close to α-Fe. The presence of casting defects such as bifilm reduces Sr modification’s beneficial effects, and little increase in absorbed impact energy is observed in this work.

1. Introduction

In recent years, aluminum-silicon casting alloys have been given high consideration thanks to their excellent mechanical properties and generally good corrosion resistance [1,2]. Moreover, these alloys are characterized by high fluidity, good weldability, and low thermal expansion coefficient [3].
Several fields of application adopt aluminum alloys or aluminum composites [4], especially the automotive industry [5,6], where the light weight of aluminum alloys allows the reduction in cars’ weights and, consequently, greenhouse gas emissions [7]. From this point of view, it is not surprising that a great deal of publications consider aluminum-silicon alloys and aluminum composites or functionally graded materials for automotive applications, especially adopted to manufacture powertrain components such as pistons by traditional techniques [8,9] or by powder metallurgy [10,11], and process-related issues [12]. Thanks to alloying elements such as Mg and Cu, aluminum-silicon alloys are susceptible to heat treatment to achieve better mechanical properties. Heat treatment usually involves a first step where solubilization takes place, as the alloying elements solubilize into the α-aluminum matrix, and a second step of artificial aging, where intermetallic phases nucleate into the α-aluminum matrix, thus increasing mechanical properties [13]. During heat treatment, silicon shape modification takes place, and the eutectic silicon morphology changes from acicular to spherical; the magnitude of this transformation depends on the heat treatment parameters (times and temperatures) [14].
On the other hand, several chemical elements can promote the modification of eutectic silicon [15] instead of heat treatment: Sr, Na, K, Rb, Ca, Ce, La, Ba, and Yb. In [16], the authors investigated the effect of Ba, Ca, Y, and Yb on 356.0 alloy, observing that these elements modify the eutectic silicon to different degrees. Ba and Ca lead to a good or very good modification of Si into a fine fibrous silicon structure, especially Ba, which led to the best modification among the elements analyzed for the specific alloy composition. Y and Yb caused a plate-like structure, and the same result was underlined in [17] for alloy A357 (EN AC 42100). When aluminum-silicon alloys were modified by Yb and Sr, the nucleation temperature of the eutectic silicon decreased, its shape changed from a coarse plate-like to a fine fibrous structure [18]. As regards Eu [19], research has evidenced a very good modification already with 0.05% w.t. Eu in Al-5% Si alloy. Addition of 1% w.t. Ce [20] led to a partial eutectic modification, while the addition of 1% w.t. Ce and 0.04% w.t. Sr can modify the eutectic structure.
In [21,22], the authors studied the relation between the increase in Sc levels and the refining and modification effects in Al-Mg2Si alloys and found that the silicon shape evolves from a rough plate-like shape to a thin coral-like and fine fibrous morphology.
Al-Si alloys are commonly modified in industrial practice by employing the master alloy Al-Sr10 [23,24]. Experimental evidence demonstrated that Sr modification’s effectiveness depends on both the Sr quantity and the metal quality. High metal quality (minor oxide into the melt) requires a low Sr amount [25]. As proposed in [26], the eutectic phase and the intermetallic phase β-Al5FeSi nucleate on the same nuclei; it is conceivable that Fe affects the eutectic phase. In fact, in [27], it was demonstrated that the number of eutectic grains in Sr-modified alloys containing 10% w.t. silicon is lower when the amount of Fe is higher. As regards mechanical properties, in [28], the authors investigated the effect of refining the Sr-modified A356.2 alloy on the mechanical properties, finding an increase in impact-released energies with the decrease in the grain size after Sr addition. In [29], Sr addition was investigated in the alloy EN AC 46000, and it was found that Sr causes a substantial improvement in tensile properties compared to the as-cast properties. The addition of 276 ppm of Sr increases ultimate tensile strength from 300 to 350 MPa and causes an increase in elongation at rupture from 3% to 6%. Furthermore, a decrease in eutectic temperature nucleation was observed and outlined in alloy A319 [30]. The same behavior was outlined in [31] for high-purity hypoeutectic alloys.
In this work, four aluminum-silicon casting alloys were analyzed. Samples were studied in the unmodified condition or after the use of the master alloy AlSr10. Alloys were cast by gravity casting, and samples were prepared and analyzed in terms of microstructure (silicon shape and intermetallic fraction) and mechanical properties (micro-hardness and impact tests) to find a relationship between the modification and all of these parameters. Intermetallic phase evolutions after the Sr adoption were also investigated to highlight how the various intermetallic phases are affected by Sr for each alloy. Based on the literature, the main intermetallics found in the alloys are reported in Table 1. The goal of the work is to highlight relationships between eutectic characteristics and Sr addition.

2. Materials and Methods

The effect of AlSr master alloy addition to four aluminum-silicon alloys with different silicon contents was studied in this work. Three alloys belong to the hypoeutectic alloys group—EN AC 42100 (AlSi7Mg0.3), EN AC 45300 (AlSi5Cu1Mg), and EN AC 43500 (AlSi10MnMg)—while the fourth alloy belongs to the eutectic system, EN AC 48000 (AlSi12CuNiMg). Compositional details for the alloys, from now on named alloy 1, alloy 2, alloy 3, and alloy 4, are shown in Table 2. The composition data refer to standard 1706 and technical datasheets.
All of these alloys can be reinforced by precipitation hardening because they contain a certain Mg tenor (reinforcing by nucleation of Mg2Si intermetallics); alloys containing Cu can additionally form Al2Cu and AlCuMg phases [36], and Ni-containing alloys can form Al3Ni and other complex intermetallic phases [37]. The presence of Fe and Mn leads to obtaining Fe-based intermetallic phases such as Al5FeSi, Al8FeMg3Si6, and Al15(FeMn)3Si2 [38], as reported in Table 1.
Each alloy was separately melted in a graphite crucible, and 250 ppm AlSr10 master alloy was added for the modification 10 minutes before casting. Casting temperatures were set to 710 °C for alloy 1 and alloy 2 and 730 °C for alloy 3 and 4. No drossing agents and fluxing agents were used. Castings obtained (eight in total: four modified and four unmodified) were cut into smaller samples of 25 mm × 25 mm × 10 mm and then polished using SiC papers from 180 to 2400 grit, diamond paste, and colloidal silica for microstructural analysis and micro-hardness measurements.
After polishing, the microstructures were investigated using an optical microscope (optical microscope LEICA MEF4M, Leica Microsystems, Heerbrugg, Switzerland), and the eutectic area percentage, eutectic particles’ shape, and particles’ dimensions were measured at three different parts of each sample using an image analysis software (LEICA QWin, version 3.5, Leica Microsystems, Heerbrugg, Switzerland). It is important to note that the measured morphological features (eutectic average particle size, percentage of the occupied area, and circularity) included intermetallic phases and silicon. Intermetallic phase areas were then measured using an image analysis algorithm with the open-source software ImageJ.
The eutectic area percentage, which is the eutectic percentage calculated in a specific area, was measured for each alloy using three micrographs at magnification 20X. The eutectic shape, particle dimensions, and intermetallic dimensions were measured using three images at 50X magnification for each sample, and finally, secondary dendrite arm spacing (SDAS) was measured as reported in ref. [39] by measuring thirty dendrites for each sample, employing three images at 10X magnification. Details about the SDAS measurement and image analysis are shown in Figure 1. Alloys’ micro-hardness was calculated as an average value from ten indentations for each specimen (parameters: 15 s, 500 gf, HV 0.5) using a LEICA VMHT tester, Leica Microsystems, Heerbrugg, Switzerland. Micro-hardness was adopted instead of macro-hardness because smaller indentations may permit observing the AlSr10 effect in eutectic regions.
Since impact tests can estimate the ductility of alloys under conditions of rapid loading [23], these tests were conducted to assess the effectiveness of the modifications. Tests were performed using three specimens for each type of casting (modified and unmodified), milled at a size of 10 mm × 10 mm × 55 mm, following the ASTM E29-16b standard TG5113E, Zwick Roell, Genova, Italy. Expected absorbed energies are low, as noticeable from previous work where the energy absorbed for aluminum composite samples (alloys EN AC 48000 and EN AC 42100) was, at maximum, 20 J [40]. Moreover, other research in the literature reported absorbed energy of almost 15 J in [28], a maximum of 7 J for alloy 356.0 in [41], and an average value of 7 J for various alloys AlSi10 [42].

3. Results and Discussion

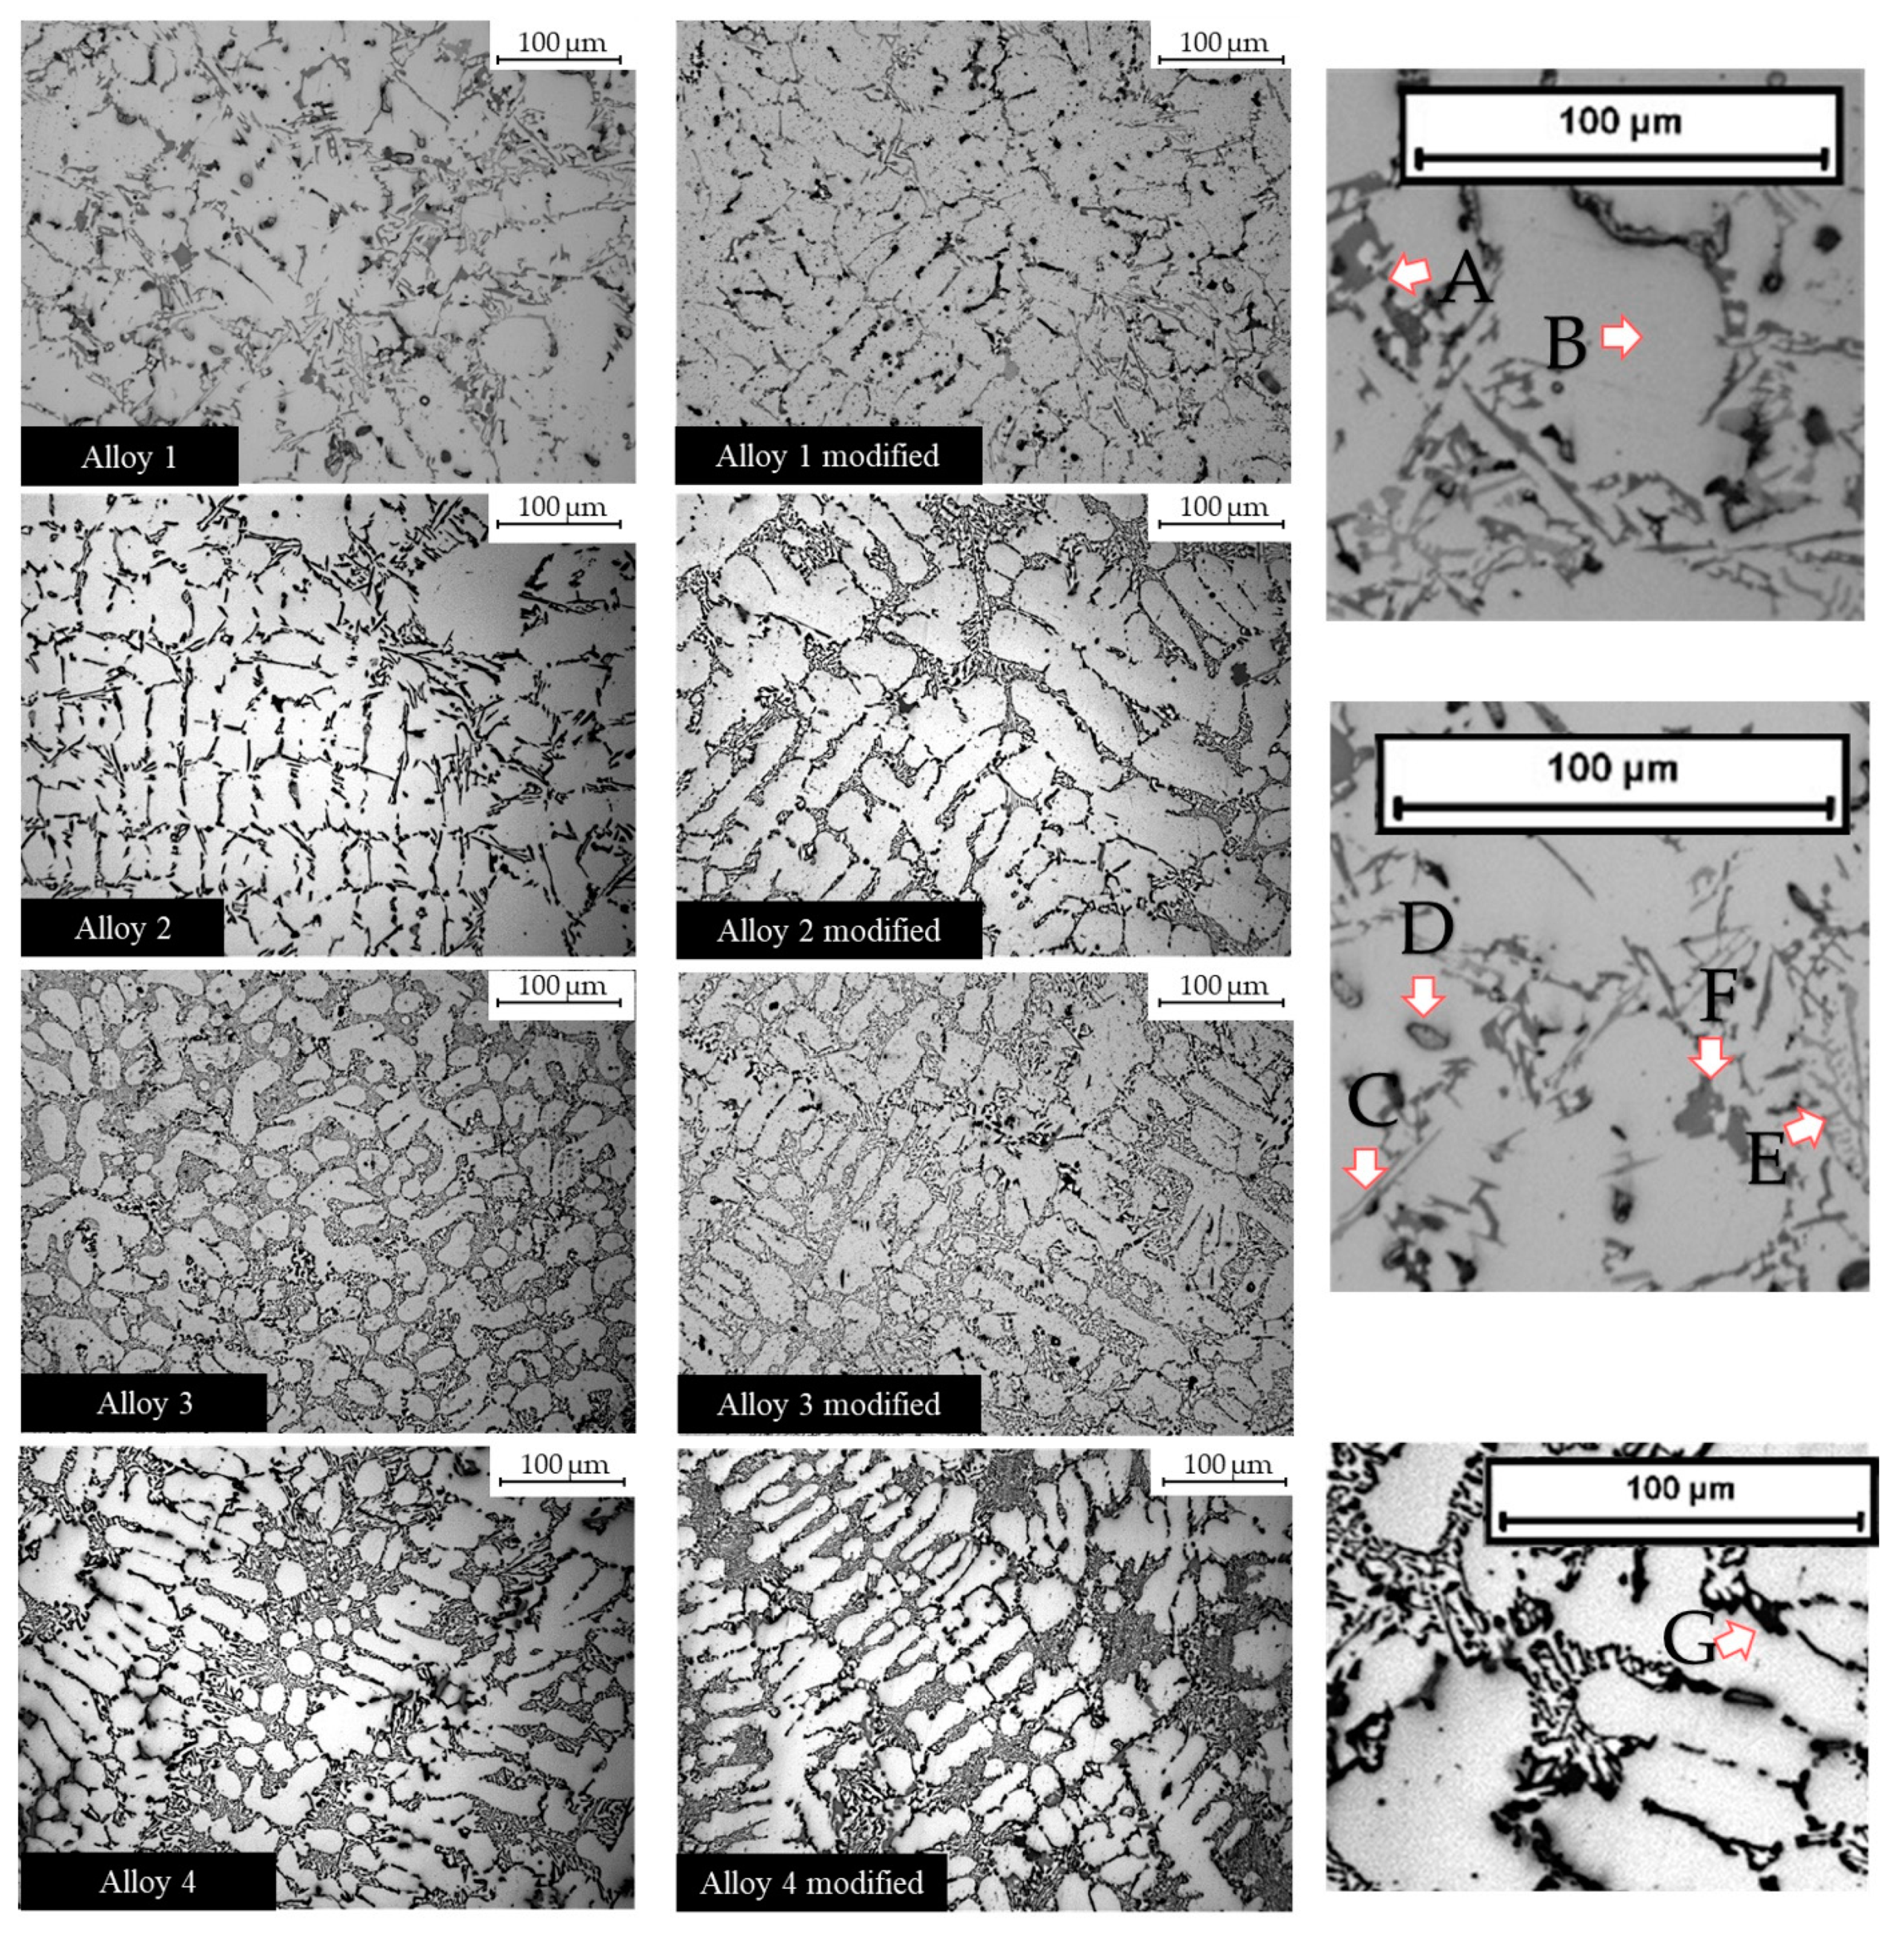
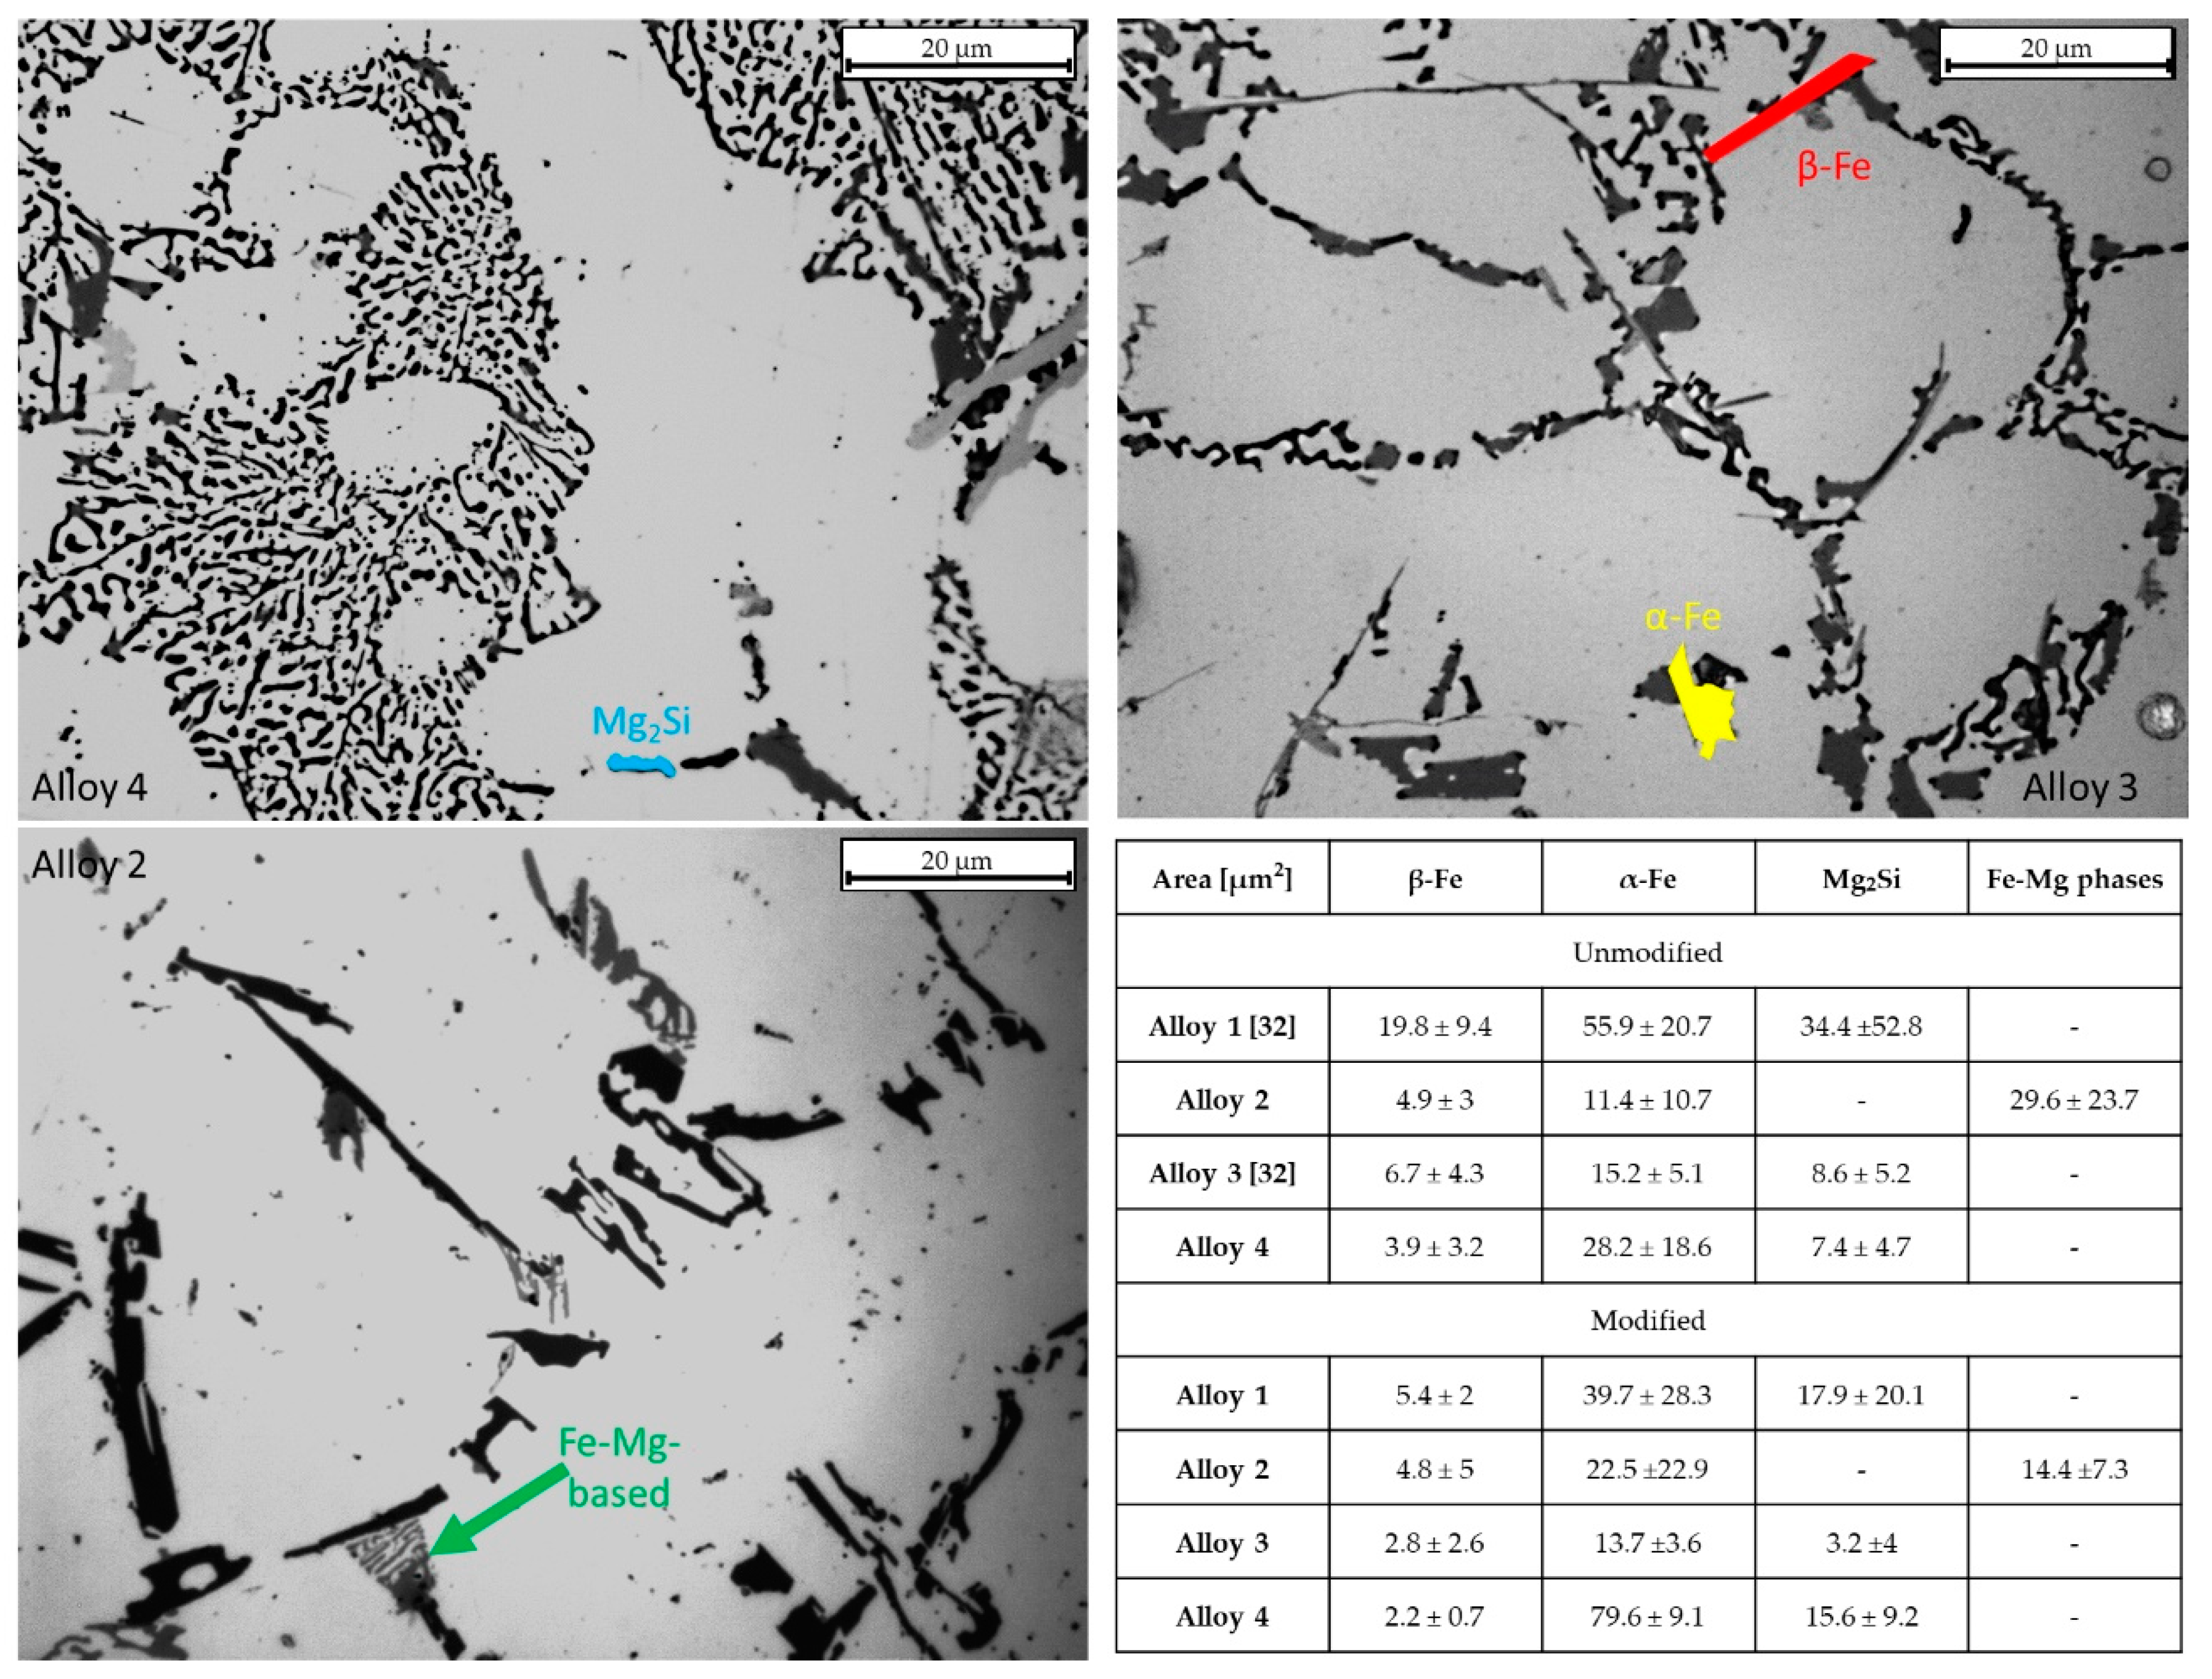
3.1. Microstructures and Intermetallic Phases
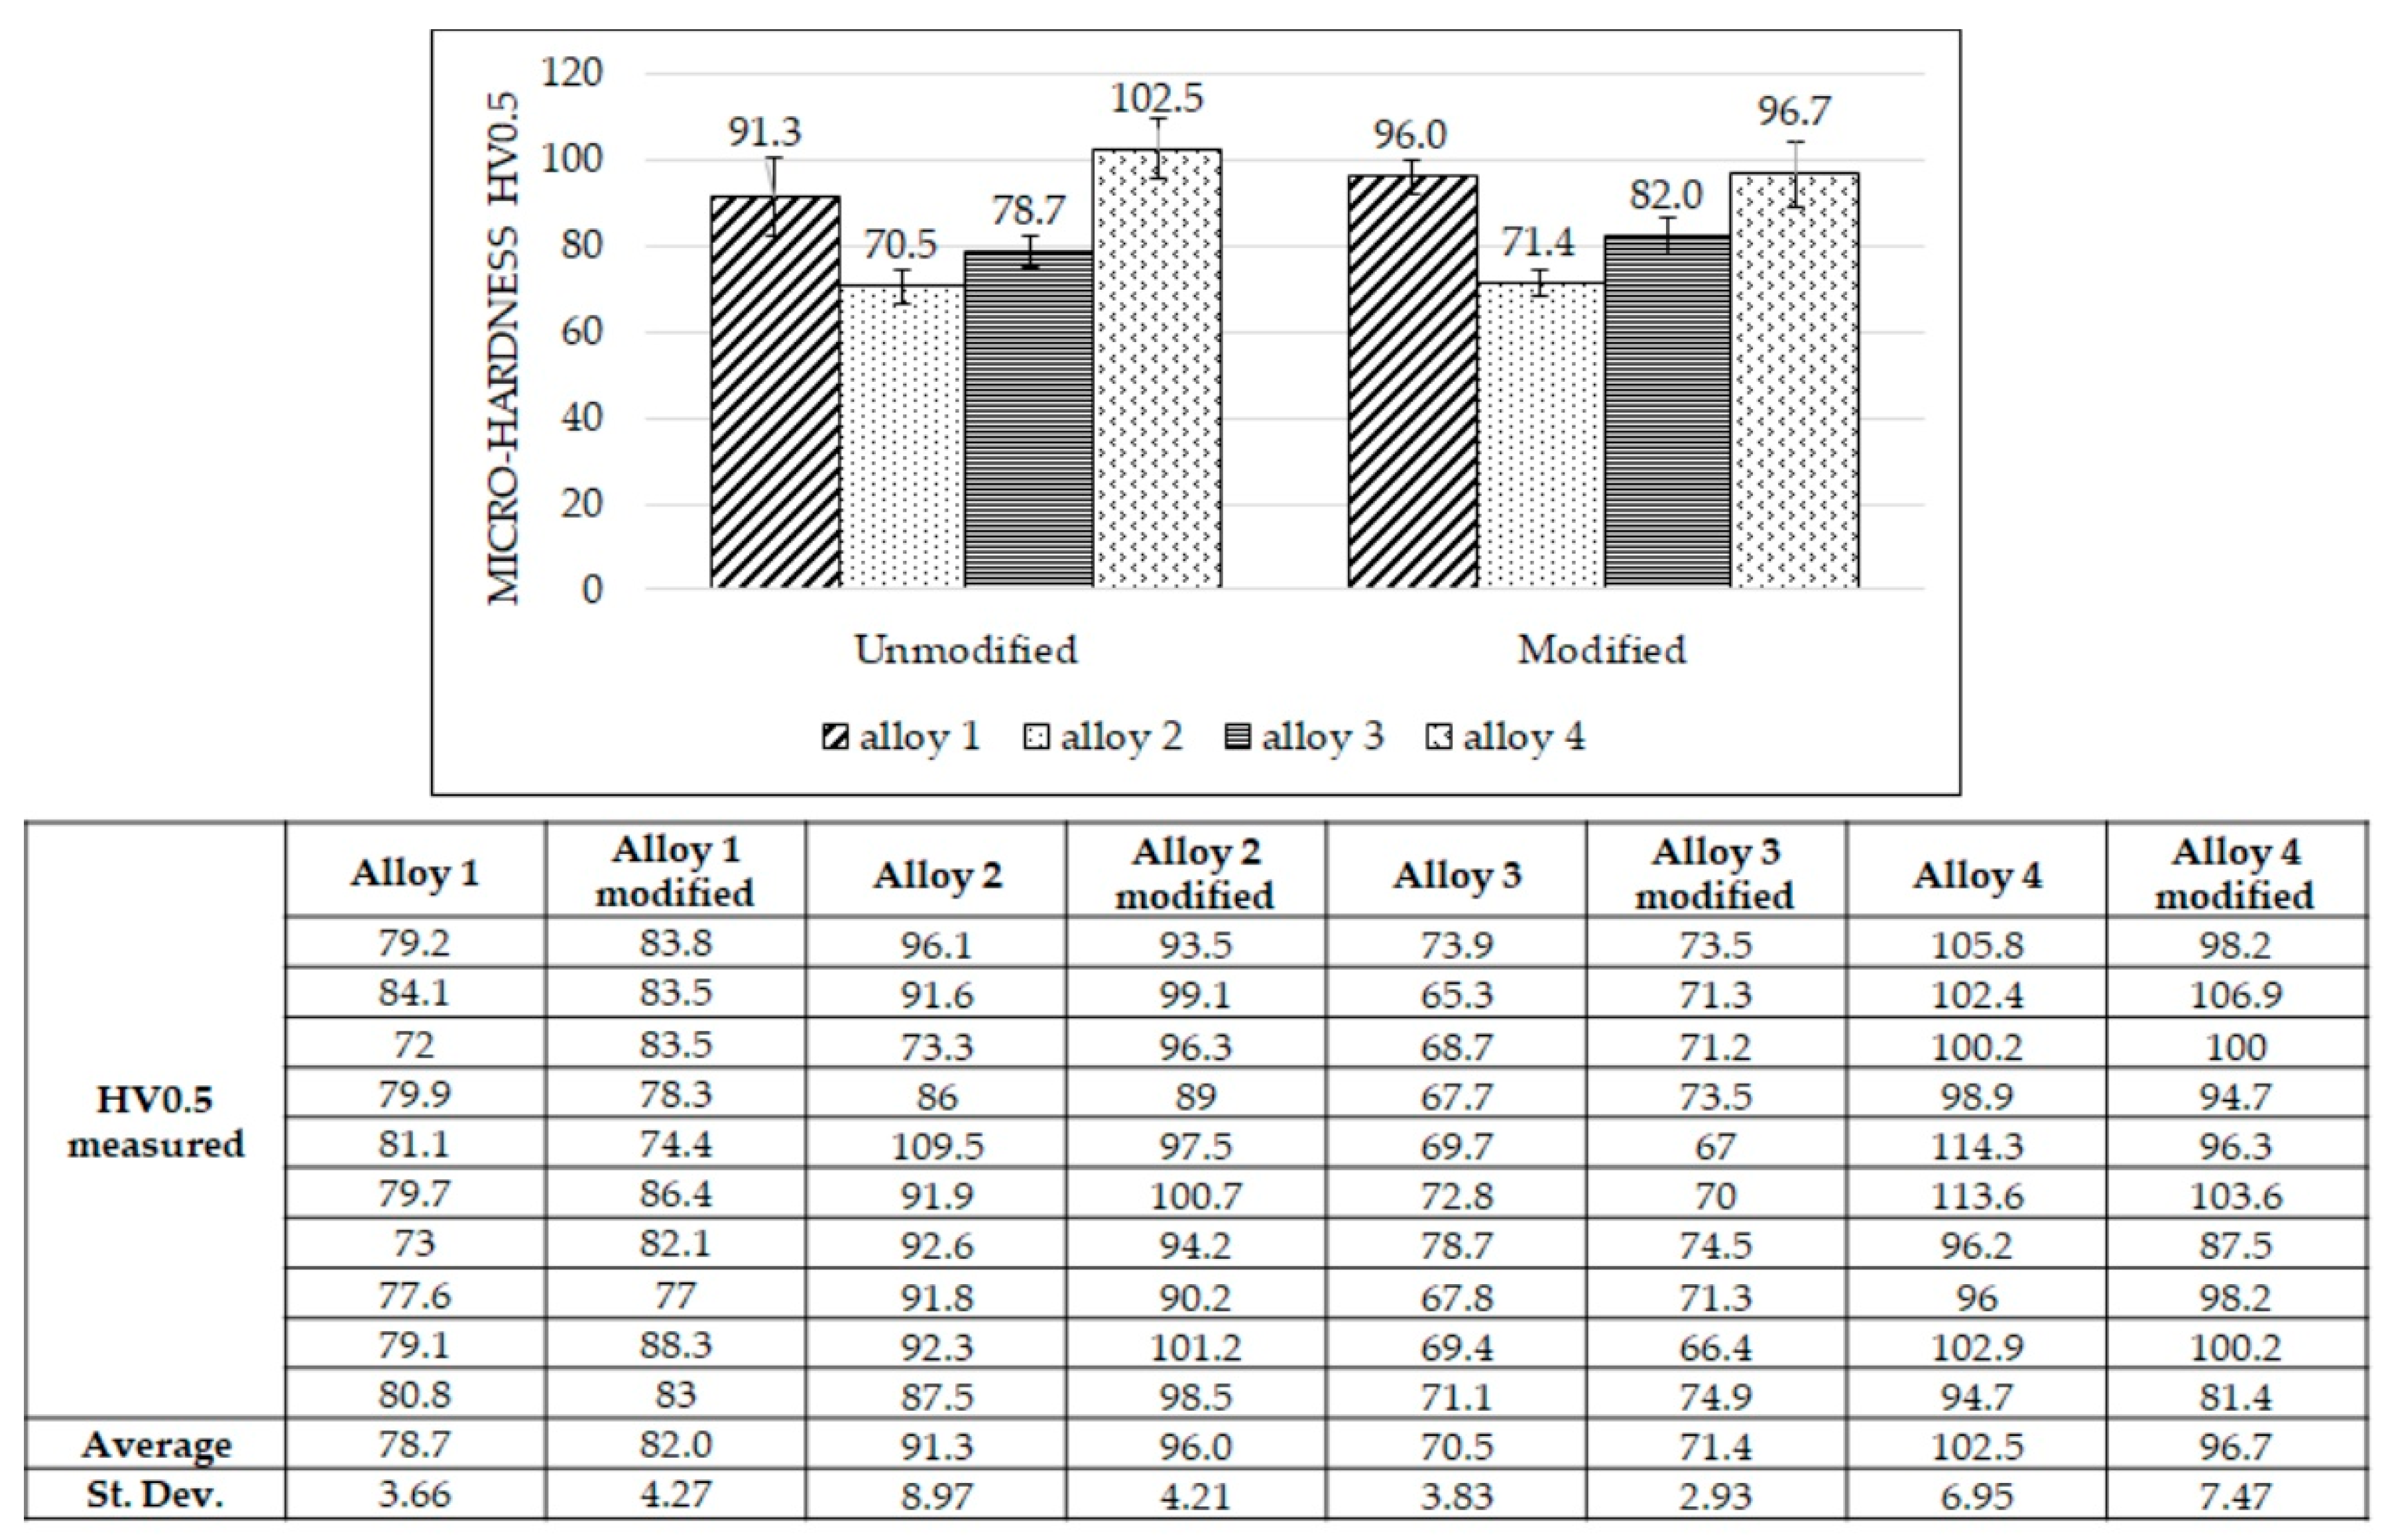
Microstructures in unmodified alloys depend on the intermetallic phases, which depend on the alloying elements. As previously mentioned, the alloys studied in the present work contain a certain amount of Fe, Mn, and Mg. Additionally, alloy 1 and alloy 4 contain Cu and Ni (as reported in Table 2). The microstructures of the unmodified and modified alloys are reported in Figure 2. Some intermetallic phases are detectable by optical microscopy. The amount of intermetallic phases in the alloys and their influence on mechanical properties depend mainly on the alloys’ compositions. Some of these intermetallic phases are known to be detrimental [43] as β-Al5FeSi, increasing the iron content, causes elongation reduction. Fe-β intermetallic phases were profusely found in alloys 1 and 3. Cu substantially influences both strength and hardness, already in the as-cast state [44].

3.2. Micro-Hardness

Micro-hardness measurements were carried out in the middle of the samples, and the results are reported in Figure 3. Micro-hardness varies slightly after adding Al-Sr; for alloys 1 to 3, a subtle increase in micro-hardness was observed after Al-Sr addition, while micro-hardness decreased for alloy 4 after Al-Sr addition. Such differences in micro-hardness are relatively narrow, and a neat, systematic trend was not observed. Positively, intermetallic phases affect the alloys’ hardness; particularly, alloys with higher Cu, Fe, Ni, and Mg contents can form harder intermetallic phases than other alloys. Based on the alloying elements shown in Table 2 and intermetallic phases listed in Table 1, alloy 1 and alloy 4 are expected to be the hardest ones because they contain strengthening elements such as Cu, Mg, Ni, Fe, and Mn; moreover, alloy 4 is the hardest because it contains the highest quantity of silicon. For the same reasons, alloy 3 is harder than alloy 2 because it contains a higher Si amount.
A larger dispersion in the measured micro-hardness was observed for the hardest alloys (alloys 1 and 4); such variability is due to the significant difference between the micro-hardness measured near the hard intermetallics and that measured in the soft α-Al matrix (maximum and minimum values measured were 100 and 72 HV0.5, respectively, in alloy 1 and 115 and 81 HV0.5, respectively, in alloy 4).
Micro-hardness appears dependent on alloying elements. This dependence is outlined in Figure 4. Only Si, Fe, Mg, and Cu were considered, because these elements affect the alloys’ micro-hardness. In Figure 4A, a parabolic trend between Si content and micro-hardness values is noticeable. Despite the increase in Si tenor, alloy 2 and alloy 3 present less micro-hardness than alloy 1. This behavior was due to their low amount of alloying elements. In fact, in Figure 4B–D, increases in micro-hardness by parabolic trends with Mg addition, Fe addition, and Cu addition, respectively, in modified or unmodified alloys are visible. The Fe effect could be well approximated by a linear trend too. Furthermore, trends in Figure 4E–H further clarify the impact of Fe, Cu, and Mg on micro-hardness. Alloy 2 and alloy 3 have lower Mg and Fe contents, while these elements cause an increase in micro-hardness.
Figure 4D clearly shown that the increase in micro-hardness is related to the presence of Cu. The higher the average Cu amount, the higher the micro-hardness, as observed for all of the alloying elements analyzed. The trends in Figure 4E,G are similar: it seems that the Fe amount almost does not affect the parabolic trend; in fact, the R2 values are similar in each case. On the other hand, trends in Figure 4B,F are similar, but the R2 value changes in both the alloy states (unmodified and modified); this makes the effect of Fe on micro-hardness values more evident.
Studying the evolution in micro-hardness as a function of the alloying elements may permit to assume, in advance, the micro-hardness attended for a specific alloy in the as-cast condition. In respect to the micro-hardness, all samples, modified and unmodified, have the same pattern.

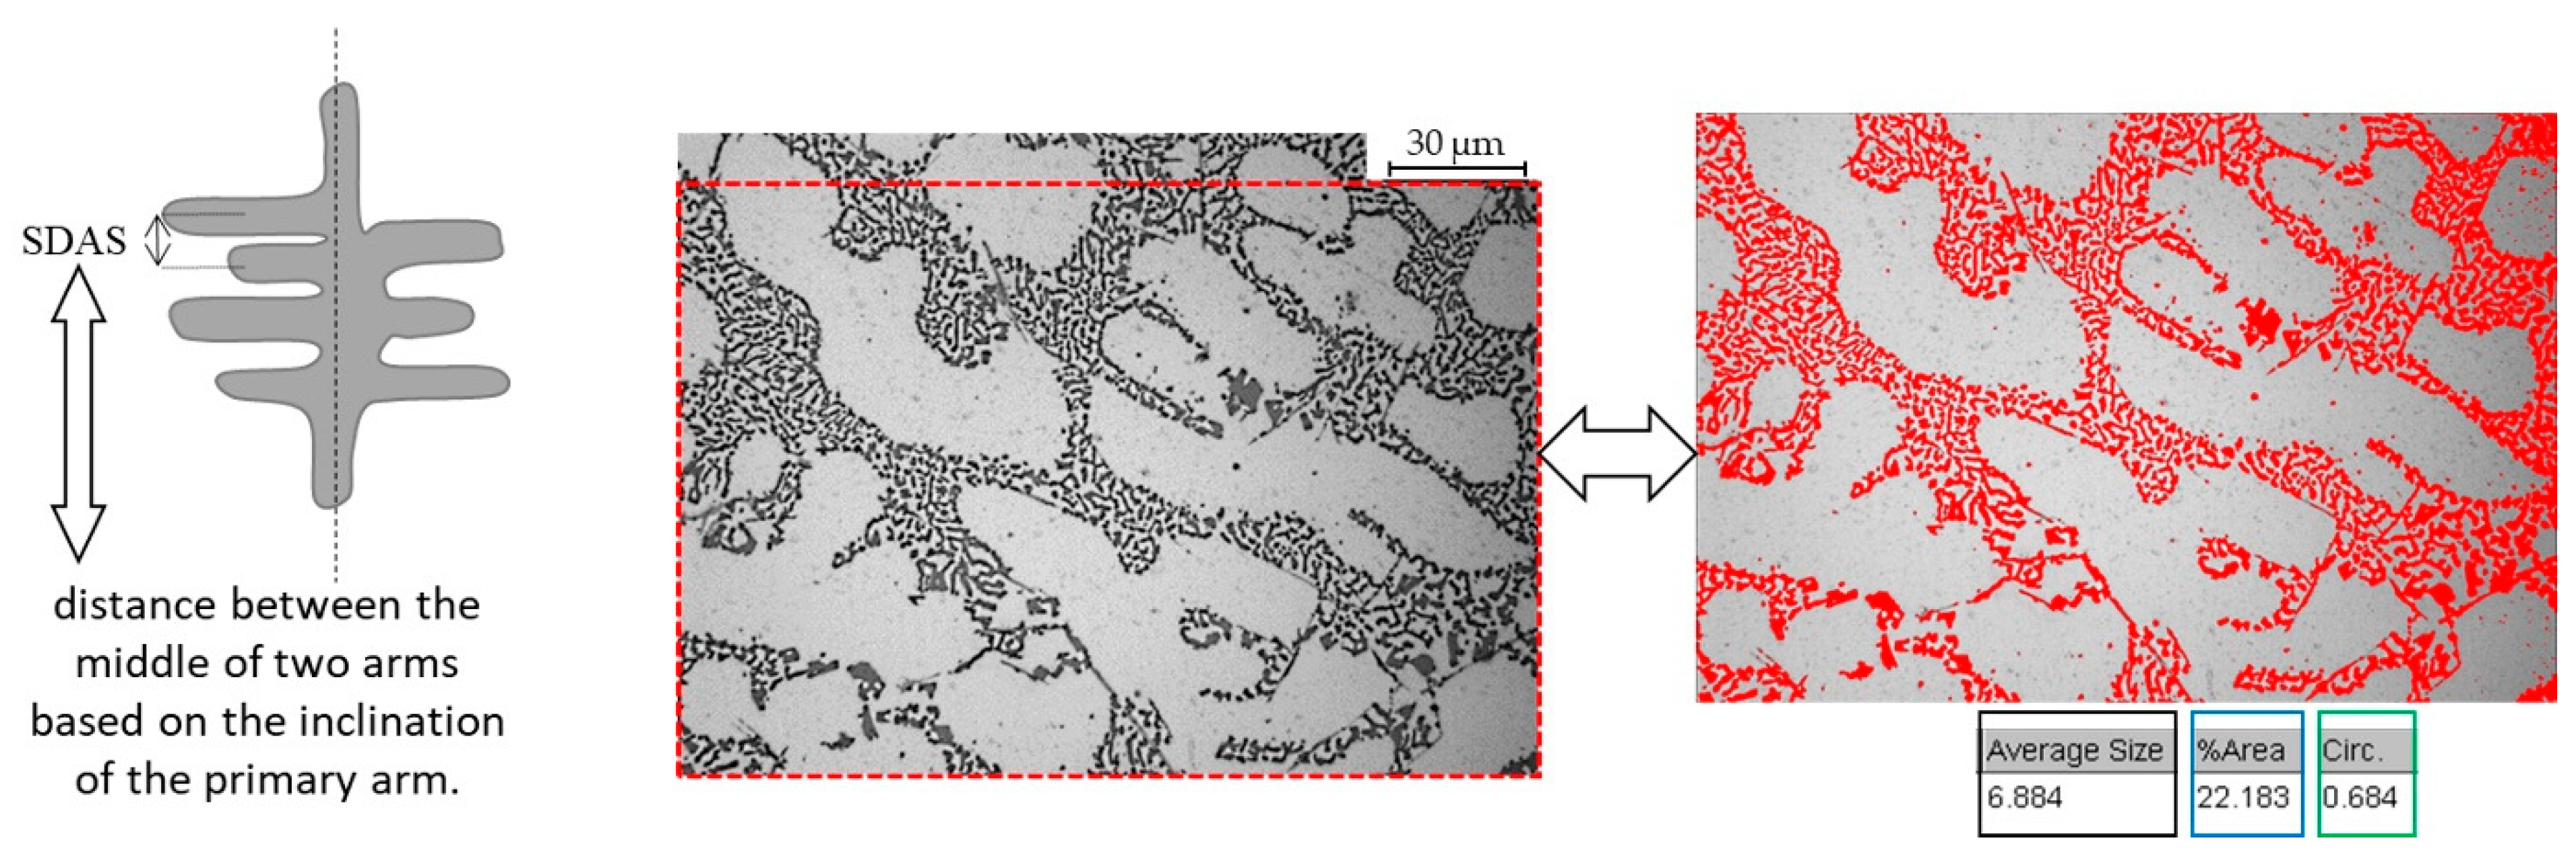
3.3. Secondary Dendrite Arm Spacing (SDAS)

SDAS measurements were carried out in all samples to observe the difference between the modified and unmodified specimens, following the procedure reported in Figure 1. As noticeable from Table 3, the SDAS decreased in all alloys after the addition of AlSr10. Remarkably, the most significant decrease was noticed for those compositions with lower silicon content (alloy 1), while a minor decrease was observed in alloy 4. In detail, SDAS in alloy 1 was reduced by 34%, in alloys 2 and 4 almost by 16%, and in alloy 3 by approximately 8%. These average results suggest that Al-Sr reduces SDAS significantly for alloys with lower silicon contents.
However, the casting removal from the mold may affect SDAS comparison in alloys having similar silicon contents because delays in the casting extraction can slow the cooling rate down, thus increasing the measured SDAS.

3.4. Eutectic Modification

The eutectic region includes the eutectic silicon and the intermetallic phases. The Sr modification mainly influences the average particle size of the silicon, the silicon shape, and the area occupied by the eutectic phase into the alloys’ bulk (percentage of the eutectic silicon in a specific measured area). The eutectic size was strongly reduced after AlSr addition, as visible in Table 4 and Figure 5.
The eutectic phase’s size is different among the unmodified alloys, but such difference is reduced after modification with AlSr. Alloys with less silicon (alloys 1 and 2) have a eutectic size of approximately 10 µm, and alloys with more silicon (alloys 3 and 4) are closer to 2.5 µm; all the results from the image analysis are reported in Table 3 for each alloy. Figure 5 shows the relationships found between SDAS and alloying elements. In particular, in Figure 5A, a parabolic trend in both the unmodified and modified alloys is observed. Figure 5B shows the relation between SDAS and the average content of the alloying elements Fe, Mg, and Cu: in this graph, it is noticeable that the R2 parameter resulted very low; there is not a clear trend between the alloying elements and the SDAS measured. Finally, in Figure 5C, all the main alloying elements (Si, Fe, Mg, and Cu) were considered: for unmodified compositions, an excellent parabolic approximation having an R2 value of 0.999 is observed. This result indicates that there seems to exist a mathematical relation between SDAS and average alloying element, as in Equation (1):
y = −6.923 x2 + 31.71 x + 11.103
where y is the SDAS and x is the average sum of the elements Si, Fe, Mg, and Cu.
The measurement of circularity evaluates the particle’s perimeter’s smoothness: the smoother a particle becomes, the higher the circularity value. From Table 4, it seems that the best results were obtained for alloys 3 and 4. The evaluation of solidity instead is useful to characterize the regularity and roughness of a particle as it represents the ratio between the area of the measured particle and the perimeter of the imaginary convex hull around it. As regards solidity, as the particle becomes more solid, the solidity value approaches one.
A parabolic relationship between silicon content and particle size was found (Figure 6A). Alloys having a lower content of alloying elements have larger eutectic particle sizes. This behavior is due to the large presence of alloying elements favoring nucleation of intermetallics into the eutectic area, thus limiting the growth of silicon. On the other hand, in the modified alloys, a linear correlation between the reduction in eutectic particle size and the Si content increase is noticeable: the greater the Si content, the lower the Si size. Figure 6A–D display the eutectic particle size evolution related to Si, Fe, and Mg contents.
No clear trend was observed between Fe or Mg content and the reduction in eutectic silicon particle size. Essentially, the higher the Fe and Mg content, the higher the intermetallic phases that occur into the eutectic region; consequently, it seems that the modification acts to reduce some intermetallic phases’ size too, resulting in smaller average eutectic size, even though from the literature [45], it seems that the increase in Mg harms Sr modification. According to other research from the literature [34], a reduced effect of Sr modification was observed in alloys with higher Mg content. The reduction in the area occupied by the eutectic phase was reduced to a lesser extent (in magnitude) in alloy 1 and alloy 4, which are richer in Mg than the other alloys. Furthermore, Shabestari et al. in [41] demonstrated that if Mn is present, Sr has a negligible effect on modifying the form of the primary β-Fe phase. In this respect, a large amount of β-Fe phase was found in modified alloys 1 and 3, compositions which are rich in Mn.
In [46], the authors underline that despite Sr addition, α-Fe intermetallics do not dissolve into the Al matrix, while β-Fe intermetallics can be affected by Sr addition [47]. This behavior can be highlighted by measuring the main intermetallic phases, easily discernible under an optical microscope. The evolution of different intermetallic phases was studied in each alloy. Mainly, α-Fe phases, β-Fe phases, and Fe-Mg intermetallics were analyzed through the image analysis, finding a relation between Sr addition and intermetallic modification. Figure 7 shows the results regarding the main intermetallic phases detected in each alloy and their evolution (in terms of area occupied) after Sr addition. From Figure 6, it is arguable that β-Fe phases decrease after Sr addition; the area occupied by β-Fe intermetallic phases decreases further in alloys 1 and 3, where a high amount of β-Fe was detected—from 33.7 to 5.4 µm2 in alloy 1 and from 15.9 to 2.8 µm2 in alloy 3.
Furthermore, a decrease in the average occupied area of α-Fe in alloy 1 after Sr addition, from 55.9 to 39.7 µm2, was observed, with similar standard deviations. Alloy 4 shows a sharp increase in α-Fe after Sr addition, from 28.2 to almost 80 µm2. Looking at the average area results (Figure 7), it may be argued that Sr acts on β-Fe phases, causing its fragmentation in all the alloys. As for Mg-containing phases, they decrease their occupied area, apart from alloy 4, which increases both Mg2Si and α-Fe phases. Alloy 3 shows similar values in terms of average intermetallic phase area.
Intermetallic behaviors could be related to the eutectic particles’ size. For alloy 1, eutectic particle size decreased by 40.4%, and all the intermetallic phases decreased in average area; this indicates that the eutectic particle size decrease was mainly due to the intermetallic area reduction rather than Si reduction. Alloy 2 eutectic particle sizes decreased by about 70%, while an increase in the α-Fe area of about 50% was observed. This evidence indicates that the average eutectic area’s substantial decrease was mainly due to silicon reduction and Fe-Mg intermetallic reduction.
As regards alloy 3, the average eutectic particle area shrank by 86% after Sr addition. Looking at the intermetallic area evolution, it appears that the eutectic area decrease is attributable to both silicon and intermetallic reduction. Finally, in alloy 4, an increase in α-Fe and Mg2Si phases was detected. The reduction in the average eutectic particles’ area (almost 85%) is mostly attributable to a decrease in Si size.

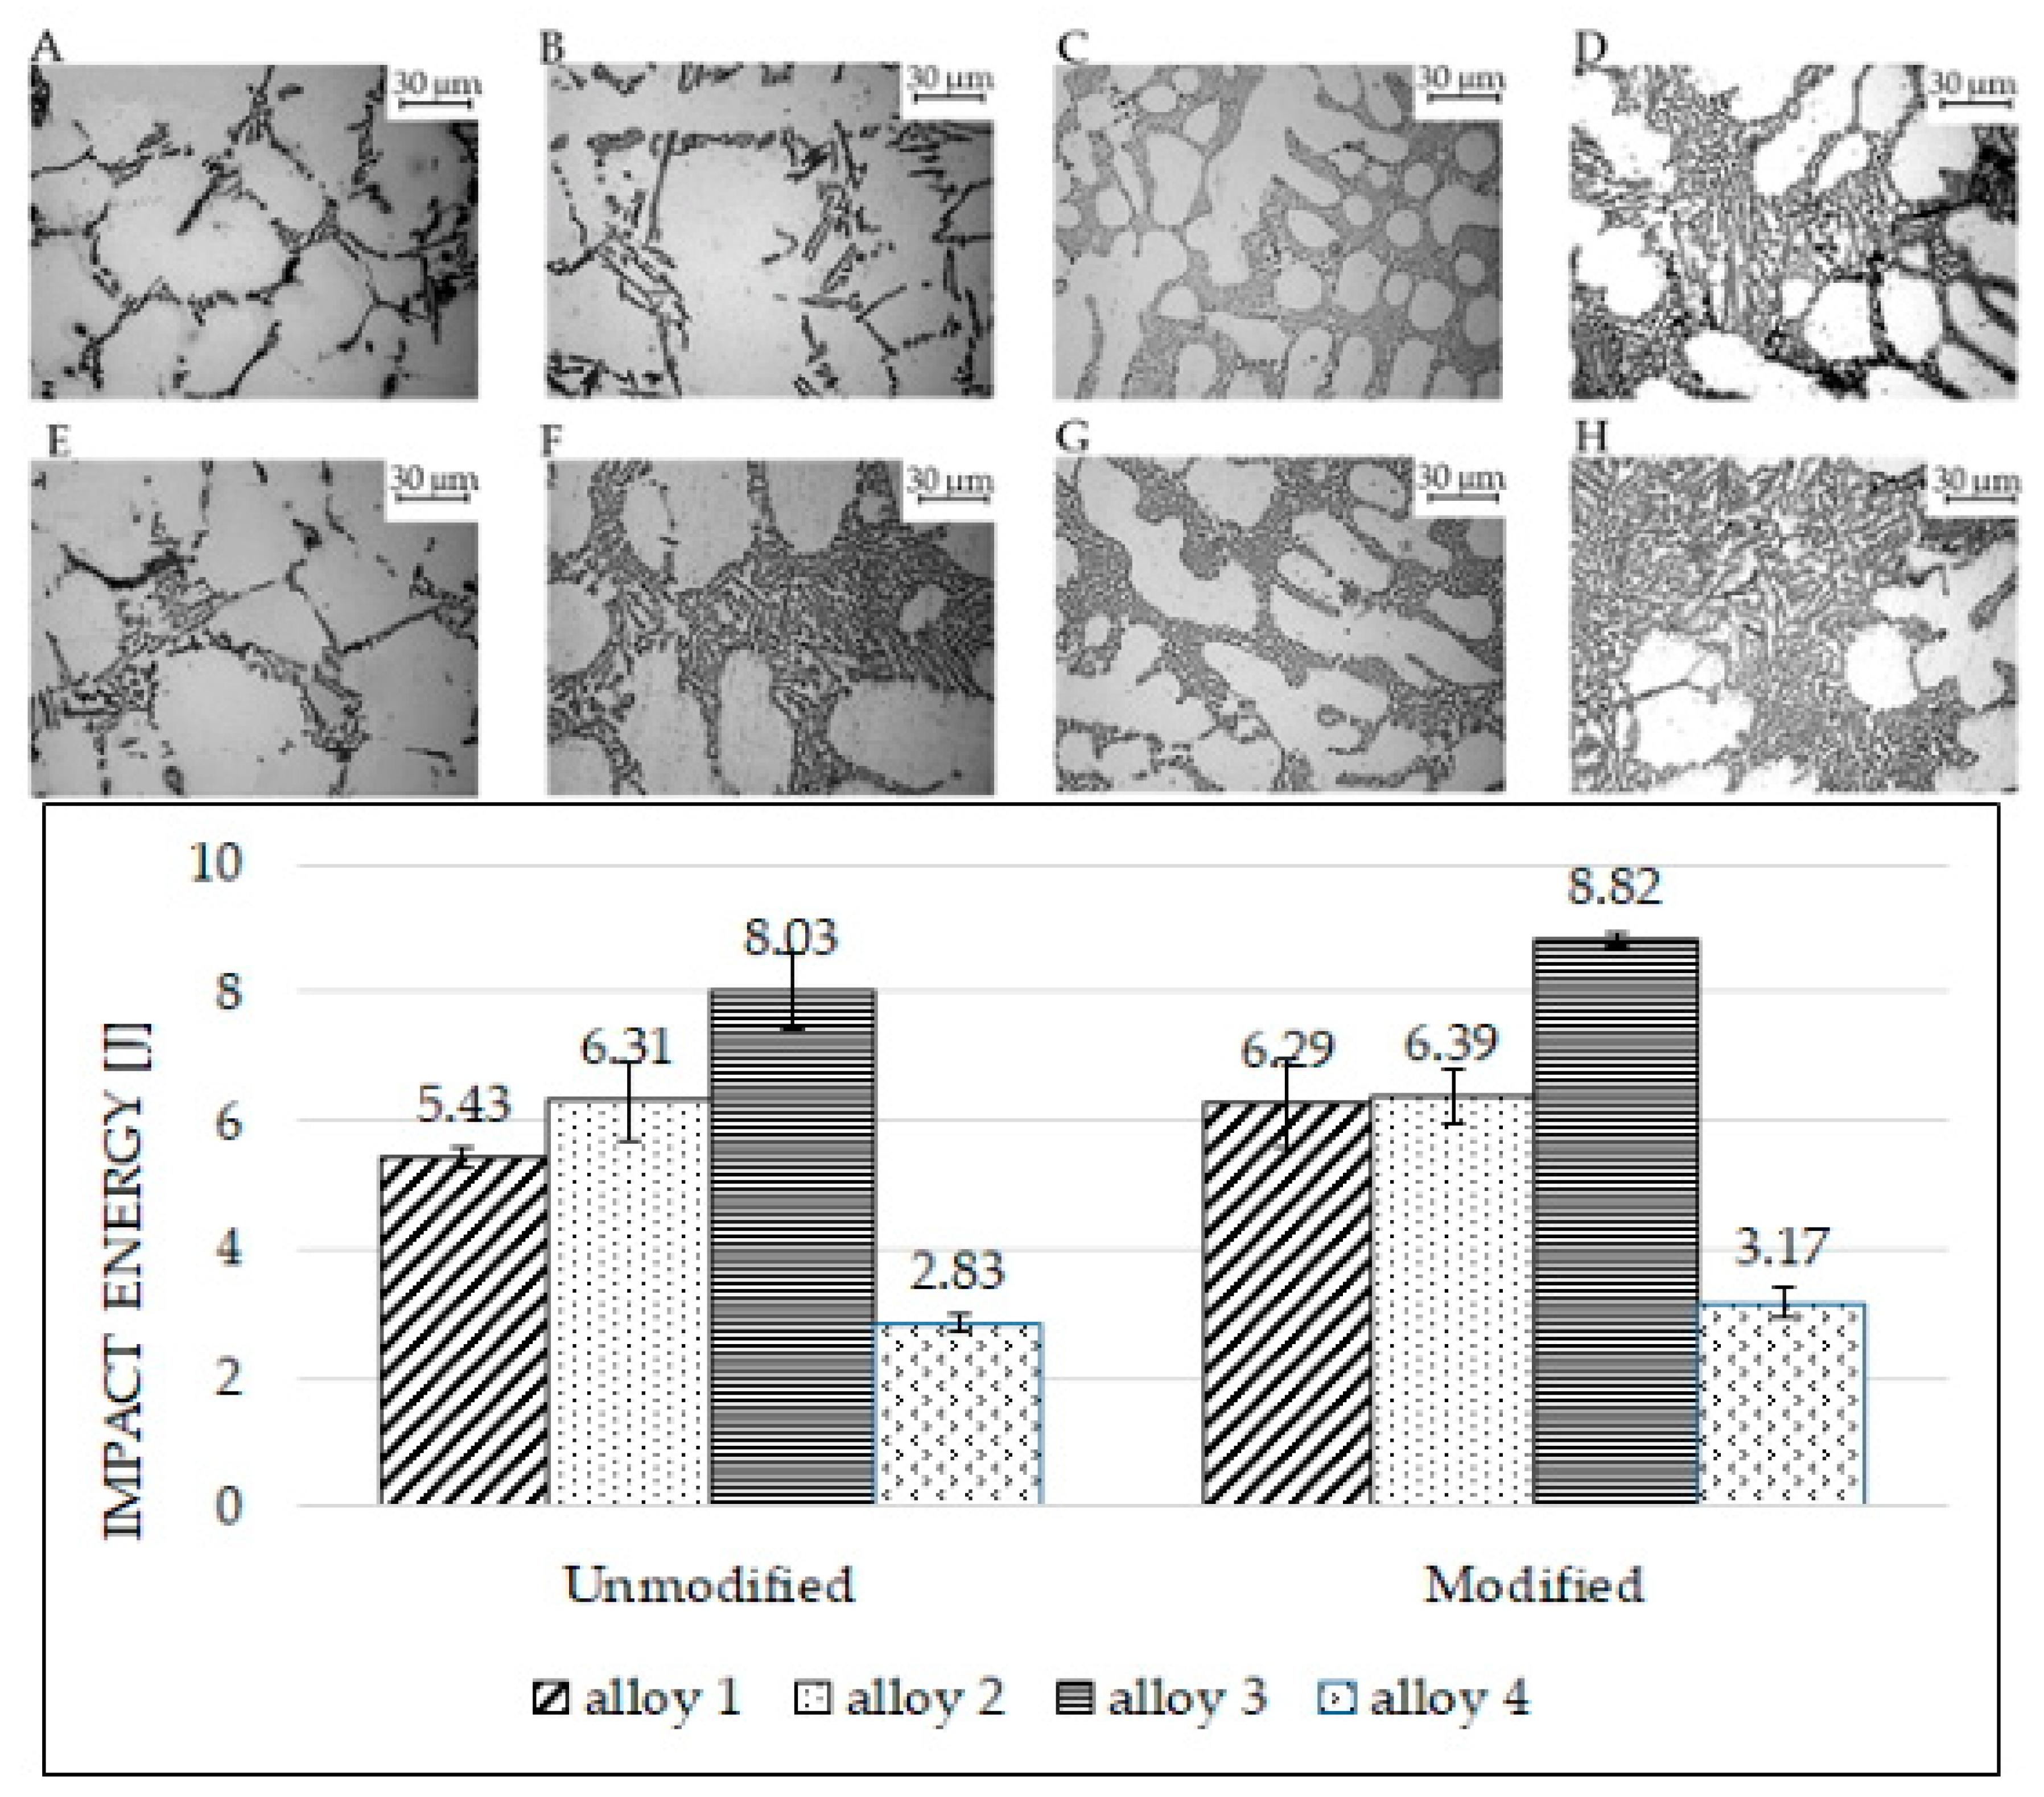
3.5. Impact Toughness

Figure 8 shows the microstructures and the impact toughness values for alloys in the unmodified (bars on the left side) and modified conditions (bars on the right side). After modification, silicon particles in alloy 1 still had an acicular shape (Figure 8E), despite the average particle size decreasing by almost 70% for the unmodified sample (Figure 8A). This is not surprising; in fact, the measured circularity reported in Figure 3 remains constant. This behavior may be associated with the presence of large polyhedral Fe-based intermetallics in the eutectic region. As previously brought up, the eutectic regions in alloys 1 and 4 are composed of eutectic silicon and various intermetallic phases. Since intermetallic phases typically have polyhedral shapes, those phases negatively impact toughness and fracture behavior. Hence, despite the eutectic modification, impact energy absorbed cannot increase significantly, as depicted in the bar chart of Figure 8: alloy 1 energy rose from 5.43 ± 0.16 to 6.29 ± 0.69 J, and that of alloy 4 increased from 2.83 ± 0.13 to 3.17 ± 0.22 J. As regards alloy 2, many bifilms were found in the modified specimens; these bifilms probably reduce the final absorbed energies. As reported in [25], the melt quality affects the effectiveness of Sr modification. In this sense, the presence of bifilm on the fracture surface indicated a quality of melt not sufficient to obtain the best performances in terms of modification.
Figure 9 documents the relations between intermetallics and silicon shape observed. In particular, Figure 9 refers to alloy 3. Some intermetallic phases seem to influence the eutectic silicon dimensions and shapes. In alloy 3, the decrease in silicon length away from intermetallic phases was noticeable, as observed in previous work too [32] (see Table 4). Despite that, an uneven modification of the eutectic silicon from a plate-like to a spherical-like shape was documented. As the eutectic spherical shape promotes ductile fracture [48], the uneven modification resulted in a slight increase in absorbed energy from the unmodified compared to the modified samples. On the other hand, it seems that the β-Fe acicular phases mainly detected in the modified alloy 3 (blue arrow in Figure 9) do not affect the silicon particle shapes, while, on the contrary, Fe plate-like intermetallics (red arrow in Figure 9) strongly affect the silicon modification in their surrounding areas.
Two surface fractures after impact tests are shown in Figure 10 and Figure 11. In particular, Figure 10 highlights the presence of bifilms in the bulk of the specimens. Alloy 4 resulted in low absorbed energy because of the extensive presence of oxide skins, while alloy 3 resulted cleaner and showed higher impact energy absorbed. In Figure 11, the SEM micrographs represent the different fracture behaviors detected in the tested specimens. Particularly, samples from alloys 3 and 4 are shown to highlight the different kinds of fractures detected. Specimens realized by alloy 4 fractured in a fragile manner, as noticeable by the cleavage facets and the rivers detected in Figure 11A. By contrast, samples realized by alloy 3 show a more ductile behavior, as depicted in Figure 11B, with a large number of dimples on the fracture surface. The fracture surfaces for alloy 1 are similar to alloy 4 while those of alloy 2 are similar to alloy 3.
On alloy 4 (and, similarly, on alloy 1), cleavage facets were detected, while dimples related to the modified eutectic silicon were observed only to a limited extent on the fracture surface [49]. Despite the increase in average eutectic size, circularity and solidity indicated an incomplete modification; the impact energy increased slightly. On alloy 3, the presence of fewer intermetallic phases positively affects the impact toughness. Silicon particles break, forming dimples, but the roundness of the silicon particles can be further improved.
Figure 12 shows the impact specimens’ edge for each composition studied. Particularly, cracks on the edge of the samples and absorbed energies were documented and related with the microstructural behaviors previously measured: SDAS, eutectic particle size, and intermetallic phases (α-Fe, β-Fe, and Fe-Mg).
As noticeable in Figure 12, the edges of the impact test specimen of alloy 1 show different features. In the unmodified alloy sample, many cracks were detected, while the modified alloy showed a limited number of defects. These defects are related to the specimen’s microstructure.
In alloy 1, after Sr modification, an SDAS reduction of 34%, a particle size reduction of about 40%, reduction through the fragmentation process of β-Fe intermetallic, and a slight increase in micro-hardness from 91.3 to 96 HV0.5 (average values) were documented. SDAS reduction affects the alloy’s mechanical resistance and the particle size reduction influences the rupture behavior by fostering the ductile fracture while the modification occurred. In this sense, the modification, along with the β-Fe fragmentation, seems to limit the presence of cracks. Consequently, the average absorbed energy increases.
As regards alloy 2, a similar trend to alloy 1 was highlighted. SDAS decreased by 16%, the eutectic particle size by 70%, and the Fe-Mg intermetallic-occupied area was halved after Sr addition. The impact specimen’s edge resulted with few cracks in the unmodified composition, while no cracks were detected in the samples made with modified alloy. In alloy 3, decreases in SDAS (8%) and the eutectic particle size (of 86%) were noticed, but the intermetallic phase-occupied areas remained constant. As β-Fe promotes the fragile fracture, its short fragmentation probably affects the absorbed energy, hindering its increase. Cracks detected in the modified and unmodified specimens are similar in number and extent. Since this composition has few alloying elements, the intermetallic phases have less influence on impact energy in both cases.
Alloy 4 shows high SDAS reduction (16%) and high particle size reduction (85%). In this alloy, an increase in the occupied area of α-Fe phases was further noticed. Cracks were detected in the specimen made using the unmodified alloy, and despite the cracks reduction in the sample made using the modified alloy, the energy remains similar due to the presence of oxide skins (Figure 10A).

4. Conclusions

In this paper, the effect of the master alloy AlSr10 was studied in different Al-Si systems. After the evaluations of SDAS, image analysis, micro-hardness, and impact tests, it is possible to conclude the following results:
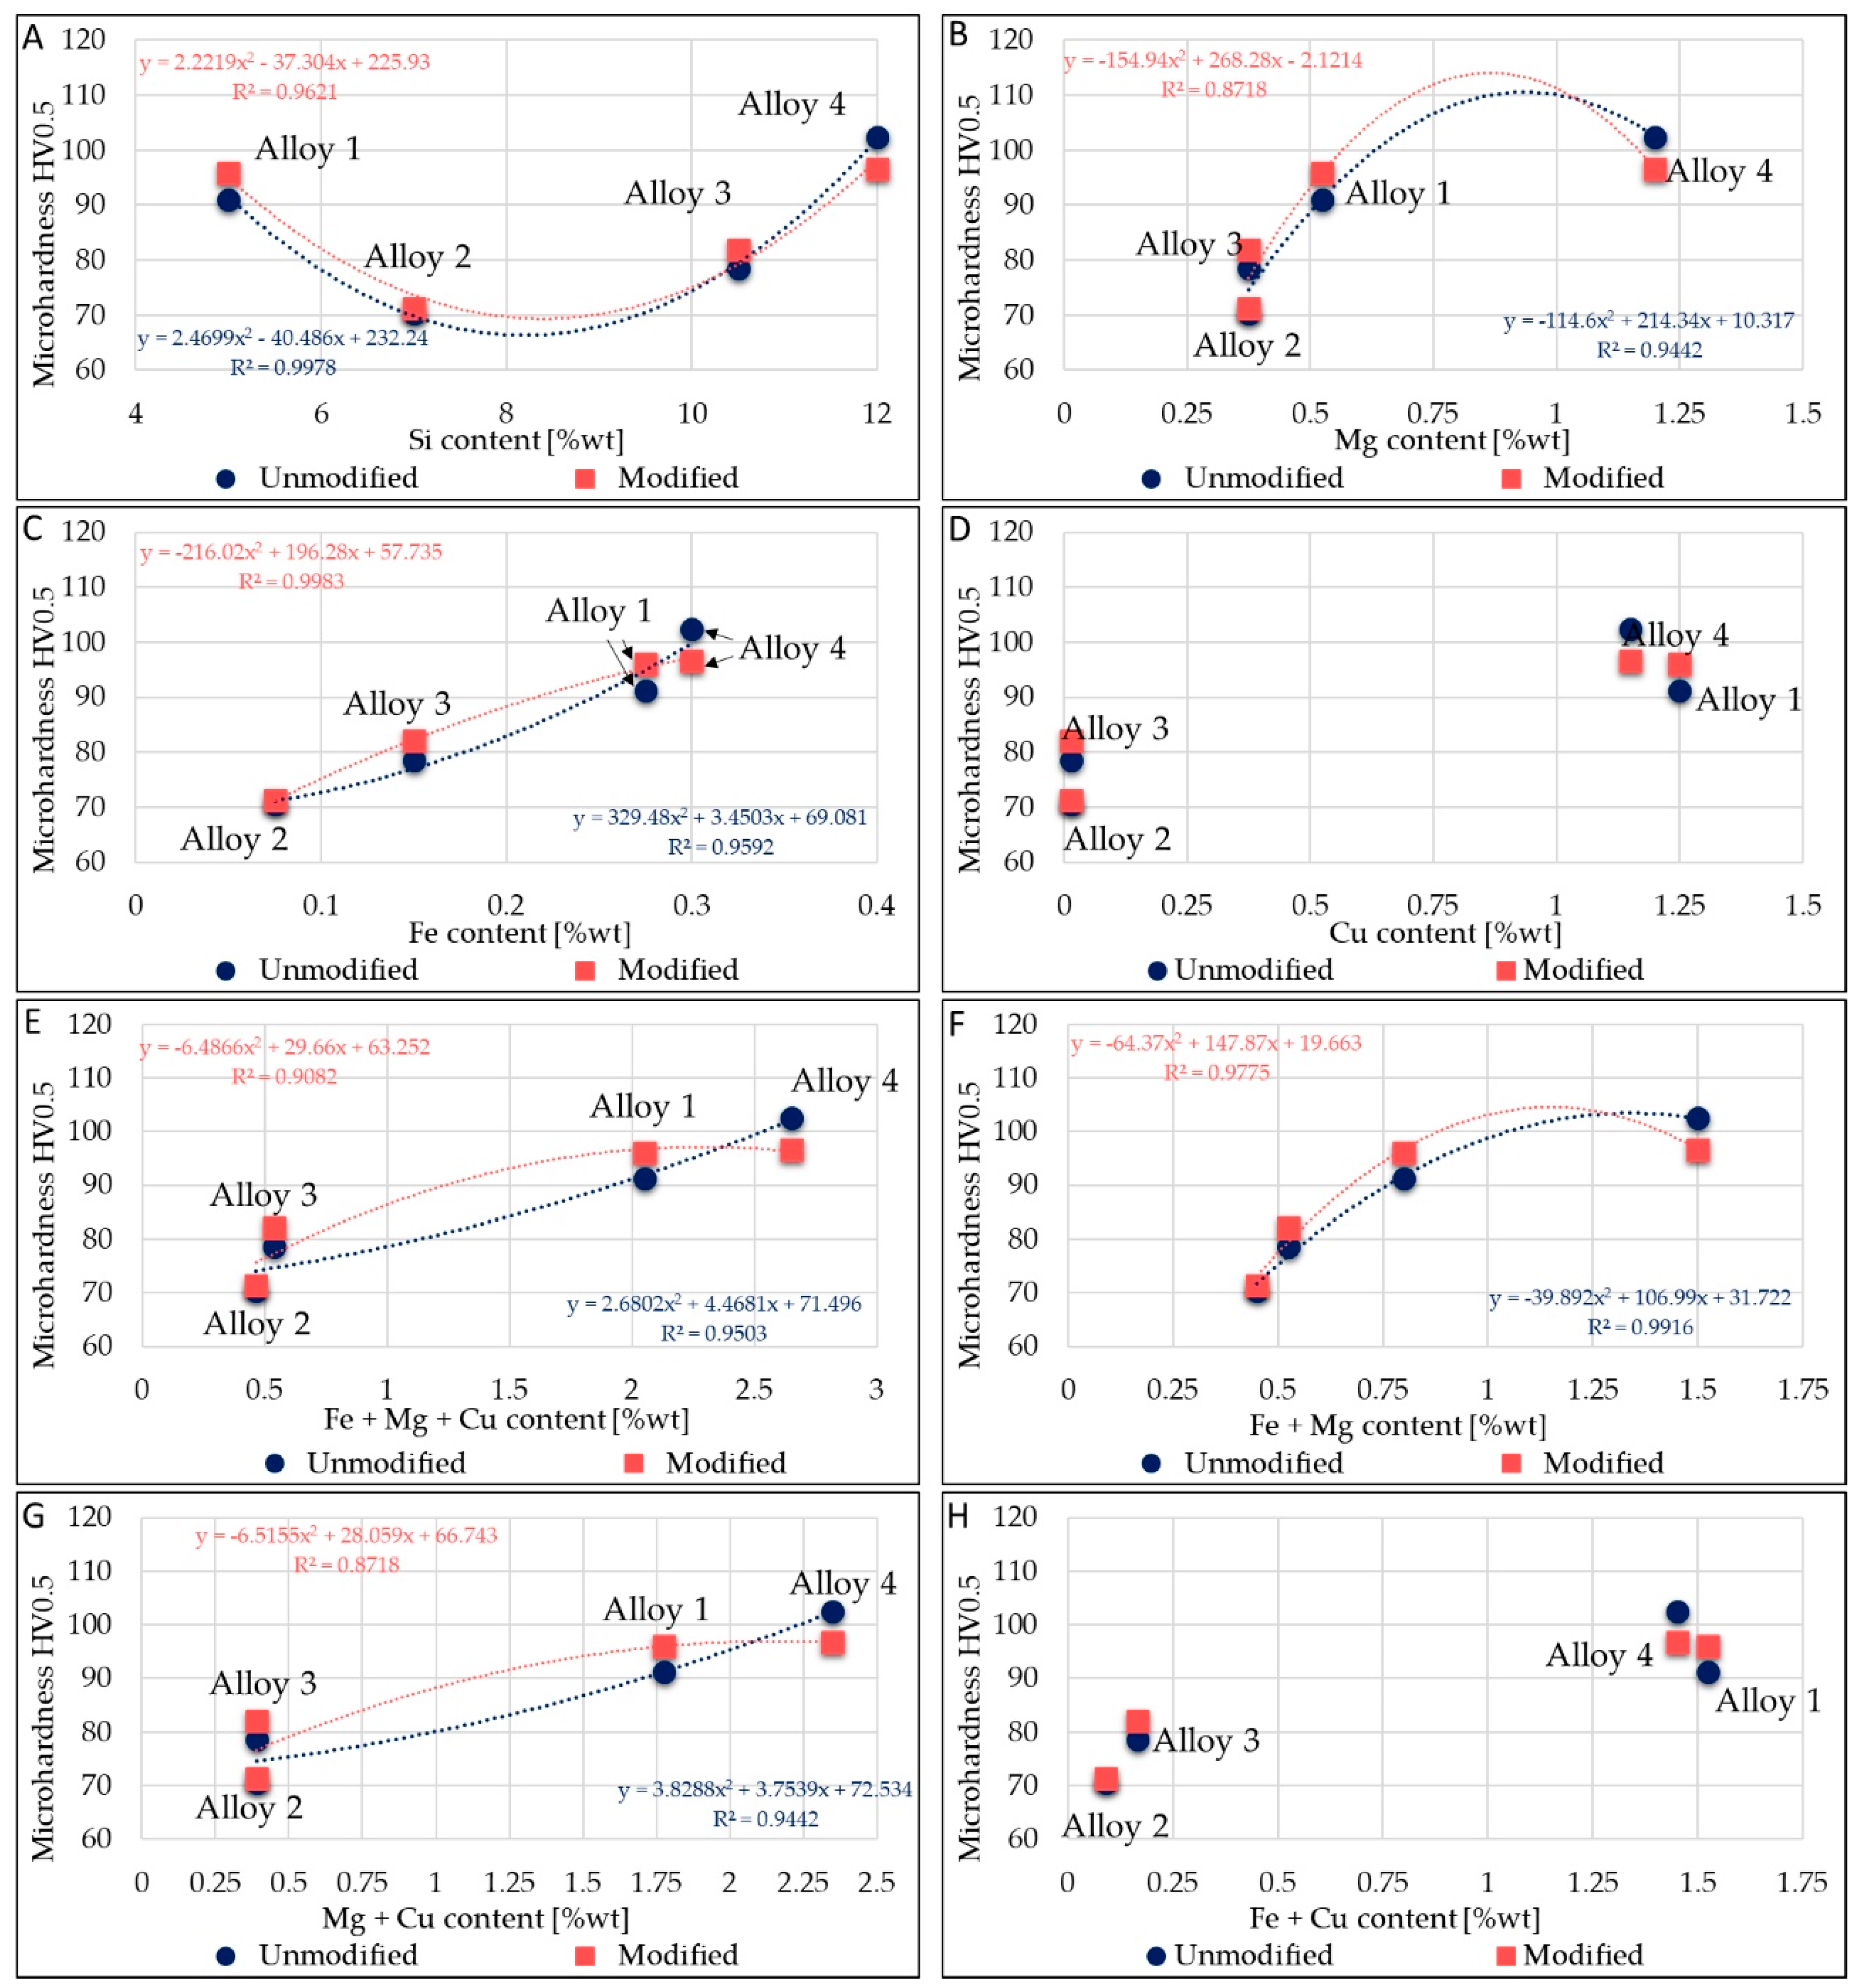
  • As regards micro-hardness, the alloys containing higher alloying element contents resulted in higher micro-hardness values in both cases with and without Sr addition. Alloy 1 and alloy 4 had the largest intermetallic phases, which caused an increase in mechanical properties. The influence of alloying elements was further clarified in Figure 4: as Fe or Mg increases, the micro-hardness increases with a parabolic trend. Although the micro-hardness seems less affected by Sr addition, further experiments or nano-indentation are required to clarify the effect of Sr on samples’ hardness.
  • The SDAS decreases in all the alloys as a consequence of Sr addition. The final SDAS values appear similar for alloys having similar Si contents.
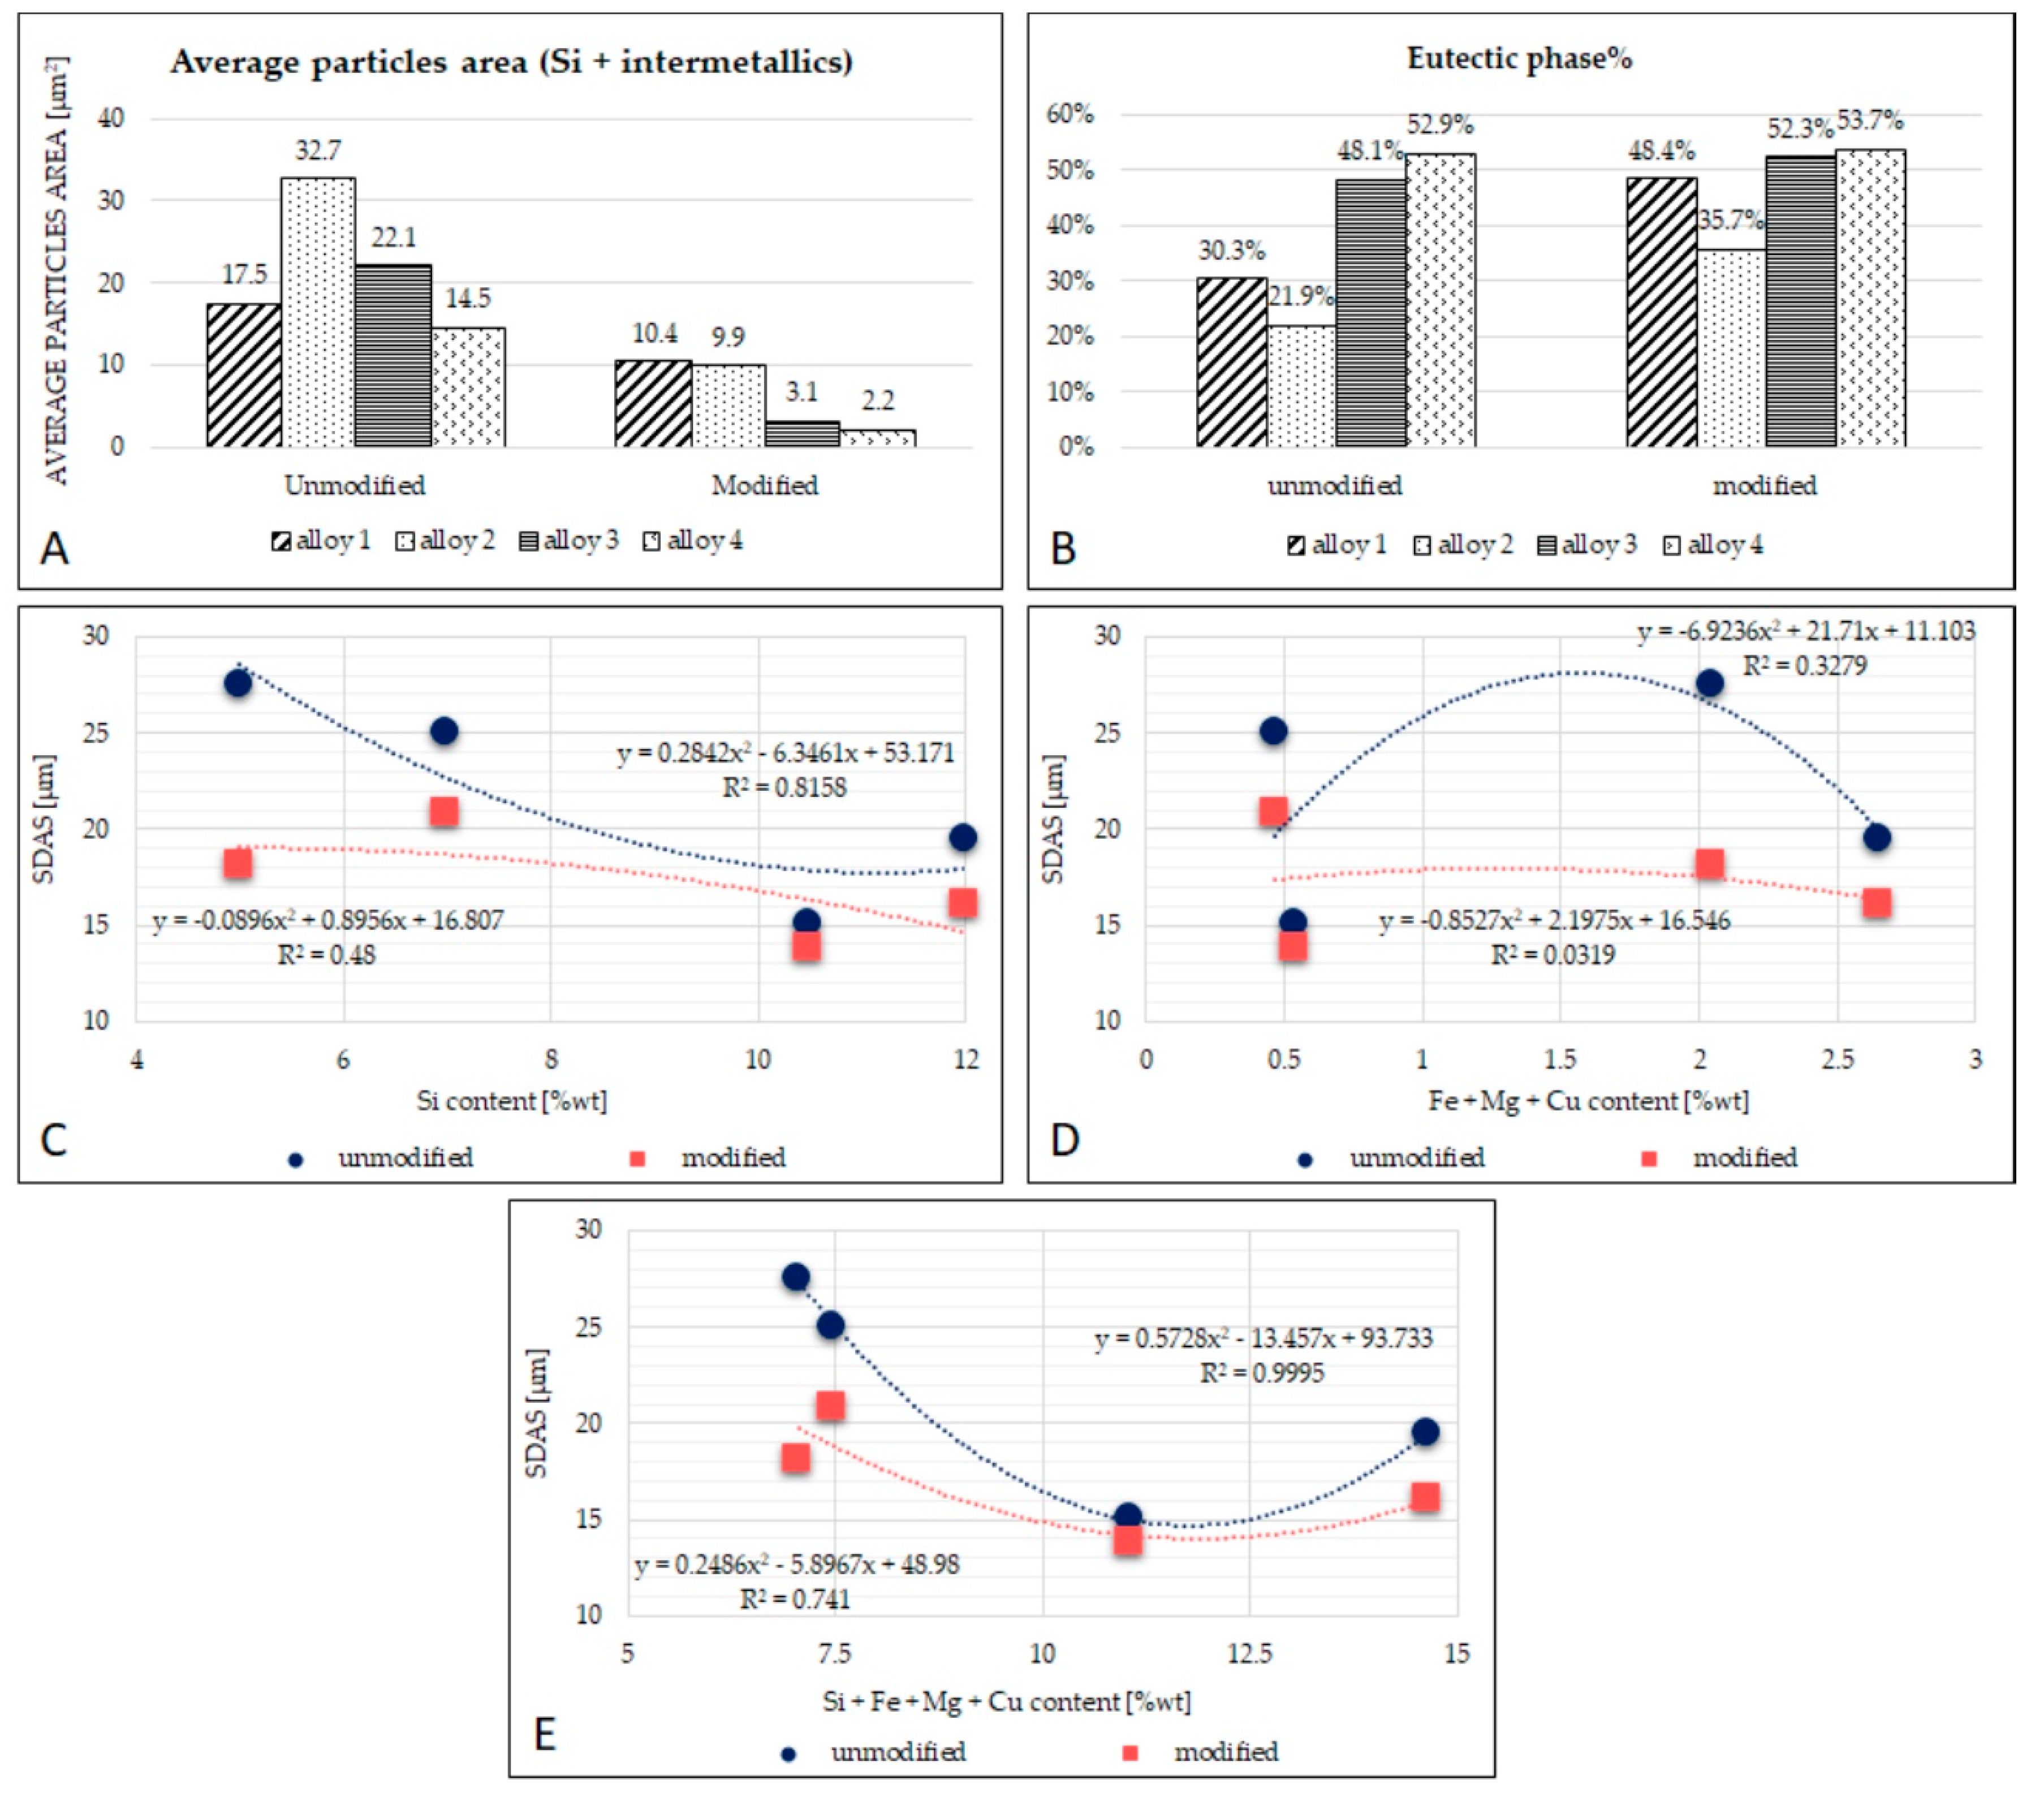
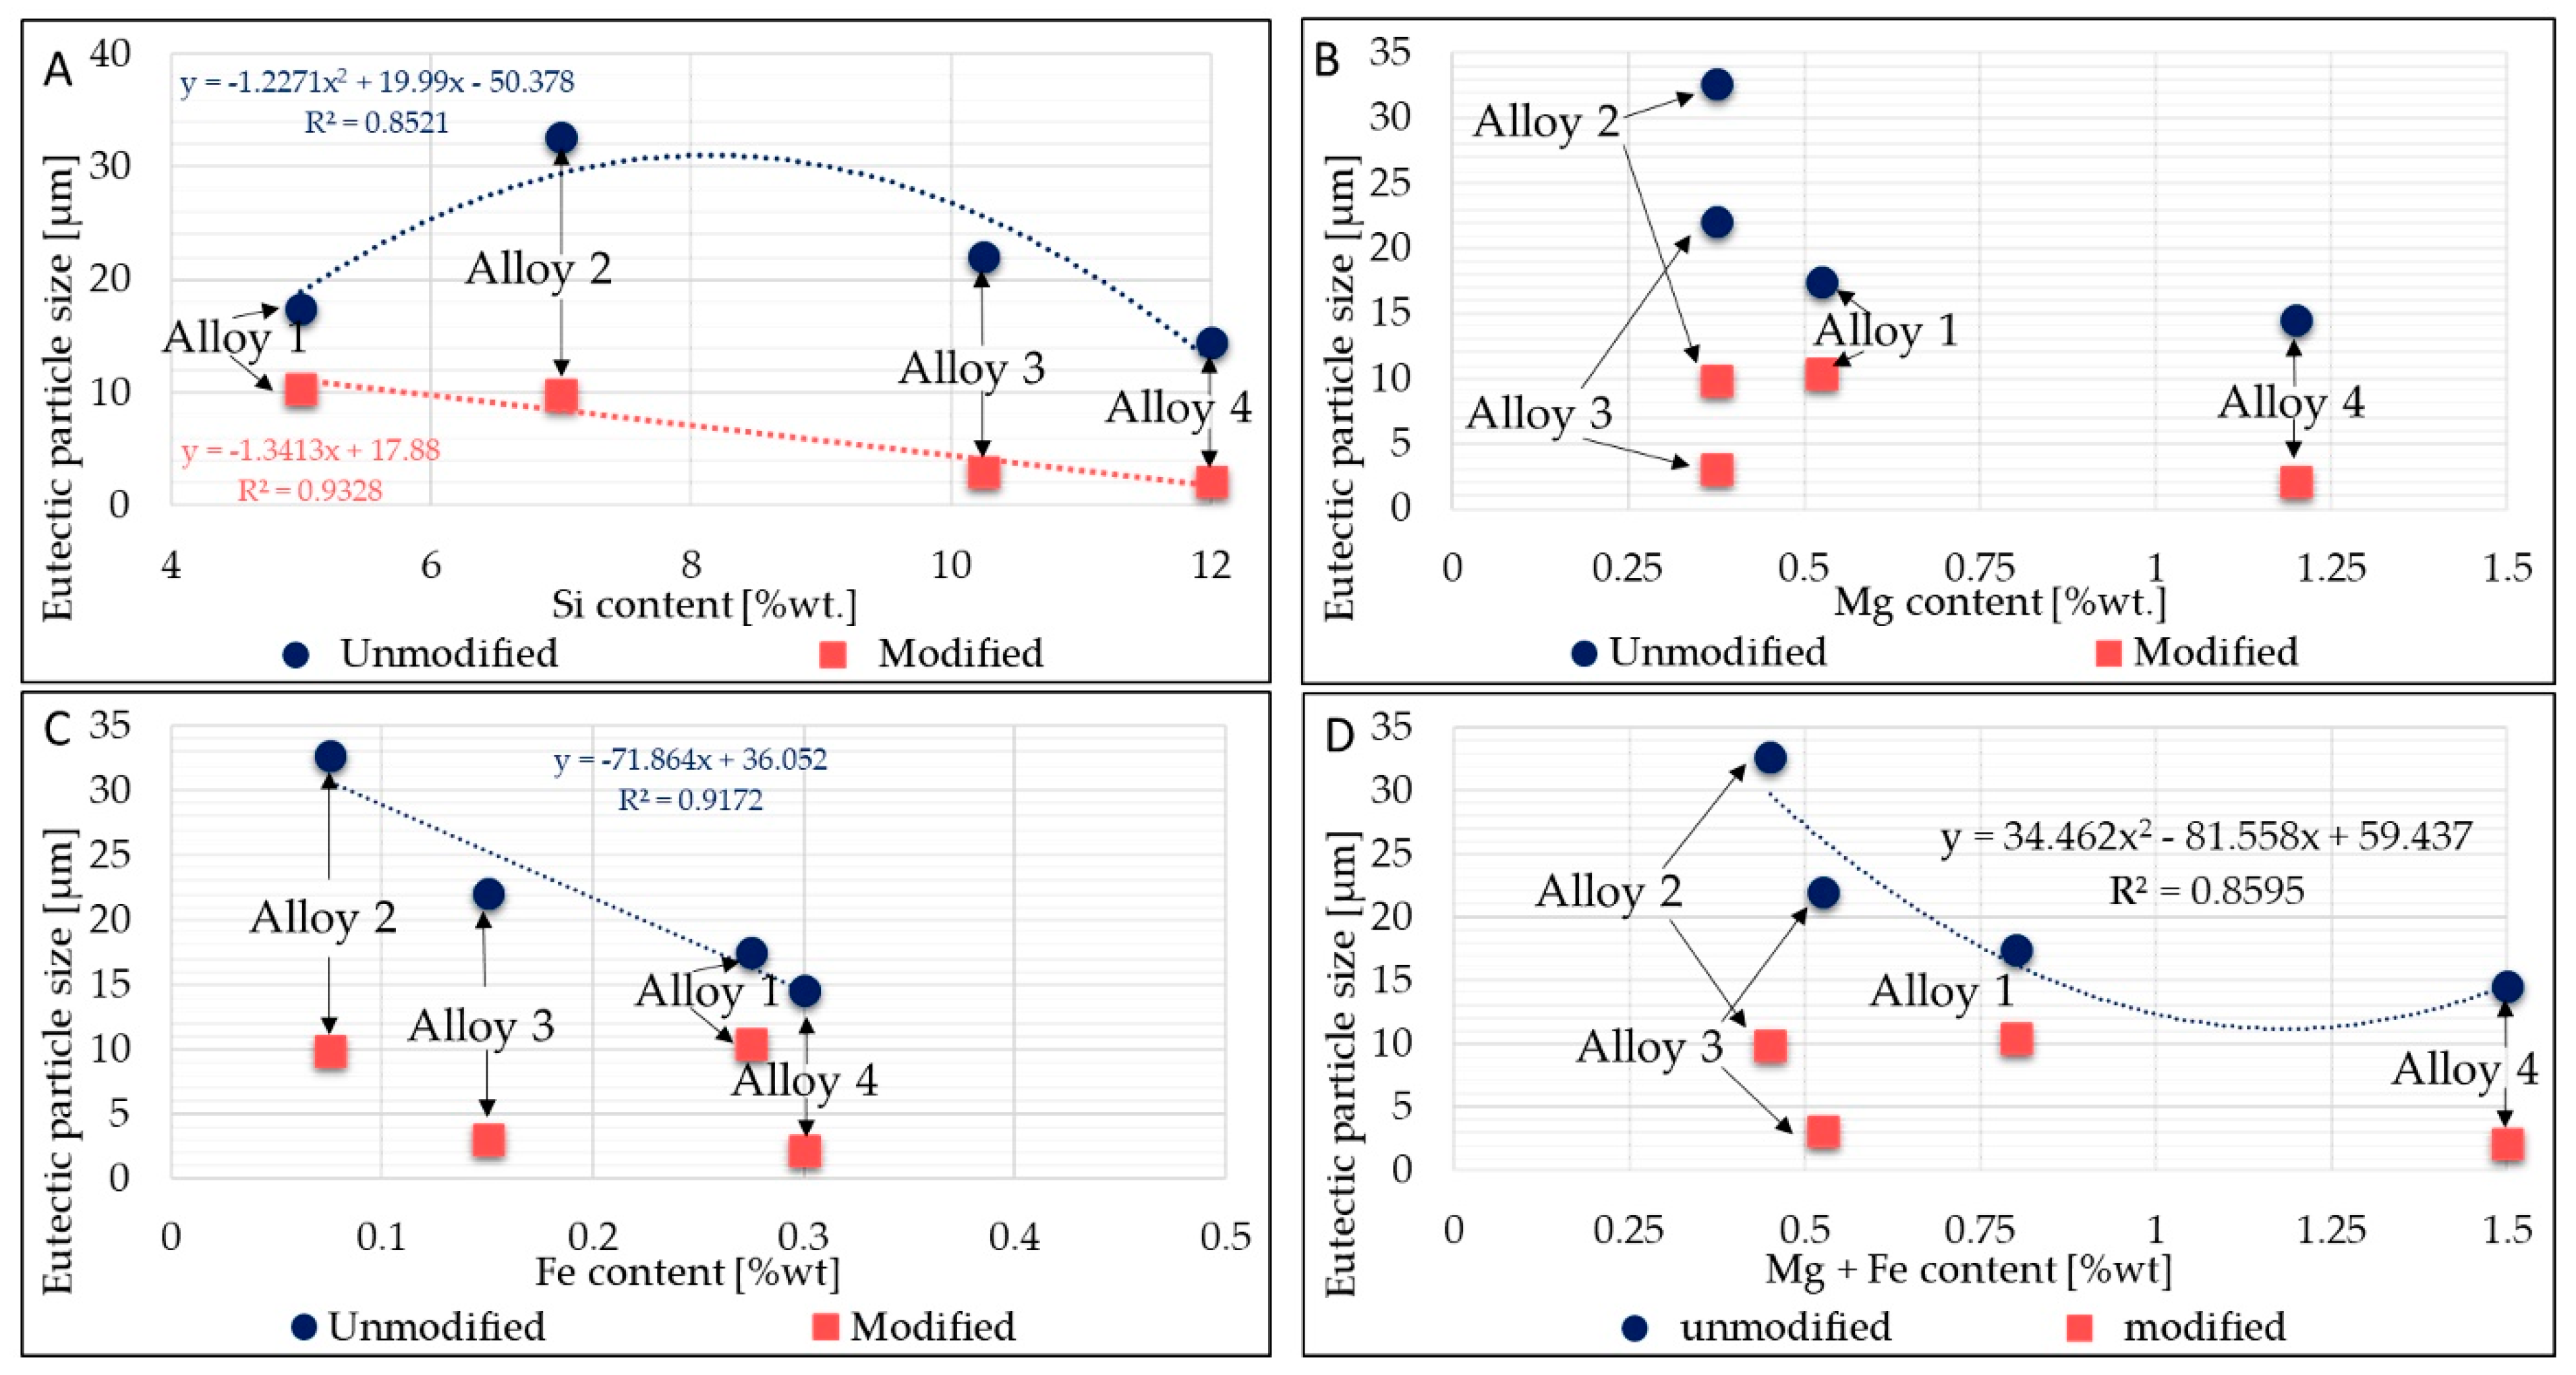
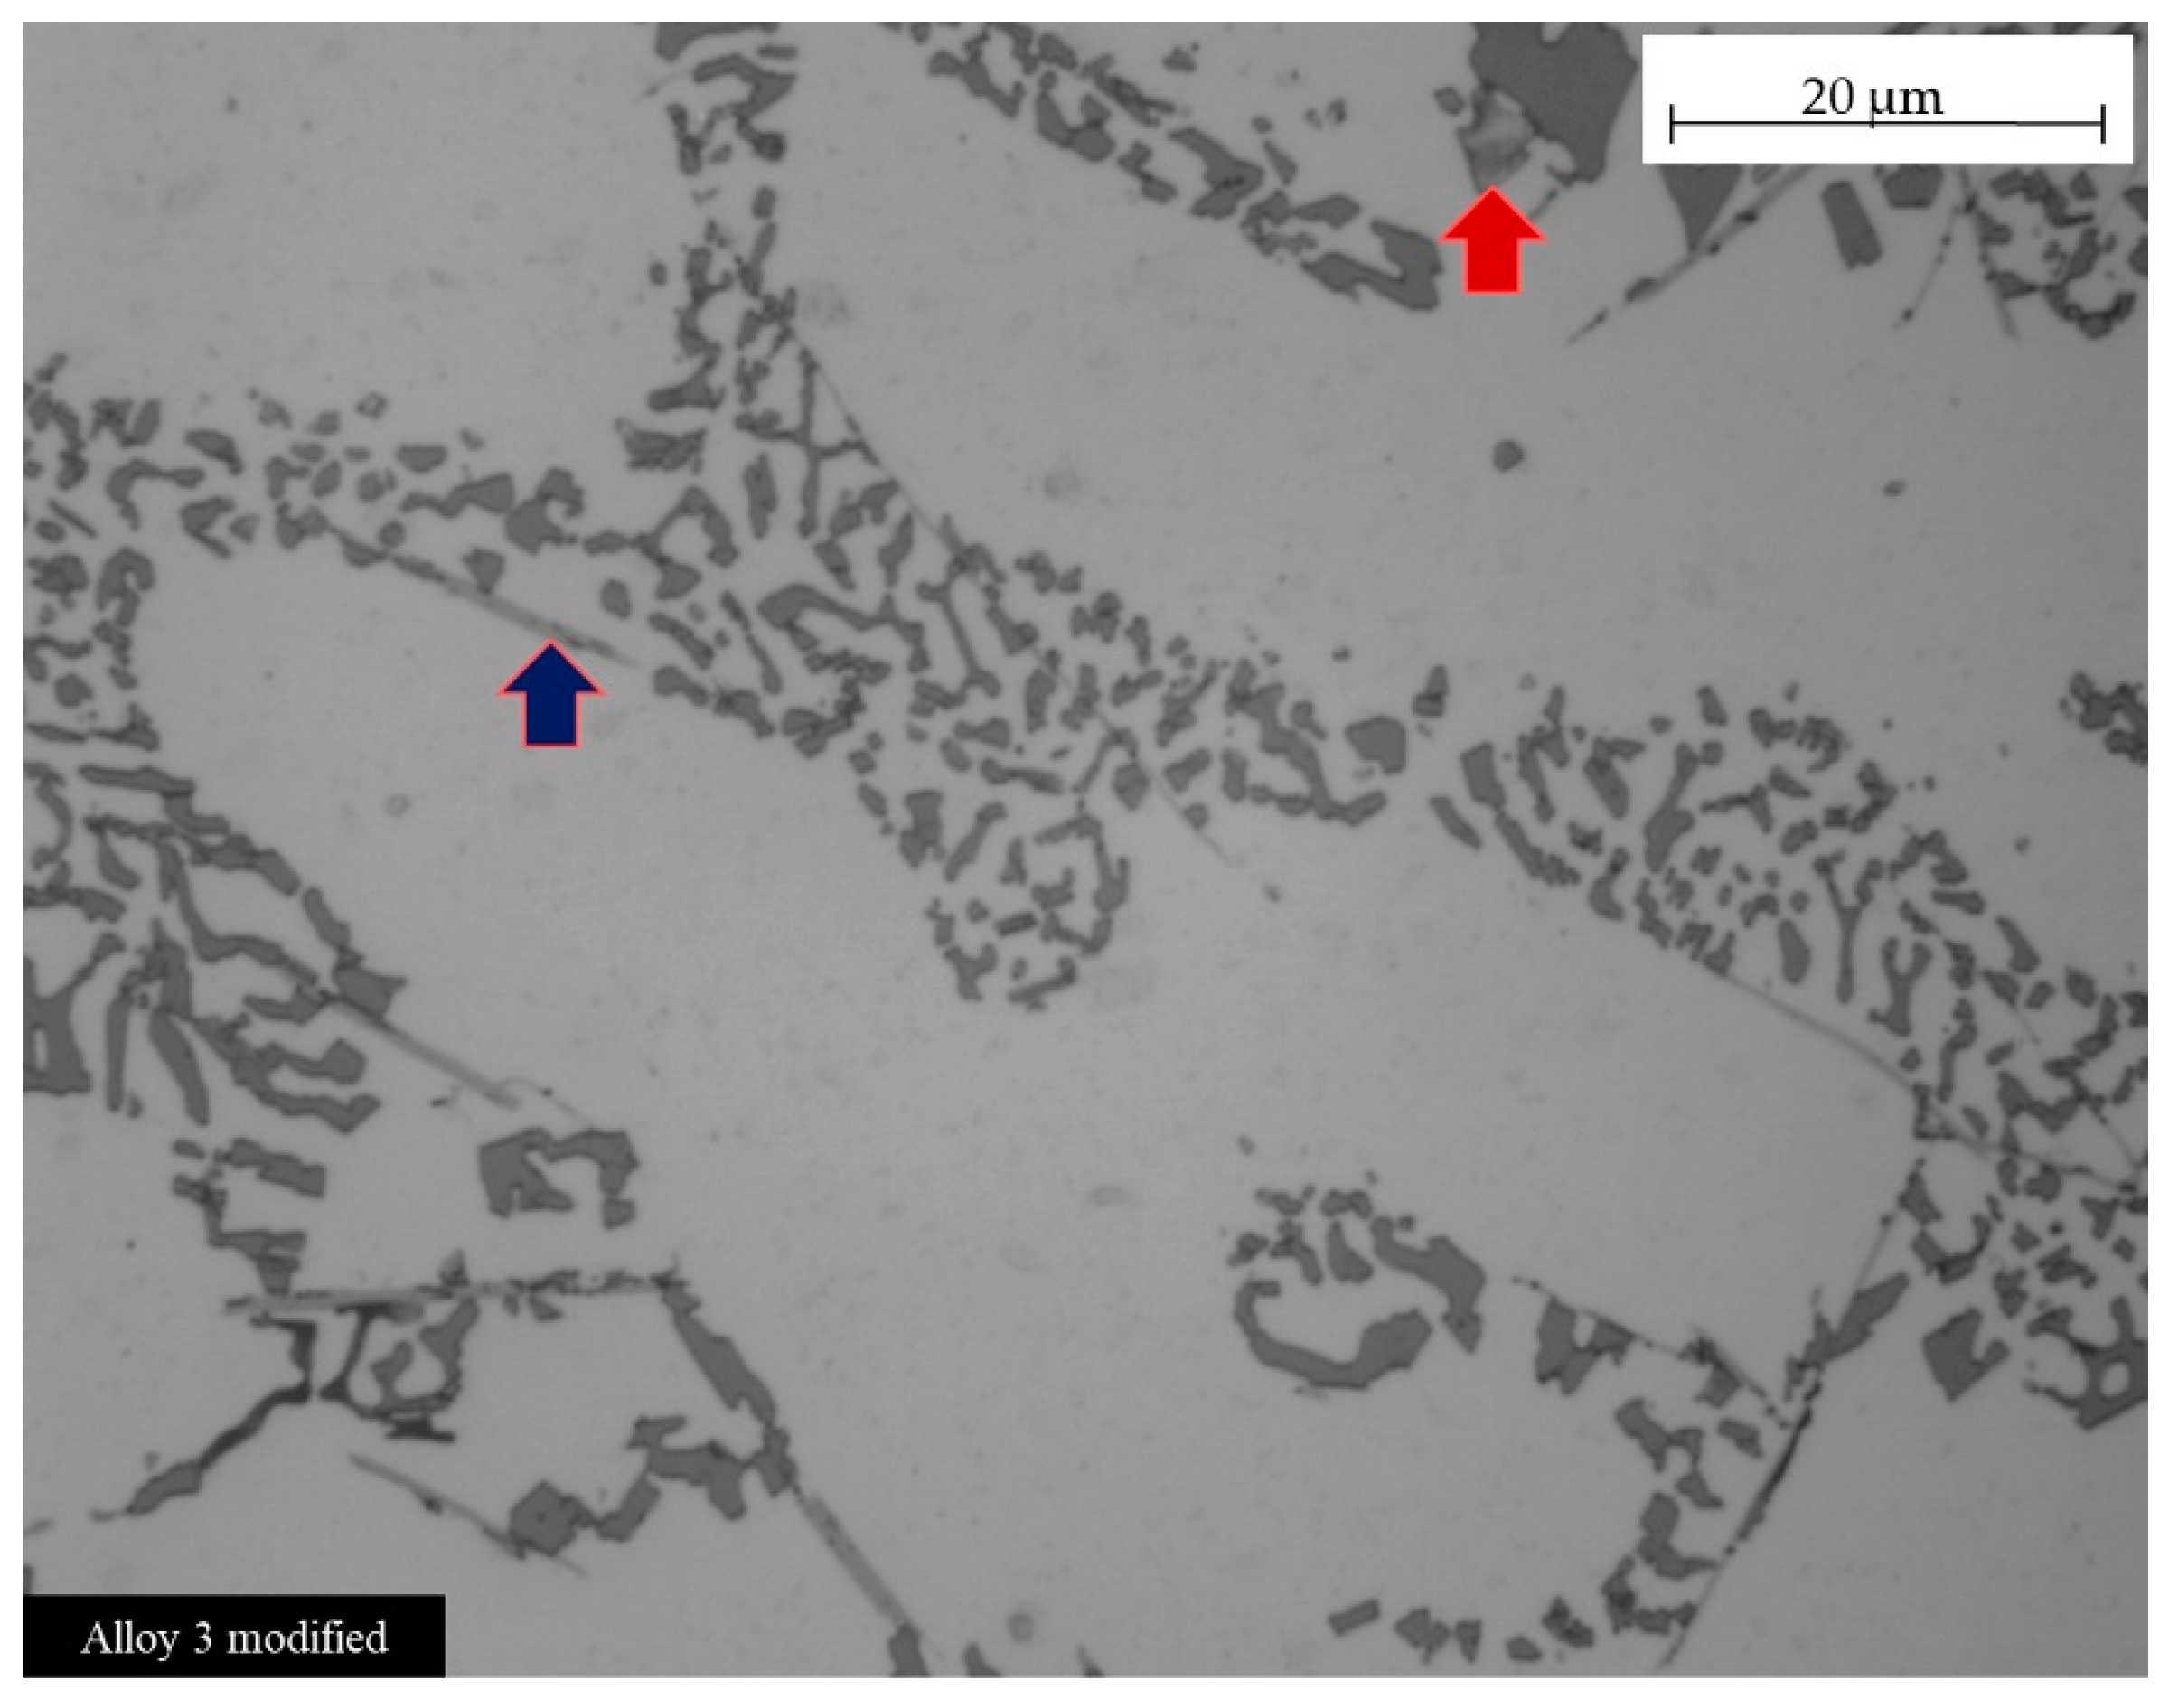
  • The eutectic particle size results in differences in the unmodified state for all alloys. Despite that, after the modification, particle size converges to similar values both in the alloys with less silicon content (alloys 1 and 2, where particle size is almost 10 µm) and in the alloys with the high silicon content (alloys 3 and 4, where particle size is almost 3 µm). This behavior seems to indicate that alloys converge to a similar response even if silicon content is similar. Despite that, a correlation was observed between the silicon particle size and the intermetallics in the eutectic phase. Moreover, in Figure 5, the graphs showed the impact of Fe and Mg on the eutectic particle size, highlighting that as the average content of Mg and Fe increases, the average particle size decreases. However, some intermetallic phases may locally change this trend: in fact, even though the average size decreases, it may change locally depending on the intermetallics present in the surrounding area, as shown in Figure 7 and Figure 9. A decrease in the average occupied area of β-Fe after Sr addition was observed, while α-Fe was affected in an uneven manner, and there was increase in the area occupied in the alloys having low Mn content (alloy 2 and alloy 3).
  • The eutectic phase percentage increased in all the alloys after the introduction of the master alloy AlSr10. The hypoeutectic alloys 1 and 2, with low Si contents, reached a similar percentage, precisely as in the alloys 3 and 4 with high silicon contents. Considering the specific casting process performed in this work, a mathematical relation between SDAS values and average alloying elements present in the alloys seems to exist.
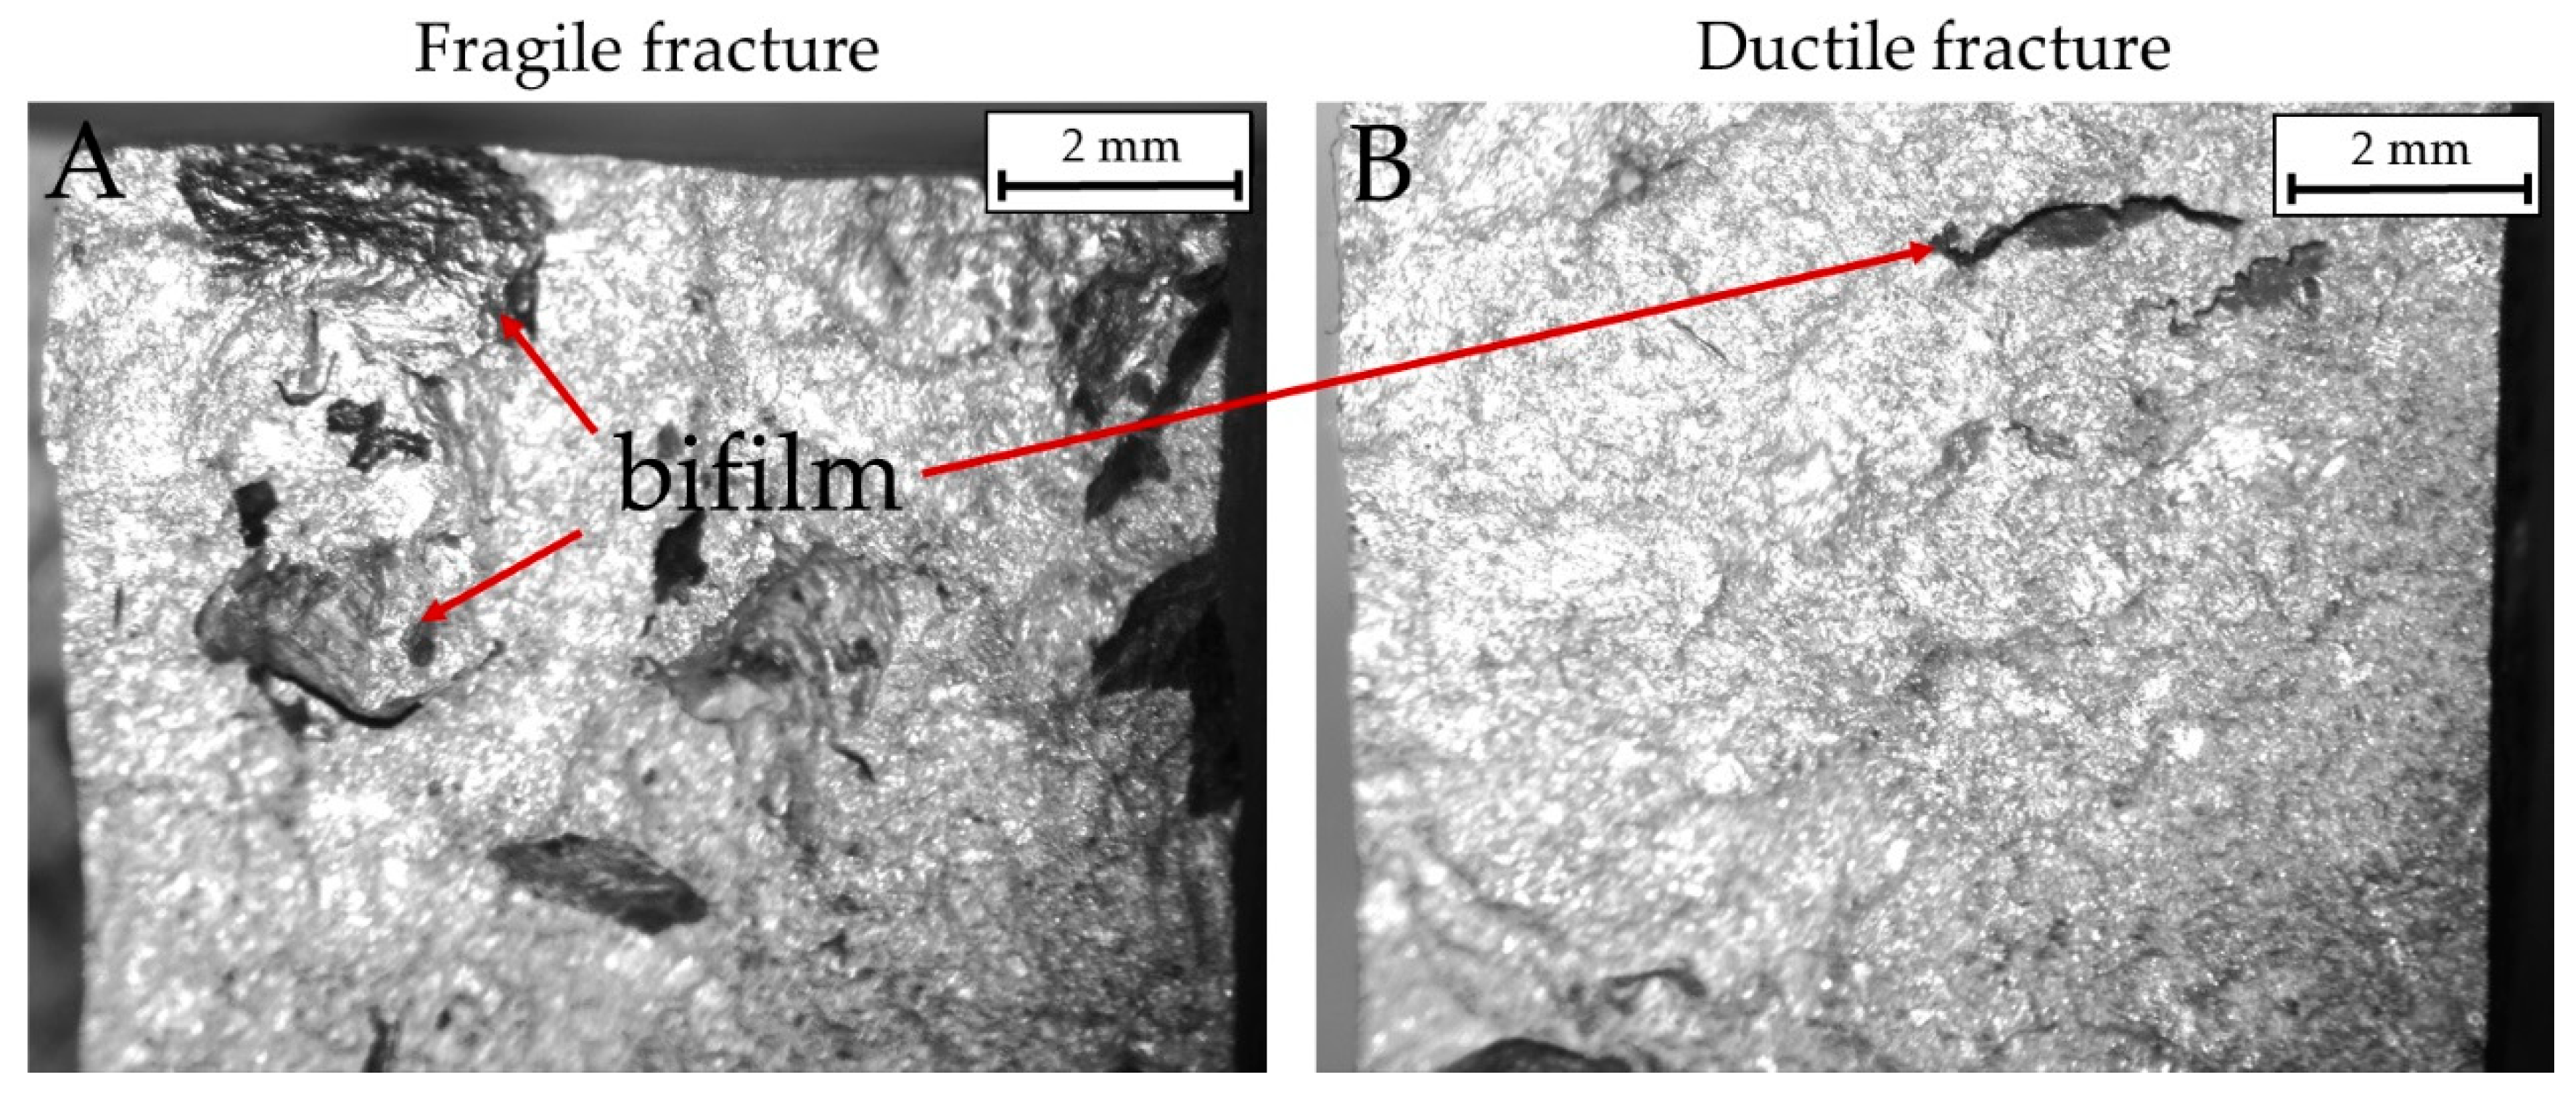
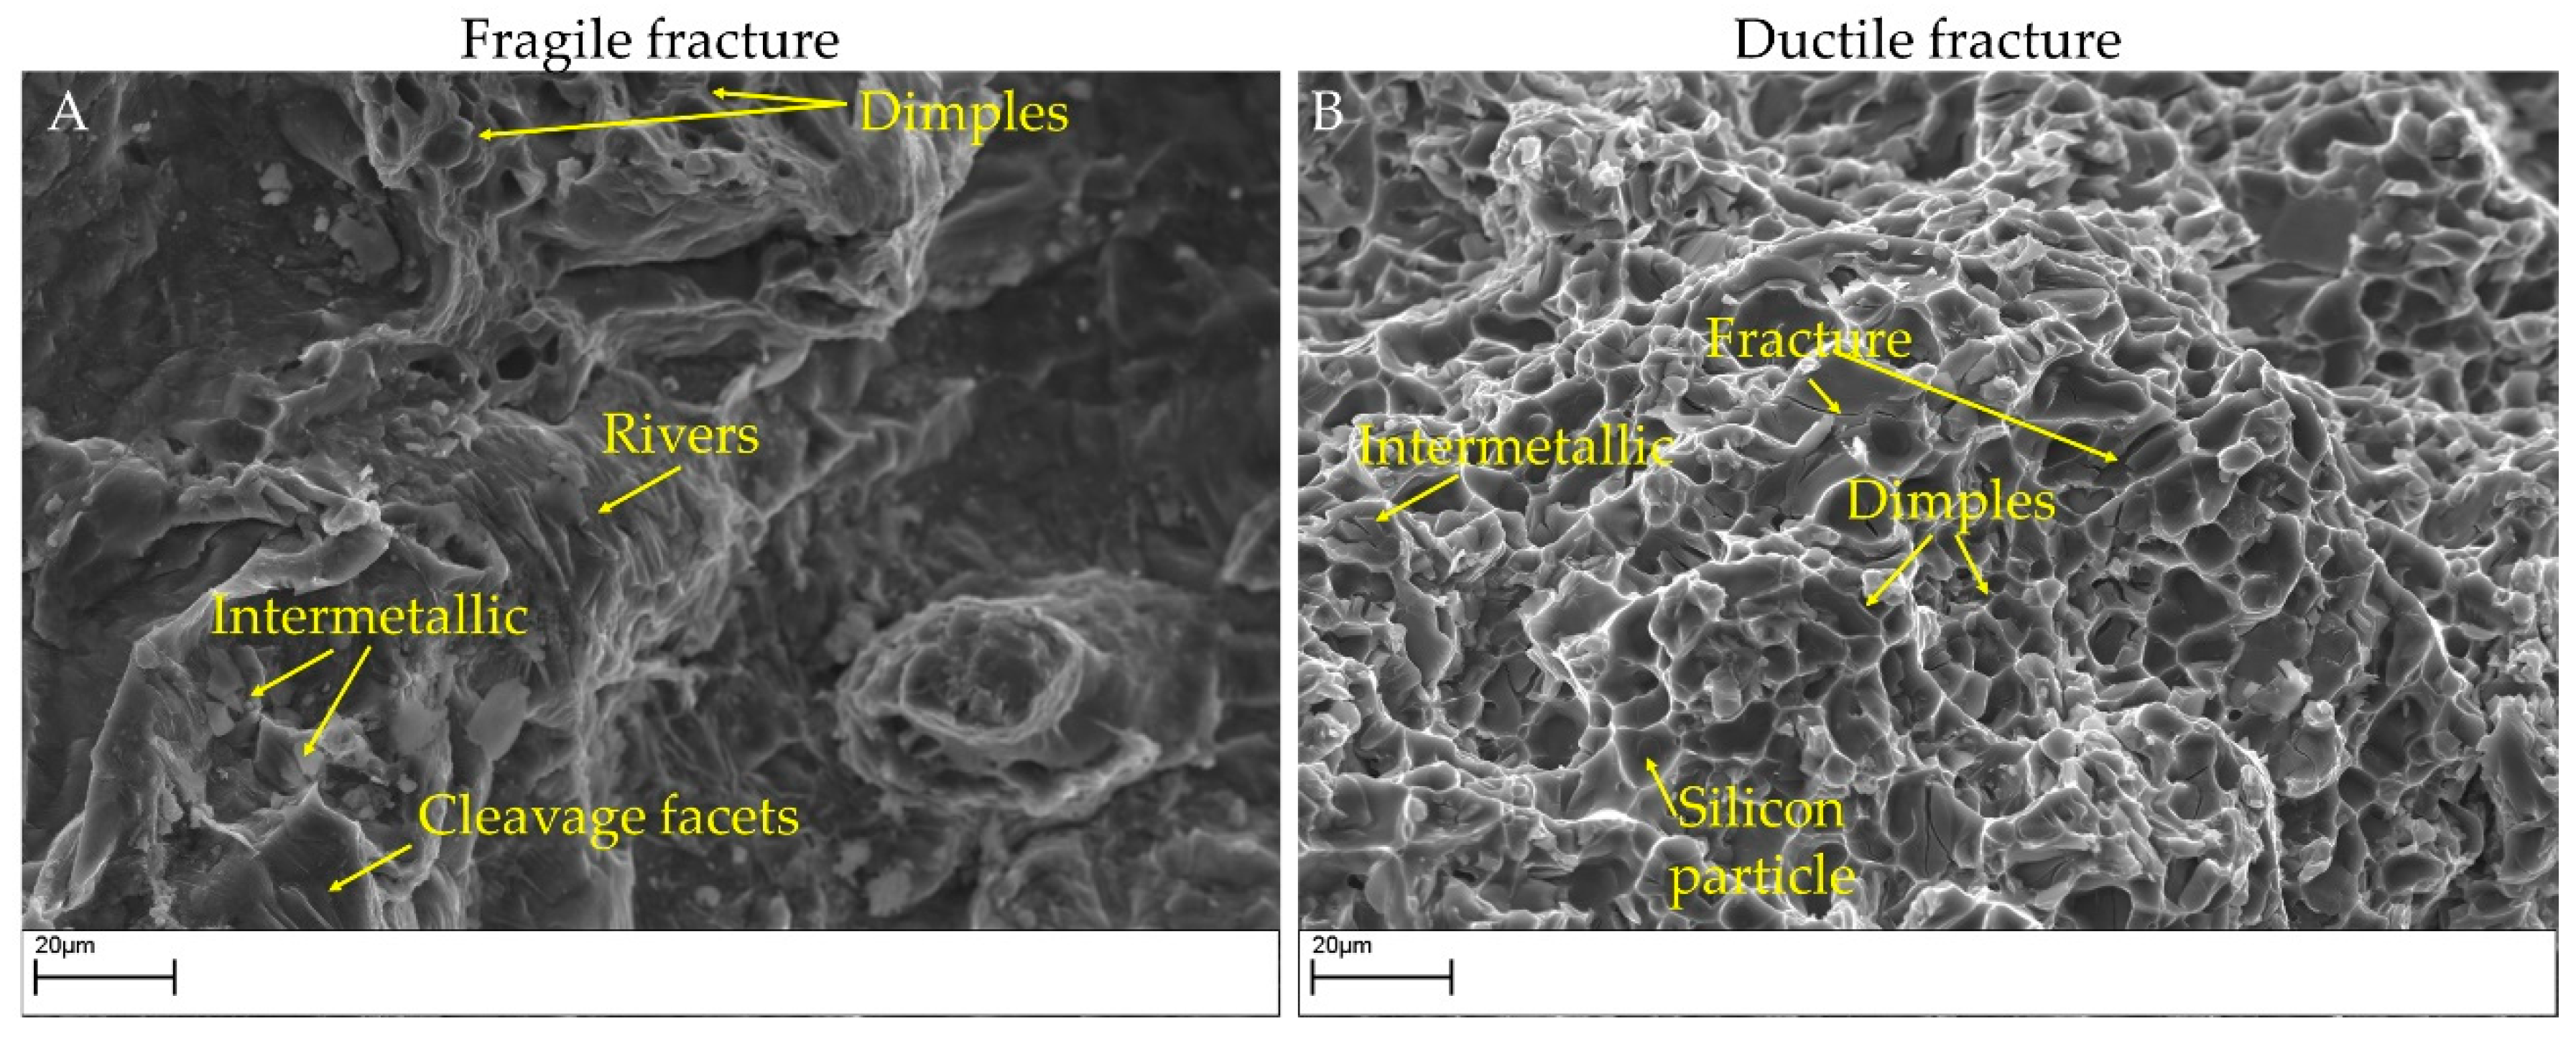
  • The impact energies were strongly related to silicon content, intermetallic phases, and melt quality. The increase in alloying element tenor appears to reduce the absorbed energy, while the addition of the master alloy AlSr10 causes a slight increase. The high tenor of Fe-based fragile intermetallics caused the fragile preferential fracture in the alloy bulk, as noticed in alloy 4 (Figure 11A). Indeed, many intermetallics prevent the ductile fracture fostered by the rounded silicon particles, causing low absorbed energies. Alloy 3 absorbed the highest energy, thanks to both the low amount of alloying elements and the round-shaped Silicon, showing a ductile fracture surface (Figure 11B).
  • The manual casting process affects the casting quality. The presence of bifilm in the microstructures harms the impact properties for each alloy, especially for alloys 2 and 4 (Figure 10A).
This study highlights Sr’s effect on Al-Si alloys having different Si contents; the intermetallic phases appear affected by Sr, especially the detrimental β-Fe. Other intermetallic phases, for instance, Mg2Si, give a contradictory response in terms of Sr effect and need to be further studied.
Further investigations will be performed by increasing AlSr content to optimize the modification process. Si’s circularity and solidity have to be taken into account as the leading parameters for optimizing microstructural and mechanical properties.

Author Contributions

Conceptualization, E.F. and M.R.; methodology, E.F.; formal analysis, E.F. and F.S.G.; investigation, E.F. and F.S.G.; data curation, E.F. and F.S.G.; writing—original draft preparation, E.F. and F.S.G.; writing—review and editing, M.R.; supervision, M.R. All authors have read and agreed to the published version of the manuscript.

Funding

This research received no external funding.

Conflicts of Interest

The authors declare no conflict of interest.

References

  1. Rana, R.S.; Purohit, R.; Das, S. Reviews on the Influences of Alloying elements on the Microstructure and Mechanical Properties of Aluminum Alloys and Aluminum Alloy Composites. Int. J. Sci. Res. Publ. 2012, 2, 6. [Google Scholar]
  2. Amirkhanlou, S.; Ji, S. Casting lightweight stiff aluminum alloys: A review. Crit. Rev. Solid State Mater. Sci. 2020, 45, 3. [Google Scholar] [CrossRef]
  3. Vijayakumar, M.D.; Dhinakaran, D.; Sathish, T.; Muthu, G.; Bupathiram, P.M. Experimental study of chemical composition of aluminium alloys. Mater. Today Proc. 2020. [Google Scholar] [CrossRef]
  4. Stojanovic, B.; Bukvic, M.; Epler, I. Application of Aluminum and Aluminum Alloys. Appl. Eng. Lett. 2018, 3, 52–62. [Google Scholar] [CrossRef]
  5. Stojanović, B.; Ivanović, L. Application of aluminium hybrid composites in automotive industry. Teh. Vjesn. 2015, 22, 247–251. [Google Scholar] [CrossRef] [Green Version]
  6. Peter, I.; Fracchia, E.; Canale, I.; Maiorano, R. Incremental sheet forming for prototyping automotive modules. Procedia Manuf. 2019, 32, 50–58. [Google Scholar] [CrossRef]
  7. Hertwich, E.G.; Ali, S.; Ciacci, L.; Fishman, T.; Hereen, N.; Masanet, E.; Asghari, F.N.; Olivetti, E.; Pauliuk, S.; Tu, Q.; et al. Material efficiency strategies to reducing greenhouse gas emissions associated with buildings, vehicles and electronics—A review. Environ. Res. Lett. 2019, 14, 043004. [Google Scholar] [CrossRef] [Green Version]
  8. Mbuya, T.O.; Sinclair, I.; Moffat, A.J.; Reed, P.A.S. Micromechanisms of fatigue crack growth in cast aluminium piston alloys. Int. J. Fatigue 2012, 42, 227–237. [Google Scholar] [CrossRef]
  9. Huang, X.; Liu, C.; Lv, X.; Liu, G.; Li, F. Aluminum alloy pistons reinforced with SiC fabricated by centrifugal casting. J. Mater. Process. Technol. 2011, 211, 1540–1546. [Google Scholar] [CrossRef]
  10. Srinivas, P.N.S.; Balakrishna, B. Microstructural, mechanical and tribological characterization on the Al based functionally graded material fabricated powder metallurgy. Mater. Res. Express 2020, 7, 026513. [Google Scholar] [CrossRef] [Green Version]
  11. Erdemin, F.; Canakci, A.; Varol, T. Microstructural characterization and mechanical properties of functionally graded Al2024/SiC composites prepared by powder metallurgy techniques. Trans. Nonferrous Met. Soc. China 2015, 25, 3569–3577. [Google Scholar] [CrossRef]
  12. Gobber, F.S.; Pisa, A.G.; Ugues, D.; Rosso, M. Design of a Test Rig for the Characterization of Thermal Fatigue and Soldering Resistance of the Surfaces of Tool Steels for High-Pressure Die-Casting Dies. Steel Res. Int. 2019, 91, 1900480. [Google Scholar] [CrossRef]
  13. Sjölander, E.; Seifeddine, S. The heat treatment of Al-Si-Cu-Mg casting alloys. J. Mater Process. Technol. 2010, 210, 1249–1259. [Google Scholar] [CrossRef] [Green Version]
  14. StJohn, D.; McDonald, S.; Darlapudi, A. A New Perspective on the Nucleation, Growth Morphology and Modification of the Silicon Phase During the Formation of Eutectic Al-Si Grains. JOM 2019, 71, 391–396. [Google Scholar] [CrossRef]
  15. Hegde, S.; Prabhu, K.N. Modification of eutectic silicon in Al–Si alloys. J. Mater. Sci. 2008, 43, 3009–3027. [Google Scholar] [CrossRef]
  16. Knuutinen, A.; Nogita, K.; McDonald, S.D.; Dahle, A.K. Modification of Al-Si alloys with Ba, Ca, Y and Yb. J. Light Met. 2001, 1, 229–240. [Google Scholar] [CrossRef]
  17. Mao, G.; Yan, H.; Zhu, C.; Wu, Z.; Gao, W. The varied mechanisms of yttrium (Y) modifying a hypoeutectic Al–Si alloy under conditions of different cooling rates. J. Alloys Compd. 2019, 806, 909–916. [Google Scholar] [CrossRef]
  18. Dong, Z.; Hu, Z.; Yan, H.; Xie, H.; Li, X. Solidification Behavior and Microstructure of Al-7Si Alloys with Individual and Combined Additions of Sr and Yb. Adv. Mater. Sci. Eng. 2019, 9750526. [Google Scholar] [CrossRef] [Green Version]
  19. Li, J.H.; Wang, X.D.; Ludwig, T.H.; Tsunekawa, Y.; Arnberg, L.; Jiang, J.Z.; Schumacher, P. Modification of eutectic Si in Al-Si alloys with Eu addition. Acta Mater. 2015, 84, 153–163. [Google Scholar] [CrossRef]
  20. De Giovanni, M.; Kaduk, J.A.; Srirangam, P. Modification of Al-Si Alloys by Ce or Ce with Sr. JOM 2019, 71, 426–434. [Google Scholar] [CrossRef] [Green Version]
  21. Trudonoshyn, O.; Prach, O. Multistep nucleation and multi-modification effect of Sc in hypoeutectic Al-Mg-Si alloys. Heliyon 2019, 5, e01202. [Google Scholar] [CrossRef] [Green Version]
  22. Wu, X.F.; Wang, K.Y.; Wu, F.F.; Zhao, R.D.; Chen, M.H.; Xiang, J.; Ma, S.N.; Zhang, Y. Simultaneous grain refinement and eutectic Mg2Si modification in hypoeutectic Al-11Mg2Si alloys by Sc addition. J. Alloys Compd. 2019, 791, 402–410. [Google Scholar] [CrossRef]
  23. Tan, P.; Yang, Y.; Sui, Y.; Wang, Q.; Jiang, Y. The influence of Al–10Sr or/and Al–5Ti–1B on microstructure and mechanical properties of Al–12Si–4Cu–2Ni–0.8 Mg alloys. J. Alloys Compd. 2019, 809, 151856. [Google Scholar] [CrossRef]
  24. Timpel, M.; Wanderka, N.; Schlesiger, R.; Yamamoto, T.; Lazarev, N.; Isheim, D.; Schmitz, G.; Matsumura, S.; Banhart, J. The role of strontium in modifying aluminium-silicon alloys. Acta Mater. 2012, 60, 3920–3928. [Google Scholar] [CrossRef]
  25. Campbell, J.; Tiryakioglu, M. Review of effect of P and Sr on modification and porosity development in Al-Si alloys. Mater. Sci. Technol. 2010, 23, 262–268. [Google Scholar] [CrossRef]
  26. Samuel, F.H.; Samuel, A.M.; Ouellet, P.; Doty, H.W. Effect of Mg and Sr additions on the formation of intermetallics in Al-6 Wt pct Si-3.5 Wt pct Cu-(0.45) to (0.8) Wt pct Fe 319-type alloys. Metall. Mater. Trans. A 1998, 29, 2871–2884. [Google Scholar] [CrossRef]
  27. Cho, Y.; Lee, H.C.; Oh, K.; Dahle, A.K. Effect of Strontium and Phosphorus on Eutectic Al-Si Nucleation and Formation of β-Al5FeSi in Hypoeutectic Al-Si Foundry Alloys. Metall. Mater. Trans. A 2008, 39, 2435–2448. [Google Scholar] [CrossRef]
  28. Samuel, A.M.; Doty, H.W.; Valtierra, S.; Samuel, F.H. Effect of grain refining and Sr-modification interactions on the impact toughness of Al-Si-Mg cast alloys. Mater. Des. 2014, 56, 264–273. [Google Scholar] [CrossRef]
  29. Zamani, M.; Seifeddine, S. Determination of Optimum Sr Level for Eutectic Si Modification in Al–Si Cast Alloys Using Thermal analysis and Tensile Properties. Inter. Metalcast. 2016, 10, 457–465. [Google Scholar] [CrossRef]
  30. Dahle, A.K.; Nogita, K.; McDonald, S.D. Eutectic nucleation and growth in hypoeutectic Al-Si alloys at different strontium levels. Metall. Mater. Trans. A 2001, 32, 949–960. [Google Scholar] [CrossRef]
  31. Zarif, M.; McKay, B.; Li, J. Study of the Effect of Strontium (Sr) on the Nucleation of Eutectic Silicon (Si) in High Purity Hypoeutectic Al-5Si Alloys. Berg Huettenmaenn Monatsh. 2010, 155, 506–511. [Google Scholar] [CrossRef]
  32. Fracchia, E.; Gobber, F.S.; Rosso, M. Effects of casting-additives on the microstructure evolution of hypoeutectic aluminium-silicon alloys. Metals 2020, 10, 618. [Google Scholar] [CrossRef]
  33. Mrowka-Nowotnik, G. Intermetallic Phases Examination in Cast AlSi5Cu1Mg and AlCu4Ni2Mg2 Aluminium Alloys in As-Cast and T6 Condition. In Recent Trends in Processing and Degradation of Aluminium Alloys; Intechopen: London, UK, 2011. [Google Scholar] [CrossRef]
  34. Piątkowski, J.; Przeliorz, R.; Szymszal, J. The application of ATD and DSC methods to study of the EN AC-48000 alloy phase transformations. Arch. Foundry Eng. 2017, 17, 2. [Google Scholar] [CrossRef] [Green Version]
  35. Zedan, Y.; Samuel, F.H.; Samuel, A.M.; Doty, H.W. Effects of Fe intermetallics on the machinability of heat-treated Al-(7–11)% Si alloys. J. Mater. Process. Technol. 2010, 210, 245–257. [Google Scholar] [CrossRef]
  36. Lemmadi, F.Z.; Chala, A.; Belahssen, O.; Benramache, S. Effect of the ageing temperature, ageing time and quenching temperature on precipitation kinetics in Al-Mg-Si alloy. Acta Metall. Slovaca 2014, 20, 4. [Google Scholar] [CrossRef] [Green Version]
  37. Meng, F.; Wu, Y.; Hu, K.; Li, Y.; Sun, Q.; Liu, X. Evolution and strengthening effects of the heat-resistant phases in Al-Si piston alloys with different Fe/Ni ratios. Materials 2019, 12, 2506. [Google Scholar] [CrossRef] [PubMed] [Green Version]
  38. Belov, N.A.; Eskin, D.G.; Avxentieva, N.N. Constituent phase diagrams of the Al-Cu-Fe-Mg-Ni-Si system and their application to the analysis of aluminium piston alloys. Acta Mater. 2005, 53, 4709–4722. [Google Scholar] [CrossRef]
  39. Vandersluis, E.; Ravindran, C. Comparison of Measurement Methods for Secondary Dendrite Arm Spacing. Metallogr. Microstruct. Anal. 2017, 6, 89–94. [Google Scholar] [CrossRef]
  40. Fracchia, E.; Gobber, F.S.; Rosso, M.; Actis Grande, M.; Bidulská, J.; Bidulský, R. Junction characterization in a functionally graded aluminum part. Materials 2019, 12, 3475. [Google Scholar] [CrossRef] [Green Version]
  41. Amne Elahi, M.; Shabestari, S.G. Effect of various melt and heat treatment conditions on impact toughness of A356 aluminum alloy. Trans. Nonferrous Met. Soc. China 2016, 26, 956–965. [Google Scholar] [CrossRef]
  42. Mohamed, A.M.A.; Samuel, F.H.; Samuel, A.M.; Doty, H.W. Influence of additives on the impact toughness of Al-10.8% Si near-eutectic cast alloys. Mater. Des. 2009, 30, 4218–4229. [Google Scholar] [CrossRef]
  43. Bjurenstedt, A.; Ghassemali, E.; Seifeddine, S.; Dahle, A.K. The effect of Fe-rich intermetallics on crack initiation in cast aluminium: An in-situ tensile study. Mater. Sci. Eng. A 2019, 756, 502–507. [Google Scholar] [CrossRef]
  44. Abdelaziz, M.H.; Samuel, A.M.; Doty, H.W.; Valtierra, S.; Samuel, F.H. Effect of additives on the microstructure and tensile properties of Al-Si alloys. J. Mater. Res. Technol. 2019, 8, 2255–2268. [Google Scholar] [CrossRef]
  45. Ibrahim, M.F.; Samuel, E.; Samuel, A.M.; Al-Ahmari, A.M.A.; Samuel, F.H. Metallurgical parameters controlling the microstructure and hardness of Al-Si-Cu-Mg base alloys. Mater. Des. 2011, 32, 2130–2142. [Google Scholar] [CrossRef]
  46. Moustafa, M.A.; Samuel, F.H.; Doty, H.W. Effect of solution heat treatment and additives on the hardness, tensile properties and fracture behaviour of Al-Si (A413.1) automotive alloys. J. Mater. Sci. 2003, 8, 4523–4534. [Google Scholar] [CrossRef]
  47. Samuel, A.M.; Samuel, F.H.; Villeneuve, C.; Doty, H.W.; Valtierra, S. Effect of trace elements on β-Al5FeSi characteristics, porosity and tensile properties of Al-Si-Cu (319) cast alloys. Int. J. Cast Met. Res. 2001, 14, 97–120. [Google Scholar] [CrossRef]
  48. Pineau, A.; Benzerga, A.A.; Pardoen, T. Failure of metals I: Brittle and ductile fracture. Acta Materialia. 2016, 107, 424–483. [Google Scholar] [CrossRef] [Green Version]
  49. Elsharkawi, E.A.; Abdelaziz, M.H.; Doty, H.W.; Valtierra, S.; Samuel, F.H. Effect of β-Al5FeSi and π-Al8Mg3FeSi6 Phases on the Impact Toughness and Fractography of Al–Si–Mg-Based Alloys. Int. J. Met. 2018, 12, 148–163. [Google Scholar] [CrossRef]
Figure 1. Secondary dendrite arm spacing (SDAS) measurement and image analysis. Left image: SDAS measurement procedure as in [39]. Center and right images: image analysis details on the eutectic phase (average size, circularity, % area occupied). Optical images at 50X magnification.
Metals 11 00342 g001
Figure 2. Optical microscope images at 20X magnification. Intermetallic phases that nucleated in the alloys. The arrows indicate some intermetallic phases. A: Eutectic silicon; B: α-aluminum matrix; C: acicular Fe intermetallic; D: Cu-based phase; E: Chinese script; F: Q-phase; G: Mg2Si.
Metals 11 00342 g002
Figure 3. Micro-hardness measurements for all the alloys, unmodified (left side) and modified (right side). Values reported are average values. The table reports all micro-hardness measurements. Alloy 1: 86-93 HV0.5 = α-Al; from 93 to 100 HV0.5 = eutectic; up to 100 HV0.5 = intermetallic phases. Alloy 2: 65–70 HV0.5 = α-Al; up to 70 HV0.5 = eutectic. Alloy 3: 70–80 HV0.5 = α-Al; from 80 to 83 HV0.5 = eutectic silicon; up to 83 HV0.5 = intermetallic phases. Alloy 4: 96–100 HV0.5 = α-Al; from 100 to 110 HV0.5 = eutectic silicon; up to 110 HV0.5 = intermetallic phases.
Metals 11 00342 g003
Figure 4. Correlation between micro-hardness and average elements contained in alloys. (A): Relation between average Si content and micro-hardness. (B): Relation between average Mg content and micro-hardness. (C): Relation between average Fe content and micro-hardness. (D): Relation between average Cu content and micro-hardness. (E): Relation between average Fe + Mg + Cu content and micro-hardness. (F): Relation between average Fe + Mg content and micro-hardness. (G): Relation between average Mg + Cu content and micro-hardness. (H): Relation between average Fe + Cu content and micro-hardness.
Metals 11 00342 g004
Figure 5. (A): Graphical representation of the average particle area; (B): graphical representation of the percentage of eutectic phase; (C): the relation between average Si content and SDAS; (D): the relation between average Fe + Mg + Cu content and SDAS; (E): the relation between average Si + Fe + Mg + Cu content and SDAS.
Metals 11 00342 g005
Figure 6. The relationships between particle size and Si, Mg, and Fe contents. (A): Relation between average Si content and eutectic particles’ size.; (B): Relation between average Mg content and eutectic particles’ size. (C): Relation between average Fe content and eutectic particles’ size. (D): Relation between average Mg + Fe content and eutectic particles’ size.
Metals 11 00342 g006
Figure 7. Intermetallics measured for each alloy. Intermetallic measurements are evidenced in the micrographs by different colors—the table shows the area occupied for each intermetallic phase. Data for the α-Fe and β-Fe in the unmodified condition for alloys 1 and 3 refer to previous work [32].
Metals 11 00342 g007
Figure 8. Impact test results and alloys’ microstructures (optical microscope). Microstructures (AD) refer to the unmodified alloys, as on the bar chart’s left side. Microstructures (EH) refer to the modified alloys, as on the bar chart’s right side. Image (A,E): alloy 1; image (B,F): alloy 2; image (C,G): alloy 3; image (D,H): alloy 4.
Metals 11 00342 g008
Figure 9. Effect of intermetallic phases on silicon shape. Optical micrograph of alloy 3 modified. Red arrow indicates Fe plate intermetallics; blue arrow indicates acicular Fe intermetallic. The uneven silicon shape is well visible near the intermetallics.
Metals 11 00342 g009
Figure 10. Macrographic images of fractured surfaces in impact specimens. (A): A brittle fracture in alloy 4 modified (impact energy 3.17 J). (B): A ductile fracture in alloy 3 modified (impact energy 8.82 J).
Metals 11 00342 g010
Figure 11. SEM images of fracture surfaces in impact specimens. (A): A brittle fracture in alloy 4 modified (impact energy 3.17 J). (B): A ductile fracture in alloy 3 modified (impact energy 8.82 J).
Metals 11 00342 g011
Figure 12. Macrographic images of fracture surfaces in impact specimens (0.63×). Arrows indicate the cracks documented in specimens after impact tests. Impact energies reported are the minimum measured in the unmodified samples and the maximum measured in the modified samples.
Metals 11 00342 g012
Table 1. Intermetallic phases expected in the alloys studied from literature [32,33,34,35].
AlloyIntermetallic PhasesAlloyIntermetallic Phases
Alloy 1—EN AC 45300
(alloy 1)
θ-Al2Cu; β-Mg2Si; β-Al5FeSi; α-Al15(Fe,Mn)3Si2Alloy 3—EN AC 43500
(alloy 3)
α-Al8Fe2Si; β-Al5FeSi; β-Mg2Si;
Alloy 2—EN AC 42100
(alloy 2)
β-Mg2Si; α-Al8Fe2Si;
β-Al5FeSi; α-Al15(Fe,Mn)3Si2;
π-Al8Mg3FeSi6; Al9FeMg3Si5
Alloy 4—EN AC 48000
(alloy 4)
β-Mg2Si; ε-Al3Ni; θ-Al2Cu; α-Al15(Fe,Mn)3Si2; β-Al5FeSi; α-Al8Fe2Si; Al2CuMg; Al9FeMg3Si5;
π-Al8Mg3FeSi6; Q-Al5Cu2Mg8Si6;
Table 2. Alloys’ composition from regulation EN 1706 and technical datasheets.
EN AB/AC 45300-AlSi5Cu1Mg (Alloy 1)
ElementsSiFeCuMnMgNiZnPbSnTiAl
Min.4.5-1.0-0.40-----Res.
Max.5.50.551.500.550.650.250.150.150.050.20
Mechanical propertiesA% = 1 ÷ 2%Rm = 145 ÷ 175 MPaRp0.2 = 125 ÷ 145 MPa
EN AB/AC 42100-AlSi7Mg0.3 (Alloy 2)
ElementsSiFeCuMnMgZnTiAl
Min.6.5---0.30-0.10Res.
Max.7.50.150.030.100.450.070.18
Mechanical propertiesA% = 2 ÷ 6%Rm = 140 ÷ 220 MPaRp0.2 = 80 ÷ 140 MPa
EN AB/AC 43500-AlSi10MnMg (Alloy 3)
ElementsSiFeCuMnMgZnTiAl
Min.9.0--0.400.15--Res.
Max.11.500.200.030.800.600.070.15
Mechanical propertiesA% = 5%Rm = 250 MPaRp0.2 = 120 MPa
EN AB/AC 48000-AlSi12CuNiMg (Alloy 4)
ElementsSiFeCuMnMgNiZnTiAl
Min.10.50-0.80-0.900.70--Res.
Max.13.500.601.500.351.501.300.350.20
Mechanical propertiesA% = 2 ÷ 6% (T5)Rm = 200 (T5) MPaRp0.2 =185 (T5) MPa
Table 3. SDAS values measured.
SDAS ValuesAlloy 1Alloy 2
UnmodifiedModifiedUnmodifiedModified
SDAS (µm)27.48 ± 4.1518.09 ± 4.1525.03 ± 3.1420.80 ± 5.14
Alloy 3Alloy 4
SDAS (µm)15.02 ±2.6813.77 ±2.1819.51 ±2.0716.06 ±1.08
Table 4. Image analysis results for the characterization of the eutectic area.
Image AnalysisAlloy 1Alloy 2
UnmodifiedModifiedUnmodifiedModified
Average size (µm)17.4610.4132.679.92
Circularity0.7260.720.4760.756
Solidity0.8250.8290.7290.834
% Eutectic phase30.3 ± 0.5248.4 ± 2.9421.9 ± 0.935.7 ± 0.85
Image AnalysisAlloy 3Alloy 4
UnmodifiedModifiedUnmodifiedModified
Average size (µm)22.063.0914.532.16
Circularity0.750.6750.8220.806
Solidity0.8450.7960.8590.884
% Eutectic phase48.1 ± 2.6452.3 ± 1.9252.9 ± 4.6453.7 ± 0.71
Publisher’s Note: MDPI stays neutral with regard to jurisdictional claims in published maps and institutional affiliations.

