Article

Central Composite Experiment Design (CCD)-Response Surface Method (RSM) to Optimize the Sintering Process of Ti-6Al-4V Alloy

1
College of Materials Science and Engineering, Sichuan University, Chengdu 610065, China
2
Engineering Research Center of Alternative Energy Materials & Devices, Ministry of Education, Chengdu 610065, China
3
Institute of New-Energy and Low-Carbon Technology, Sichuan University, Chengdu 610207, China
*
Author to whom correspondence should be addressed.
Metals 2021, 11(2), 197; https://doi.org/10.3390/met11020197
Submission received: 15 December 2020 / Revised: 18 January 2021 / Accepted: 19 January 2021 / Published: 22 January 2021
(This article belongs to the Special Issue Advances in Powder Metallurgy)

Abstract

:
It is widely acknowledged that the blended elemental (BE) powder metallurgy (PM) Ti6Al4V alloy attracted unusual due to its low cost and comprehensive mechanical properties. However, the high porosity and mediocre mechanical properties of traditional vacuum sintering limited its application. To achieve better mechanical performance, the central composite designs (CCDs) method was employed to analyze the influence of sintering parameters, such as sintering temperature (St), heating rate (Hr), and holding time (Ht). The results indicated that St makes the most significant contribution to compressive strength and sintering density, accounting for 95.5% and 86.54% respectively. In addition, Ht makes the most significant contribution to compression ratio, which accounted for 89.35%. Through the analysis of response surface methodology (RSM), the optimum sintering parameters (St, Ht, Hr) could be considered to be 1300 °C, 148 min and 5 °C/min. In addition, verification experiments were carried out under the optimum conditions, and the experimental results were in good agreement with the predicted values, since the deviation of the predicted and experimental values was less than 4.9%. Therefore, the results of this study could certify the reliability of CCDs method, which would contribute to the development of titanium alloys with low cost and high mechanical properties.

1. Introduction

Titanium and titanium alloy have been extensively used in the national defense industry and the civilian industry due to their outstanding advantages including excellent corrosion resistance and high specific strength [1,2]. Among them, the Ti6Al4V titanium alloy has received wide attention because of its excellent corrosion resistance, high specific strength, high stiffness, and good weldability, which accounted for 50% of the total titanium alloy output and 95% of the titanium alloy components [3,4]. Forging and casting were two typical methods of titanium alloy formation. Titanium alloys with high strength, high density and good plasticity could be formed through forging and casting, but the problems of forging and casting could not be ignored, such as low production efficiency and high requirements for mold materials. Furthermore, the use rate of materials in processing was poor [5]. According to data, in 2010, the production capacity of titanium sponge in China reached 103.5kt, and the expected production capacity of titanium ingot reached 89.2 kt. However, the actual production capacity of titanium ingot was 46.262 kt, only accounted for 50% of the expected production [3,4,5,6]. For a long time, the main problem limiting the industrialization of titanium alloys was the high cost. Therefore, compared with the complex process of conventional processing of titanium alloys and the huge material loss, the near net shape (NNS) forming process was a very attractive choice [6,7,8,9,10].
Near net-shaped was a no-cutting or less cutting process, including additive manufacturing (AM), superplastic forming (SPF), powder metallurgy (PM), etc. AM took the high-energy beam (laser beam/electron beam/electric arc, etc.) as the heat source, and the metal components were stacked layer by layer with melting the powder or wire [11,12,13,14]. At present, the tensile properties of titanium alloy products formed by AM could meet the forging standard. While the problems of novel microstructure and texture orientation, poor fatigue performance, large residual stress and the high cost limited its industrialization [15]. SPF could be employed to fabricate complex and high- quality components, but the long processing time and high forming temperature (900 °C) limited its application. In addition, the added costs of such processes would offset the costs advantages of the PM process over wrought processing [16]. Powder metallurgy, as a typical near net shaping (NNS) manufacturing process, was first proposed by Kroll in the late 1940s [17]. Powder metallurgy technology could directly press and sinter the powder into products of the desired shape, which not only shortened the process flow and reduced processing losses. In addition, powder preparation without the need for VAR (vacuum arc remelting), EBM (electron beam melting) or PAM (plasma arc) Smelting), then could reduce energy loss. Compared with forging products, the powder metallurgy products were more cost effective due to the increment of raw material use rate, and could obtains the same excellent performance [18,19]. That was why powder metallurgy has been quite popular in the research field. Typically, powder metallurgy could be divided into two types: pre-alloy (PA) method and Blended-Element (BE) Method. The raw material of the pre-alloying method was usually PA powder with high purity, which was made by the process of rotating electrode plasma rotating electrode process (PREP), gas-atomization (GA) and electrode-induction-gas-atomization (EIGA) [20,21]. However, the raw material powder of the Blended-Element (BE) method could be directly obtained by crushing sponge titanium, and alloy elements could be added by mixing. Therefore, compared to pre-alloying methods, the BE method was more energy efficient and less expensive, which was more conducive to the industrial application of titanium alloy [22]. With the development of the titanium industry, the use of low-cost titanium hydride powder as a raw material for titanium powder metallurgy has also attracted widespread attention. Its main advantage was higher concentration of vacancies and dislocations, due to the volume change caused by hydrogen decomposition in the sintering process of titanium hydride, which promoted the diffusion between elements. In addition, the brittle titanium hydride was broken into finer particles during the pressing process, resulted in increased sintering surface. During the sintering process, the released hydrogen reacts with oxygen to clean the surface, reduced the oxygen content, increased the surface activity, and facilitated the densification of the sintering process. Therefore, compared with the sintered samples of hydrogenated dehydrogenated titanium, hydrogenated powder could obtain higher density and performance [23,24,25,26].
The process of sintering was the essential step in traditional powder metallurgy. J.-M. Oh., et al. studied the effect of sintering temperature on the sintering performance of TC4, and the result shown that sintering temperature has a major impact on sintering performance [27]. In addition, Zhang et al. have also studied the influence of the main process factors on the sintering process of titanium hydride powder, the control of variables such as sintering temperature (St), holding time (Ht) and heating rate (Hr) were the main parameters that affect the performance of the sample during the sintering process. However, according to previous studies [28,29,30], these studies did not specifically analyze the degree of impact of each parameter and lack of research on the effect of the interaction of three process parameters. Therefore, this study used the experimental design method of combining CCD and RSM to study the influence of the interactions of various factors (St, Ht, Hr) and the specific contribution of each parameter, then determined the optimal sintering parameters. First, several experiments were conducted according to the central composite experimental design (CCD), then response surface methodology (RSM) was adapted to analyze and optimize the data [31]. RSM was a method under optimizing experimental conditions, suitable for solving related problems of nonlinear data processing [32] The combination of central composite experimental design (CCD) and response surface method (RSM) could involve the cross-effects of variables on the overall response and obtain the specific contribution of each parameter. In addition, the correlation between the influencing factor and the response value could also be represented by a three-dimensional rendering diagram or a two-dimensional contour diagram [33,34].
The objectives of this study were to develop the mathematical model to predict the response of sintering performance using the design of experiment method in terms of Ht, St and Hr [34]. Data analysis used MINITAB statistical software combined with variance analysis to study the contribution of three factors on the output response (compressive, density and compression ratio), and obtained a quadratic regression equation between the input response and the output response.

2. Experimental Strategy

2.1. Sample Preparation

Raw materials were TH2 powder with the particle size of ~75 μm, the particle size distribution is shown in Figure 1. Then, the raw materials and commercially purchased AlV55 and TiAl35 powder were weighted by electronic balance and mixed in a V-type mixer for 4 hours with the protection of high purity argon. Later, mixed raw materials were pressed by using 34SM-810H-T hydraulic machine at 650 MPa with the holding time of 60 s, and the pressing method was biaxial compaction. Finally, the green compacts were sintered at a high vacuum molybdenum wire furnace for sintering with the vacuum degree less than 5 × 10⁻³ Pa. In addition, at least seven specimens of each sintering condition were needed to ensure the reliability of the results.

2.2. Experiment Design

CCD was flexible and effective, and could provide a lot of information about experimental variables and experimental errors with the least experimental cycle. In addition, central experiment design (CCD) added an axial point and a center point to the two-level factorial design point for simulation improvement of the response surface. Therefore, several experiments were carried out according to the central experiment design (CCD). Table 1 showed the sintering parameters generated by the central composite design method and their coding levels. The range of sintering factors are set at sintering temperature of 1100 °C, 1200 °C, and 1300 °C, heating rate of 5 °C/min, 7.5 °C/min, and 10 °C/min and holding time of 120 min, 180 min and 240 min.

2.3. Experimental Tests

Density measurement: The sintered density of the samples was measured by the Archimedes method, which can be calculated by the following equation: ρ s i n t e r e d = M 0 M 1 , where M0 was the mass of the sintered sample, and M1 represented the mass of drainage quality, and M0 and M1 were weighed by electronic balance. Since the density of water was 1 g.cm−3, the volume of the sample can be determined as M1. To ensure the reliability of the results, at least seven parallel samples should be calculated and then averaged.
Microstructure evolution: The microstructure of these samples was measured by optical microscopy (OM, JX-2000B) and scanning electron microscopy (SEM, Hitachi S3400N). First, these samples were grounded using silicon carbide polishing paper with the mesh number from 600–4000 mesh, then polished with diamond polishing paste, and finally etched by Kroll’s solution: (90% H2O, 7% HNO3, 3% HF). The distribution, morphology, and pore size of the holes was detected by JX-2000B microscopic imager, and the pore size and porosity of the sample was calculated by Image-Pro Plus software. The phase evolution of the sample was detected by X-ray diffractometer (XRD, DX—2600, Dandong Fang Yuan, China) with Cu-Kα radiation, which was operated at a wavelength of 0.1542 Å, voltage of 35 kV and scan range from 30° to 90°.
Mechanical behavior: The compression experiments were carried out on Instron 5569 tester at a compression rate of 0.3 mm/min, the diameter and the height/diameter ratio of these samples were 5.8 mm and 1.5, respectively, which conformed with the “Metal compression test method” (GB/T 7314-87). The microhardness of these samples was measured by HVS-1000 microhardness tester (Shanghai special precision instrument) with the loading weight of 500g and the holding time of 10s, which is in agreement with the “metallic materials—Vickers microhardness test” (GBT4342-1991). In addition, at least 20 scattered points of each sample were measured and then averaged to ensure the reliability of the results.

3. Results and Discussion

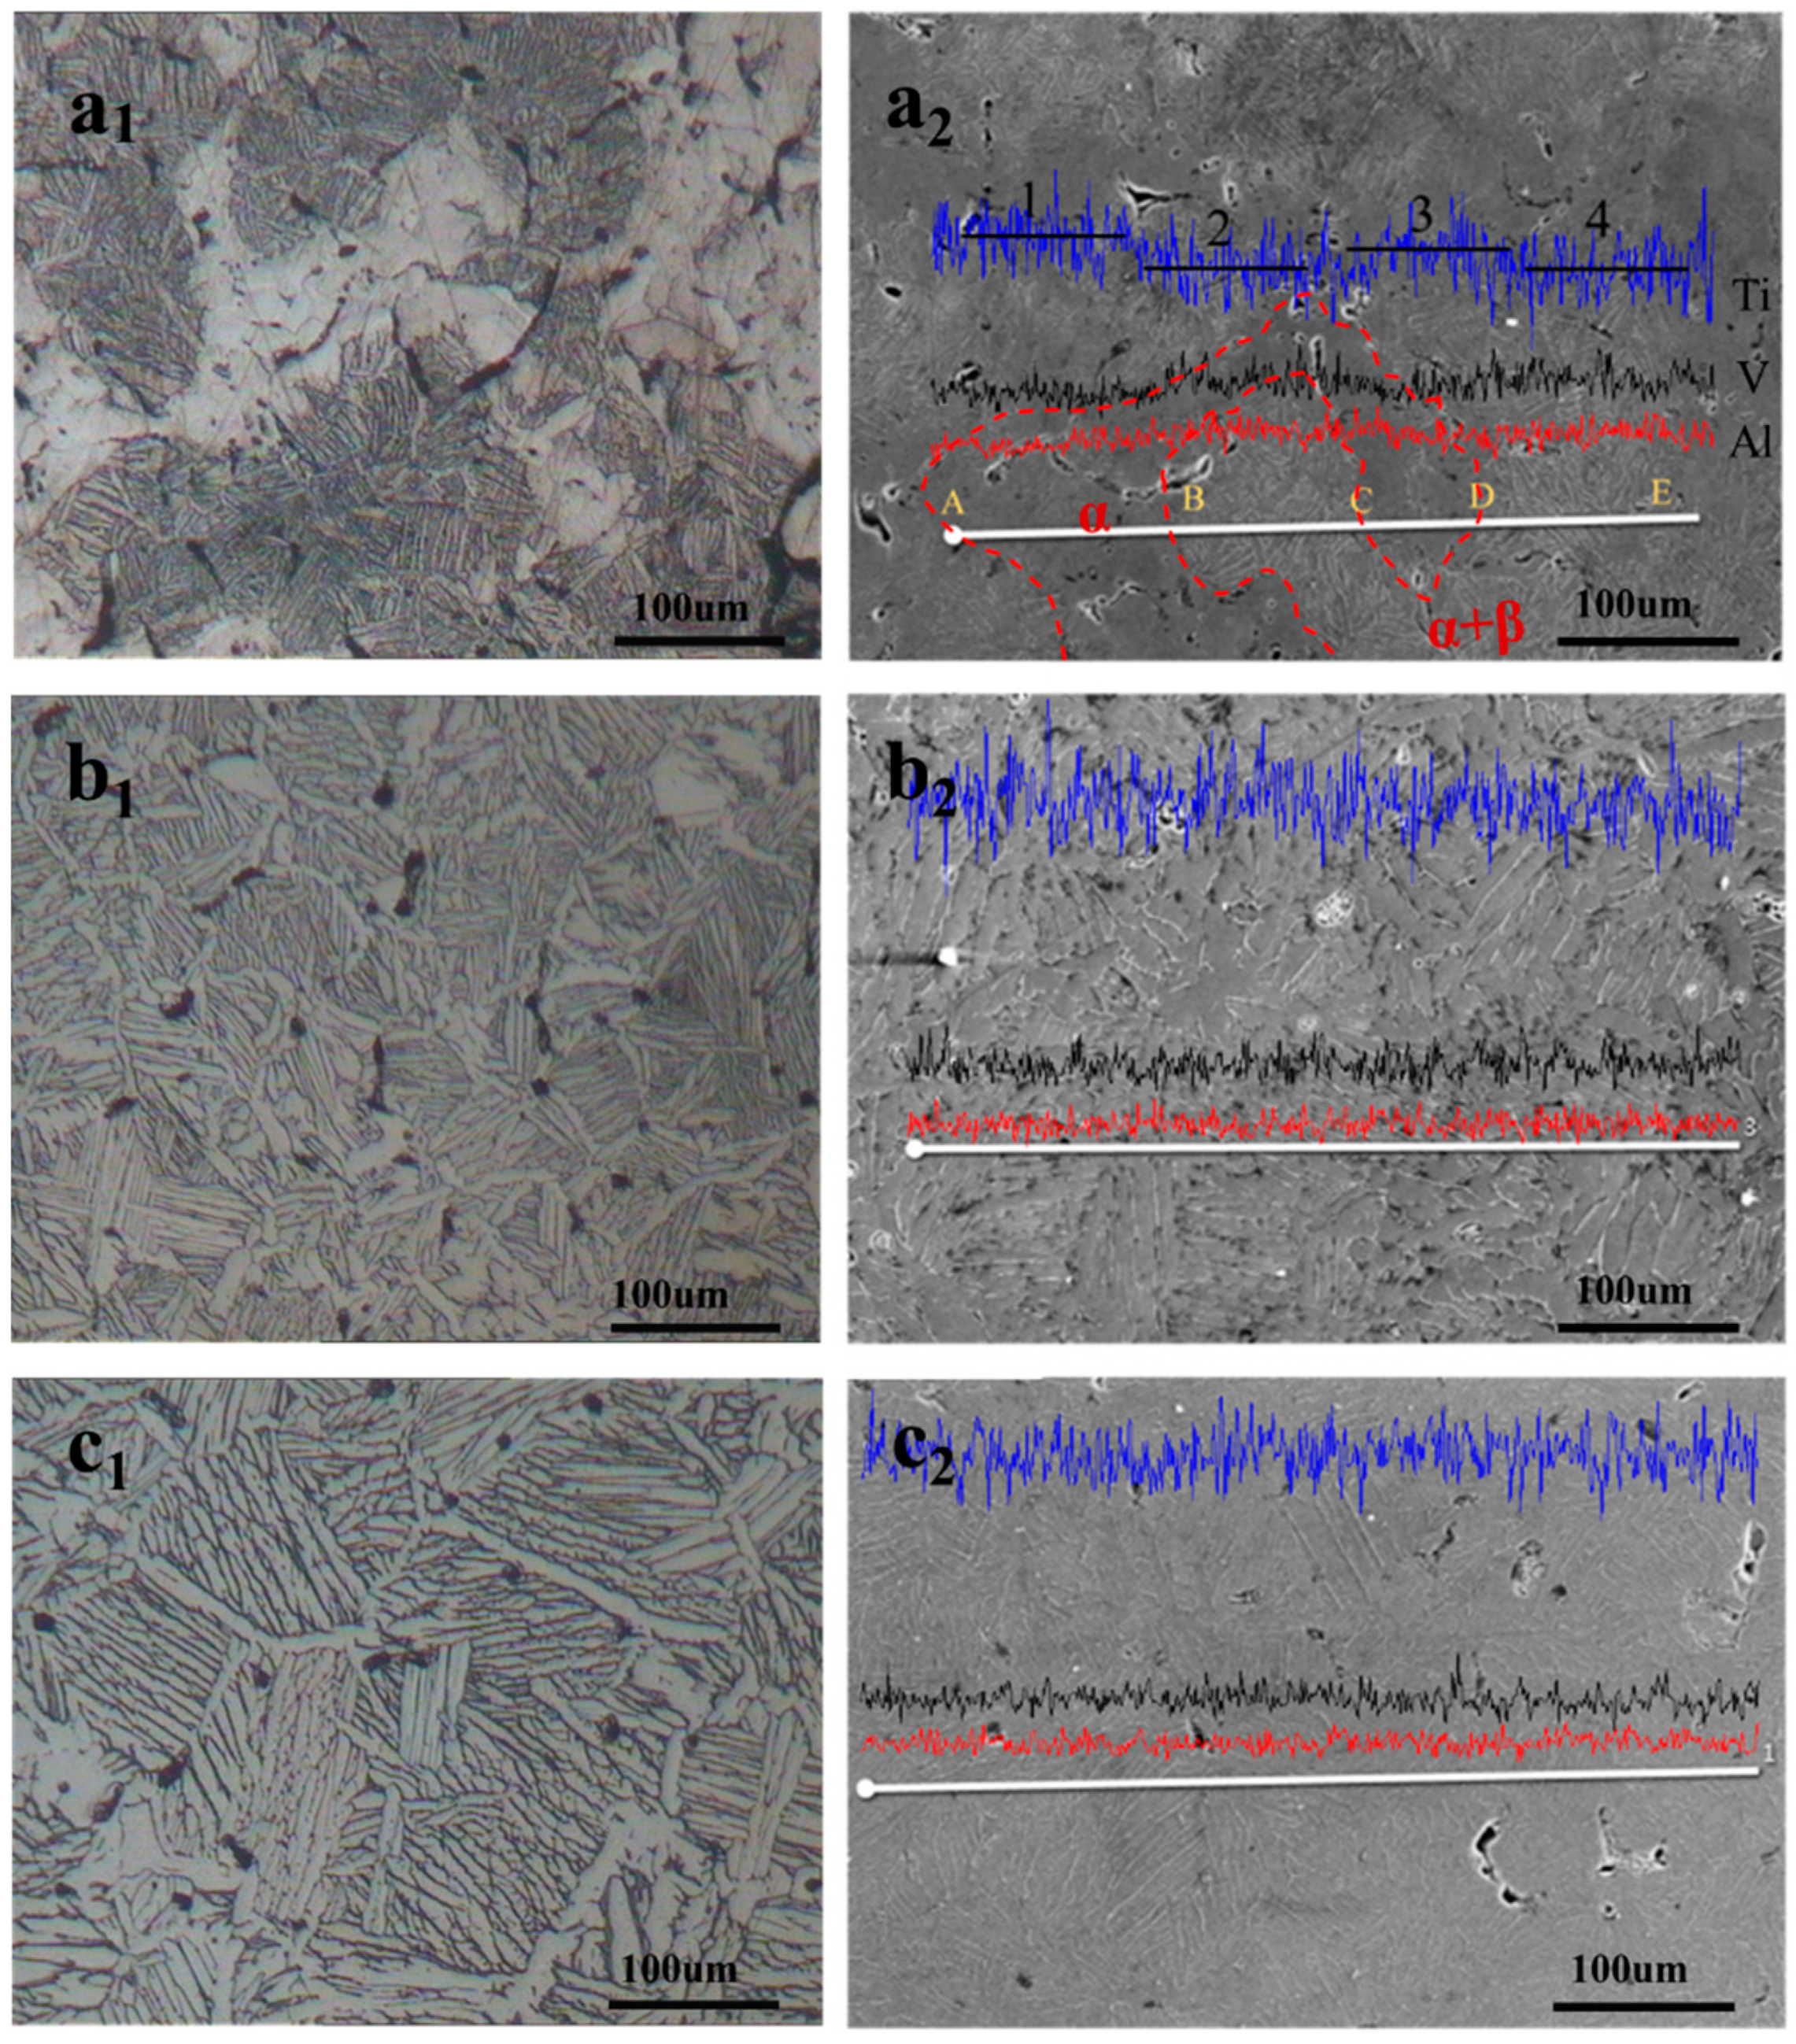
3.1. Microstructure Characterization
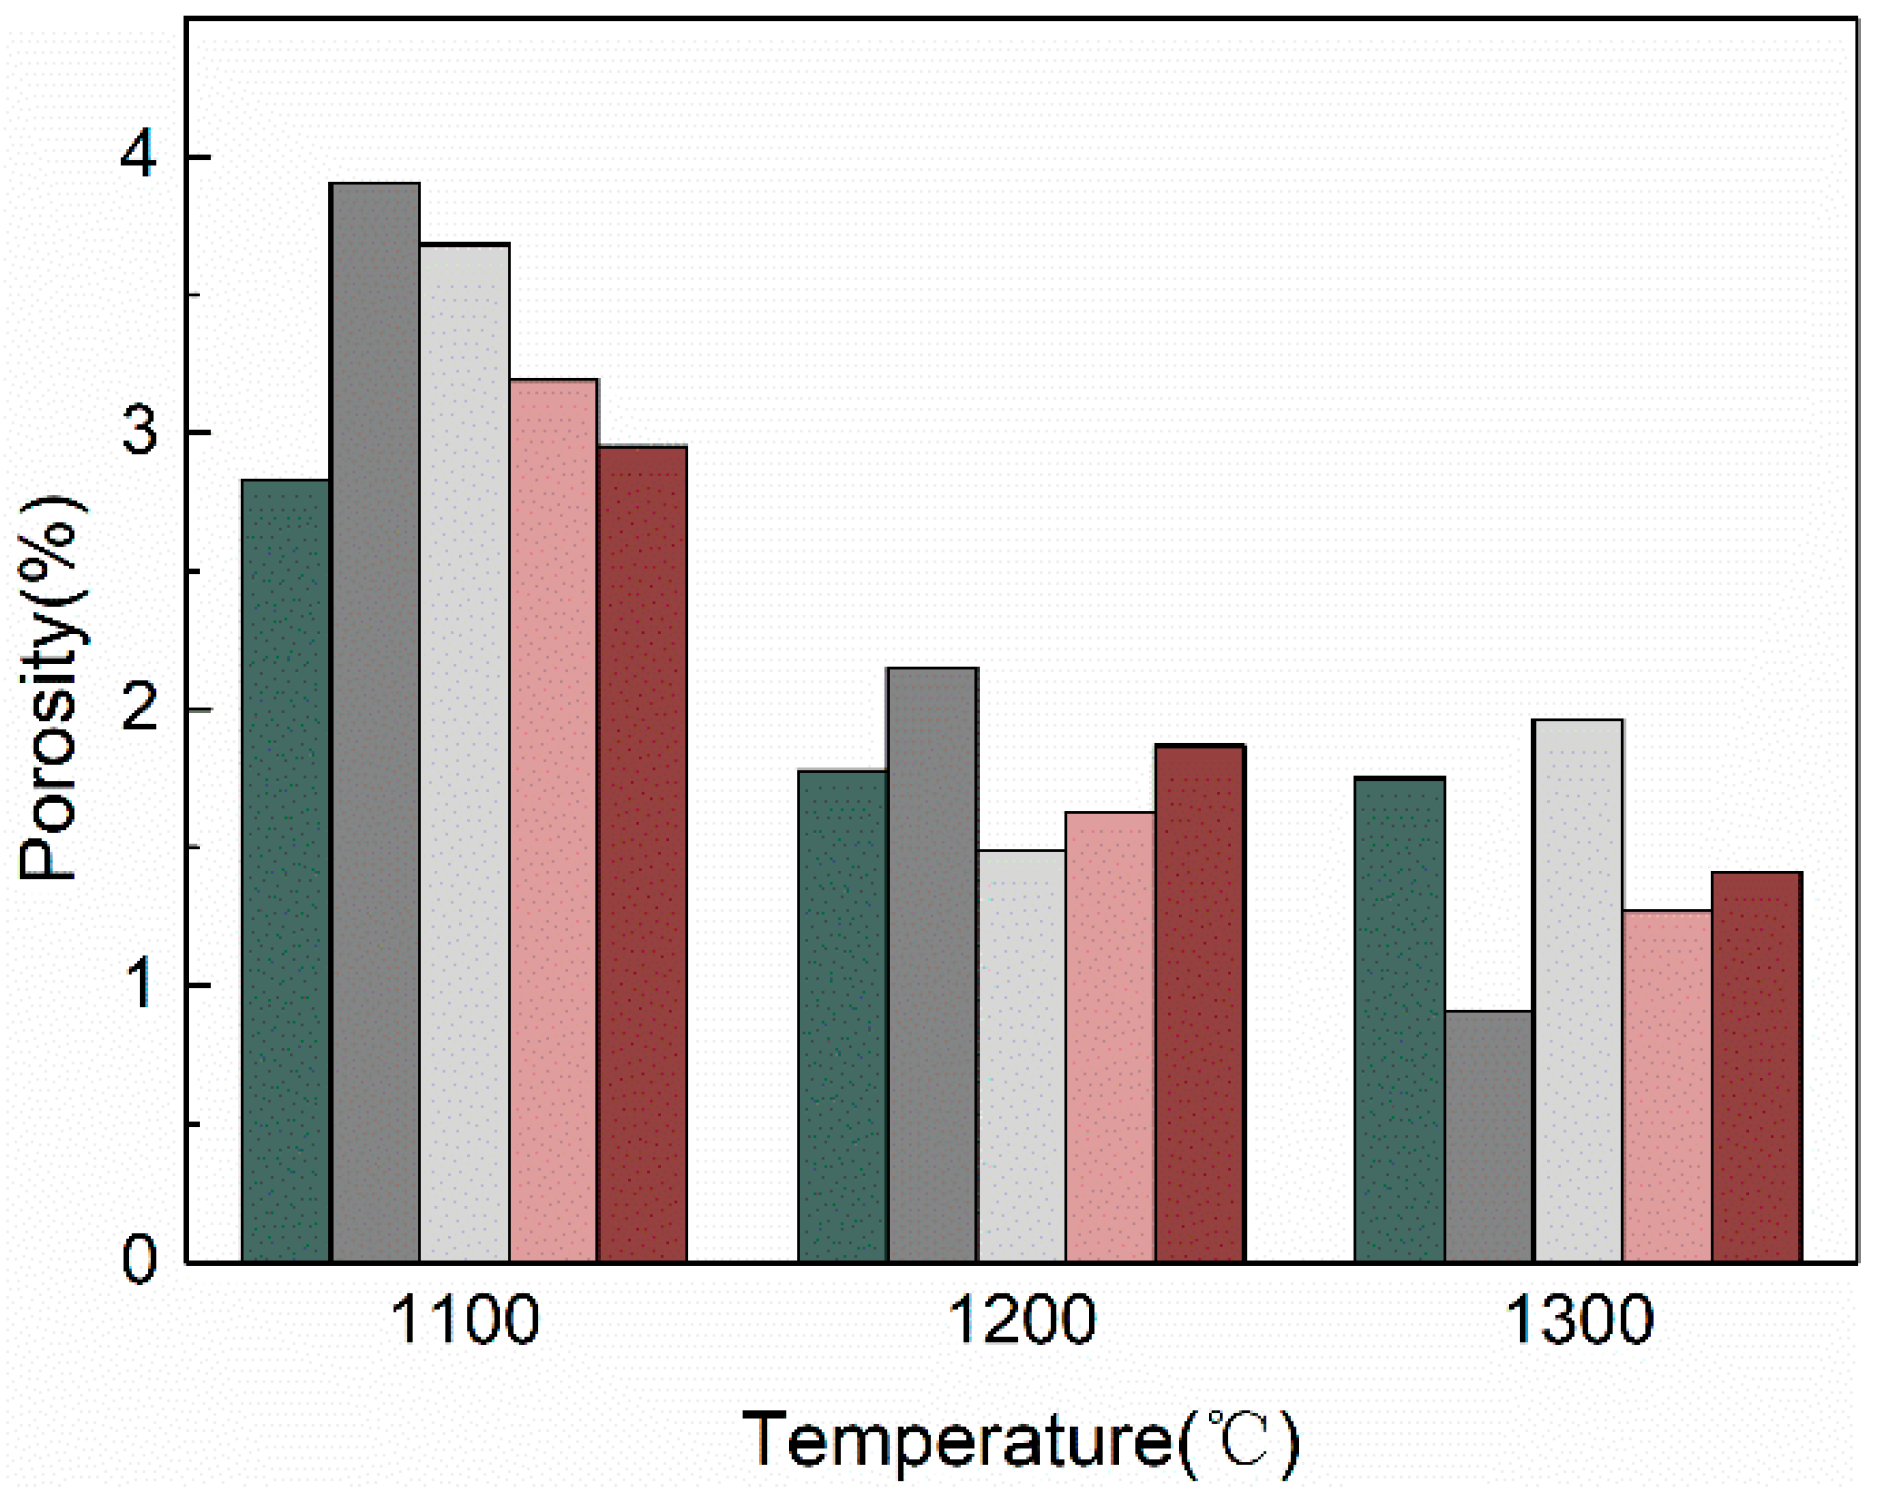
Figure 2 showed the OM images and SEM images of PM TC4 alloy sintered at different temperatures. As the sample was cooled with furnace after sintering, the microstructure changed into lamellar structure (Figure 2) at the low cooling rate. When the sintering temperature was 1100 °C, a large amount of pure titanium phase was retained, many slender and continuous pores could be observed in Figure 2a1, which indicated that the PM Ti6Al4V alloy did not complete sintering at 1100 °C. However, when the sintering temperature was 1200 °C, the β grain boundary began clear and the continuous pores changed into independent closed pores, the grain size was about 50 μm, and the average thickness of α–layer was close to 4 μm. When the sintering temperature was 1300 °C, it was observed that a completely lamellar structure was formed in Figure 2c1, and the grain size was about 90 μm, and the average thickness of α–layer was close to 7.5 μm.
To investigate the influences of sintering temperature on elements diffusion, EDS analysis was carried out on SEM images (Figure 2a2,b2,c2). EDS could perform element analysis by measuring the energy of the excited X-ray photons of solid materials, for samples with less complex element distribution, this measure was efficient and stable. Besides, X-ray fluorescence analysis and X-ray photoelectron spectroscopy were also frequently applied for elemental analysis [35]. The EDS spectrum in Figure 2 represented the fluctuation of element content. The stronger the peak intensity, the higher the element content in this region. When the sintering temperature was 1100 °C, the EDS spectrum fluctuates significantly, and the rising peaks (1, 3) of titanium could be observed, corresponding to the aggregation areas (AB and CD) of titanium. In this area where the titanium element was concentrated, Al and V are not fully diffused yet, and the α + β structure is not formed yet. Therefore, the red dashed area in Figure 2a2 could be divided into the α phase area, and the red outer dashed area was (α + β) Phase area. When the sintering temperature was 1200 °C, the EDS spectra of the three elements have no obvious fluctuation, indicating that the diffusion of Ti, Al and V was almost completed at this temperature. While for the sintering temperature of 1300 °C, the fluctuation of the EDS peak pattern at 1200 °C was more stable, indicating that the diffusion of Ti, Al and V was more uniform.
Figure 3 was the XRD diagram of PM Ti6Al4V. Apparently, only the diffraction peaks of α-Ti phase could be detected when the sintering temperature was 1100 °C. Then, the diffraction peak (110) of β-Ti appeared when the temperature rose to 1200 °C, and strengthened. Furthermore, with the increase of sintering temperature, the FWHM of diffraction peaks became narrower and the intensity of diffraction peaks increased gradually, but the position of diffraction peaks tended to shift to the left. As can be shown in Figure 2a1,a2, when the sintering temperature reached 1100 °C, the phase transformation was inadequate and the microstructure was mainly composed of α phases, which was the reason only the diffraction peaks of α-Ti phase could be detected. Later, the phase transition in PM TC4 alloy was basically completed when the sintering temperature rose to 1200 °C (Figure 2b2), after that the diffraction peak (110) of β-Ti appeared. Meanwhile, the lattice constant of α-Ti phases increased gradually with the solution of Al and V elements, leading to the shift of diffraction peak position. In addition, the FWHM of α peak gradually widen from 1100 °C to 1300 °C, which was mainly due to the growth of α clusters after the increase of sintering temperature.
Figure 4 showed the microstructure of PM TC4 alloy when sintered at 1300 °C for 2 h or 4 h. Apparently, as the holding time increases, the grain size increased and the α clusters thickened. The main reason for these phenomena was that when the sintering temperature was high enough (e.g., 1300 °C), the diffusion activation energy of the elements was high enough to make the elements diffuse uniformly in a short time. Therefore, there was almost no connected pore phenomenon in the sintered products (Figure 2c2). After that, with the prolongation of holding time, the grain size grown rapidly, and the thickness of α clusters increased after cooling, which eventually leads to the decreases of strength and plasticity.

3.2. Pore Analysis

Using “count/size” in image pro-plus to perform porosity and size statistics on metallographic images which showed in Figure 5, combined pixel conversion to calculate its porosity and maximum pore size. Table 2 clearly showed the statistics of porosity in various sinter conditions. As seen in Figure 5, with the sintering temperature increased, the number of pores was significantly reduced, and the shape of the pores has changed from irregular continuous pores to spherical pores.
As shown in Figure 6, the sintering temperature of PM TC4 alloy showed significant influence on porosity, which reduced with the rise of temperature from 1100 °C to 1300 °C. It could be observed from Table 3 that the increase of porosity directly leads to the decrease of compressive strength. However, there were some special cases, for instance: When the porosity of A (1300 °C, 120 min, 5 °C/min) was greater than that of B (1200 °C, 180 min, 7.5 °C/min), the compressive strength of B was less than A. This phenomenon could be explained from the perspective of aperture size. Based on the statistics of the sample pore size, the largest pore area ratio of A and B was 0.12% and 0.69%, respectively. As we all known, even when the porosity was reduced to a very low level (<0.1%), the occurrence of extremely sized pores can still exhibit significant impact on the mechanical properties [1]. Moreover, stress concentration was more likely to occur around the macropores, which leads to crack initiation and fracture, this was the reason the compressive strength of A was greater than of B.

3.3. Properties Analysis

Figure 7 showed the compression curves of PM TC4 alloy when sintered at different conditions. Obviously, the compressive strength increased significantly with the increase of sintering temperature. The hardness value was determined by the initial plastic deformation resistance and the continuous plastic deformation resistance. The higher the strength of the material, the higher the resistance to plastic deformation of the material, so there was a correlation between strength and hardness. As shown in Table 3, when the sintering temperature rise from 1100 °C to 1300 °C, the compressive strength and the microhardness increased from 1100 MPa to 1387 MPa and from 209 HV to 361 HV, respectively, which was mainly due to the decrease of porosity of these samples after sintering (Figure 6). Besides, when the sintering temperature and heating rate remain unchanged, the corresponding compression ratio decreased from 0.33 to 0.265 with the increase of the holding time (Table 3), the compression ratio was defined as the ratio of the deformation of the material after yielding to the initial length. This was mainly because when the sintering temperature was 1300 °C, the alloying elements have enough activation energy to complete the diffusion in a short time, which reduced the synergistic effect of plastic deformation between the grains, thus resulting in a significant decrease in the plasticity of PM TC4 alloy [28].

3.4. Model Analysis

3.4.1. ANOVA (Analyze of Variance)

To find out the influence of sintering parameters on the properties of PM TC4 alloy, an ANOVA (analyze of variance) was carried out. Basically, when the p value (the significance probability) of each input responds in Table 4 were less than 0.05, the influence factor was significant. In addition, the value of R-sq was employed to judge the reliability of the model, which was determined by the equation: R-sq = SSR/SST (SSR: Sum of squares of the regression, Total sum of squares). Moreover, the closer the R-sq value was to 100%, the higher correlation of input response and output response derived by the regression equation. More importantly, the value of R-sq should be greater than 80% to ensure the correlation of input response and output response. In addition, the reliability of the analyzed data was tested by residual analysis.
For density, according to the results of ANOVA in Table 5, the p values of Hr, Ht × Ht, Hr × Hr, St × Hr and St × Ht were greater than 0.05, indicating that the influence of these parameters could be neglected. Then, the regressive equation could be rewritten as Equation (1):
Density   =   1578 + 8.593 × St + 1.276 × Ht 0.03128 × St × St + 0.0299 × Ht × Hr
The R-sq value of this equation was 99.51% (Table 5), which showed that the input response and density were highly correlated. In addition, the contribution rate of St to the sintering density was about 86.54% (Figure 8), indicating that St was the most significant influence for sintering density.
For compression ratio, the p values of Hr, Hr × Hr, St × St, Hr × Ht and St × Hr were higher than 0.05, indicating that the influence of these parameters should be neglected. Then, the regressive equation could be rewritten as Equation (2)
Compression   Ratio   =   0.359 + 0.0006 × St + 0.005103 × Ht 0.000005 × Ht × Ht 0.000003 × St × Ht
The R-sq value of the model shown in Table 5 was 83.16%, indicating that the input response and compression ratio were highly correlated. Besides, the contribution rate of Ht to the compression ratio was about 89.35% (Figure 8), indicating that Ht was the most important factor for compression ratio.
For compressive strength, the p values of Ht, Hr, Hr × Hr, Ht × Ht, St × Hr and St × Ht were higher than 0.05, which the influence of these parameters should be neglected. Then, the regressive equation could be rewritten as Equation (3)
Compressive   Strength   =   4876 + 8.16 × St 0.3 × Hr 0.003 × St × St 0.075 × Ht × Hr
The R-sq value of this model shown in Table 5 was 98.9%, indicating that the input response and compressive strength were highly correlated. As shown in Figure 8, the contribution rate of St to the compression ratio was about 95.5%, which represented that St was the most important factor for compressive strength.
According the normal probability plot for process parameters in Figure 9, the experiments data in the plot (Figure 9) was able to generated straight line, which mean the residuals were in normal distribution. Therefore, the plot proved that the assumptions of the model were correct and the data was reliable.

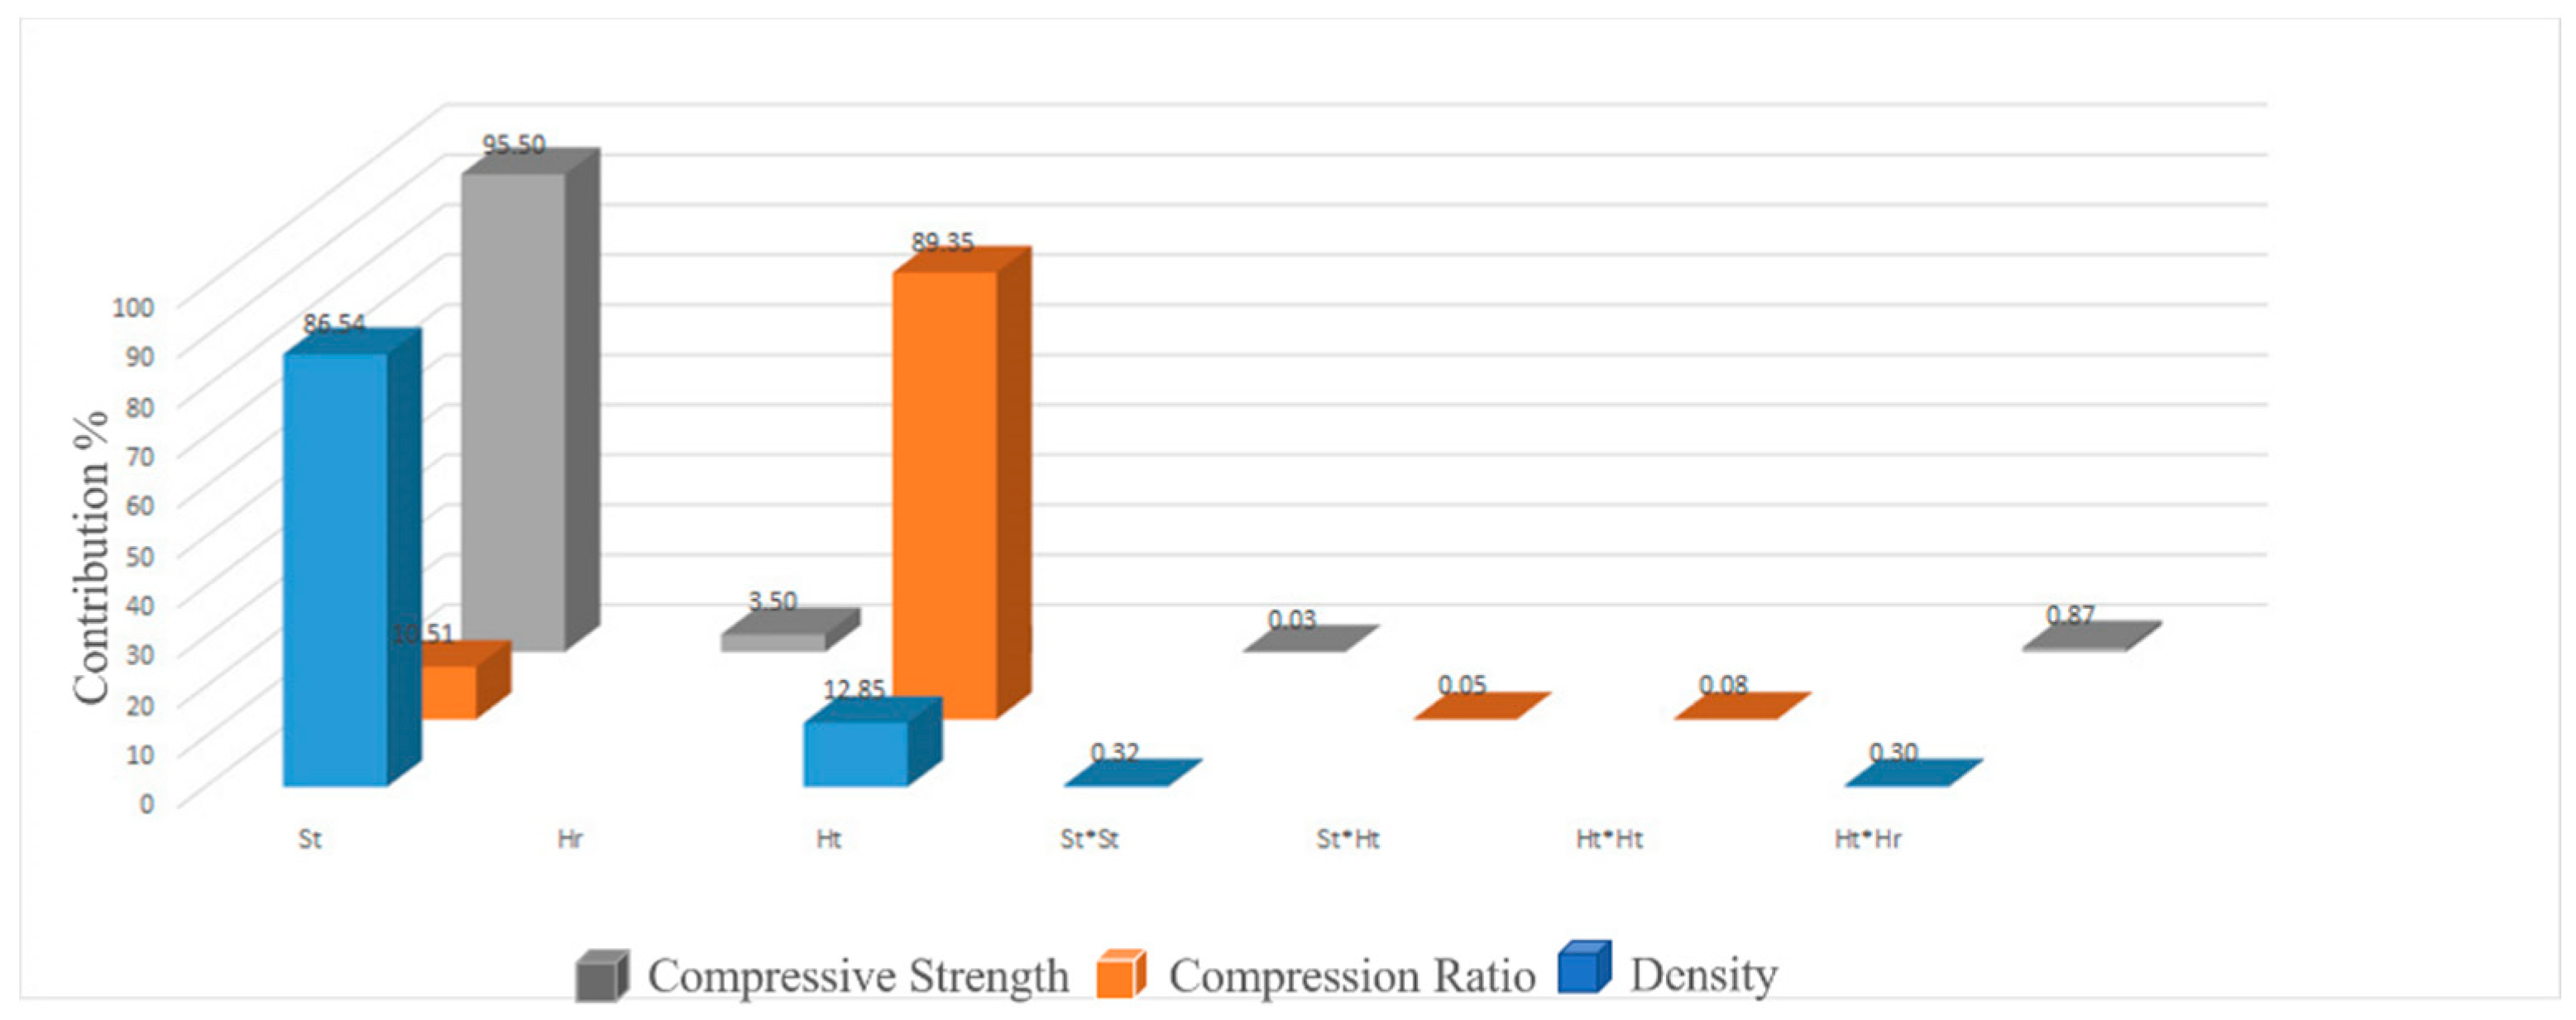
3.4.2. Variables Analysis

To illustrate the effect of sintering parameters (St, Ht, Hr) on compressive strength, density, and compression ratio, the change between the output responses (compressive strength, density, compression ratio) and sintering variables should be analyzed systematically. As shown in Figure 10a1–a3, the influence of heating rate on compressive strength, compression ratio and sintered density could be neglected, which was also consistent with the results of the quadratic regression equations (Equations (1)–(3)). As shown in Figure 10b1,b3, when the holding time reached 180 min, the increase of holding time would not promote the increase of sintering density and compressive strength. However, as shown in Figure 10b2, the compression ratio of powder metallurgy TC4 alloy decreases sharply with the extension of holding time, which was mainly due to the fact that the change of sintered density begun to slow down at the end of sintering process. At this time, the extension of holding time would lead to the coarsening of β grain and the thickening of α clusters, which results in the degradation of mechanical performance, especially the compression ratio. Because of compression ratio was a reflection of the ability of a metal to resist plastic deformation without breaking. When the grains were coarsened, the number of grains in a certain volume starts to decline, the slip system during plastic deformation was smaller, and the deformation could not be uniformly dispersed, which was not conducive to plastic deformation. As shown in Figure 10c1–c3, there was an almost linear relationship between sintering temperature and compression ratio, sintering density. Therefore, sintering temperature was the important effect on compressive strength, compression ratio and sintered density. For compression ratio and sintering density, the holding time was also an important factor, while for compressive strength, the heating rate could not be neglected. The 3D surface images in Figure 11a,b showed the interaction between sintering temperature and holding time on density, compression ratio. In addition, Figure 11c showed the interaction between sintering temperature and heating rate on compressive strength. Obviously, the density and compressive strength have a more obvious response to the sintering temperature, while the compression ratio has a more obvious response to the holding time. With the increase of the sintering temperature, both the density and the compressive strength increased sharply, and the compressibility decreased dramatically with the increase of the holding time.

3.5. Optimization of Response Results

To obtain the optimal sintering parameters, the response surface analysis between the input response and the output response should be systematically investigated, and the optimization results are shown in Figure 12. Obviously, the optimal parameters could be determined to be 1300 °C, 148 min, and 5 °C/min, and the corresponding mechanical performance could be predicted as: sintered density, compression ratio and compressive strength of 4330 kg/m3, 0.326 and 1370 MPa, respectively. According to previous studies [31,33,34], the density of TC4 alloy prepared by traditional vacuum sintering technology is mostly between 94–97%, therefore, the optimized sintering parameters achieved the purpose of improvement. To verify the accuracy of the prediction, a verification experiment should be carried out under the optimal parameters. As shown in Table 6, the sintered density, compression ratio and compressive strength of the sintered sample were 4332 kg/m3, 0.310 and 1388 MPa, respectively. The deviations between the experimental results and the predicted values also could be seen in Table 6. Therefore, the experimental results were in good agreement with the predicted results, which proves the reliability of the optimization results.

4. Conclusions

The optimum sintering parameters could be obtained based on the results of ANOVA and response surface analysis, and the influence of sintering parameters on element diffusion, pore distribution and mechanical properties of PM Ti6Al4V was systematically studied. The main conclusions were as follows:
(1)
Sintering temperature was noted to be the most significant of compressive strength and sintering density, which contributed to 95.5% and 86.54%, respectively.
(2)
Holding time has the most significant effect on the compression ratio of PM Ti6Al4V alloy, which contributed to 89.35%.
(3)
Sintering temperature has the greatest influence on element diffusion. When the sintering temperature was 1100 °C, there was a phenomenon of uneven diffusion of the alloy elements in the sample, yet alloying elements were basically uniformly diffused when the sintering temperature rises to 1200 °C.
(4)
Through the analysis of response surface, the optimum sintering parameters can be considered to be St of 1300 °C, Ht of 148 min, and Hr of 5 °C/min.
(5)
Since the R-sq values of Equations (1)–(3) reaches 99.51%, 83.16% and 98.9%, respectively, and the residuals were normally distributed. It could be determined that the correlation of input response and output response, and the assumptions of the model were correct and the data was reliable.

Author Contributions

All authors contributed to the study conception and design. J.X.: experimental design and operation, data analysis, writing-original draft, investigation. S.L.: scientific discussion, writing revision and provided guidance, all authors have reviewed the paper. B.Z.: material preparation, experimental design and scientific discussion, all authors have reviewed the paper. Y.C.: project administration, supervision, writing-review, conceptualization, formal analysis, methodology. All authors have read and agreed to the published version of the manuscript.

Funding

This research was funded by Technological breakthroughs in technological achievements of titanium powder metallurgy products (No. 2018CDPZH-2).

Institutional Review Board Statement

Not applicable.

Informed Consent Statement

Not applicable.

Data Availability Statement

Data are available from the corresponding author on reasonable request.

Acknowledgments

The authors gratefully acknowledge the financial support from the Science and Technology Support Program of Pan Zhi Hua Government (No. 2018CDPZH-2).

Conflicts of Interest

The authors declare that they have no known competing financial interests or personal relationships that could have appeared to influence the work reported in this paper.

References

  1. Kumar, P.; Ravi Chandran, K.S. Strength-Ductility Property Maps of Powder Metallurgy (PM) Ti-6Al-4V Alloy: A Critical Review of Processing-Structure-Property Relationships. Metall. Mater. Trans. A 2017, 48, 2301–2319. [Google Scholar] [CrossRef]
  2. Chen, W.; Yamamoto, Y.; Peter, W.H.; Clark, M.B.; Nunn, S.D.; Kiggans, J.O. The Investigation of Die-pressing and Sintering Behavior of ITP CP-Ti and Ti-6Al-4V powders. J. Alloys Compd. 2012, 541, 440–447. [Google Scholar] [CrossRef]
  3. Yang, H.E.; Wang, Y.; Liu, H. The Development and Application of Overview of Titanium Alloy. Equip. Manu. Technol. 2014, 10, 160–161. [Google Scholar]
  4. Xu, X.Y.; Liu, G.R.; Nash, P. Sintering Mechanisms of Blended Ti6Al4V Powder from Diffusion path Analysis. J. Mater. Sci. 2014, 49, 994–1008. [Google Scholar] [CrossRef]
  5. Li, H.Y.; Li, X.K.; Rong, Y.M.; Liu, X.L. Machinability Comparison of Laser Solid Forming (LSF) and Forging TC4 Alloys. Mater. Sci. Forum 2014, 800–801, 26–31. [Google Scholar] [CrossRef]
  6. Nan, H.; Xie, C.M. The Application & Development of Cast Titanium Alloys and Their Castings Abroad. China Foundry Mach. Technol. 2003, 2, 239–245. [Google Scholar]
  7. Williams, J.C. Alternate Materials Choices-Some Challenges to the Increased Use of Ti Alloys. Mater. Sci. Eng. A 1999, 263, 107–111. [Google Scholar] [CrossRef]
  8. Yuan, G.S.; Yan, L.P.; Han, Y.Y. Application Progress of Titanium Alloy. Hot Working Technol. 2017, 46, 13–16. [Google Scholar]
  9. Shi, K.; Shan, D.B.; Xu, W.C.; Lu, Y. Near Net Shape Forming Process of a Titanium Alloy Impeller. J. Mater. Process. Technol. 2007, 187–188, 582–585. [Google Scholar] [CrossRef]
  10. Ma, G.Y.; Li, C. Performance and Application Characteristic of Titanium and Titanium alloy Equipment. Chem. Equip. Technol. 2006, 27, 55–58. [Google Scholar]
  11. Xu, W.; Brandt, M.; Sun, S.; Elambasseril, J.; Liu, Q.; Latham, K.; Xia, K.; Qian, M. Additive Manufacturing of Strong and Ductile Ti-6Al-4V by Selective Laser Melting via In-situ Martensite Decomposition. Acta Mater. 2015, 85, 74–84. [Google Scholar] [CrossRef]
  12. Vilaro, T.; Colin, C.; Bartout, J.D. As-Fabricated and Heat-Treated Microstructures of the Ti-6Al-4V Alloy Processed by Selective Laser Melting. Metall. Mater. Trans. A 2011, 42, 3190–3199. [Google Scholar] [CrossRef]
  13. Pramanik, A. Problems and Solutions in Machining of Titanium Alloys. Int. J. Adv. Manuf. Technol. 2014, 70, 919–928. [Google Scholar] [CrossRef]
  14. Vrancken, B.; Thijs, L.; Kruth, J. Heat Treatment of Ti6AI4V Produced by Selective Laser Melting: Microstructure and Mechanical Properties. J. Alloys Compd. 2012, 541, 177–185. [Google Scholar] [CrossRef] [Green Version]
  15. Barriobero-Vila, P.; Artzt, K.; Schel, N.; Siggel, M.; Gussone, J. Mapping the geometry of Ti-6Al-4V: From martensite decomposition to localized spheroidization during selective laser melting. Scr. Mater. 2020, 182, 48–52. [Google Scholar] [CrossRef]
  16. Liu, J.; Tan, M.J.; Aue, Y.; Guo, M.L.; Castagne, S.; Chua, B.W. Superplastic-like Forming of Ti-6Al-4V Alloy. Int. J. Adv. Manuf. Technol. 2013, 783–786, 607–612. [Google Scholar] [CrossRef]
  17. Cominotti, R.; Gentili, E. Near Net Shape Technology: An Innovative Opportunity for the Automotive industry. Robot CIM-INT Manuf. 2008, 24, 722–727. [Google Scholar] [CrossRef]
  18. Moxson, V.S.; Baburaj, E.G.; Oleg, S. Production and Applications of Low-Cost Titanium Powder Products. Int. J. Powder Metall. 1998, 34, 127–134. [Google Scholar]
  19. Cao, F.; Chandran, K.S.R.; Kumar, P.; Sun, P.; Zak Fang, Z.G. New Powder Metallurgical Approach to Achieve High Fatigue Strength in Ti-6Al-4V Alloy. Metall. Mater. Trans. A 2016, 47, 2335–2345. [Google Scholar] [CrossRef]
  20. Wang, L.; Lang, Z.B.; Pei, S.H. Properties and Forming Process of Pre-alloyed Powder Metallurgy Ti6Al4V alloy. T. Nonferr. Metal Soc. 2007, 17, 639–643. [Google Scholar]
  21. Xu, X.Y.; Nash, P. Sintering Mechanisms of Armstrong Pre-alloyed Ti-6Al-4V powders. Mater. Sci. Eng. A 2014, 607, 409–416. [Google Scholar] [CrossRef]
  22. Ivasishin, O.M.; Anokhin, V.M.; Demidik, A.N.; Savvakin, D.G. Cost-Effective Blended Elemental Powder Metallurgy of Titanium Alloys for Transportation Application. Key Eng. Mater. 2000, 188, 55–62. [Google Scholar] [CrossRef]
  23. Tian, Y.Q.; Liang, H.; Ping, R.X. Study on Modification and Mechanism of Titanium Alloy by Die Forming and Sintering Utilizing Hydrogenated Powder. J. Aero. Mater. 2011, 31, 1–7. [Google Scholar]
  24. Wang, C.M.; Zhang, Y.N.; Xiao, S.F.; Chen, Y.G. Sintering Densification of Titanium Hydride Powders. Mater. Manu. Process 2017, 32, 517–522. [Google Scholar] [CrossRef]
  25. Sun, P.; Zark Fang, Z.G.; Koopman, M.; Xia, Y.; Paramore, J.; Ravi Chandran, K.S.; Ren, Y.; Lu, J. Phase Transformations and Formation of Ultra-Fine Microstructure During Hydrogen Sintering and Phase Transformation (HSPT) Processing of Ti-6Al-4V. Metall. Mater. Trans. 2015, 46A, 5546. [Google Scholar] [CrossRef]
  26. Tian, Y.Q.; Hou, H.L.; Ren, P.X. Structure and Properties of TC4 Alloy by Die Forming and Sintering Utilizing Hydrogenated Powder. Adv. Mater. Res. 2011, 291–294, 629–634. [Google Scholar] [CrossRef]
  27. Oh, J.M.; Heo, K.H.; Kim, W.B. Sintering Properties of Ti–6Al–4V Alloys Prepared Using Ti/TiH2 Powders. Mater. Trans. 2013, 54, 119–221. [Google Scholar] [CrossRef] [Green Version]
  28. Zhang, J.M.; Yi, J.H.; Lei, T.; Fang, Z.G. Dehydrogenation and sintering process of titanium hydride for manufacture titanium and titanium Alloy. Adv. Mater. Res. 2012, 616-618, 1823–1829. [Google Scholar] [CrossRef]
  29. Zhu, Y.L.; Yang, S.L.; Ma, L. Direct sintering of hydrogenated titanium powder and vanadium aluminum alloy powder experimental study of TC4 alloy. Sichuan Metall. 2019, 41, 28–31. [Google Scholar]
  30. Ivasishin, O.; Moxson, V. Low-cost titanium hydride powder metallurgy. In Titanium Powder Metallurgy (Science, Technology and Applications); Ma, Q., Ed.; Butterworth-Heinemann: Oxford, UK, 2015; pp. 115–148. [Google Scholar]
  31. Lu, L.; Ying, S.; Daverey, A.; Lin, G. Optimization of Photo-Fenton Process Parameters on Carbofuran Degradation using Central Composite Design. J. Environ. Sci. Health B 2012, 47, 553–561. [Google Scholar] [CrossRef] [PubMed]
  32. Singh, D.; Pandey, P.M.; Sundaram, D.K. Optimization of Pressure-Less Microwave Sintering of Ti6Al4V by Response Surface Methodology. Mater. Manu. Process 2018, 33, 1835–1844. [Google Scholar] [CrossRef]
  33. Ramirez, H.; Lampinen, J.; Vicente, M.; Madeira, L.M. Experimental Design to Optimize the Oxidation of Orange II Dye Solution using a Clay-based Fenton-like Catalyst. Am. Chem. Soc. 2008, 47, 285. [Google Scholar]
  34. Lenth, R.V. Response-Surface Methods in R, Using rsm. J. Stat. Softw. 2009, 30, 7–15. [Google Scholar]
  35. Alfeld, M.; Wahabzada, M.; Bauckhage, C.; Kersting, K.; Wellenreuther, G. Non-negative matrix factorization for the near real-time interpretation of absorption effects in elemental distribution images acquired by X-ray fluorescence imaging. J. Synchrotron Rad. 2016, 23, 579–589. [Google Scholar] [CrossRef] [PubMed]
Figure 1. The particle size distribution diagram of TH2 powder.
Metals 11 00197 g001
Figure 2. OM (a1,b1,c1) and SEM (a2,b2,c2) images of PM TC4 alloy when sintered at (a1,a2) 1100 °C, 3 h, 7.5 min/°C; (b1,b2) 1200 °C, 3 h, 7.5 min/°C; (c1,c2) 1300 °C, 3 h, 7.5 min/°C.
Metals 11 00197 g002
Figure 3. Comparison of XRD Plots for the various St at Ht of 180 min and Hr of 7.5 °C/min.
Metals 11 00197 g003
Figure 4. OM images of PM TC4 alloy when sintered at (a) 1300 °C, 120 min, 5 °C/min; (b) 1300 °C, 240 min, 5 °C/min.
Metals 11 00197 g004
Figure 5. Pore morphology and distribution of these samples when sintered at various conditions.
Metals 11 00197 g005
Figure 6. Porosity of these samples when sintered at various temperatures.
Metals 11 00197 g006
Figure 7. The compression curves of these samples when sintered at (a) 1300 °C, (b) 1200 °C and (c) 1100 °C.
Metals 11 00197 g007
Figure 8. Histogram of the contribution of St, Ht, and Hr to the performance of sintered samples.
Metals 11 00197 g008
Figure 9. Normal Probability Plot for process parameters: (a) Density; (b) Compressive strength; (c) Compression ratio.
Metals 11 00197 g009
Figure 10. Main effect plots for (a1) Hr Vs. compressive strength; (a2) Hr Vs. compression ratio; (a3) Hr Vs. density; (b1) Ht Vs. compressive strength (b2) Ht Vs. compression ratio; (b3) Ht Vs. density; (c1) St Vs. compressive strength; (c2) St Vs. density; (c3) St Vs. compression ratio.
Metals 11 00197 g010
Figure 11. 3D surface diagram of (a) density and (b) compression ratio vs. sintering temperature and holding time; (c) compressive strength vs. sintering temperature and heating rate.
Metals 11 00197 g011
Figure 12. The optimal response result graph of this experiment.
Metals 11 00197 g012
Table 1. Sintering parameter and their levels.
Level 1Level 2Level 3
Sintering parameters−10+1
Sintering Temperature110012001300
Holding Time120180240
Heating Rate57.510
Table 2. Porosity statistics of these samples when sintered at various conditions.
ConditionsPorosity
1 (1100 °C-120 min-5 °C/min)2.83%
2 (1100 °C-120 min-10 °C/min)3.9%
3 (1100 °C-180 min-7.5 °C/min)3.68%
4 (1100 °C-240 min-5 °C/min)3.19%
5 (1100 °C-240 min-10 °C/min)2.95%
6 (1200 °C-120 min-7.5 °C/min)1.78%
7 (1200 °C-180 min-5 °C/min)2.15%
8 (1200 °C-180 min-7.5 °C/min)1.49%
9 (1200 °C-180 min-10 °C/min)1.63%
10 (1200 °C-240 min-7.5 °C/min)1.87%
11 (1300 °C-120 min-5 °C/min)1.75%
12 (1300 °C-120 min-10 °C/min)0.91%
13 (1300 °C-180 min-7.5 °C/min)0.96%
14 (1300 °C-240 min-5 °C/min)1.27%
15 (1300 °C-240 min-10 °C/min)1.41%
Table 3. Performance of TC4 at different temperatures.
ConditionsCompressive Strength (MPa)Compression RatioHV
1100 °C-180 min-7.5 °C/min11000.325209
1200 °C-180 min-7.5 °C/min12790.325295
1300 °C-180 min-7.5 °C/min13870.300361
Table 4. The input factors and output results of sintering experiments.
Running SequencePoint TypeSt (°C)Ht (min)Hr (°C/min)Compression
Strength (MPa)
Density
(kg/m3)
Compression
Ratio
111100120510904106.60.310
211300120513434321.10.330
311100240511204145.30.330
411300240513904338.00.265
5111001201011014105.10.320
6113001201013814317.50.323
7111002401011134153.00.320
8113002401013574362.00.268
9-111001807.511004134.00.325
10-113001807.513874341.70.300
11-112001207.512604251.20.310
12-112002407.512704276.00.280
13-11200180512914273.90.330
14-112001801012674271.90.310
15012001807.512754262.90.325
16012001807.512624262.50.315
17012001807.512694262.80.325
18012001807.512654261.80.318
19012001807.512714262.70.326
Table 5. ANOVA results of CCDs experiments.
Compressive StrengthDensityCompression Ratio
Regression
(p value)0.0010.0010.001
DF999
(Residual error)101010
(Lack of fit and pure error)5 and 55 and 55 and 5
p-value for each response
Linear terms0.0000.0000.002
St0.0000.0000.001
Ht0.1510.0280.009
Hr0.0180.1030.934
Square terms0.0000.0000.013
St × St0.0010.0000.885
Ht × Ht0.2040.1240.004
Hr × Hr0.3990.2790.196
Interactions0.0680.0810.001
St × Ht0.5530.1200.000
St × Hr1.0000.4130.799
Hr × Ht0.0120.0430.734
Total (AdjSS)1856551165780.007412
R-sq (Adsj)98.90%99.51%83.16%
Table 6. Analysis of the verification experiments.
Compressive StrengthCompression RatioDensity
PredictActualErrorPredictActualErrorPredictActualError
1370 MPa1388 MPa1.3%0.3260.3104.9%4330 kg/m34332 kg/m30.04%
Publisher’s Note: MDPI stays neutral with regard to jurisdictional claims in published maps and institutional affiliations.

