Article

Experimental Determination of Phase Equilibria in the Na2O-SiO2-WO3 System

1
Faculty of Materials Metallurgy and Chemistry, Jiangxi University of Science and Technology, Ganzhou 341000, China
2
Sustainable Minerals Institute, University of Queensland, Brisbane 4072, Australia
*
Authors to whom correspondence should be addressed.
Metals 2021, 11(12), 2014; https://doi.org/10.3390/met11122014
Submission received: 9 November 2021 / Revised: 6 December 2021 / Accepted: 9 December 2021 / Published: 13 December 2021
(This article belongs to the Special Issue Fundamentals of Advanced Pyrometallurgy)

Abstract

:
The present study investigated phase equilibria in the Na2O-SiO2-WO3 system experimentally using high-temperature equilibration, quenching, and electron probe X-ray microanalysis (EPMA). New thermodynamic information on the Na2O-SiO2-WO3 system was derived based on the newly obtained experimental results and data from the literature. The primary phase fields of sodium metasilicate, sodium disilicate, and tridymite were determined along with the isotherms at 1073, 1173, and 1273 K. The solubilities of WO3 in SiO2, Na2Si2O5, and Na2SiO3, and the solubility of SiO2 in Na2WO4 were accurately measured using EPMA. Comparisons between the existing and newly constructed phase diagram were carried out and the differences are discussed. The phase equilibrium data will be beneficial to the future development of sustainable tungsten industries and thermodynamic modelling in WO3 related systems.

1. Introduction

Tungsten, a metal, is identified as one of the strategic and critical minerals by numerous countries, including The United States, Europe, Russia, Britain, and Australia due to its significant economic importance and supply instability [1,2,3,4]. Historically, the extraction of tungsten from ores relied on a series of hydrometallurgy processes, such as alkali digestion followed by solvent extraction and ion exchange, that consume large amounts of reagents, water, and energy [5,6,7]. Meanwhile, the difficulty of processing tungsten ores continuously raises due to the increased exploitation of primary tungsten resources, which results in a lower grade more complex in mineralogy [8]. These are key hindrances to the future of tungsten extraction processes.
Gomes et al. studied a two-phase extraction method to process tungsten minerals [9,10]. This method utilized the liquid–liquid immiscibility between sodium tungstate and silicon dioxide, which is a well-known phenomenon in glass-forming oxide systems [11]. The two-phase extraction method could light a new direction in the development of future sustainable tungsten extraction processes. Phase diagram is an essential tool to predict the crystallization path and control crystallization behaviour, which has a pivotal role in the understanding of the crystallization process [12,13,14,15]. To gain a better understanding of the two-phase extraction method, the phase diagram for the Na2O-SiO2-WO3 system needs to be studied comprehensively to provide fundamental understandings of its thermo-physical properties.
Systems containing alkali tungstate have been studied extensively. In the Na2O-WO3 system, two congruently melting compounds, Na2WO4 and Na2W2O7, and one incongruently melting compound, Na2W4O13, were identified along with two eutectic reactions [16,17,18]. The presence of Na2W6O19 was a subject of controversy, which was reported by Sakka, Chang, and Sachdev; however, this was not found by Caillet [16,17,18]. No information is available on the WO3-SiO2 binary system. Moreover, only limited literature relating to the ternary system Na2O-SiO2-WO3 has been published. Štemprok reported a Na2O-SiO2-WO3 ternary phase diagram at 1473 K, which presented a wide two-liquid immiscibility [19]. It was reported that the two-liquid field corresponds to a stable demixing of the system between silicate glass and sodium tungstate. The two liquids’ immiscible region disappears in the Na2O rich sector. Furthermore, it was reported that the presence of WO3 reduces the liquidus temperature of sodium silicates. However, the region with higher silica contents was not investigated [19]. Various homogenization techniques were carried out in the study, including repeated firing with intermittent crushing and mixing, slow cooling, and quenching. The previous study provided initial information on the Na2O-SiO2-WO3 system. However, more comprehensive studies of the system are needed due to the lack of detailed methodology, microstructure analysis, and isotherms to fill the gap.
In the present study, the phase equilibria of the Na2O-SiO2-WO3 system was investigated using the equilibration/quenching/EPMA technique from 1073 to 1273 K in air. The technique used has been proven to be efficient in acquiring high temperature equilibrium information for metallurgical slags [20]. It also can resolve some uncertainties resulting from dynamic and static methods for studying molten oxides that contain volatile materials, such as sodium and silica [21]. By applying this methodology, the change of initial bulk composition caused by the evaporation of the sodium oxide during high temperature equilibration will not affect the final liquid and solid compositions. This is because the change in the initial bulk composition will only affect the proportion of liquid and solid phases when equilibrium is achieved. The determined phase equilibrium data will be beneficial to the future development of sustainable tungsten industries and for scientific interests, especially for thermodynamic modelling studies where limited thermodynamic data have been reported on WO3-containing systems.

2. Experimental

The phase equilibrium investigation was carried out using the typical melting-holding-quenching method [22,23]. The samples were prepared by mixing the required amounts of chemicals thoroughly in an agate mortar for 30 min. Chemicals used to prepare the sample were powders of SiO2 (99.9 wt% Sigma-Aldrich, Missouri, MO, USA), Na2CO3 (>99.0 wt%, Sigma-Aldrich, Missouri, MO, USA), and WO3 (99.9 wt%, Sigma-Aldrich, Missouri, MO, USA). The Na2CO3 powder was dried in an oven at 473 K for at least 48 h to remove any moisture prior to sample preparation. After mixing, the mixture was pelletized and placed in a platinum envelope. Approximately 0.2 g of pelletized sample was used in each equilibration experiment.
Equilibration experiments were carried out in a vertical tube furnace with lanthanum chromate heating elements (supplied by Pyrox Thermique Matériaux, Rambouille, France). A B-type thermocouple (Pt-30% Rh/Pt-6%) was placed in an alumina sheath next to the crucible located in the hot zone of the furnace to accurately measure and monitor the temperature during the experiments. The thermocouple was periodically calibrated against a standard thermocouple (supplied by the National Measurement Institute of Australia) to ensure the temperature accuracy within ±2 K. A schematic view of the vertical furnace setup is shown in Figure 1. The platinum envelope that contained the pelletized sample was held in the furnace using a FeCrAl wire (0.5 mm diameter). Samples were inserted from the bottom of the furnace, then raised and kept in the furnace hot zone for the desired period. After equilibration, the samples were dropped directly into mineral oil to achieve rapid quenching. The mineral oil was refrigerated at 263 K (−10 °C) for three hours to ensure the retaining of glassy phase by achieving rapid quenching. Water was not selected as quenching media due to the solubilities of sodium tungstate and other sodium oxide compounds. The quenched samples were washed carefully with ethanol, dried, and mounted in epoxy resin and polished for electron probe X-ray microanalysis (EPMA).
Carbon coater JEOL (Japan Electron Optics Ltd. * JEOL is a trademark of Japan Electron Optics Ltd., Tokyo, Japan) was used to apply a carbon coat on the surface of the polished samples prior to electron microscopic examination. JEOL JXA-8200 EPMA (Japan Electron Optics Ltd., Tokyo, Japan) with wavelength dispersive detectors was used to analyse the microstructures and phase compositions of the quenched samples. EPMA was conducted at an accelerating voltage of 15 kV and a probe current of 15 nA. The ZAF (Z is atomic number correction factor, A is absorption correction factor, and F is fluorescence correction factor) correction procedure supplied with the electron-probe software was applied. Overall, the measurements of EPMA have an average accuracy within ±1 wt% [24]. In general, 10–20 and 5–10 measurements were performed for the liquid and solid phases, respectively, at different areas of the samples. The homogeneities of compositions in the phases indicate that the sample reached equilibrium. Only the compositions with standard deviations less than 1 wt% were used in the construction of the phase diagram.

3. Results and Discussion

3.1. Determination of Equilibration Time

At the beginning of the study, suitable equilibration times were determined to ensure that the equilibrium state was achieved in all experiments. The time needed to reach equilibrium is affected by the mass transfer in the sample. Hence, achieving equilibrium in the liquid phase with high viscosity is directly influenced by the low molecule transportation rate. Both composition and temperature can influence liquid viscosity. In general, the liquid phase with high SiO2 content is considered as highly viscous. In the present study, we investigated the equilibration time for samples in selected primary phase fields with high SiO2 content in the liquid phase at relatively low temperatures. The appropriate equilibration time was determined by examining the compositional homogeneity using EPMA when the equilibration time was prolonged. Samples with identical initial composition were held at different temperatures and durations. Three phases were observed from the microstructures of the quenched sample that was held for 24 h at 1073 K, indicating the 24 h was not sufficient to allow the samples to reach equilibrium. As a result, the equilibration time at 1073 K was increased to 72 and 168 h. Table 1. shows the comparisons of the samples held for 72 and 168 h at 1073 K, and 24 and 72 h at 1173 K and 1273 K respectively. It can be seen from the table that the phases present in the samples with the same initial composition and different equilibration time are close. The results of the samples in the SiO2 primary phase field demonstrated that equilibrium was achieved within 72 h at 1073 K, and 24 h at 1173 and 1273 K.

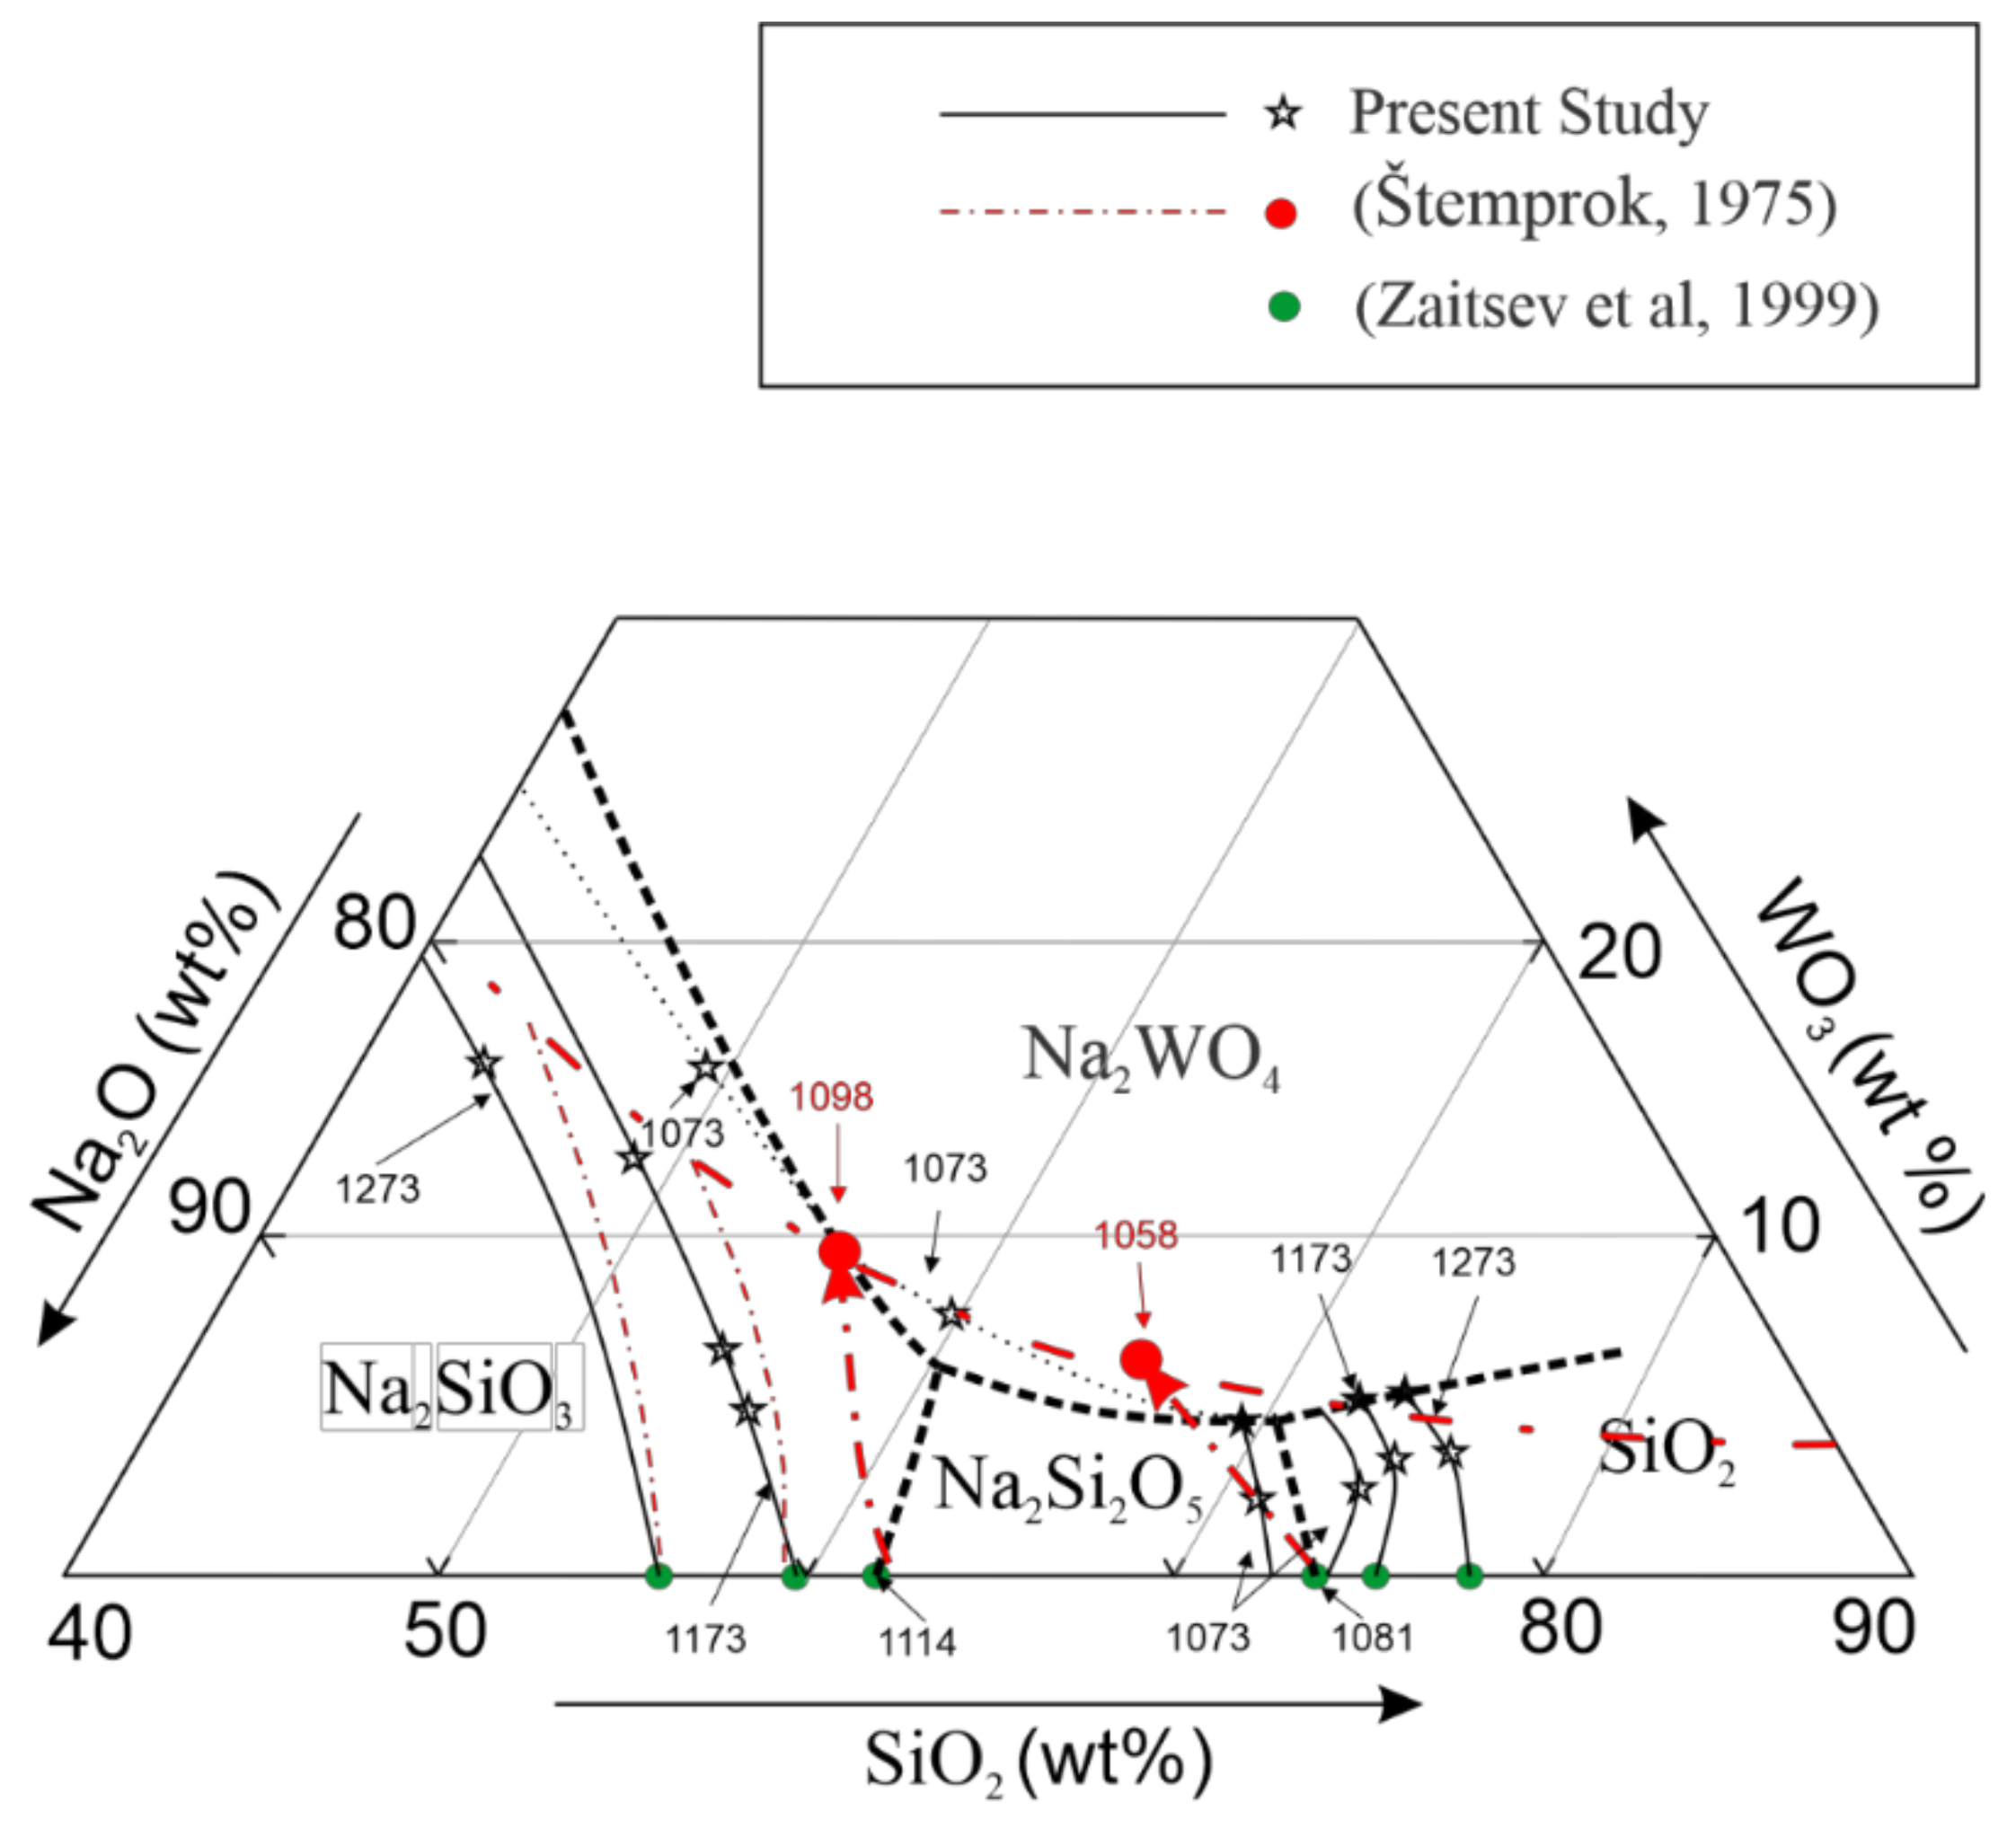
3.2. Description of the Ternary Phase Diagram

Over 50 experiments were conducted in the Na2O-SiO2-WO3 system targeting the two-phase immiscibility region and adjacent primary phase fields at fixed temperatures of 1073, 1173, and 1273 K. Some experimental results were found in fully liquid condition. Four primary phases were identified in the composition range investigated, including Na2SiO3, Na2Si2O5, SiO2, and Na2WO4. The present results indicate that the phase relationships in the SiO2-rich region appear to be more complex than that in the previous investigation [19]. Typical microstructures observed in the quenched samples are presented in Figure 2. Figure 2 shows the equilibrium of liquids with (a) sodium metasilicate (Na2SiO3), (b) sodium disilicate (Na2Si2O5), (c) tridymite (SiO2), and (d) liquid sodium tungstate (Na2WO4). It can be seen from Figure 2d that the sodium tungstate liquid separated from the silicate glass (liquid) and settled on the bottom of the Pt envelope, due to its high density. Furthermore, the phase boundaries in the phase diagram were identified by determining the composition of the liquid phase co-existing with the two solid/liquid phases. Figure 3 shows the microstructures where the liquid was in equilibrium with two other phases, (a) tridymite and sodium tungstate, and (b) sodium disilicate and sodium tungstate. From the microstructures of both samples, the formation of drop-like segregated sodium tungstate liquids against the silicate glass (liquid) and crystals, due to the high viscosity of the silicate glass, were observed.
The compositions of the solid and liquid phases in the quenched samples analysed by EPMA that were used to construct the isotherms and phase boundaries of the ternary phase diagram are listed in Table 2. The initial compositions of the experiments shown in Table 2 are summarized in Table 3. It can be seen from Table 2 that up to 0.5 wt% WO3 is present in the sodium metasilicate and tridymite. WO3 in the sodium disilicate is only 0.2 wt%. SiO2 in the sodium tungstate is less than 0.1 wt%. The melting points and crystal structures of the solids present in the phase diagram are summarized in Table 4. Measuring the compositions of the liquid and solid phases using the equilibration-quenching technique has one of the greatest advantages: the measured phase compositions are not affected by starting compositions and changes during equilibration. The phase diagram of Na2O-SiO2-WO3 system is constructed from the experimental results, and the isotherms at 1073, 1173, and 1273 K are determined. The construction was based on the ascertained information on the phase equilibria. Information from the well-established binary Na2O-SiO2 system is also presented on the ternary phase diagram, and used to construct the diagram by connecting the liquidus to the Na2O-SiO2 binary. The hollow dots represent the liquidus obtained from the Na2O-SiO2 system reported by Santoso and Taskinen [21] and Zaitsev et al. [25]. In the targeting region of the phase diagram (40–100 wt% SiO2, 40–60 wt% Na2O, and 0–20 wt% WO3), four primary phase fields (sodium metasilicate, sodium disilicate, sodium tungstate and tridymite) were identified at the temperature ranging 1073–1273 K. It can be seen from Figure 4 that, sodium metasilicate and tridymite occupy extraordinarily large primary phase fields in the studied area. As the SiO2 content increased from 40 to 73.4 wt%, the sodium metasilicate gradually dissolves in the slag, and the sodium disilicate starts to precipitate. Meanwhile, the boundary of the demixing region of the two immiscible liquids enters into the low-WO3 region. The solubility of the WO3 in the liquid decreases until it reaches the tridymite primary phase field by continuously increasing the SiO2 content.
Table 2. Na2O-SiO2-WO3 system analysed by EPMA.
Sample NumberTemperature (K)PhaseComposition (wt%)
Na2OSiO2WO3
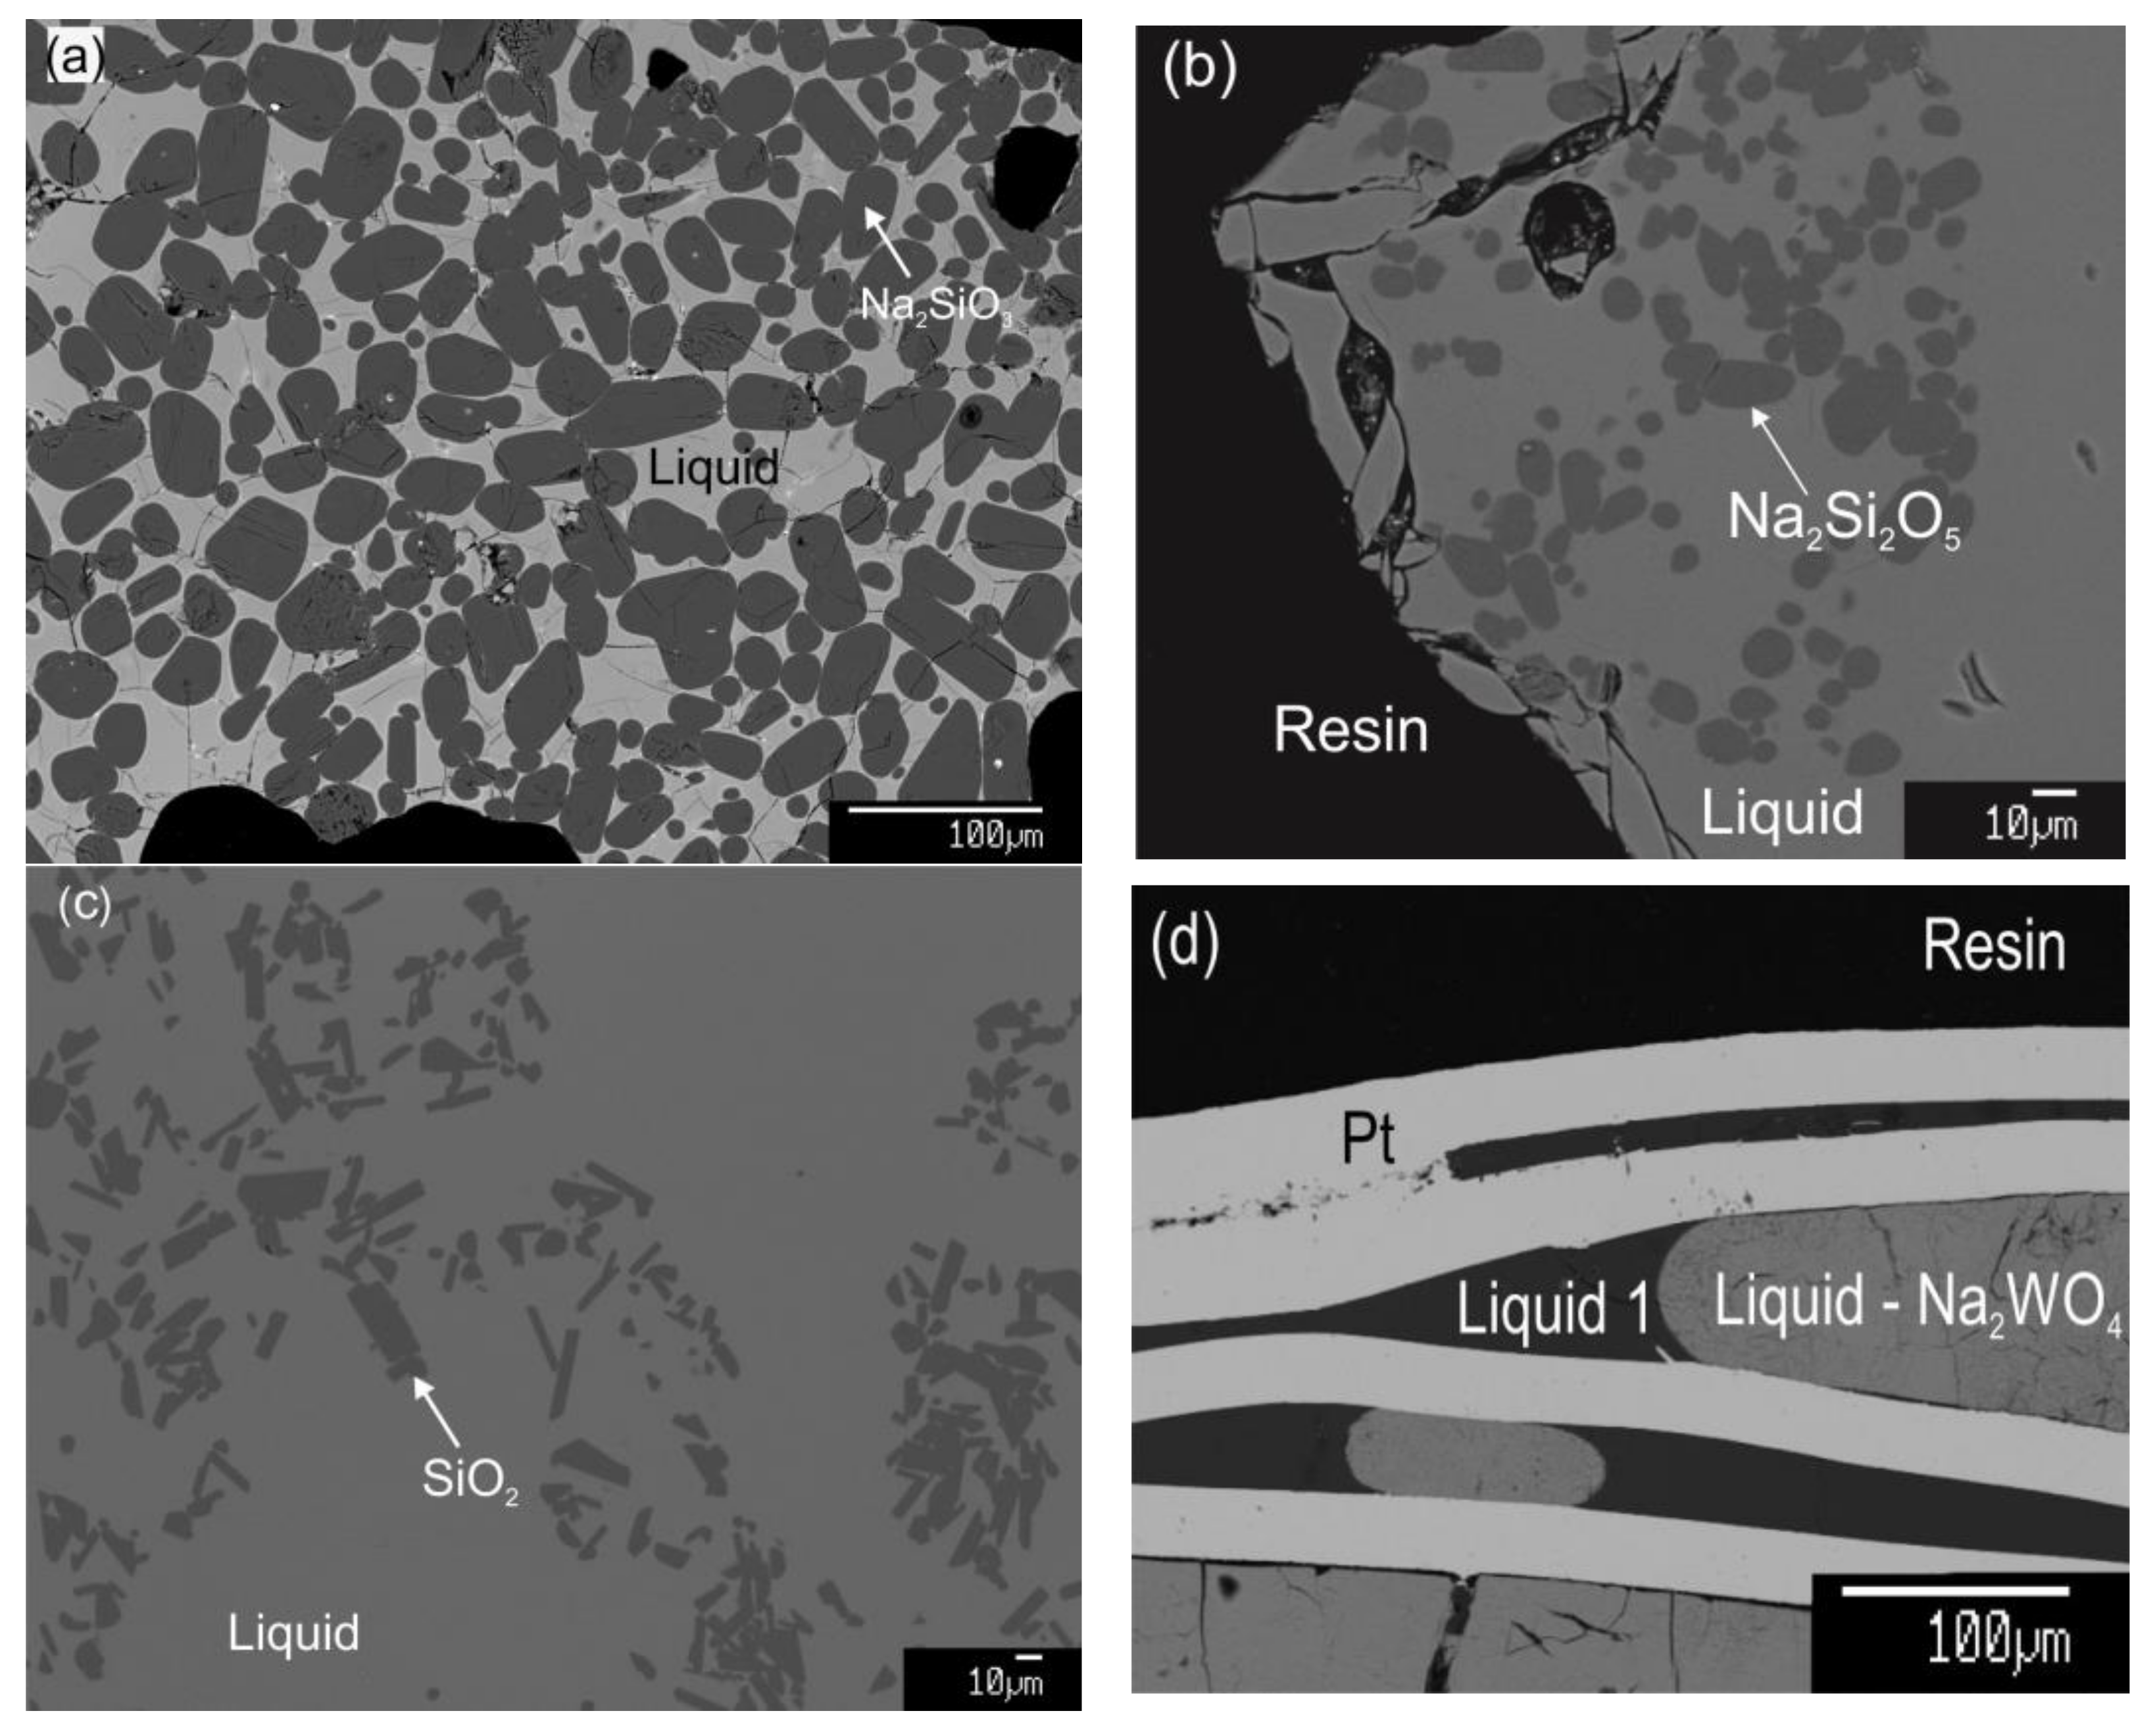
Sodium metasilicate primary phase field
WE11073Na2SiO350.149.40.5
Liquid37.548.813.7
WE21173Na2SiO350.549.20.3
Liquid38.756.15.2
WE31173Na2SiO350.649.20.2
Liquid38.254.47.4
WE41173Na2SiO350.649.10.3
Liquid37.948.913.2
WE51273Na2SiO350.249.30.5
Liquid38.943.018.1
Sodium disilicate primary phase field
WE61073Na2Si2O532.8670.2
Liquid26.471.12.5
Tridymite primary phase field
WE71073SiO20.199.9n.d
Liquid23.573.72.8
WE81173SiO20.399.60.1
Liquid22.174.23.7
WE91273SiO20.399.60.1
Liquid20.575.63.9
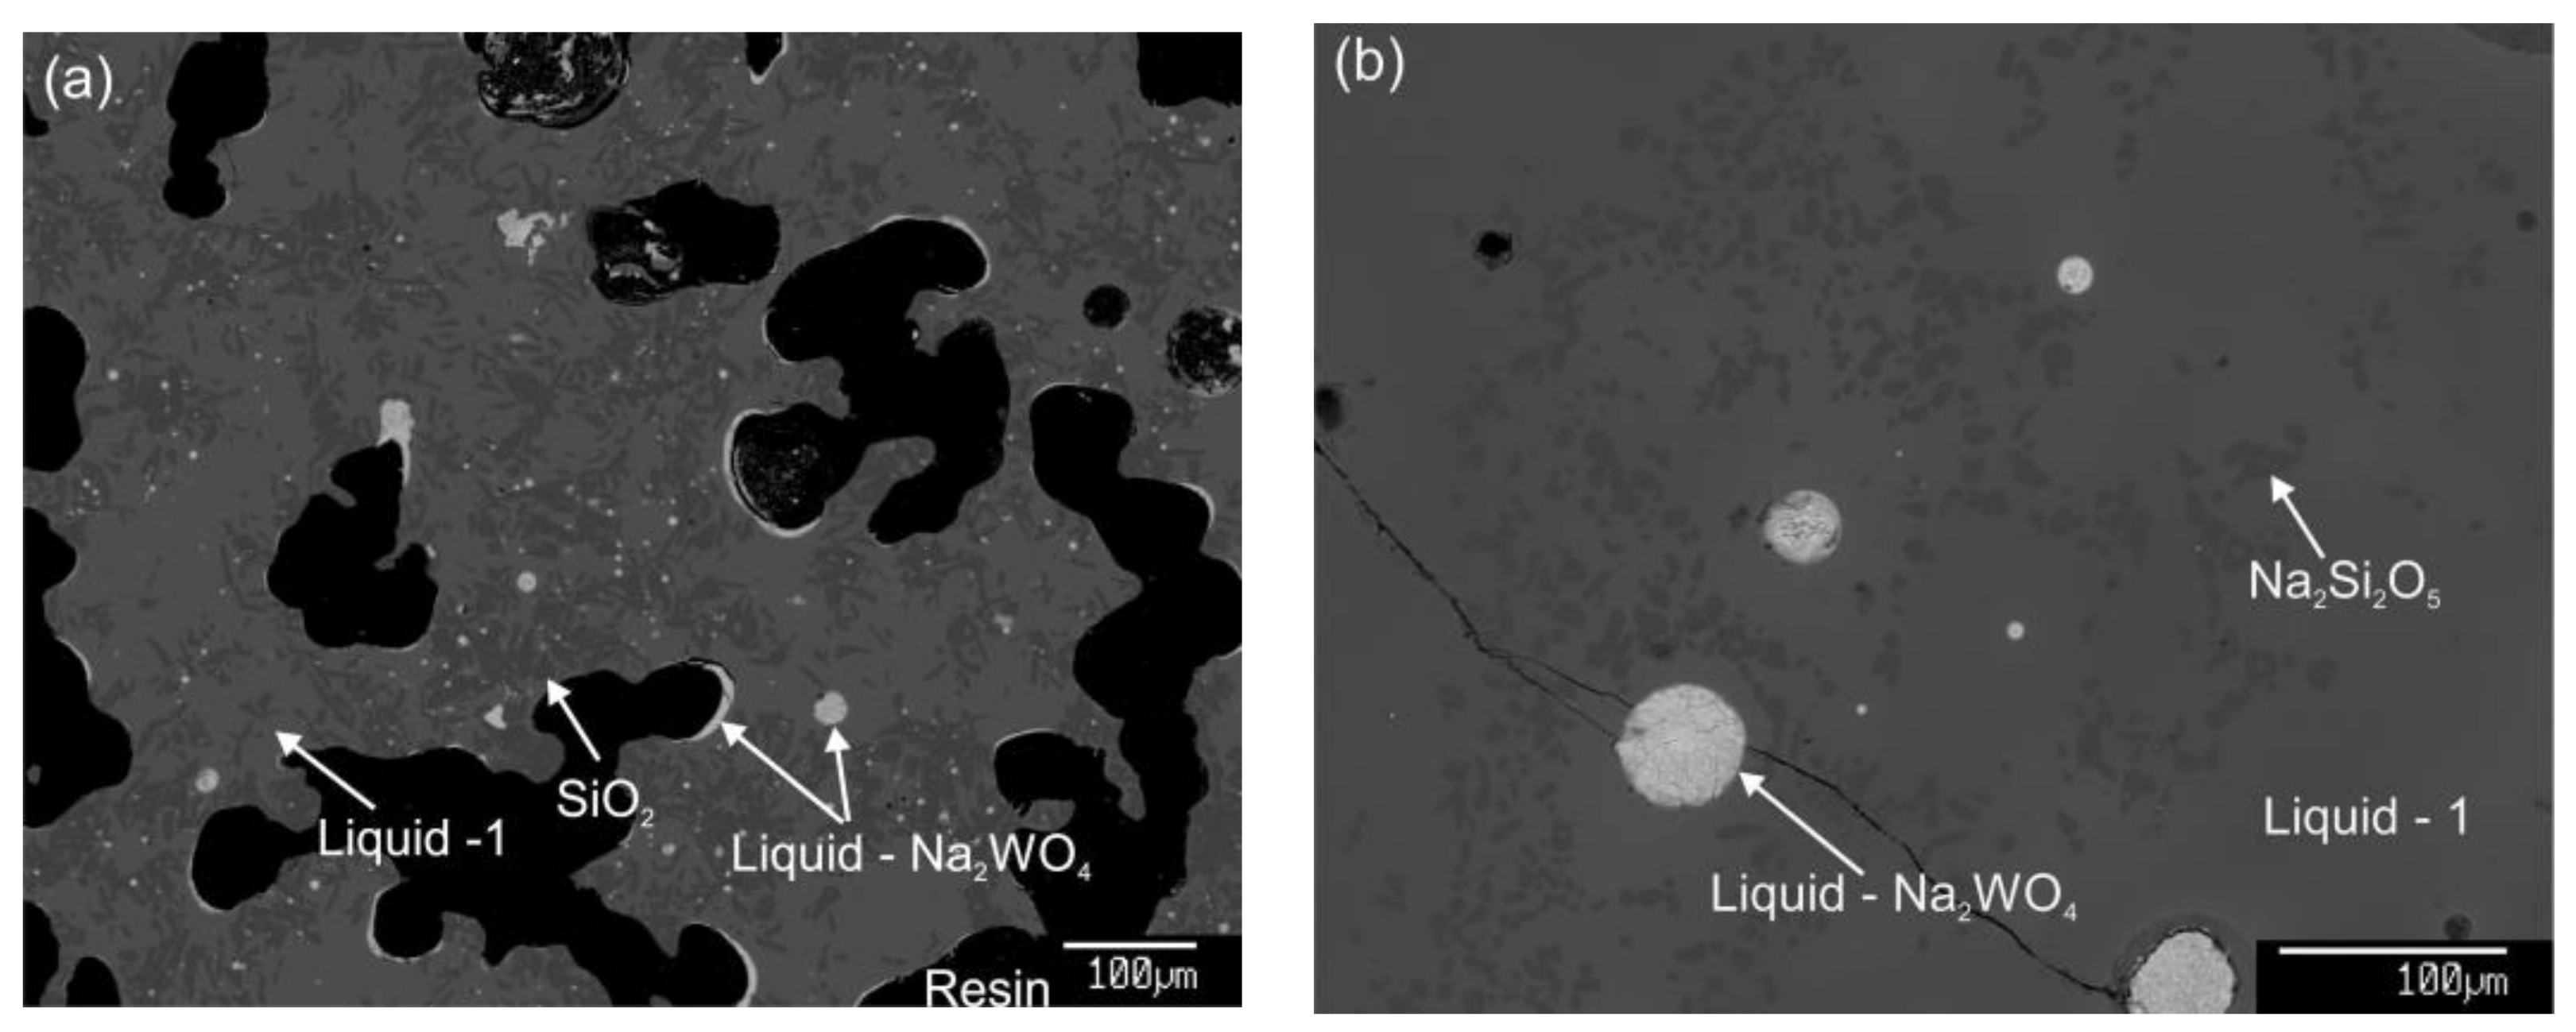
Sodium tungstate two immiscible liquid region
WE101073Liquid -Na2WO420.1n.d79.9
Liquid -132.859.77.5
Phase boundary
WE111073Liquid -125.469.54.1
Liquid -Na2WO420.2n.d79.8
Na2Si2O532.967.10.2
WE121173Liquid -122.172.35.6
Liquid -Na2WO420.1n.d79.9
SiO20.199.40.5
WE131273Liquid -120.573.56.0
Liquid -Na2WO420.4n.d79.6
SiO20.299.50.3
Only one liquid phase exists
WE141073Liquid28.466.35.3
WE151173Liquid36.853.89.4
WE161173Liquid24.071.34.7
WE171173Liquid26.368.55.2
WE181273Liquid40.648.710.7
Table 3. Experimental conditions for investigating the Na2O-SiO2-WO3 system.
Sample NumberTemperature (K)Composition (wt%)
Na2OSiO2WO3
WE1107325705
WE2117340555
WE3117338548
WE4117342499
WE5127342.542.55
WE6107327703
WE7107317803
WE8117317803
WE9127317803
WE101073335710
WE11107327658
WE12117315796
WE13127315796
WE14107330655
WE151173355015
WE16117325705
WE17117330655
WE18127342499
Table 4. Properties of the crystalline solids present in the ternary phase diagram.
Crystalline SolidStructureMelting Temperature (K)Ref.
Na2SiO3Tetragonal1361[26,27]
Na2Si2O5Tetragonal1143[28]
SiO2Tetragonal1984[29,30,31]
Na2WO4Spinel971[32,33]
Figure 4. Newly determined isotherms at 1073 K (800 °C), 1173 K (900 °C), and 1273 K (1000 °C) for the ternary phase diagram in the Na2O-SiO2-WO3 system 25; faint dotted line: estimated liquidus.
Metals 11 02014 g004

3.3. Comparisons with the Existing Ternary Phase Diagram

The data reported by Štemprok [19] are extracted and shown in the phase diagram for comparison with the present results in Figure 5. It can be seen from the figure that Štemprok reported the same primary phase fields. However, isotherms were only reported in the sodium metasilicate primary phase field. The isotherms in the other primary phase fields were not reported in his study. It can be seen from Figure 5 that the size of the Na2SiO3 primary phase field determined in the present study is larger than that reported by Štemprok. In contrast, the size of the Na2Si2O5 primary phase field determined in the present study is smaller than that reported by Štemprok. The temperature of the eutectic point joining the Na2SiO3, Na2Si2O5, and Na2WO4 primary phase fields is below 1073 K in the present study, which is lower than that (1098 K) reported by Štemprok. The experimental points and the isotherms in the primary phase fields of SiO2, Na2Si2O5, and Na2WO4 fill the gaps not reported by Štemprok [19].
Due to the limitations in the methodologies and techniques used in previous studies, large deviations were observed while comparing previously reported data with the present measurements. To the best of our knowledge, FactSage cannot calculate the liquidus temperatures for the Na2O-WO3 containing systems due to a lack of reliable experimental data. It is believed that the present study is beneficial for the further construction and optimization of thermodynamic modelling by fulfilling the FactSage database with this Na2O-SiO2-WO3 ternary system.

4. Conclusions

New phase equilibria information for the Na2O-SiO2-WO3 system were determined experimentally. A phase diagram targeting a high silica and low tungsten region (40–100 wt% SiO2, 40–60 wt% Na2O, and 0–20 wt% WO3) was constructed with isotherms of 1073, 1173, and 1273 K. The solubilities of WO3 in SiO2, Na2Si2O5, and Na2SiO3, and the solubility of SiO2 in Na2WO4 were accurately measured using EPMA. The newly established phase diagram was compared with the existing data and phase diagram. The present study provides valuable information for the future development of the thermodynamic database and development of tungsten extraction technology.

Author Contributions

Conceptualization, B.Z.; methodology, K.S. and X.M.; validation, K.S.; formal analysis, B.Z. and K.S.; investigation, K.S.; resources, X.M.; writing—original draft preparation, K.S.; writing—review and editing, B.Z., K.S. and X.M.; supervision, B.Z. and X.M. All authors have read and agreed to the published version of the manuscript.

Funding

This research received no external funding.

Institutional Review Board Statement

Not applicable.

Informed Consent Statement

Not applicable.

Data Availability Statement

Not applicable.

Acknowledgments

The authors would like to thank the financial support from Jiangxi University of Science and Technology through the joint laboratory on high-temperature processing. The authors acknowledge the facilities, scientific, and technical assistance of the Australian Microscopy and Microanalysis Research Facility at the Centre for Microscopy and Microanalysis, The University of Queensland.

Conflicts of Interest

The authors declare no conflict of interest.

References

  1. US Department of Defense. Strategic and Critical Materials 2013 Report on Stockpile Requirements; Office of the Under Secretary of Defense, US Department of Defense: Washington, DC, USA, 2013; p. 189.
  2. European Commission. Report on Critical Raw Materials for the EU; European Commission: Brussels, Belgium, 2014; pp. 1–37. [Google Scholar]
  3. Skirrow, R.G.; Huston, D.L.; Mernagh, T.P.; Thorne, J.P.; Duffer, H.; Senior, A. Critical Commodities for a High-Tech World: Australia’s Potential to Supply Global Demand; Geoscience Australia: Canberra, Australia, 2013. [Google Scholar]
  4. Fortier, S.M.; Nassar, N.T.; Lederer, G.W.; Brainard, J.; Gambogi, J.; McCullough., E.A. Draft Critical Mineral List—Summary of Methodology and Background Information—US Geological Survey Technical Input Document in Response to Secretarial Order No. 3359; U.S. Geological Survey: Washington, DC, USA, 2018; Volume 15. [CrossRef] [Green Version]
  5. Trasorras, J.R.L.; Wolfe, T.A.; Knabl, W.; Venezia, C.; Lemus, R.; Lassner, E.; Schubert, W.D.; Lüderitz, E.; Wolf, H.U. Tungsten, tungsten alloys, and tungsten compounds. In Ullmann’s Encyclopedia of Industrial Chemistry; Wiley: New York, NY, USA, 2016; pp. 1–53. [Google Scholar]
  6. Yih, S.; Wang, C. Tungsten: Sources, Metallurgy, Properties, and Applications; Springer: New York, NY, USA, 1979; p. 512. [Google Scholar]
  7. Shen, L.; Li, X.; Lindberg, D.; Taskinen, P. Tungsten extractive metallurgy: A review of processes and their challenges for sustainability. Miner. Eng. 2019, 142, 105934. [Google Scholar] [CrossRef]
  8. Liu, H.; Liu, H.; Nie, C.; Zhang, J.; Steenari, B.M.; Ekberg, C. Comprehensive treatments of tungsten slags in China: A critical review. J. Environ. 2020, 270, 110927. [Google Scholar] [CrossRef] [PubMed]
  9. Gomes, J.M.; Uchida, K.; Baker, D.H. A High-Temperature, Two-Phase Extraction Technique for Tungsten Minerals; US Department of the Interior and Bureau of Mines: Washington, DC, USA, 1968; Volume 7106, pp. 1–11.
  10. Gomes, J.M.; Zadra, J.; Baker, D. Electrolytic Extraction of Tungsten from Western Scheelite; US Department of the Interior and Bureau of Mines: Washington, DC, USA, 1964; Volume 6512, pp. 1–12.
  11. James, P. Liquid-phase separation in glass-forming systems. J. Mater. Sci. 1975, 10, 1802–1825. [Google Scholar] [CrossRef]
  12. Yan, B.; Wang, X.; Yang, Z. Experimental study of phase equilibria in the MgO-SiO2-TiOx system. J. Alloys Compd. 2017, 695, 3476–3483. [Google Scholar] [CrossRef]
  13. Li, J.; Shu, Q.; Chou, K. Phase relations in CaO-SiO2-Al2O3-15 mass pct CaF2 System at 1523 K (1250 °C). Metall. Mater. Trans. B. 2014, 45, 1593–1599. [Google Scholar] [CrossRef]
  14. Shi, J.; Sun, L.; Qiu, J.; Zhang, B.; Jiang, M. Phase equilibria of CaO-SiO2-5wt% MgO-10wt% Al2O3-TiO2 system at 1300 °C and 1400 °C relevant to Ti-bearing furnace slag. J. Alloys Compd. 2017, 699, 193–199. [Google Scholar] [CrossRef]
  15. Wang, Z.; Sohn, I. Experimental determination of phase equilibria in the CaO-BaO-SiO2-12 mol pct. Al2O3-13 mol pct. MgO system at 1573 K and 1623 K. J. Am. Ceram. Soc. 2019, 102, 5632–5644. [Google Scholar] [CrossRef]
  16. Caillet, P. Composition of Alkali Tungstate-Tungstic Anhydride systems. CRH Acad. Sci. 1963, 256, 1986–1989. [Google Scholar]
  17. Sakka, S. Compound formation in Alkali Tungstate systems. Bull. Inst. Chem. Res. Kyoto Univ. 1969, 46, 300–308. [Google Scholar]
  18. Chang, L.L.Y.; Sachdev, S. Alkali Tungstates: Stability relations in the systems A2OWO3-WO3. J. Am. Ceram. Soc. 1975, 58, 267–270. [Google Scholar] [CrossRef]
  19. Štemprok, M. Geological significance of immiscibility in fused silicate systems containing tungsten and molybdenum. Int. Geol. Rev. 1975, 17, 1306–1316. [Google Scholar] [CrossRef]
  20. Jak, E.; Hayes, P.C. Phase equilibria determination in complex slag systems. Miner. Process. Extract. Metall. Rev. 2008, 117, 1, 1–17. [Google Scholar] [CrossRef]
  21. Santoso, I.; Taskinen, P. Phase equilibria of the Na2O–SiO2 system between 1173 and 1873 K. Can. Metall. Q. 2016, 55, 243–250. [Google Scholar] [CrossRef]
  22. Feng, D.; Zhang, J.; Li, M.; Chen, M.; Zhao, B. Phase equilibria of the SiO2–V2O5 system. Ceram. Int. 2020, 46, 24053–24059. [Google Scholar] [CrossRef]
  23. Wang, D.; Chen, M.; Jiang, Y.; Wang, S.; Zhao, Z.; Evans, T.; Zhao, B. Phase equilibria studies in the CaO–SiO2–Al2O3–MgO system with CaO/SiO2 ratio of 0.9. J. Am. Ceram. Soc. 2020, 103, 7299–7309. [Google Scholar] [CrossRef]
  24. Ritchie, N.; Newbury, D.; Leigh, S. Breaking the 1% accuracy barrier in EPMA. Microsc. Microanal. 2012, 18, 1006–1007. [Google Scholar] [CrossRef]
  25. Zaitsev, A.I.; Shelkova, N.E.; Lyakishev, N.P.; Mogutnov, B.M. Thermodynamic properties and phase equilibria in the Na2O-SiO2 system. Phys. Chem. Chem. Phys. 1999, 1, 1899–1907. [Google Scholar] [CrossRef]
  26. Anis, M.; Shirsat, M.D.; Hussaini, S.S.; Joshi, B.; Muley, G.G. Effect of sodium metasilicate on structural, optical, dielectric and mechanical properties of ADP crystal. J. Mater. Sci Technol. 2016, 32, 62–67. [Google Scholar] [CrossRef]
  27. Morey, G.W.; Bowen, N.L. The Binary System Sodium Metasilicate-silica. J. Phys. Chem. 1924, 29, 1167–1179. [Google Scholar] [CrossRef]
  28. You, J.; Jiang, G.; Xu, K. High temperature Raman spectra of sodium disilicate crystal, glass and its liquid. J. Non Cryst Solids 2001, 282, 125–131. [Google Scholar] [CrossRef]
  29. Ringdalen, E. Changes in quartz during heating and the possible effects on Si production. J. Oper. Manag. 2015, 67, 484–492. [Google Scholar] [CrossRef] [Green Version]
  30. Welche, P.; Heine, V.; Dove, M. Negative thermal expansion in beta-quartz. Phys. Chem. Miner. 1998, 26, 63–77. [Google Scholar] [CrossRef]
  31. Konnert, J.H.; Appleman, D.E. The crystal structure of low tridymite. Acta Crystallogr. Sect. B Struct. Sci. Cryst. Eng. Mater. 1978, 34, 391–403. [Google Scholar] [CrossRef]
  32. Dkhilalli, F.; Megdiche, B.S.; Rasheed, M.; Barille, R.; Shihab, S.; Guidara, K.; Megdiche, M. Characterizations and morphology of sodium tungstate particles. R. Soc. Open Sci. 2018, 5, 172214. [Google Scholar] [CrossRef] [PubMed] [Green Version]
  33. Weaste, R.C.; Suby, S.M.S.; Hodman, C.D. Handbook of Chemistry and Physics; CRC Press: Boca Raton, FL, USA, 1979; p. B-129. [Google Scholar]
Figure 1. A schematic view of the experimental apparatus.
Metals 11 02014 g001
Figure 2. Typical backscattered scanning electron micrographs of quenched samples in the Na2O-SiO2-WO3 system, (a) WE5—sodium metasilicate with liquid phase; (b) WE6—sodium disilicate with liquid phase; (c) WE9—tridymite with liquid phase; (d) WE10—sodium tungstate with liquid phase.
Metals 11 02014 g002
Figure 3. Typical backscattered scanning electron micrographs of the quenched samples in the Na2O-SiO2-WO3 system showing equilibrium of liquid with (a) WE13—tridymite and liquid sodium tungstate, and (b) WE11—sodium disilicate and liquid sodium tungstate.
Metals 11 02014 g003
Figure 5. Comparison of the phase diagram between the present study and previous results [19,25], temperature in K.
Metals 11 02014 g005
Table 1. Comparison of the samples with same compositions and experimental temperature equilibrated for different times in selected primary phase fields.
Temperature (K)Holding Time (h)PhaseComposition (wt%)
Na2OSiO2WO3
107372
168
Liquid23.573.72.8
Tridymite0.199.9n.d
Liquid23.473.63.0
Tridymite0.299.8n.d
117324
72
Liquid22.174.23.7
Tridymite0.399.60.1
Liquid22.274.33.5
Tridymite0.299.8n.d
127324
72
Liquid20.575.63.9
Tridymite0.399.60.1
Liquid20.475.83.8
Tridymite0.299.70.1
Publisher’s Note: MDPI stays neutral with regard to jurisdictional claims in published maps and institutional affiliations.

