Article

Corrosion Mechanism of L360 Pipeline Steel Coated with S8 in CO2-Cl System at Different pH Values

1
School of Chemistry and Chemical Engineering, Xi’an Shiyou University, Xi’an 710065, China
2
Shaanxi Oil and Gas Pollution Control and Reservoir Protection Key Laboratory, Xi’an Shiyou University, Xi’an 710065, China
3
School of Materials Science and Technology, Xi’an Shiyou University, Xi’an 710065, China
4
Department of Mechanical and Manufacturing Engineering, University of Calgary, Calgary, AB T2N 1N4, Canada
*
Authors to whom correspondence should be addressed.
Metals 2021, 11(12), 1975; https://doi.org/10.3390/met11121975
Submission received: 1 November 2021 / Revised: 2 December 2021 / Accepted: 3 December 2021 / Published: 8 December 2021
(This article belongs to the Special Issue Advances in Corrosion and Protection of Materials)

Abstract

:
The corrosion behavior of L360 pipeline steel coated with or without elemental sulfur (S8) in CO2–Cl medium at different pH was studied. An autoclave was used to simulate the working conditions for forming the corrosion scale, and an electrochemical workstation with a three-electrode cell was used to analyze the electrochemical characterization of the corrosion scale. A wire beam electrode was used to determine the potential and current distribution, and scanning electron microscopy and X-ray diffraction were used to characterize the morphology and composition of the corrosion scale. The results showed that the deposition of S8 on the surface of the electrodes caused serious localized corrosion, especially under acidic conditions. The morphology and localized corrosion intensity index further proved that the deposition of S8 significantly promoted corrosion, especially pitting corrosion. Finally, a novel corrosion mechanism of L360 pipeline steel coated with S8 in a CO2-Cl environment under acidic conditions was proposed, and we then modeled the theoretical mechanisms that explained the experimental results.

Graphical Abstract

1. Introduction

During the exploitation of oil and gas, some solid particles are deposited on the surfaces of pipelines owing to a decrease in the flow rate and pressure [1]. Under deposit corrosion (UDC) usually occurs and is driven by the differences in the chemistry at the interface between the sediment, the substrate, and the bulk solution. This can cause catastrophic failures, such as a reduction in the equipment’s integrity and pipeline perforation, because UDC is difficult to detect [2,3].
Meanwhile, more sour oil and gas fields need to be developed to resolve energy shortages [4]. The dissolution of carbon dioxide produces corrosive carbonic acid, and the hydrolysis of elemental sulfur causes the solution composition to become complex. Elemental sulfur, a yellow powder of S8, is an inorganic sediment generated by the catalytic pyrolysis product of ferrous sulfide under a high temperature and high pressure at the reservoir and deposited due to the reduction in temperature and pressure in the process of fluid production [5]. Zheng et al. [6] proposed that high pressure and temperature were conducive to the formation of polysulfides. Therefore, the chemical equilibrium reaction was changed in a high-temperature and high-pressure environment, and then the decomposition of polysulfides into elemental sulfur and hydrogen sulfide was promoted.
In contrast to the general UDC, the corrosion products of sulfur-containing sediments have semiconductor properties, which can not only promote the formation of the concentration cells but also cause galvanic corrosion with metal substrates [7,8]. Furthermore, Cl with electronegativity is present in the pipeline, which easily adsorbs to the positive metal surface and hinders the formation rate of a passivation film on the surface of the metal [9]. Electrochemical tests showed that the increase in Cl concentration in the solution could accelerate the anodic dissolution of the metal and the negative shift of the cathode potential [10].
Previous studies have revealed that when the temperature is higher than 60 °C, sulfur reacts with water, resulting in serious acidification of the corrosive solution [11]. The existence of the S8 deposition layer, the distribution of ferrous ions, and the concentration of Cl eventually lead to the heterogeneity of the solution [12]. The corrosion of pipeline steel is a very complex process, which is generally affected by the type of sediment and the internal solution of the pipeline. The hydrolysis of the S8 deposition layer and the dissolution of carbon dioxide acidify the solution. The pH distribution in the pipelines is not uniform, and more H+ is accumulated in the pitting pits. Therefore, the pH distribution at different depths of the pit is heterogeneous, and the pH of the interface between the deposits and the substrate is also different from that of the surface of the bare steel. To maintain electrical neutrality, corrosive Cl causes the pitting corrosion pits to continue to be excavated downward, which causes fatal damage to the pipeline steel [13]. To mitigate pipeline failure, it is necessary to understand the corrosion mechanism under S8 deposition by adopting effective measuring technologies. Zagal et al. [14] suggested that acid formation caused by sulfur hydrolysis was the main factor controlling corrosion in the presence of S8. Gong et al. [15] argued that with an increase in immersion time, the uniform corrosion rate in the absence of S8 increased slightly, whereas the corrosion rate in the presence of S8 decreased with an increase in immersion time in a supercritical carbon-dioxide-saturated aqueous environment. Zhang et al. [16] studied the galvanic effect between the covered electrode and the bare electrode of mixed sediments in formation water containing CO2 through electrochemical measurements and surface characterization. Therefore, the presence of S8 has a great influence on the corrosion behavior of oil country tubular goods (OCTG), and the degree of influence is also different. However, few studies have focused on the influence of the deposition of S8 on the corrosion behavior of steel at different pH values.
A wire beam electrode (WBE) provides a new method for monitoring the processes of localized corrosion and estimating the rate of localized corrosion [17]. A WBE can connect the cathode and anode corrosion processes and the cathode and anode areas of the corrosion surface, respectively [18]. Therefore, it can be used to study the anode and cathode processes of localized corrosion cells [19]. Wu et al. [20] used a WBE to study the galvanic corrosion of mild steel under calcium carbonate deposition and potential and galvanic mappings. They found that the polarity of the electrode covered by calcium carbonate changed over time. Chen et al. [21] used a WBE to track the development process of SRB, inducing localized corrosion of 907 steel.
In this study, the effect of the different pH values on the localized corrosion of L360 pipeline steel coated with or without S8 in a 3.5 wt% NaCl solution containing CO2 was studied by a potentiodynamic polarization curve, EIS measurement, and a WBE. The surface morphologies of the corrosion samples were observed by scanning electron microscopy (SEM). After removing the corrosion products, the corrosion morphology of the steel substrate was observed using an OLYMPUS DSX500 optical digital microscope. The composition of the corrosion products was analyzed using X-ray diffraction.

2. Materials and Methods

2.1. Solution

The test solution was 3.5 wt% NaCl (analytical-grade reagent) solution; to avoid introducing extra chloride ions, deoxidized dilute sulfuric acid and sodium hydroxide were used to adjust the pH to 3.10, 5.15, and 7.18. The pH meter was PHS-25 (Shanghai INESA & Scientific Instrument Co., Ltd., Shanghai, China). The solution was deoxygenated with N2 for 4 h and then pumped in CO2 for 12 h before testing.

2.2. Corrosion Scale Preparation

An autoclave experimental setup (FCZ3-24/320, Dalian Science and Trade Experimental Equipment Co., Ltd., Dalian, China) was used to prepare the corrosion scale. The CO2 pressure in the autoclave was maintained at 5 MPa. The material was L360 pipeline steel, and the test sample was machined to the dimensions of 50 mm × 10 mm × 3 mm, with a chemical composition (wt%) of C 0.16%, Si 0.45%, Mn 1.60%, P 0.025%, S 0.015%, V 0.06%, Nb 0.05%, Ti 0.04%, and Fe the balance. The samples were sequentially ground with 400, 800, 1200, and 2000 grit SiC papers, rinsed with distilled water, dehydrated in alcohol, and dried in cool air. The fused sublimation sulfur was coated on the electrode surface, and its thickness was controlled within 1.0–1.5 mm by 2000# sandpaper grinding (coating thickness was determined using a vernier caliper) to ensure that there were no cracks in the sulfur layer and the working area of the electrode was covered by the sulfur layer. The average deposition mass of the sample was calculated to be 0.9312 g using the subtraction method.

2.3. Electrode Preparation

The WBE was made of a total of 100 (10 × 10) matrices by epoxy resin array; the electrode wires were made of L360 pipeline steel wires with a diameter of 1.5 mm, which were soldered on a copper wire, and each wire’s separation was 0.5 ± 0.05 mm; the total exposed area was 1.766 cm2. The size of the conventional working electrode was 10 mm × 10 mm × 3 mm, and copper wires were soldered on the working electrodes to ensure conductivity, leaving an area of 10 mm × 10 mm as the experimental surface, and the rest of the surfaces were sealed with epoxy resin. All experimental electrodes were mechanically ground with a series of silicon carbide papers down to 2000# grade, washed in acetone and ethanol, dried with cold air, and prepared for testing. The fused sublimation sulfur was coated on the electrode surface to prepare the sulfur-coated electrode. After solidification, the thickness of the coating was controlled within 1.0–1.5 mm by 2000# sandpaper grinding (coating thickness was determined using a vernier caliper) to ensure that there were no cracks in the sulfur layer, and the working area of the electrode was covered by a sulfur layer. The average coated mass of the sample was calculated to be 0.1050 g using the subtraction method. To better simulate the deposition of S8 on the pipeline, electrochemical measurements were carried out at the end of 2 h of pre-immersion under S8 deposition to stabilize the open circuit potential (OCP).

2.4. Electrochemical Measurement

A WBE scanner (CST520, Wuhan Corrtest Instruments Corp. Ltd., Wuhan, China) was used, and the acquisition time interval for each data point was 3 s. Conventional electrochemical experiments were carried out using a Parstat 4000+ electrochemical workstation with a three-electrode cell, a saturated calomel reference electrode (SCE), a platinum plate larger than the working electrode area as the counter electrode, and L360 steel as the working electrode. The EIS measurement frequency range spanned from 10 mHz to 100 kHz, the scan rate of the potentiodynamic polarization curve was 0.3 mV/s, and the potential was between −500 mV(vs. OCP) and +500 mV(vs. OCP). Zview software was used to simulate the impedance data using an equivalent circuit. All the tests were carried out at 60 °C.

2.5. Surface Characterization

The autoclave corrosion samples were analyzed by SEM, EDS, and XRD before removing the corrosion products. In the XRD analysis, the 2θ was 20–80° and the scanning rate was 1 °/min. The morphology of the corrosion products was observed using SEM with energy-dispersive spectroscopy (EDS). Using an optical digital microscope (OLYMPUS DSX500, Olympus Optical Industry Co., Ltd., Tokyo, Japan) in the bright field, at 200× magnification, to collect samples after removing corrosion products showed the morphology.

3. Results

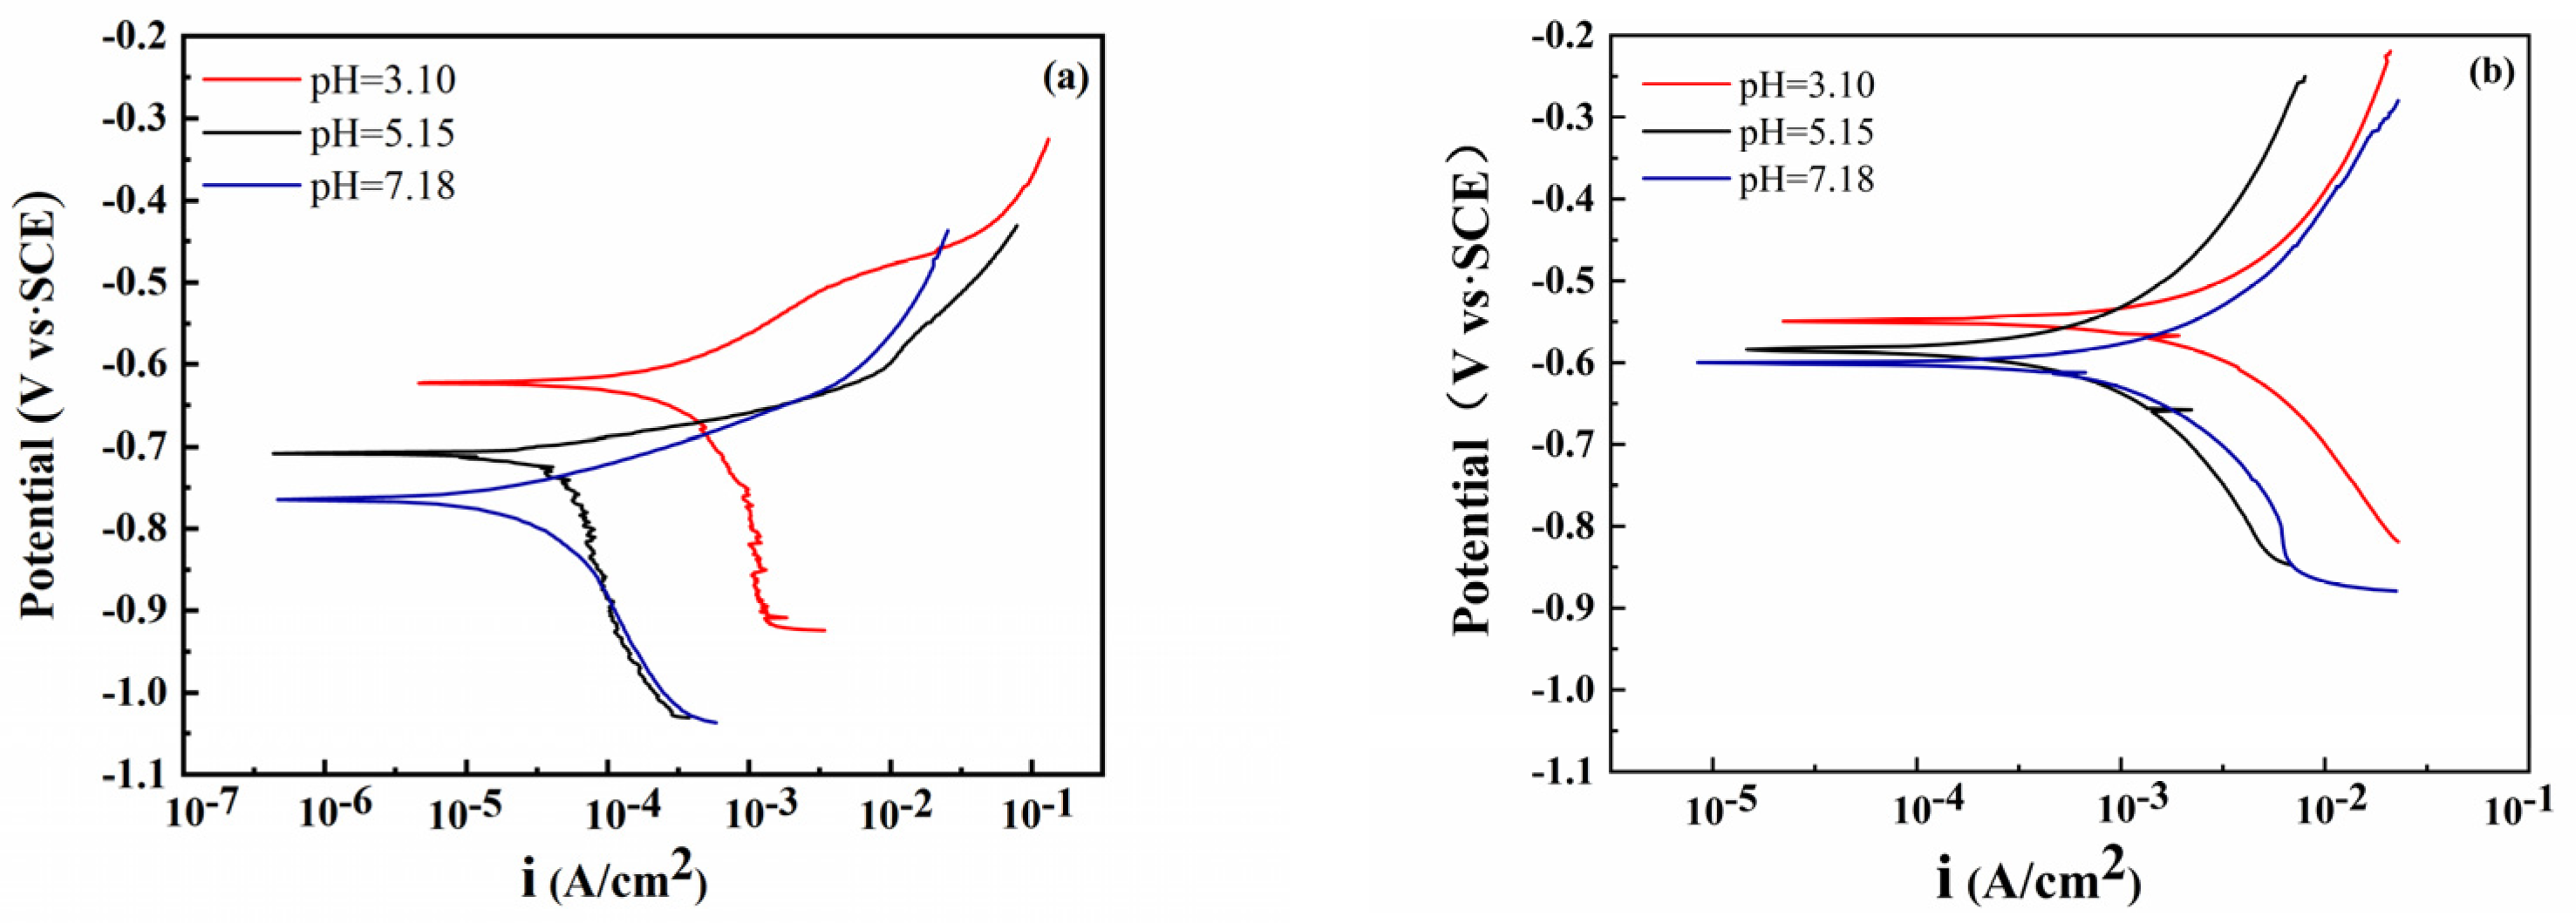
3.1. Potentiodynamic Polarization Curves

Figure 1 shows the polarization curves of the bare electrode and S8-coated electrode at different pH levels. In the pH range of 3.10 to 7.18, the polarization curves of the electrode in the corrosive solution were similar. It can be observed that the potential moved toward a more negative direction and the passive range became narrower with the increase in pH, and the Ecorr decreased from −550 to −611 mV (vs. SCE) owing to the deposition of S8 on the electrode. As shown in Figure 1a, the anode was actively dissolved. In contrast to the bare electrode, the Tafel slope (ba) of the electrode coated with S8 was smaller, and the cathode coated with S8 was greatly affected by diffusion (Figure 1b). The main reason is that when S8 contacts the metal, the electron transfer between them is more direct and rapid, and the corrosion rate is higher. Based on the Marcus theory [22], the deposition of S8 on the surface of steel will lead to the weakening of the metal–metal bonds, thereby reducing the activation energy barrier for the dissolution of the surface metal atoms.
The parameters, such as the self-corrosion potential, corrosion current density, and anodic and cathodic Tafel slopes (ba, bc), are listed in Table 1. With an increase in pH, both the current density and potential decreased, and the current density of the electrode coated with S8 was significantly higher than that of the bare electrode at the same pH. At pH = 3.10, the corrosion current density of the S8-coated electrode was twice as high as that of the bare electrode and reached 14 times at pH = 7.18. The increase in the corrosion current may be related to the hydrolysis of S8. It was proven that the corrosion potential under acidic conditions was more positive than that under neutral conditions; because of the decrease in pH, the acidity of the solution increased, and more electropositive H+ accumulated on the surface of the metal, resulting in a positive shift of the potential. The Tafel slope shows that the ba is greater than the bc, and the corrosion process is controlled by the anode.

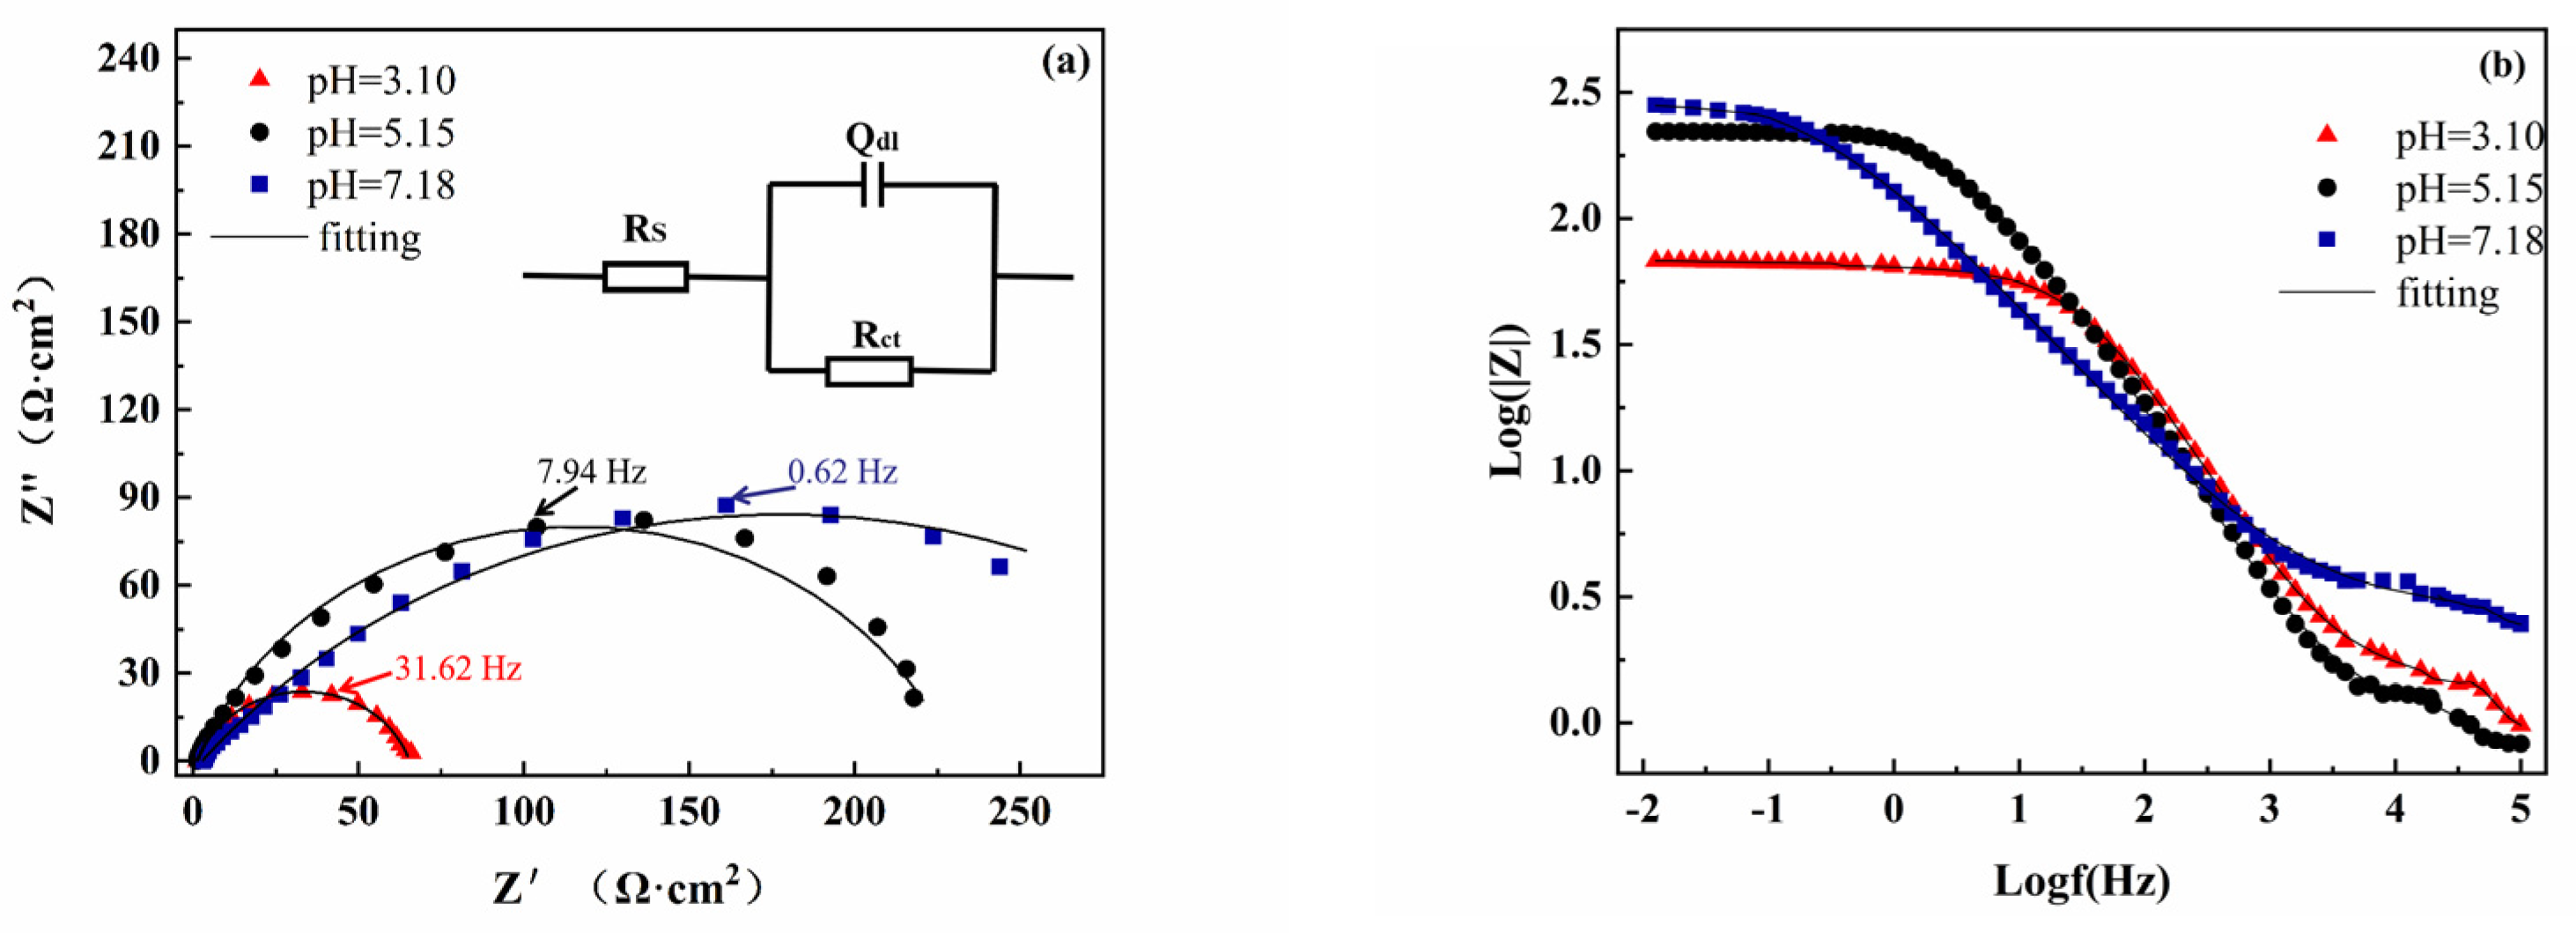
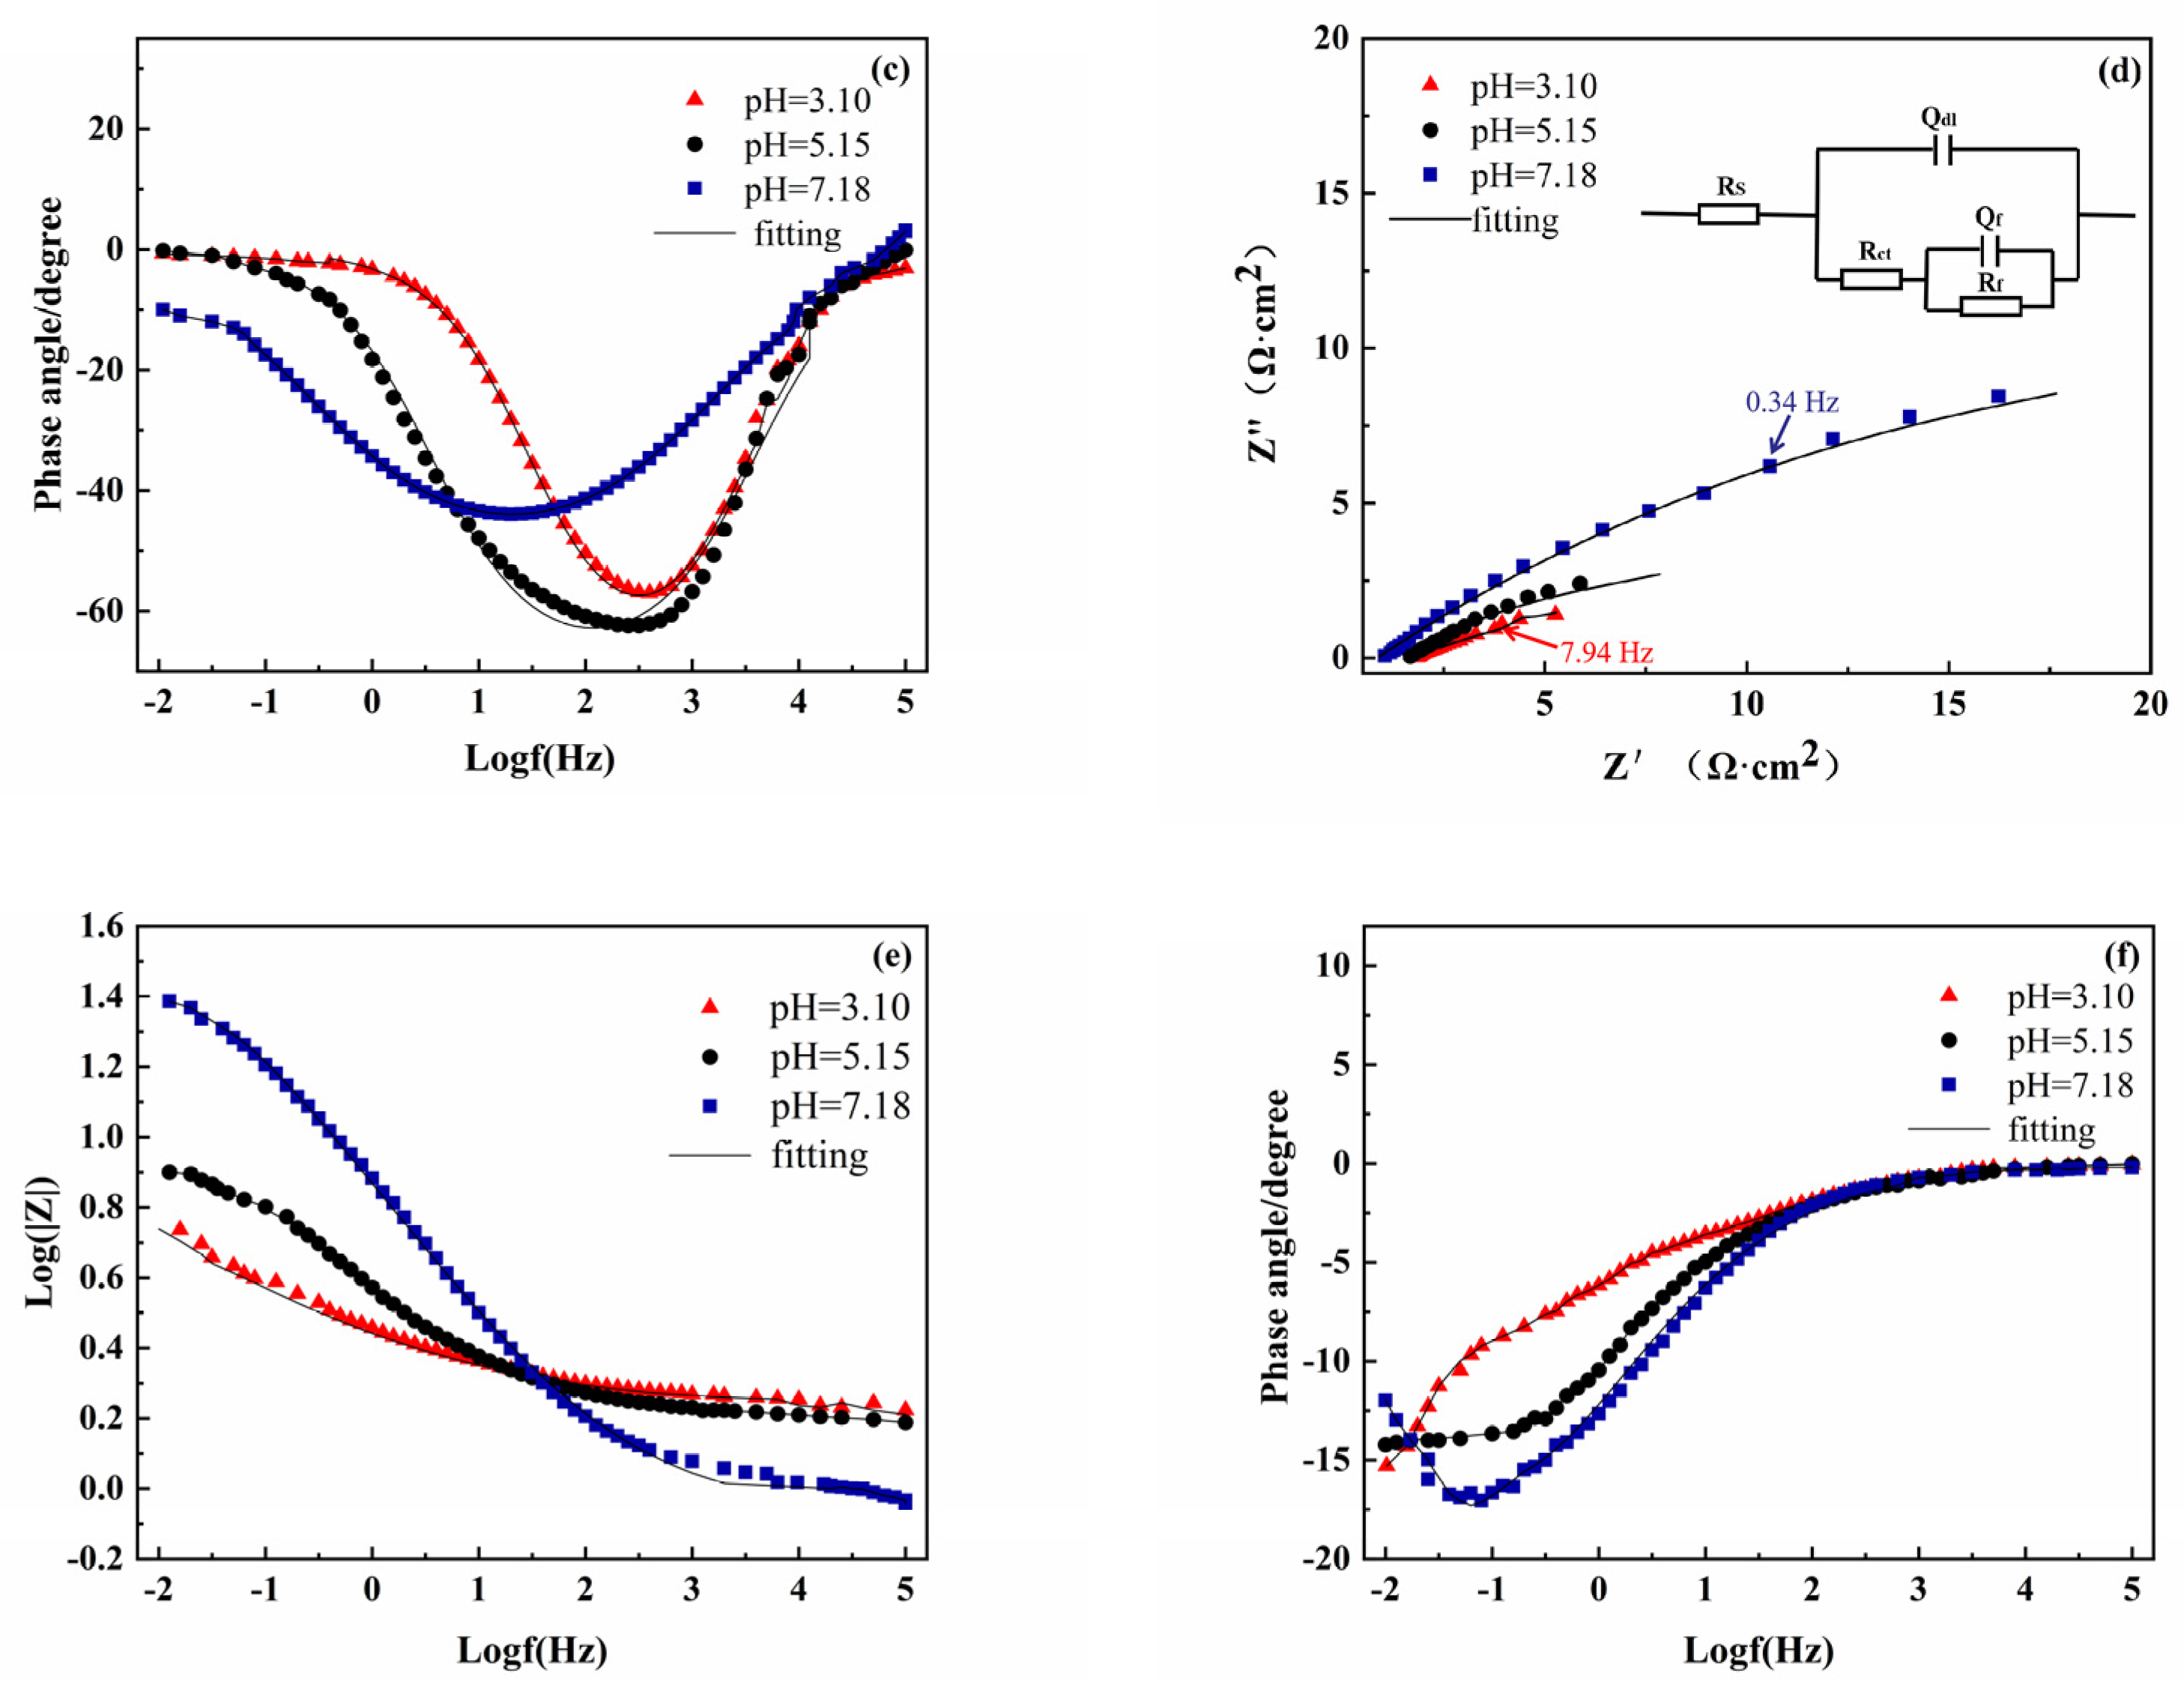
3.2. Electrochemical Impedance Spectroscopy

To further explore the effect of pH on the electrode coated with S8, EIS measurements were systematically performed, and the impedance spectra of the bare electrode and S8 coated electrode at different pH values are presented in Figure 2. The Nyquist spectrum has a capacitance semi-circular arc in the high-frequency area, and the arc center pressure is below the x-axis, which is attributed to the interface charge transfer reaction [23]. As can be seen from Figure 2a,d, there were obvious differences in capacitance diameter at different pH values, and the radius of the arc increased significantly with the increase in pH. This shows that a high pH has larger resistance, which slows down the corrosion process of the electrode surface.
From the Bode diagram (Figure 2b,c), the phase angle vs. frequency curves of the bare electrode conformed to a one-time constant model. For the S8-coated electrode (Figure 2e,f), there were two arcs on the electrode surface, which were distributed in low-frequency and high-frequency areas, respectively, and the high frequency was mainly related to the defects caused by S8 coated on the surface, and the low-frequency region was related to the electrochemical corrosion process of the electrode.
In order to fit the EIS data, all the data were fitted using the appropriate equivalent circuit as given in the insert, in which Rs is the solution resistance, Rct is the charge transfer resistance, Qdl is the double-layer capacitance, n is the dispersion index, and Rf and Qf represent the resistance and capacitance of the elemental sulfur deposition layer, respectively [24]. Table 2 lists the fitting results of electrochemical impedance spectroscopy; the Chi-Squared values were between 10−3 and 10−4, which suggests that the fitting results are reliable. With the increase in pH, both Rct and Rf showed a rising tendency. The Rct of the bare electrode far exceeded the sum of Rct and Rf of the S8-coated electrode. Generally, the Rct of the electrode is inversely proportional to the corrosion rate and can be used to characterize the corrosion rate [25]. At pH = 3.10, the Rct value of the bare steel electrode was 16 times higher than that of the S8-coated electrode. Therefore, EIS measurements further showed that the corrosion of the electrode coated with S8 was more severe under acidic conditions, and the EIS results were in good agreement with the results of the polarization curves.

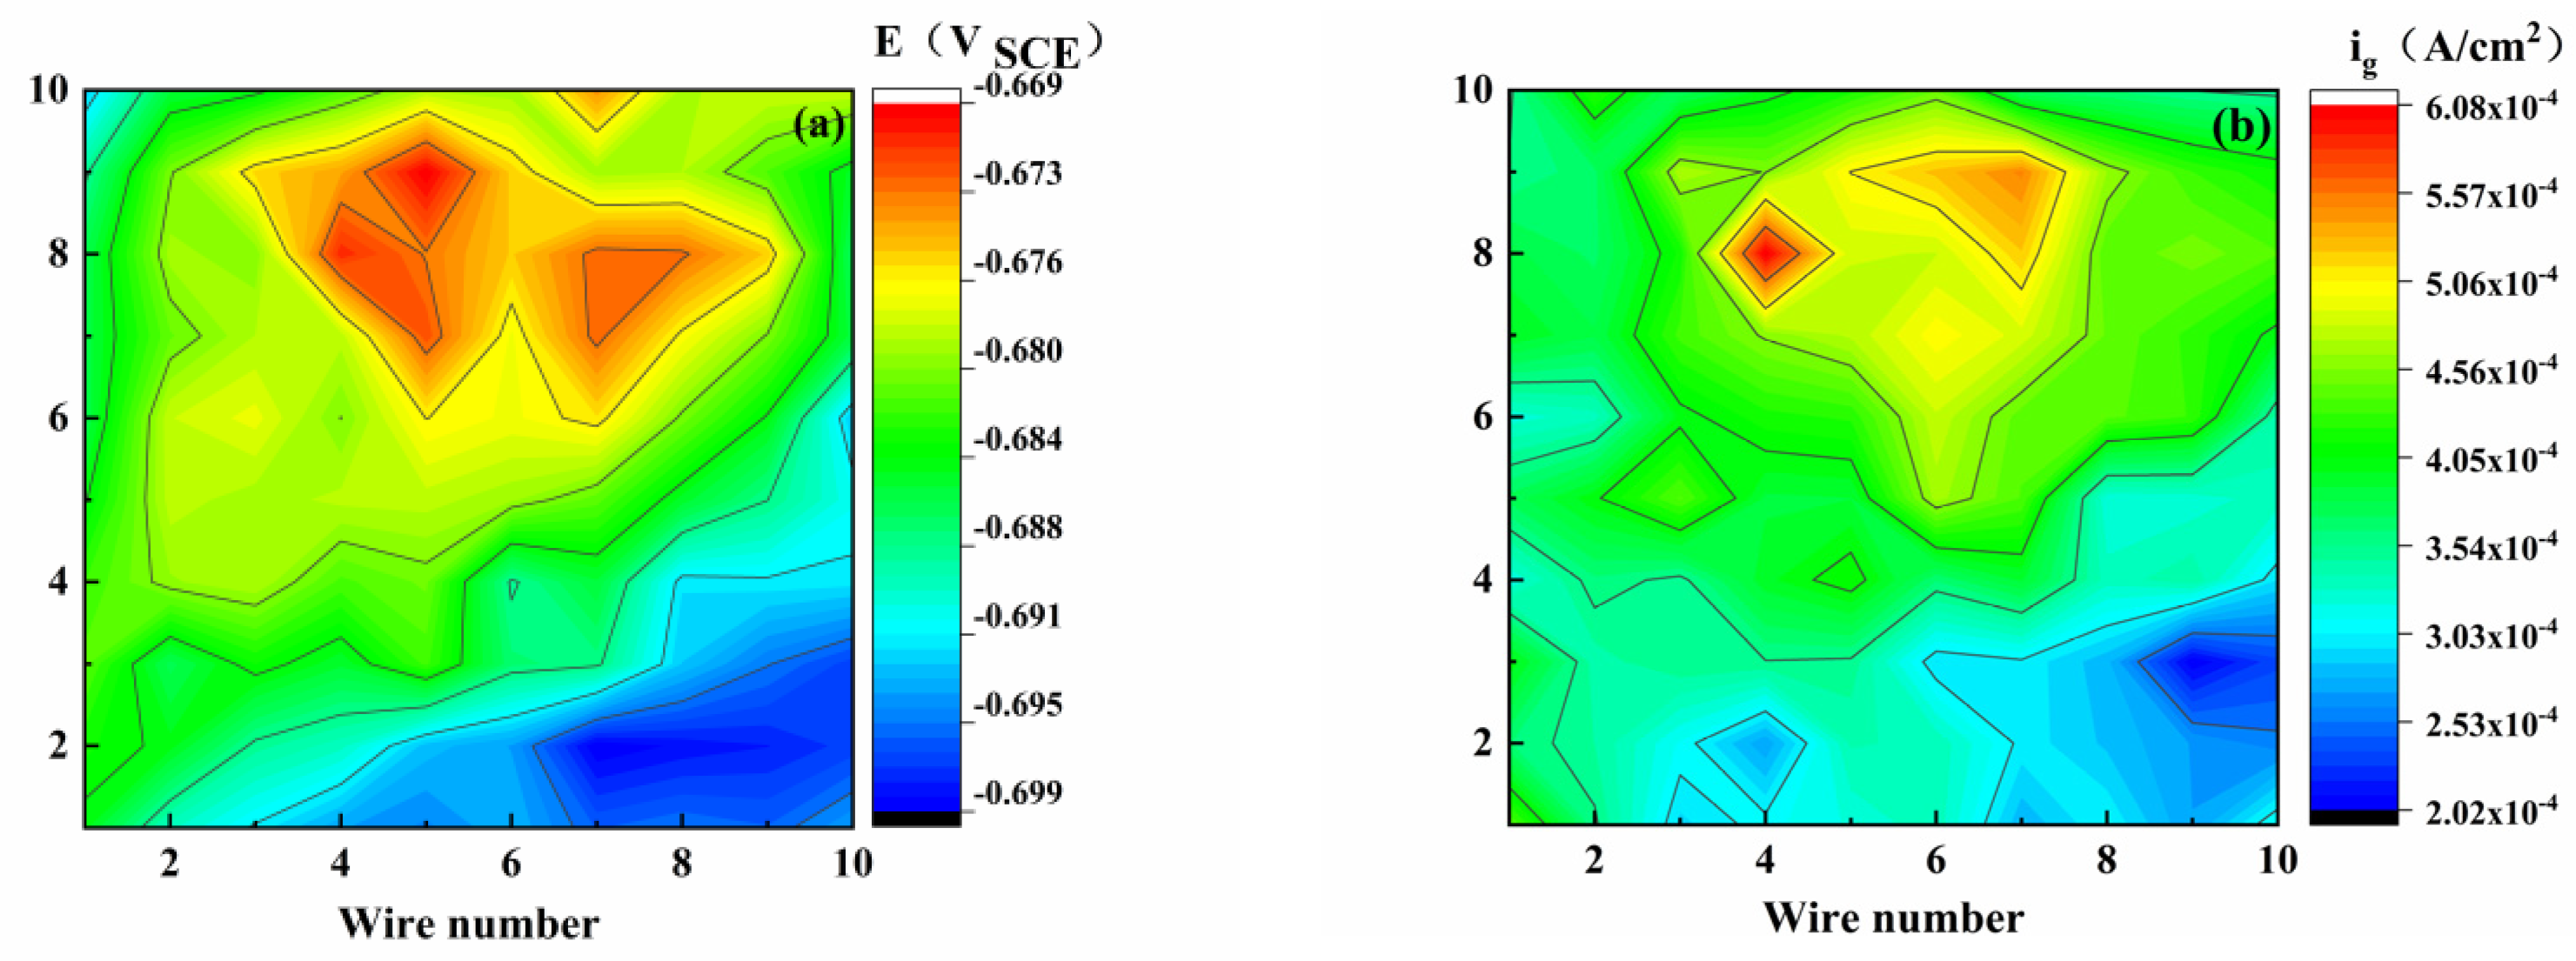
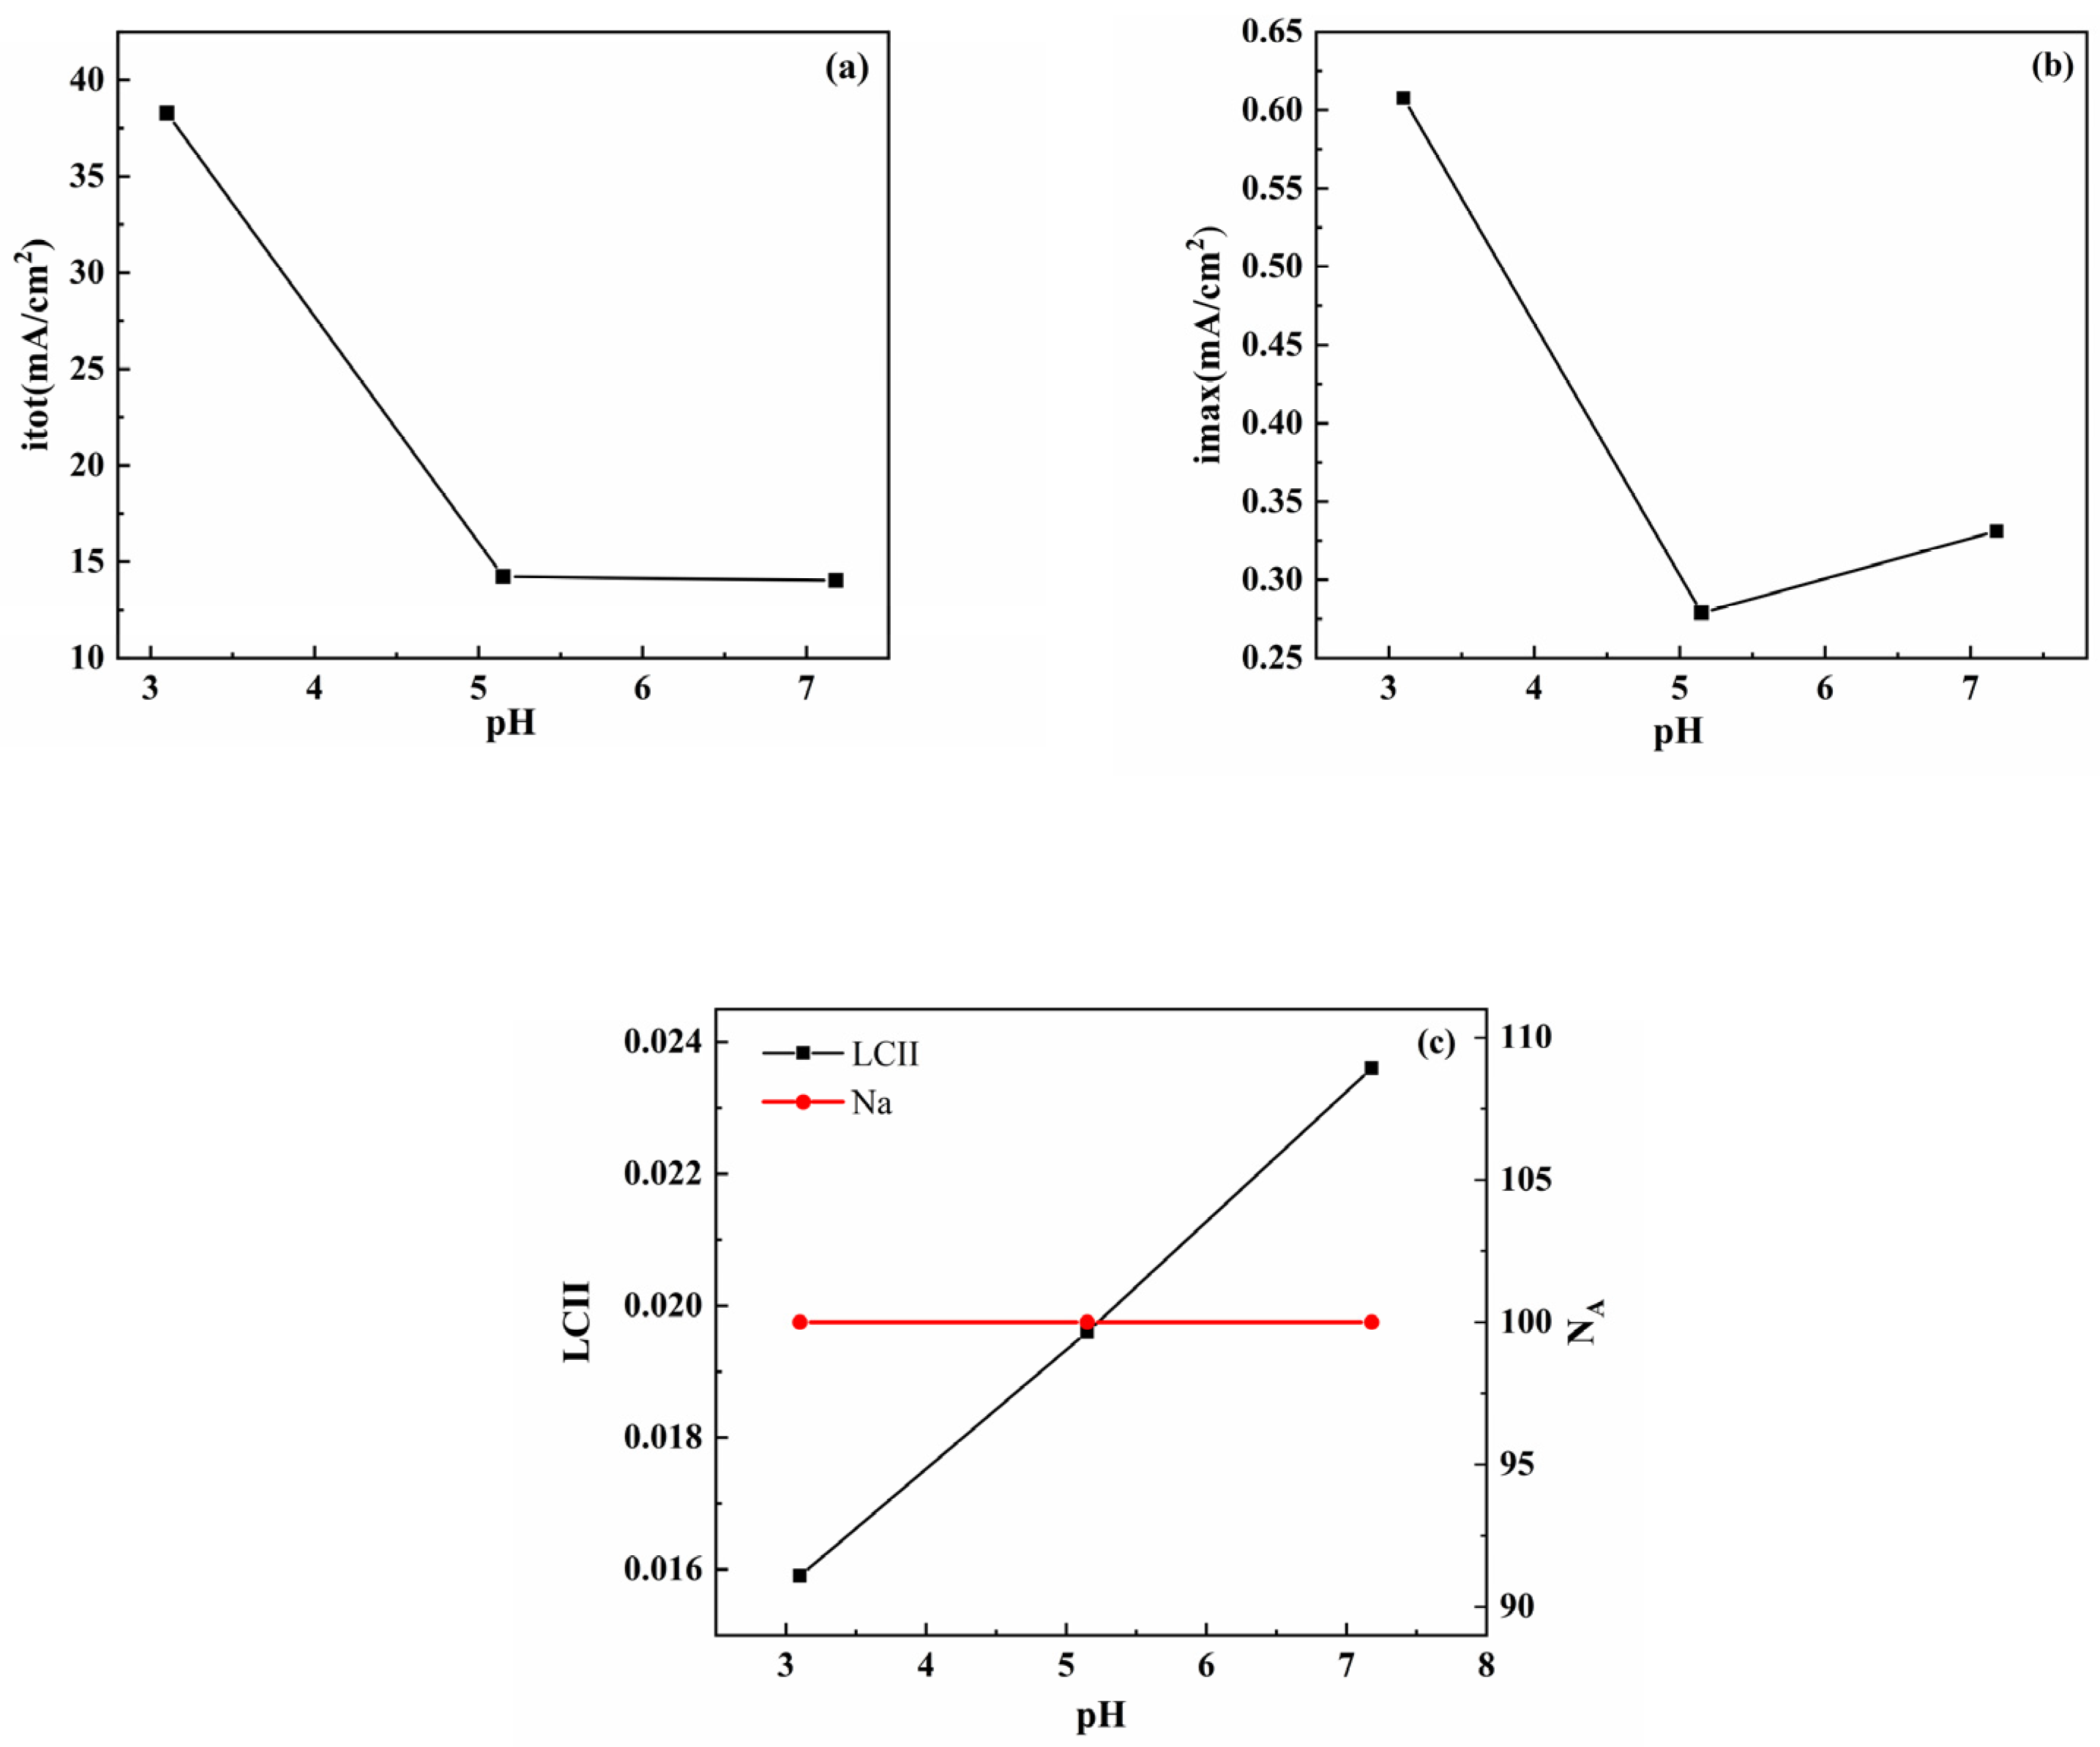
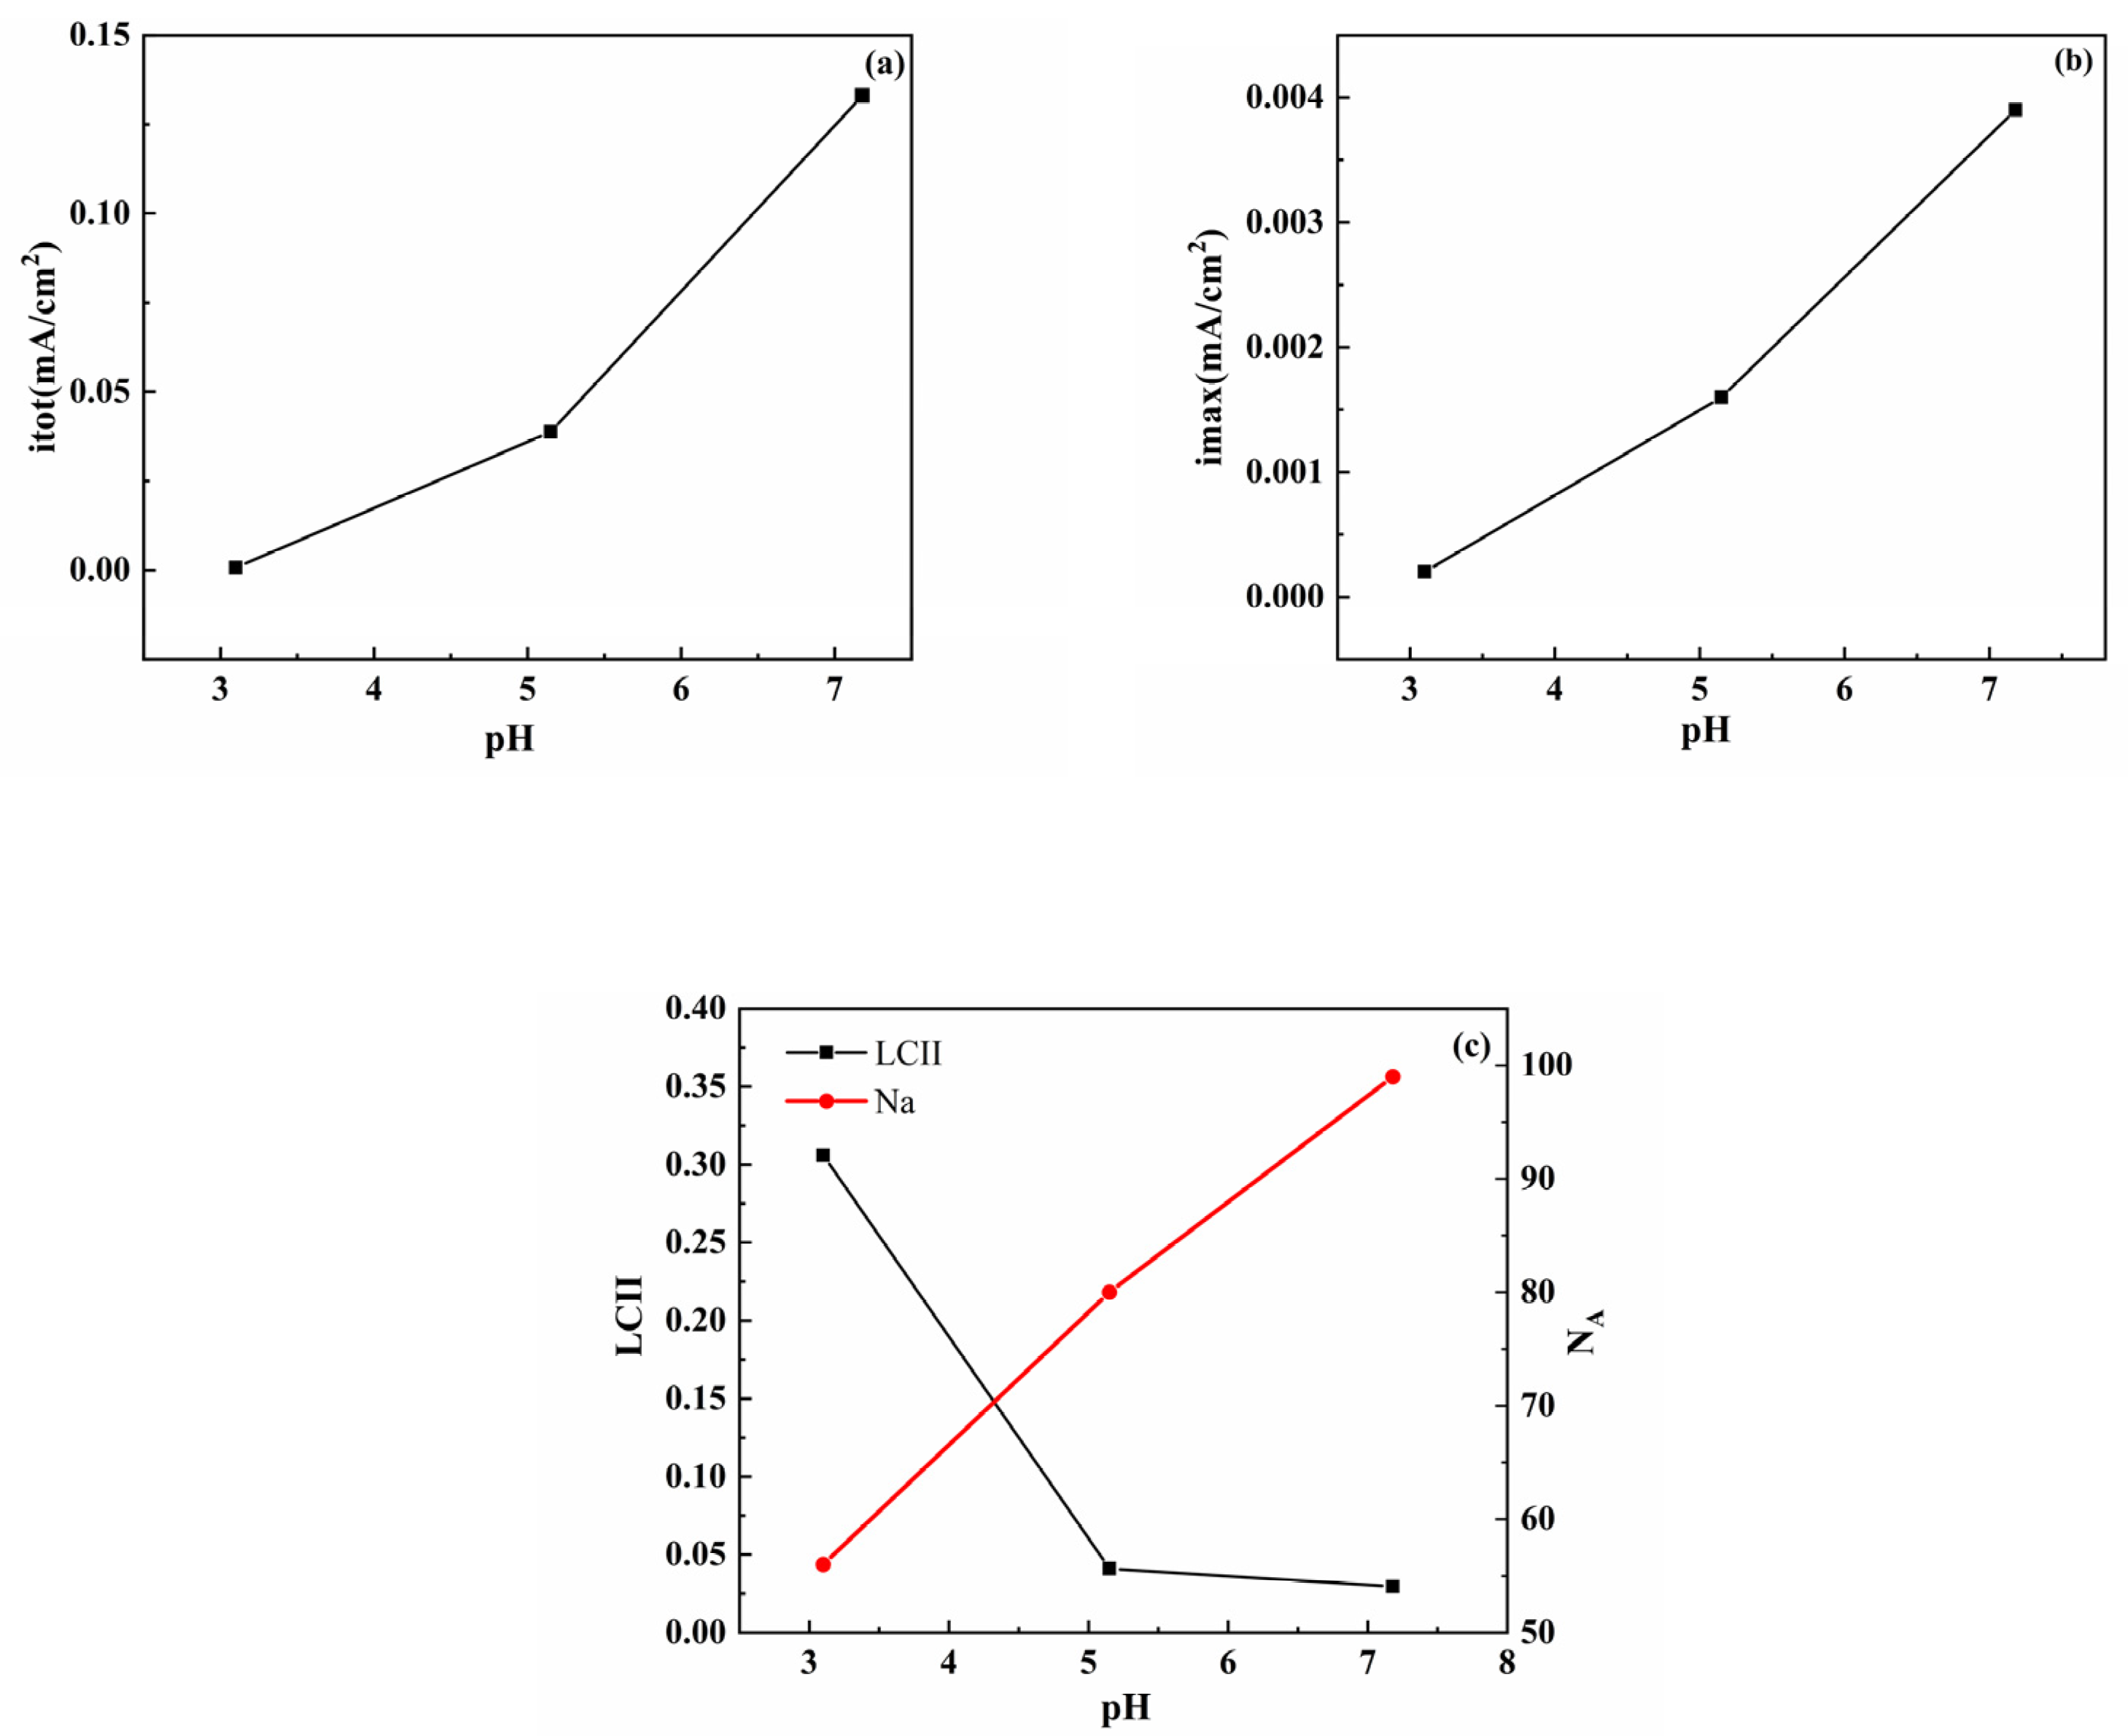
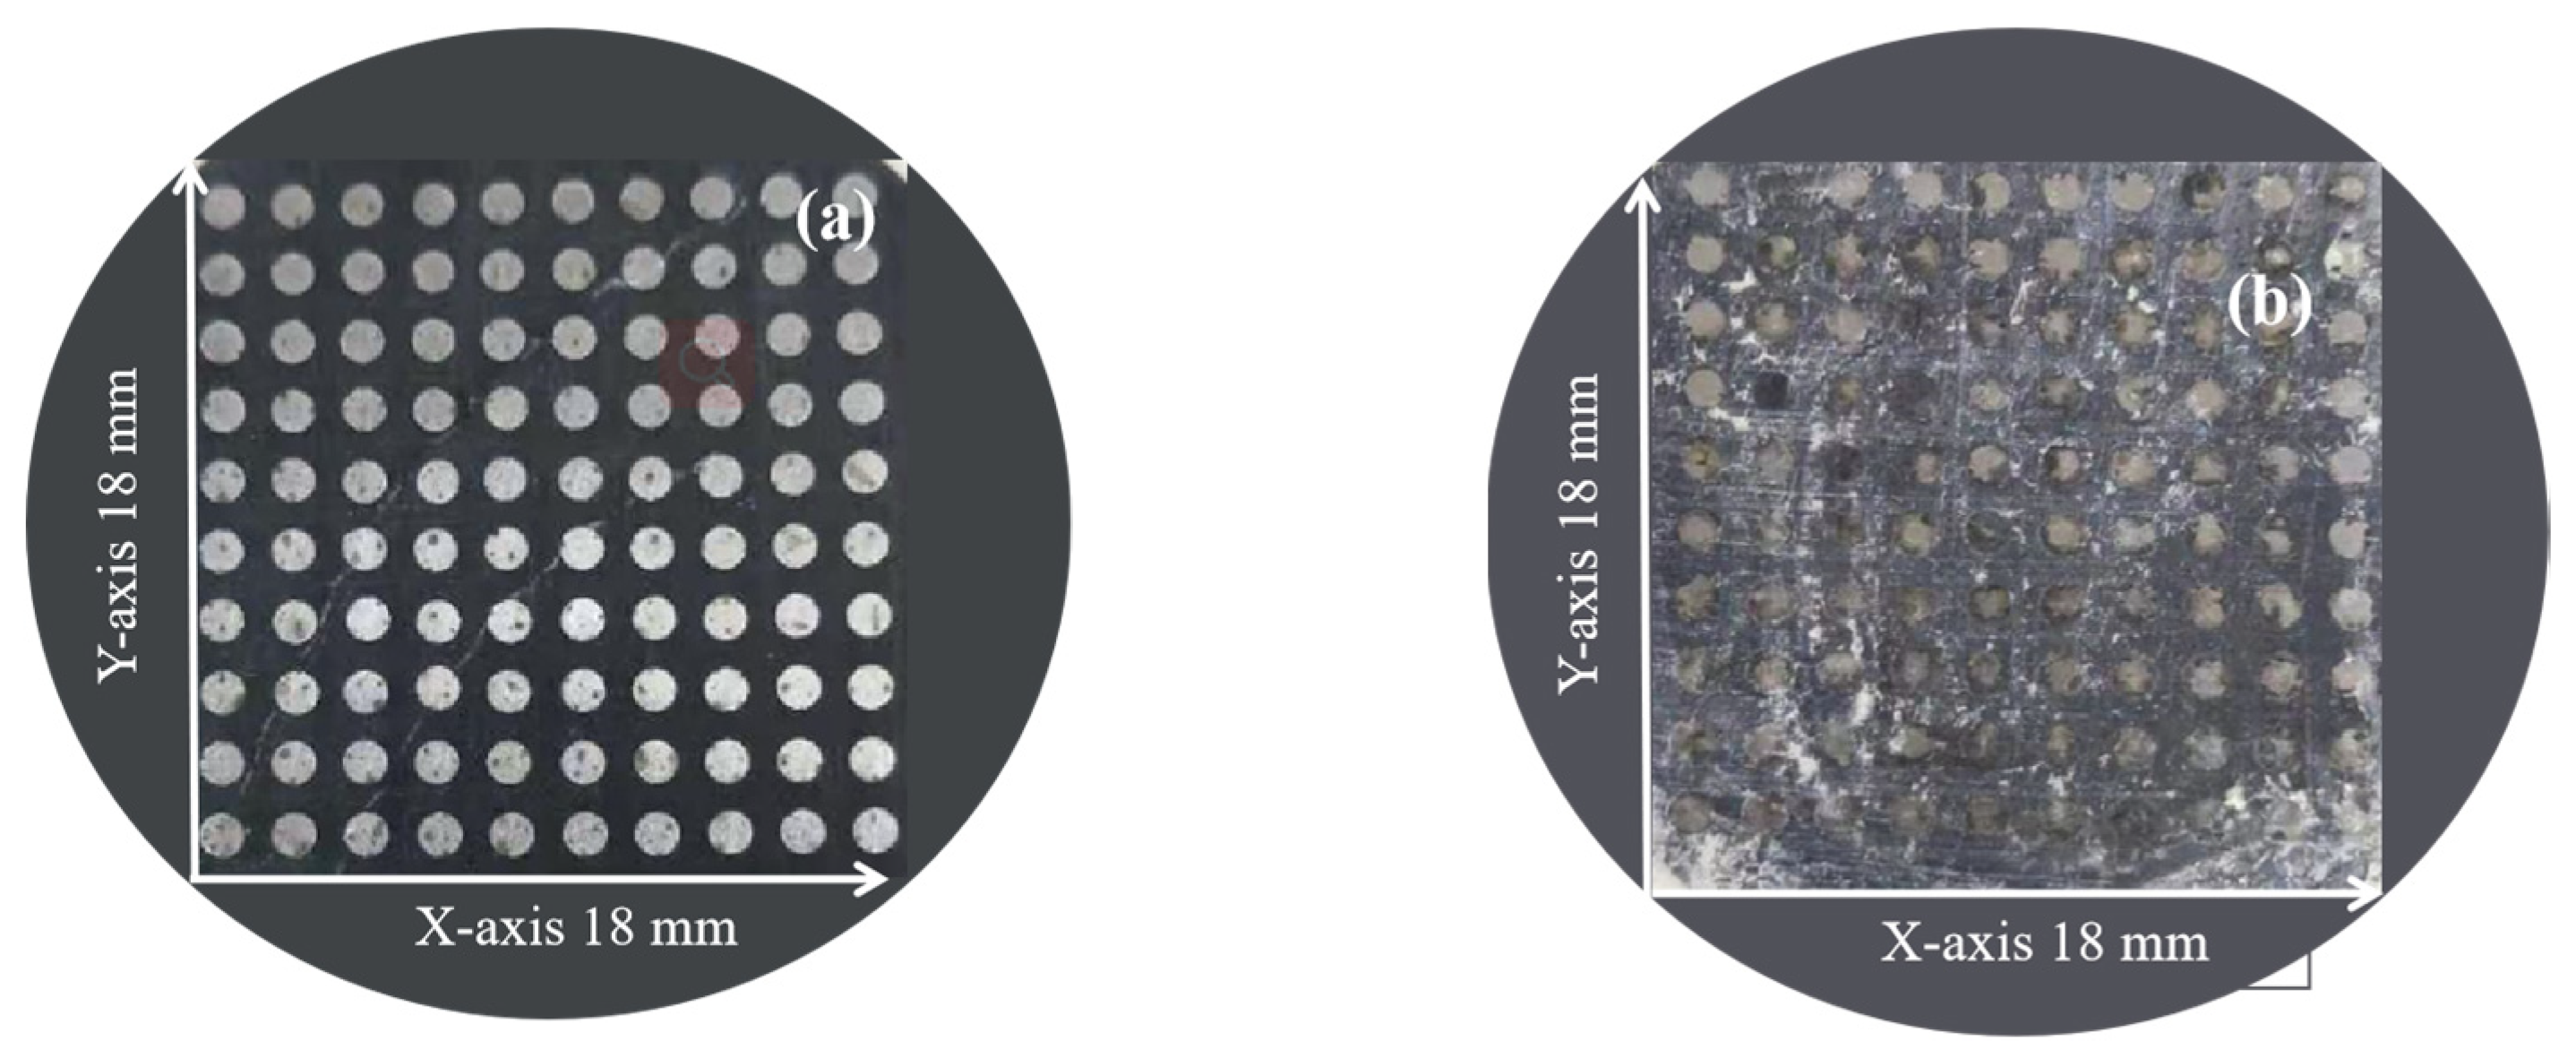
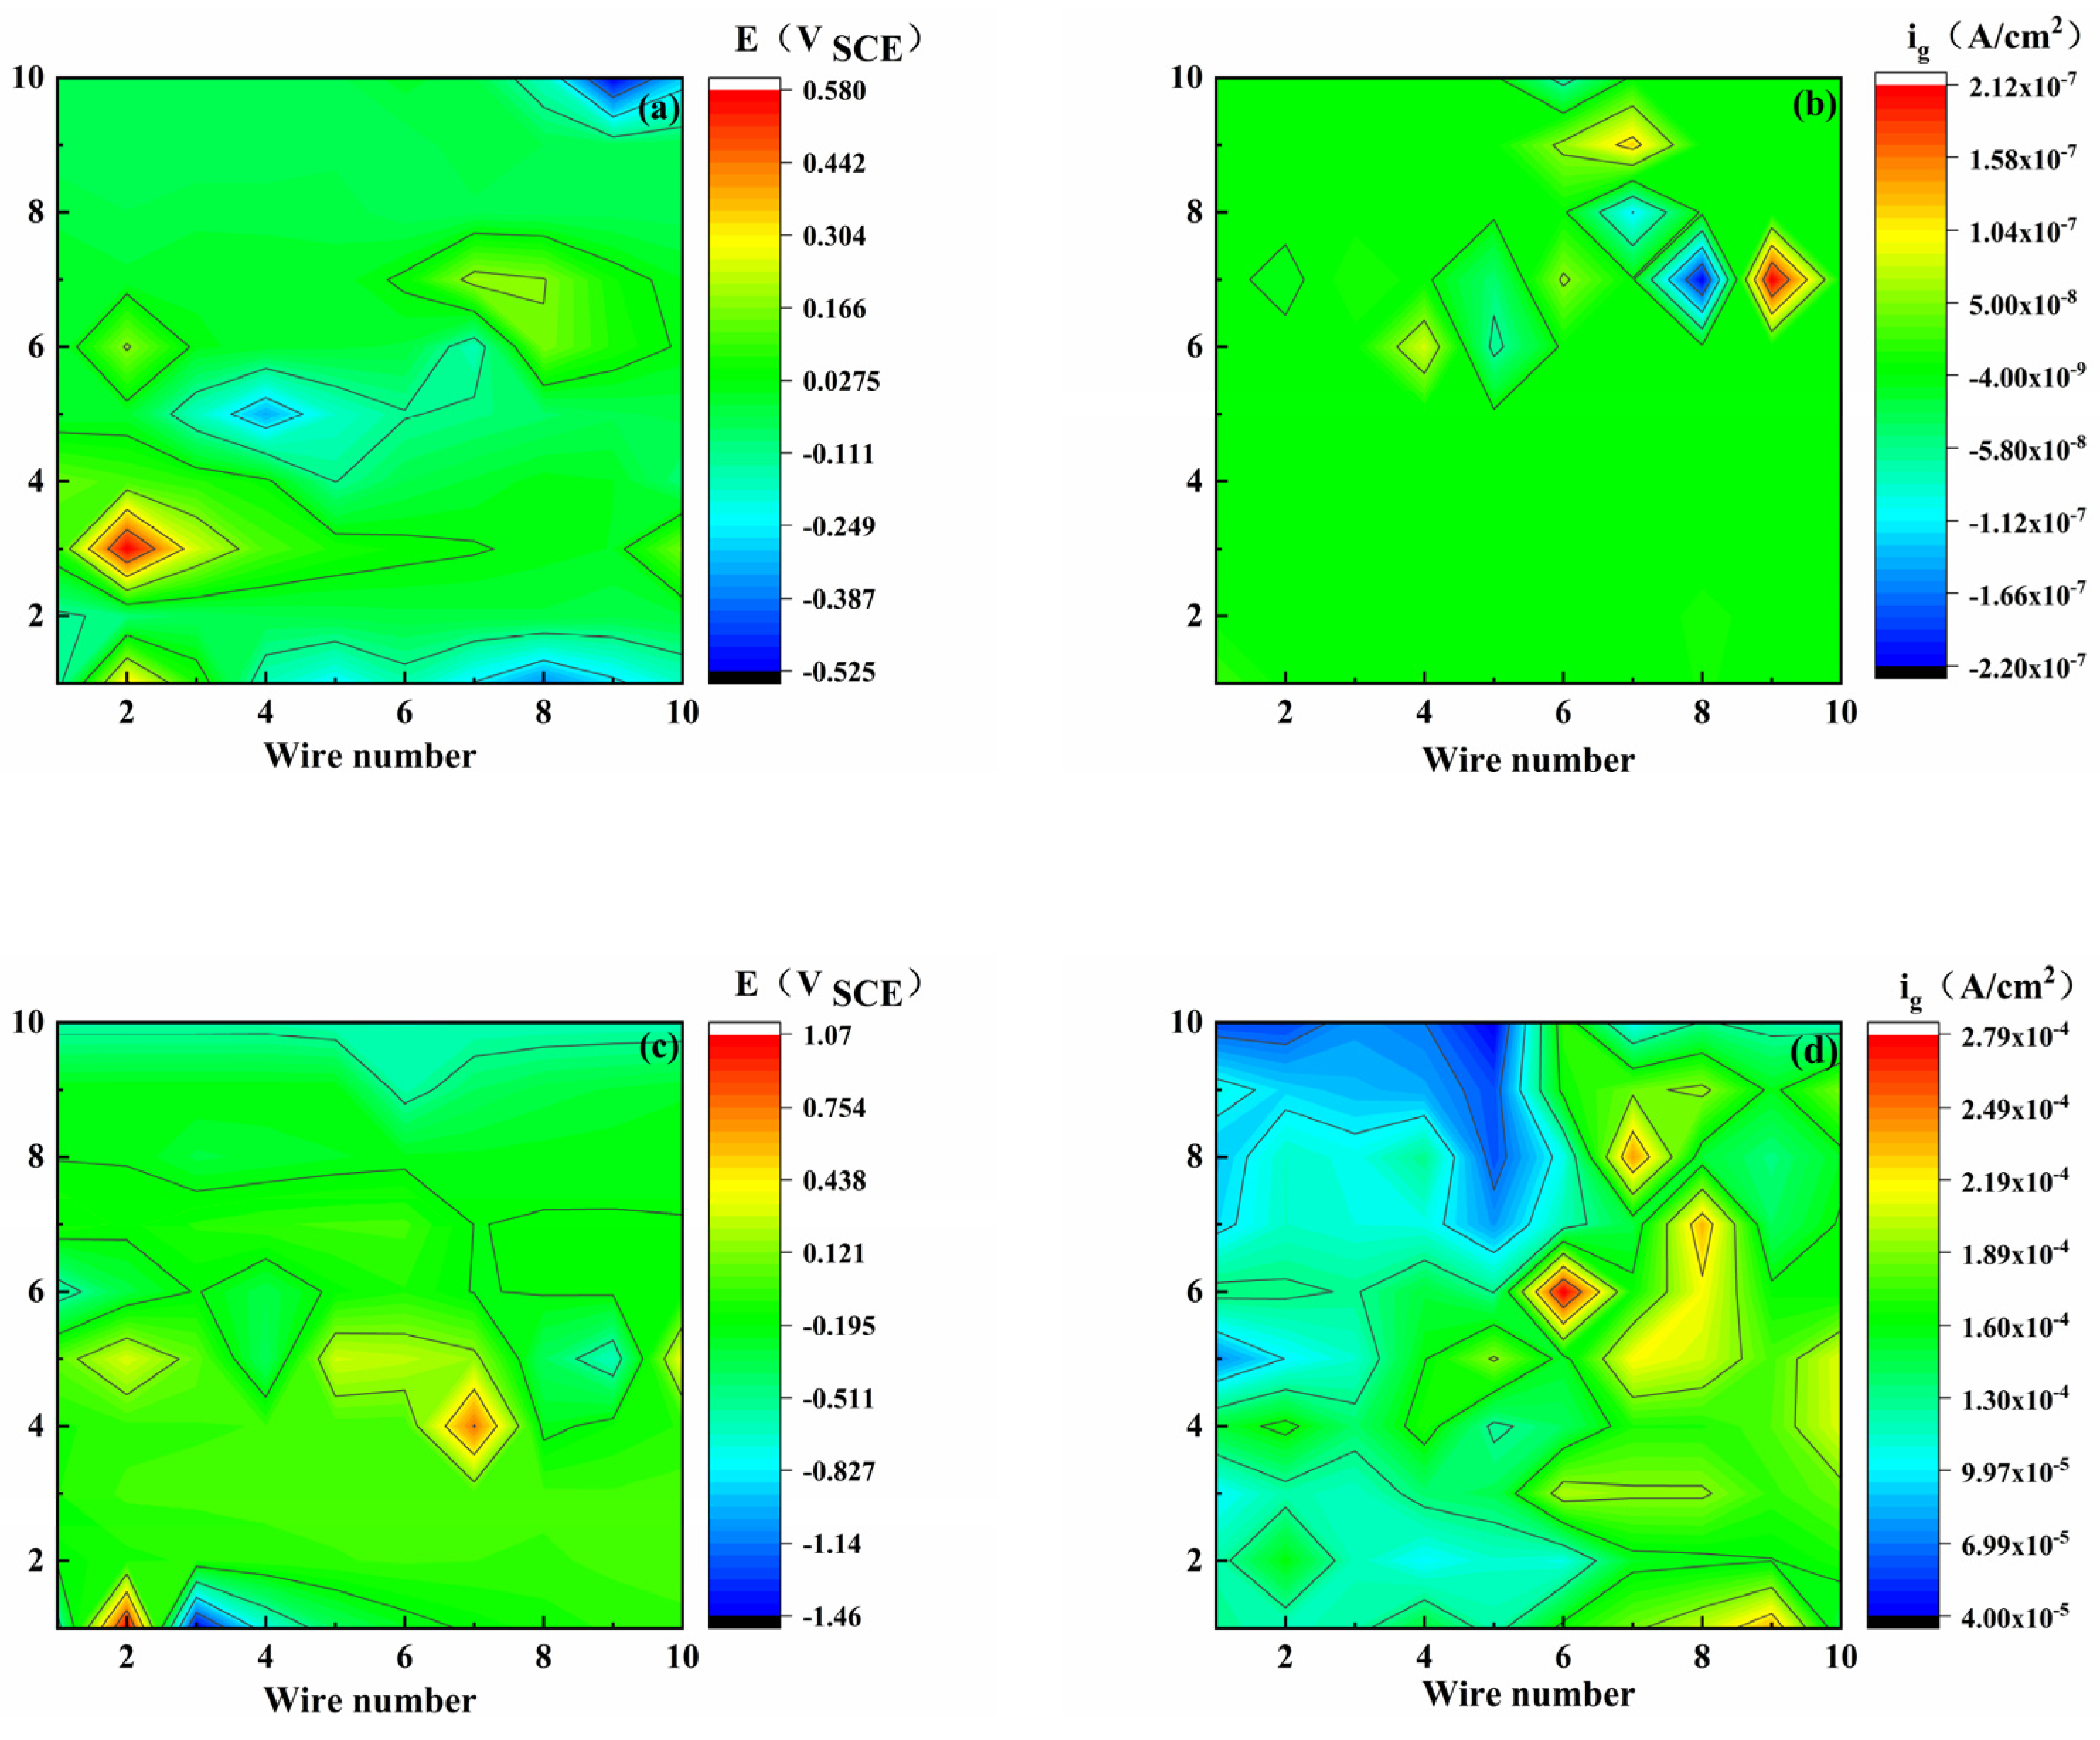
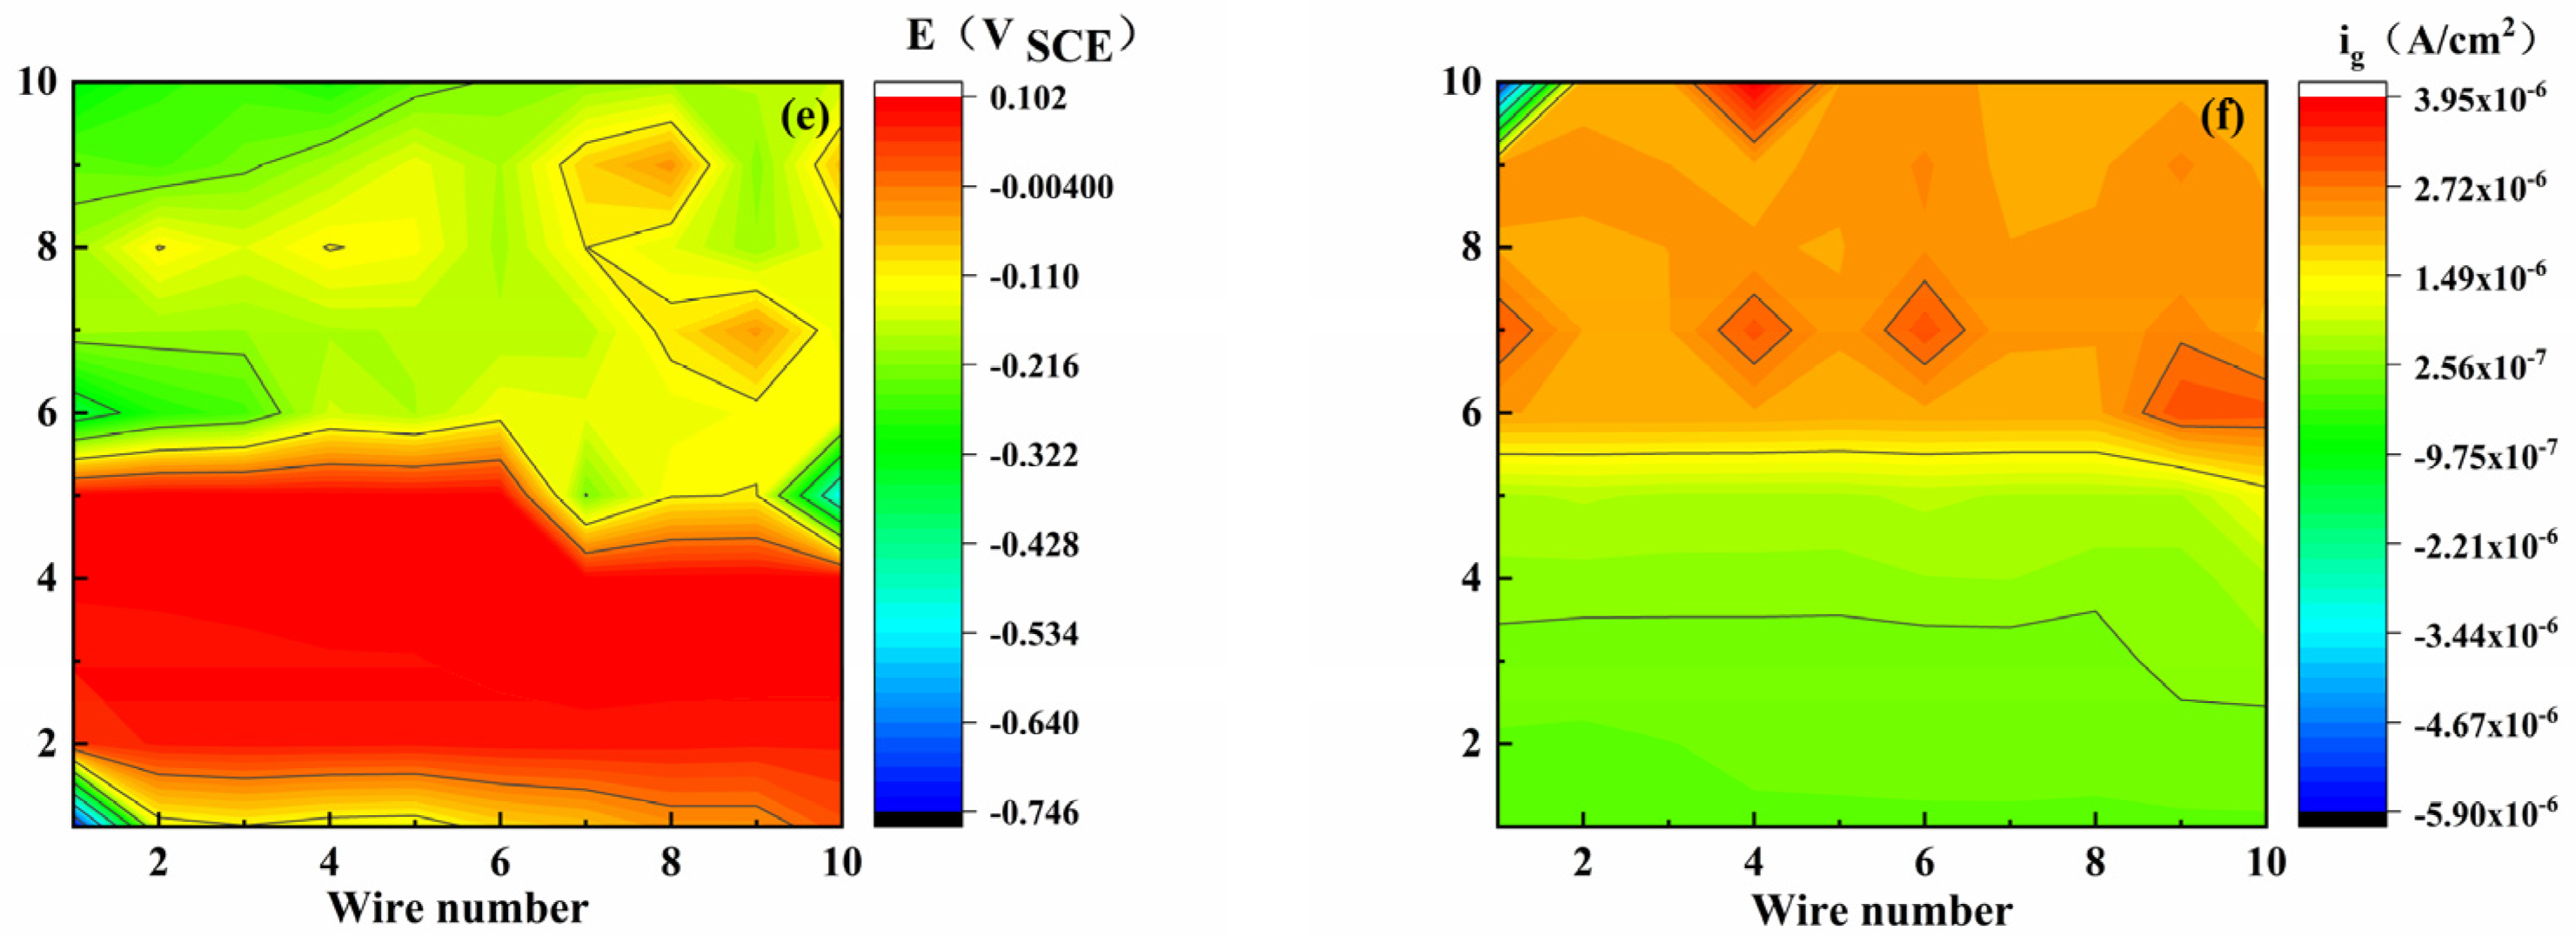
3.3. Potential and Current Distribution

To further study the localized corrosion behavior under S8 deposition, a WBE was used to reveal the corrosion difference between the bare steel electrode and the S8-coated electrode. Tan et al. [26] first adopted the WBE to study localized corrosion and obtained localized potential and current information. A new parameter, the localized corrosion intensity index (LCII), is proposed to quantify the degree of localized corrosion using the following equation:
L CII = i max i t o t
where imax is the maximum anode current, and itot is the positive galvanic current density of the WBE. Tan et al. [26] presumed that localized corrosion was not serious when the LCII index was lower than 0.1.
When sulfuric acid and sodium hydroxide were added to the medium solution as a simple pH modifier to adjust the pH of the solution, the corrosion mechanism changed and the corrosion distribution became highly different, as reflected by the color and scale. For the bare electrode, as shown in Figure 3, all the point current densities were positive, and the potential distribution was uneven and random. The potential difference was relatively small, indicating that the localized corrosion tendency of the WBE was relatively weak. The maximum anodic currents of 0.607, 0.279, and 0.279 A/cm2 were present at the electrodes (8, 4), (6, 6), and (6, 6), respectively (X-column, Y-row), at pH of 3.10–7.18.
Figure 4 shows the coupling potential and current density distribution maps of the WBE coated with S8. It was found that with the increase in pH, the anode region gradually enlarged, and its position changed. The non-uniformity of the potential distribution reflects the heterogeneity of the corrosion. As shown in Figure 4e, the upper half of the electrode potential is small. In general, the anode position causes the OCP of the electrode to move negatively; therefore, the electrode in the upper half region is used as the anode region, and the corresponding Figure 4f shows a high position current value, which can also be reflected by the color. The other electrode potentials presented similar results.
In the pH range of 3.10–7.18, Figure 5 shows the calculation results of some key parameters (itot, imax, LCII, and NA) based on Figure 3, where NA is the number of anodes. When the pH was adjusted from 3.10 to 7.18, both the itot and imax decreased, all NA values were 100, and a small LCII value (LCII < 0.1) was obtained, indicating that all bare electrodes experienced homogeneous corrosion, and localized corrosion did not occur. As shown in Figure 6c, as the pH increased, the surface of the S8-coated electrode produced new anode sites, and the NA value increased from 57 to 99; therefore, the anode current density increased significantly, and imax also increased. This also means that the current distribution became less concentrated on a small number of anode sites, and then generated more active corrosion activities, and corrosion on the electrode surface became more homogeneous. After the pH increased from acidic to neutral, the corrosion pattern changed significantly. The distribution of the anode and cathode sites became random, and the LCII value also decreased rapidly from 0.3061 to 0.0295. Obviously, higher LCII values correspond to concentrated anode regions and intensive corrosion locations. As shown in Figure 5c, the LCII (LCII = 0.3061 > 0.1) of the electrode coated with S8 was higher than that of the bare electrode at pH = 3.10, which indicates that the localized corrosion trend of the electrode coated with S8 was enhanced. This result agrees with the polarization curves and EIS results.
An optical picture of the WBE is shown in Figure 7. For the bare electrode (Figure 7a), the current density in the anode region was extremely small, and the corresponding electrode was covered with a negligible amount of black corrosion products, causing mild corrosion. For the S8-coated electrode (Figure 7b), part of the electrode was covered with black corrosion products, and the other was still bright. S8 accelerated the corrosion of the electrode, and the electrode suffered from localized corrosion, which agrees with the calculated results shown in Figure 5 and Figure 7.

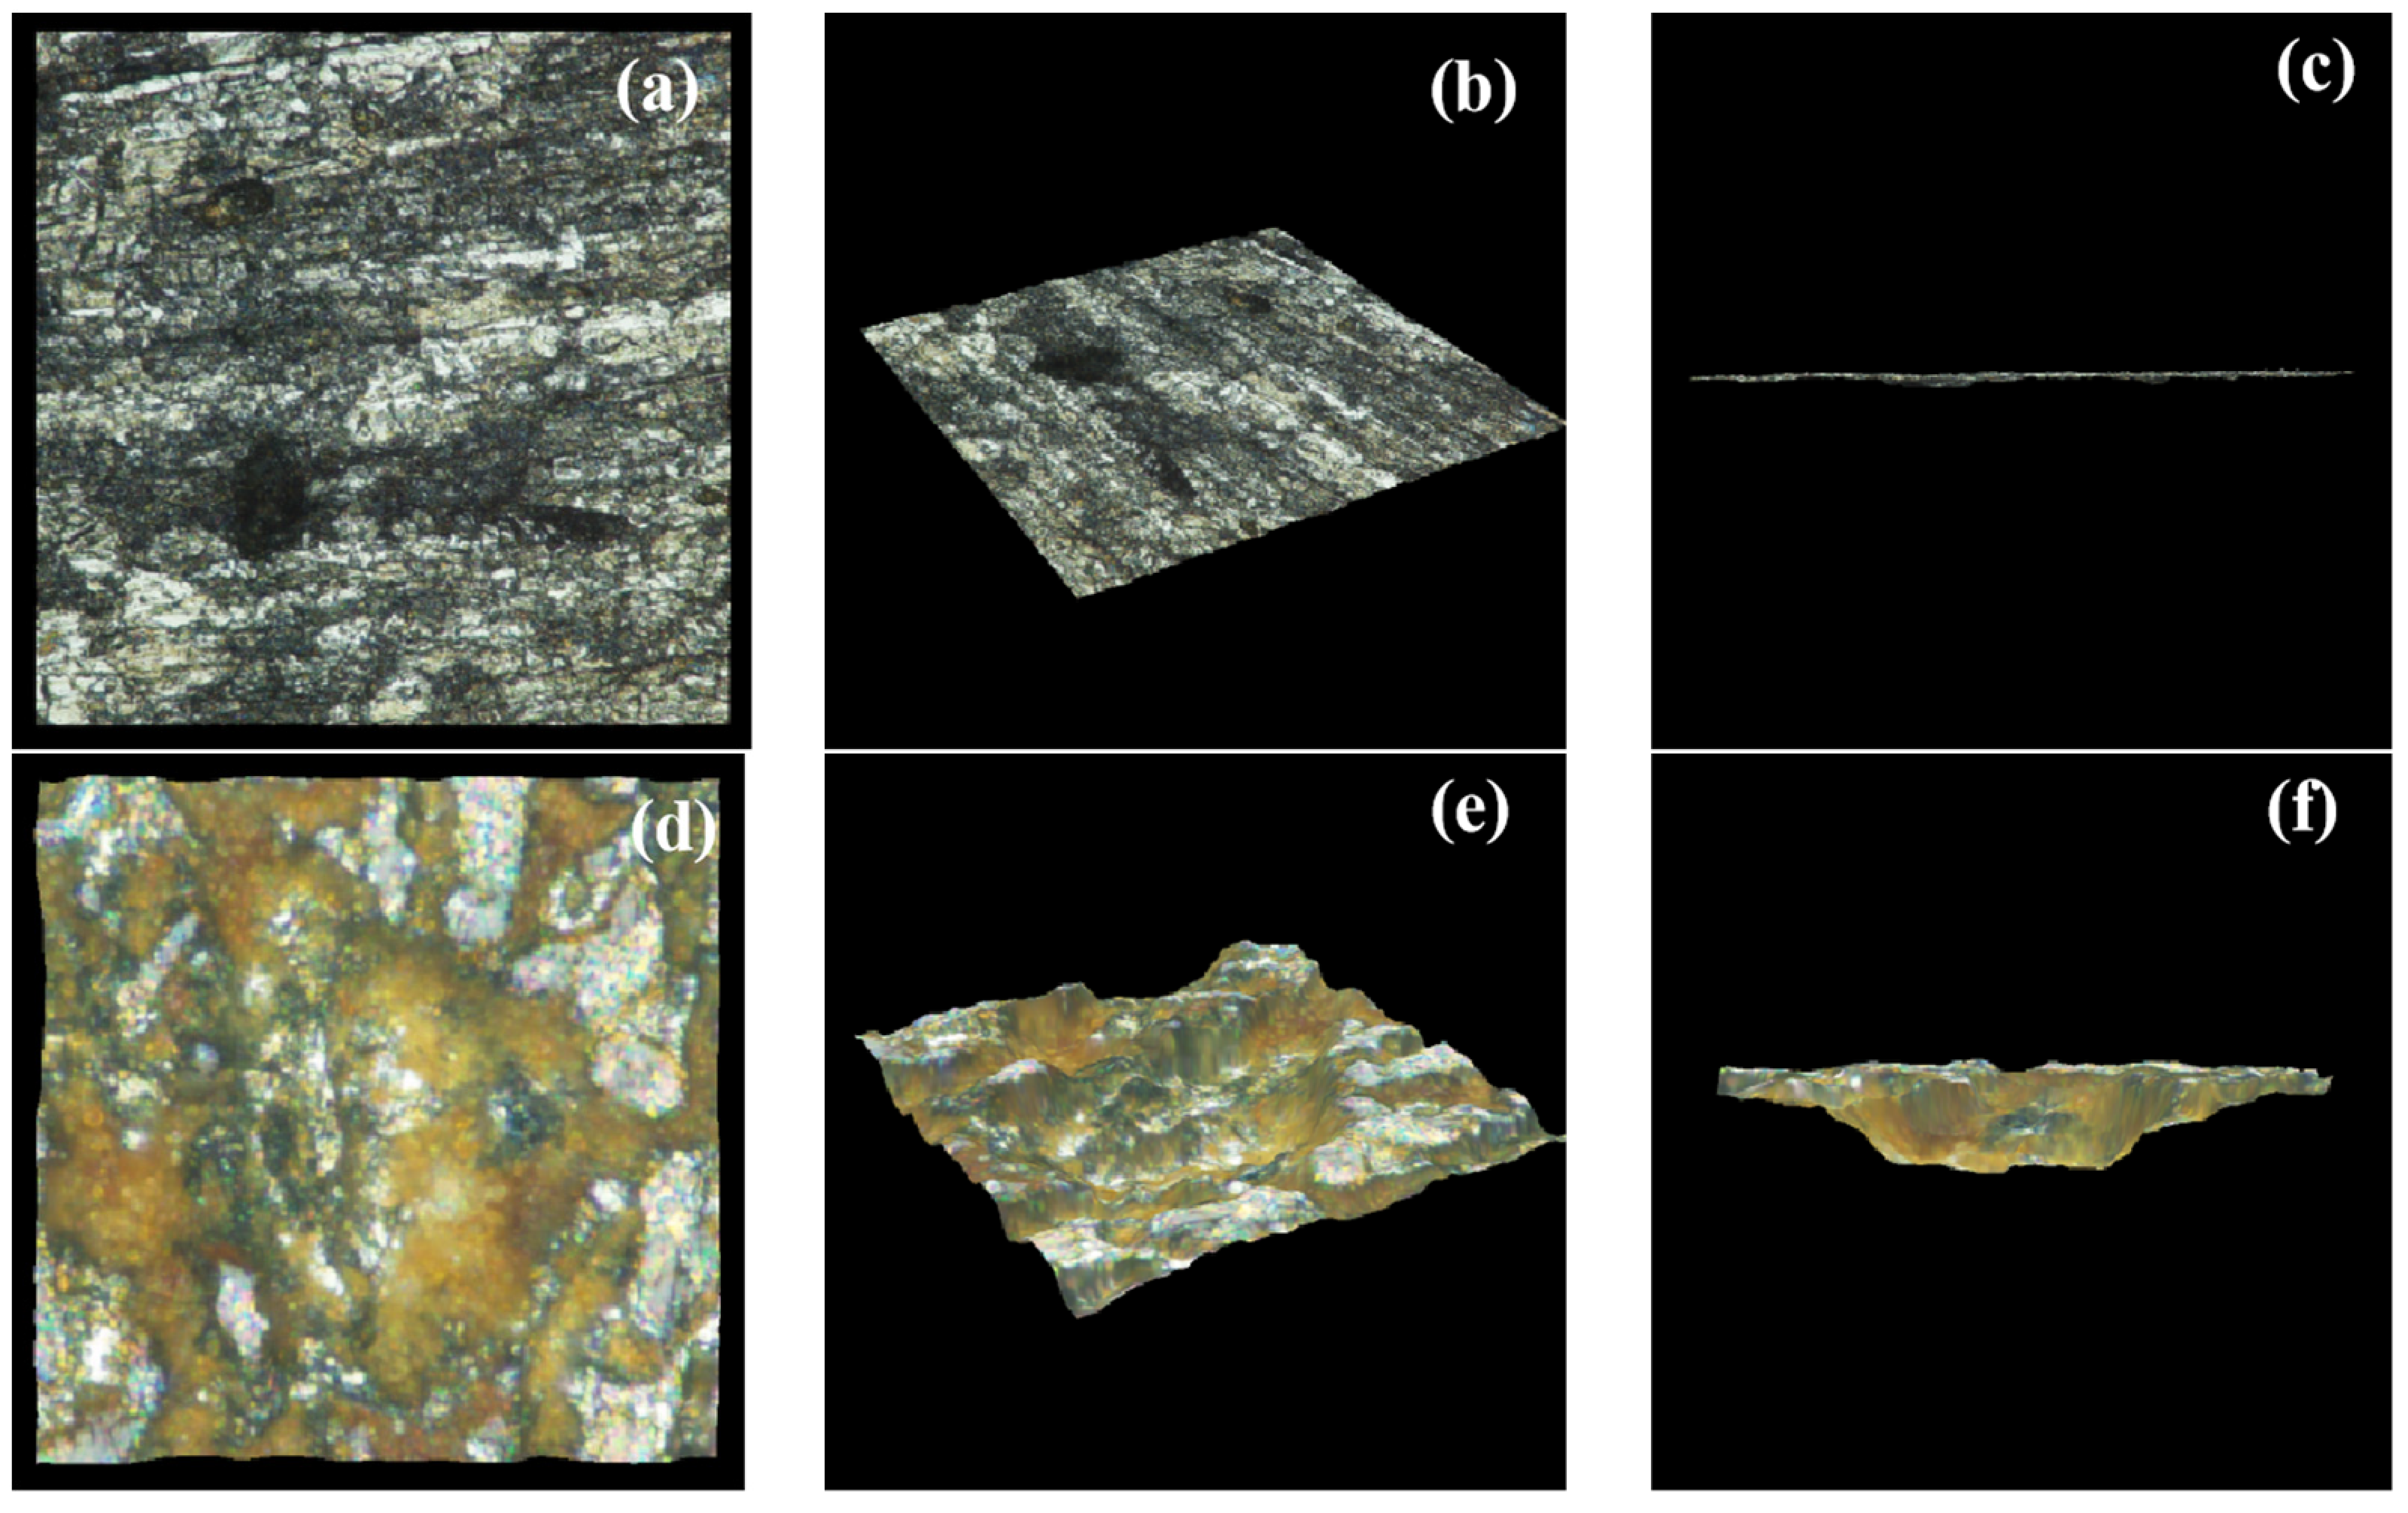
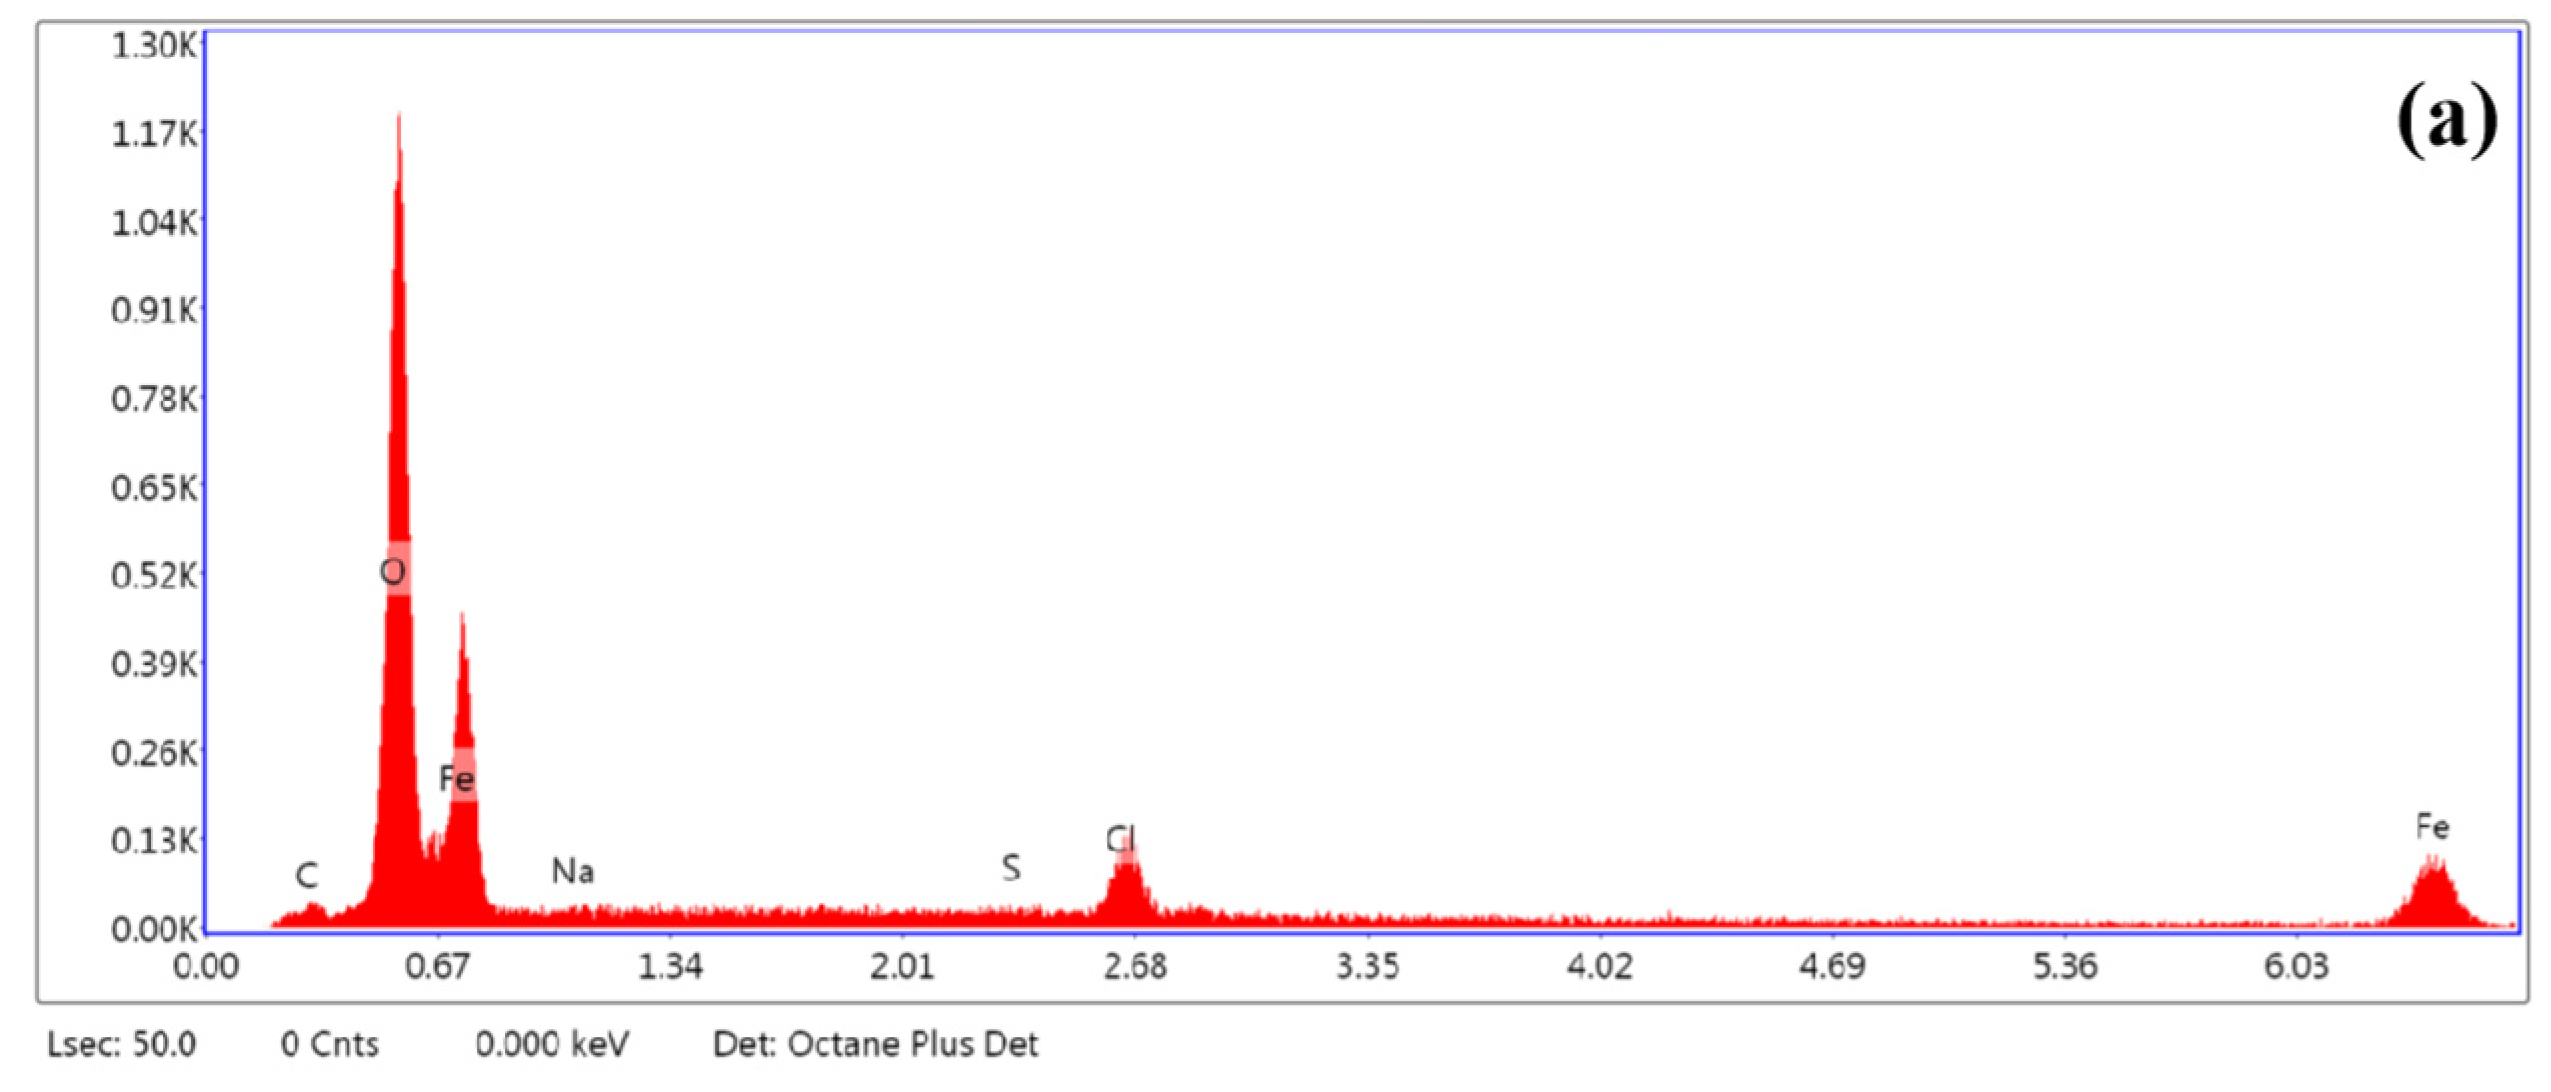
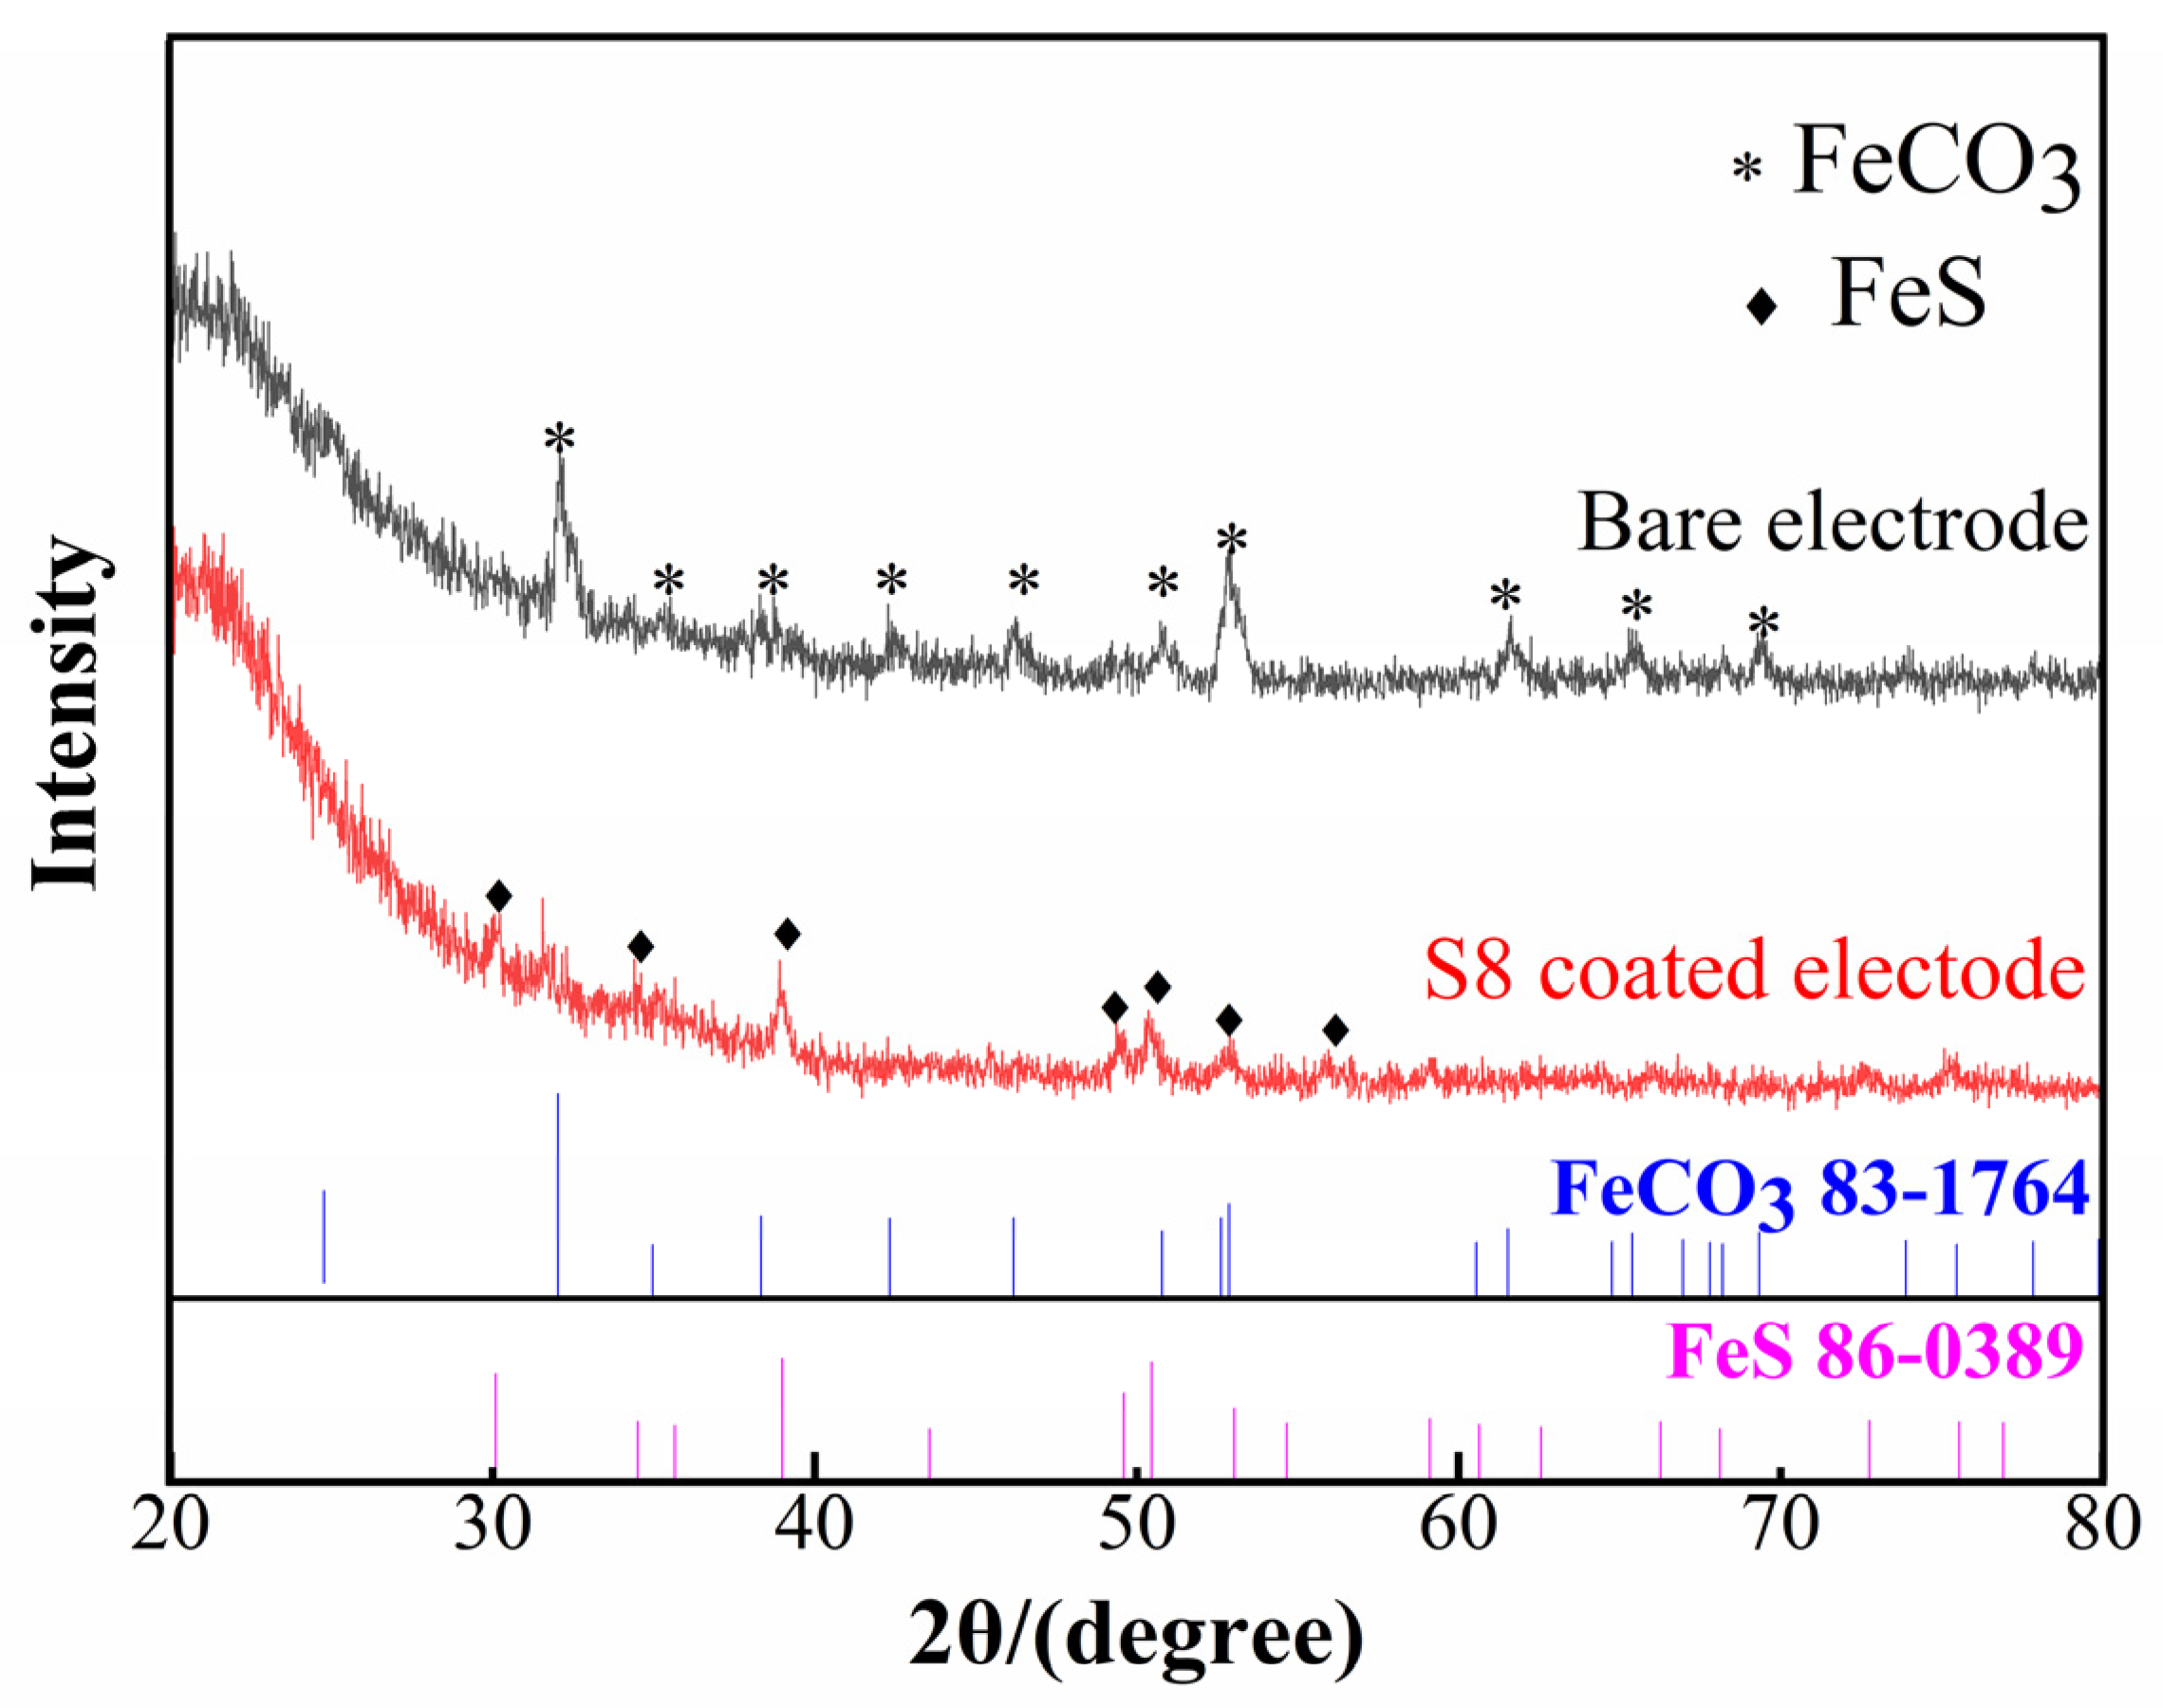
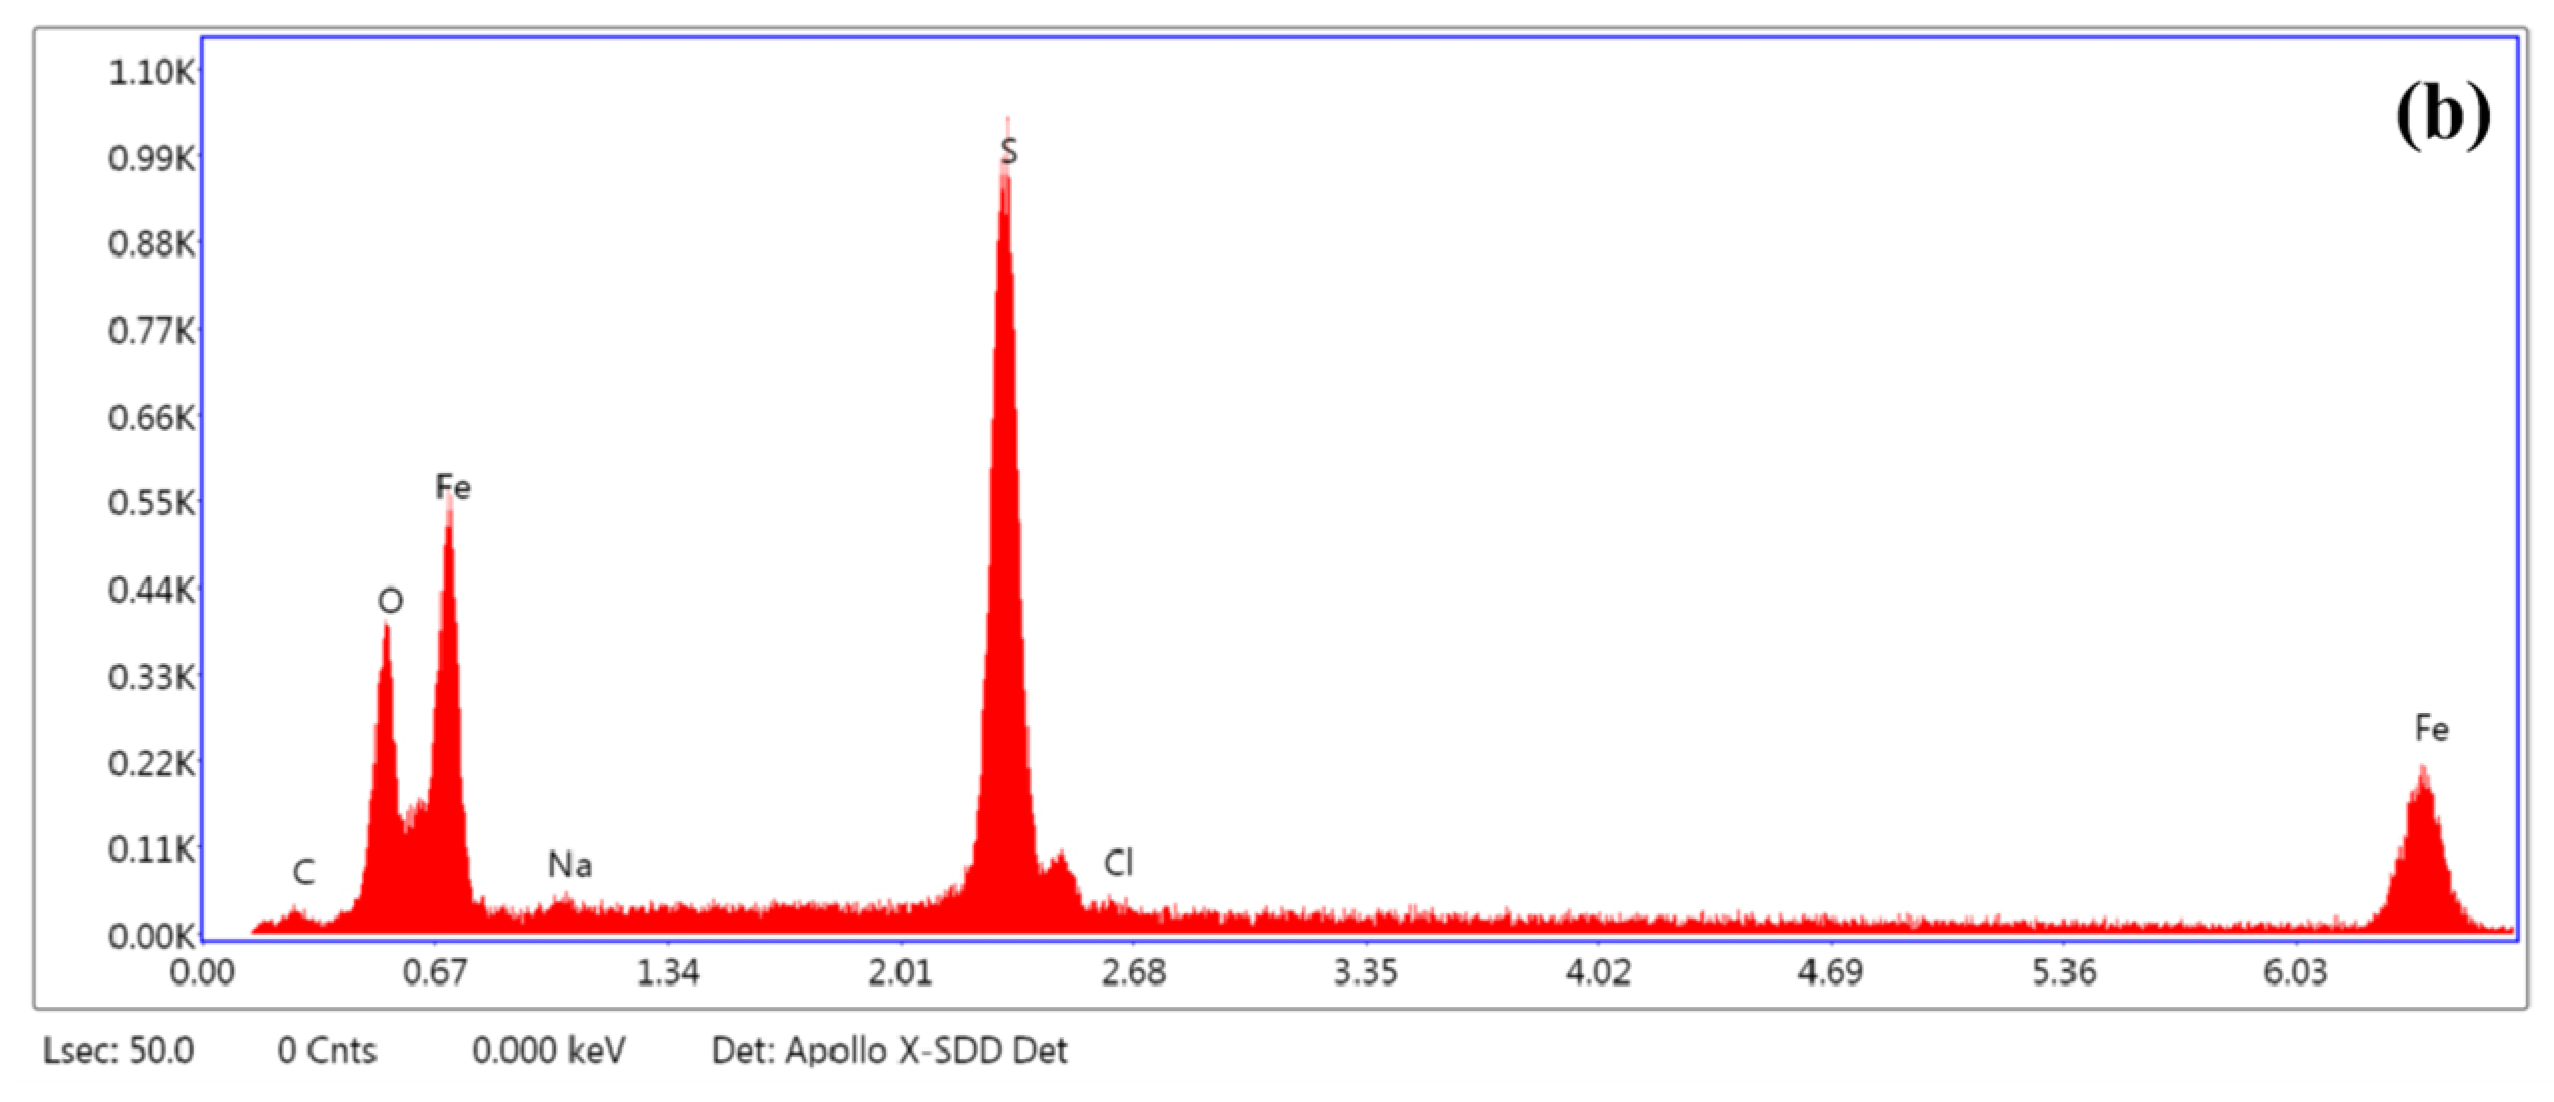
3.4. Surface and Component Characterization

The micromorphology of the corrosion products formed on the bare steel and S8-coated steel at different pH values with an autoclave is shown in Figure 8. The entire surface was uniformly covered by a thick and dense corrosion scale (Figure 8a–c), and there was no obvious localized corrosion. The dense corrosion scale provided protection for the substrate by hindering the corrosive species from penetrating the interface between the corrosion scale and the steel. The surface of the S8-coated steel was covered with an incomplete and loose corrosion scale and dispersed solid particles, and some small holes and recessed areas were observed at pH = 3.10, indicating that the steel suffered from serious localized corrosion attacks. Therefore, the presence of S8 changed the structure of the corrosion scale, leading to a reduction in the resistance of corrosion scale to the corrosive medium. The corrosion of the S8-coated steel was more serious than that of the bare steel, which was consistent with the results of potential polarization.
To further evaluate the corrosion difference between the bare electrode and S8-coated electrode at pH = 3.10, an OLYMPUS DSX500 optical digital microscope was used to observe and calculate the maximum corrosion depth of the metal substrate after removing the corrosion scale in the bright field (BF) mode. Representative 3D images are shown in Figure 9. To comprehend the severity of the localized corrosion, a pitting factor was proposed to characterize the severity of pitting corrosion [15]:
P F = p d
where PF is the pitting factor, p is the deepest metal penetration (µm), and d is the average metal penetration (µm). The PF value was positively correlated with the destructiveness of pitting, and the pitting corrosion threat was obvious at PF > 5. According to the results in Table 3, the PF value of the S8-coated electrode was above 5, whereas that of the bare electrode was at a low level.
Only a small number of pores and scratches were observed on the bare electrode’s surface, and the substrate was relatively flat. Many large pores were found on the surface of the S8 deposition electrode, and the metal substrate was uneven. Therefore, the characteristics of deeper holes and surface roughness indicated that the corrosion of the S8-coated electrode was more serious, which further confirmed the results mentioned above.
Furthermore, Figure 10 shows the corresponding chemical composition of the corrosion scale. The main elements in the deposits were C, O, Fe, and S. Figure 11 illustrates the XRD spectra of the corrosion products of the S8-coated and bare electrodes at pH 3.10. The corrosion scale on the bare electrode was composed of FeCO3, which is a typical product in CO2 systems. FeCO3 is deposited on the electrode surface when the concentration of ferrous ions and carbonate ions surpasses the solubility product of FeCO3 at a certain temperature. The product on the S8-coated electrode was FeS. Therefore, the sediments on the substrate were mainly ferrous carbonate and ferrous sulfide.

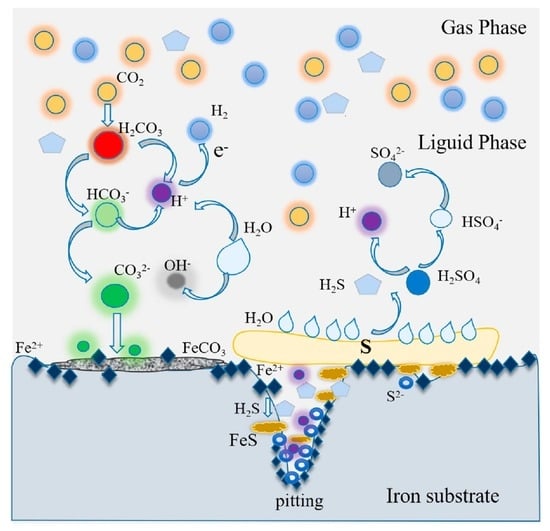
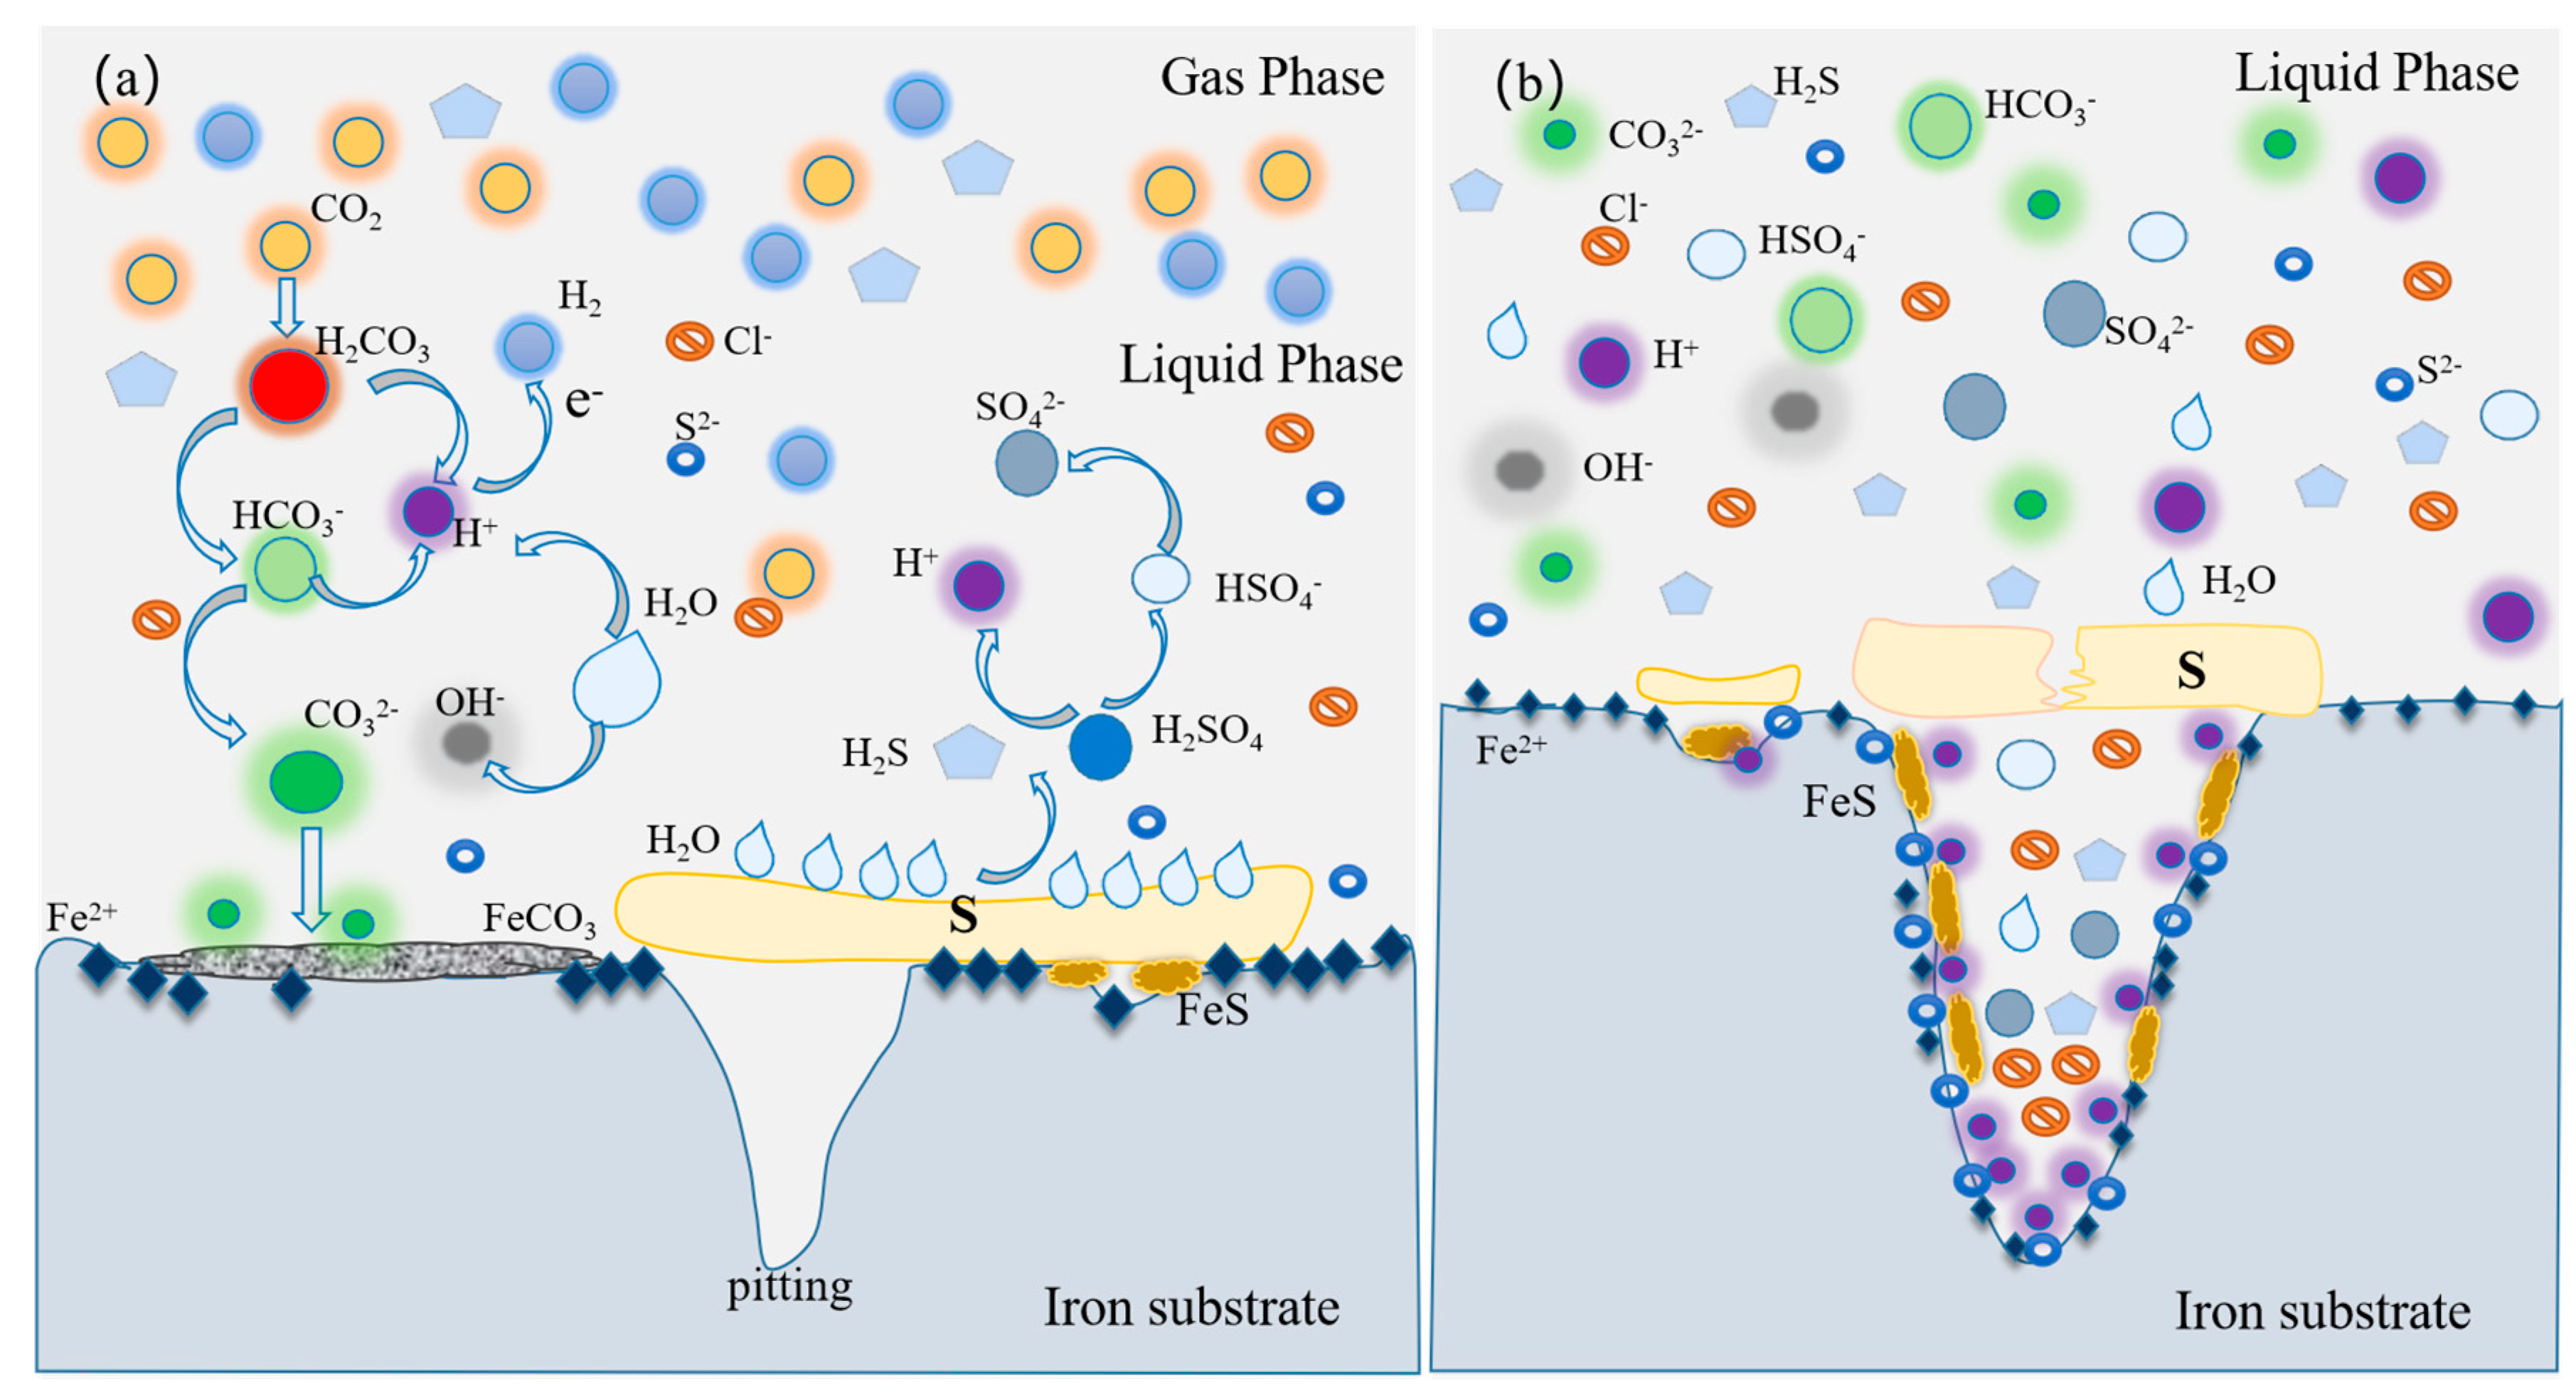
4. Corrosion Mechanism

The presence of S8 and CO2 accelerated corrosion by reacting directly with the metal substrate or forming acid by hydrolysis to further promote corrosion. The corrosion process under S8 deposition mainly included the hydrolysis of S8, formation of the corrosion product (ferrous sulfide), and further catalytic corrosion caused by ferrous sulfide in addition to Cl [27]. The following equations are proposed to explain the corrosion formation of steel caused by S8 deposition on the electrode surface.
Cathodic reaction:
2H2CO3(aq) + 2e → H2(g) + 2HCO3(aq)
2HCO3(aq) + 2e → H2(g) + 2CO32−(aq)
2H2O(l) + 2e → H2(g) + 2OH(aq)
S y 1 · S 2 + 2 ( x 1 )   e + 2 xH +   F e S   xH 2 S + S y x
H+ + e → Hads → 1/2H2
Anodic reaction process:
(x − 1)Fe → (x − 1)Fe2+ + 2(x − 1)e
(x − 1)Fe2+ + (x − 1)H2S → (x − 1)FeS + 2(x − 1)H+
Fe2+(aq) + CO32− (aq) → FeCO3(s)
Overall corrosion reaction:
S8 + 8H2O → 6H2S + 2H2SO4
H2S ⟺ H+ + HS
HS ⟺ H+ + S2−
( x 1 ) Fe + S y 1   ·   S 2 + 2 H +   F e S   ( x 1 ) FeS + H 2 S + S y x
In the above reaction equations, Fe2+ generated by the substrate entered the solution, and initially combined with CO32 to form FeCO3 or with S2 and SO42 to form FeS and FeSO4. In the CO2-saturated acidic solution, the direct reduction of carbonic acid was the main cathodic reaction, and other possible cathodic reactions, including H+ reduction, were ignored. Sy−1·S2, as a reduced substance under the catalysis of ferrous sulfide, was considered to be formed by the chemical adsorption of sulfide ions on the surfaces of S8 particles, and corrosive substances might also involve adsorbed polysulfate ions, which may be formed by the reaction of S8 with water [14]. It has been reported that acidification occurs in sulfur-containing aqueous systems, and H2SO2, H2SO3, H2SO4, H2S, and polysulfides are species for the hydrolysis products of S8.
At the beginning of corrosion, the surface of the metal substrate was covered by S8, and the corrosion process was a self-catalytic process. The direct contact between the metal substrate and S8 was a necessary factor for corrosion, which would lead to the corrosion potential moving in the positive direction, and it was easy to induce pitting corrosion with defect areas [27]. Then, the Cl and acid solution contacted the substrate, further aggravating the corrosion. However, some scholars believe that, in the presence of S8, the hydrolysis of S8 to generate acid is the main factor controlling corrosion, and sulfide-catalyzed cathodic sulfur reduction is considered to be the most important step [28]. To better demonstrate the corrosion mechanism of the S8-coated electrode, a pattern was proposed, as shown in Figure 12.
The deposition of S8 on the metal surface was non-uniform for the electrode coated without S8, which directly contacted the NaCl solution containing CO2, mainly resulting in the anodic dissolution of the metal and the reduction of H2CO3. The typical corrosion scale of FeCO3 was formed, covering the surface of the metal and preventing Cl from contacting the metal substrate, which is consistent with the results of XRD and SEM. In addition, with an increase in pH, the solubility of CO2 in the solution decreased, and the stability of the corrosion product FeCO3 was also enhanced. Finally, the corrosion rate slowed with an increase in pH, as shown in the left half of Figure 12a. S8 reacted with the metal substrate and formed the corresponding sulfide, such as FeS (Equation (9)). At the same time, hydrolysis of S8 occurred, and the solution was acidified. With the passage of time, the hydrolysis of S8 and the dissolution of H2CO3 occurred slowly, and the local environment between the S8 deposition layer and metal substrate changed, which was mainly manifested in the excessive pH shifting from neutral to acidic and activated the dissolution of metal. In addition, the hydrolysis products of S8, H2SO4 and H2S, contacted the metal and combined with Fe2+ to form FeS and FeSO4, as shown in Figure 11.
Crevice corrosion was also formed due to the non-uniform deposition of S8, and localized corrosion occurred first at the edge of the deposition of S8. There was a potential difference between the steel substrate and the corrosion products with electronic conductivity, such as FeS and FeCO3, and the substrate covered by S8. Therefore, the potential of the electrode covered by S8 was significantly lower than that of the bare electrode or corrosion products. The metal under S8 deposition was used as the anode corrosion area, and the bare electrode or corrosion products were used as the cathodic protection area, forming a large cathode and a small anode, which caused galvanic corrosion and further accelerated the corrosion under deposits [29,30], as shown in Figure 12a.
At the same time, the environment under the S8 deposition was different from that of the surface of the bare electrode, and the corrosion behavior changed. The self-catalytic cathodic reaction accelerated the corrosion of the substrate during S8 deposition. A self-catalytic cathodic reaction occurred when the electrode was covered with S8 in an aqueous solution. Ferrous sulfide is an electronic conductor with structural defects and low hydrogen overpotential, so it has a catalytic effect on the cathodic reaction [14], as shown in Figure 12b.
In addition, the chloride concentration had a significant influence on the overall corrosion rate (Equations (13) and (14)). When the chloride content was high, the concentration of dissolved Fe2+ ions was much higher than the solubility constant of FeS [28].
Anodic metal dissolution in the presence of Cl:
Fe + 2Cl + H2O → [Fe(OH)+ + Cl] + HCl + 2e
Cathodic sulfur reduction in the presence of Cl:
[FeSx+1] + 2e + 2Na+ + H2O → [FeSx] + (Na+ + SH) + NaOH
With a decrease in pH, especially at the tips of pits, higher concentrations of H+ (lower pH) accumulated under S8 deposition due to the hydration of Fe2+, forming an occluded corrosion chamber, which aggravated pitting corrosion. Cl with a negative charge in the solution was adsorbed into the corrosion chamber with a positive charge to maintain the charge balance, which accelerated the anodic dissolution of the metal and negatively shifted the cathode potential, further deteriorating the environment under the S8 deposition layer. Furthermore, pitting began to expand outward, increasing the range of pitting and further accelerating the corrosion of the L360 pipeline steels.

5. Conclusions

In this work, the effect of S8 deposition on the corrosion behavior of L360 pipeline steel in CO2−Cl medium at different pH values at 60 °C was studied using electrochemical measurements and surface analysis.
(1) The corrosion current densities of the electrode coated with S8 were larger, and the Rct value was 1/27 that of the bare electrode. Pitting corrosion cavities were observed on the surface of the electrode under S8 deposition in acidic conditions, and the bare electrode suffered uniform corrosion.
(2) The LCII and morphology further proved that the deposition of S8 enhanced localized corrosion at pH = 3.10.
(3) The deposition of S8 not only acidized the solution but also increased the difference in the corrosion environment inside and outside of the S8 deposition layer, resulting in serious pitting corrosion under S8 deposition.

Author Contributions

Formal analysis, C.Q. and F.C.; Investigation, S.Z.; Resources, T.Y. and B.Y.; Supervision, Y.L.; writing—original draft preparation, F.W. and J.L. All authors have read and agreed to the published version of the manuscript.

Funding

This work was funded by the National Natural Science Foundation of China (21808182, 51974245). Key Laboratory Scientific Research Project of Shaanxi Provincial Department of Education (18JS088).

Institutional Review Board Statement

Not applicable.

Informed Consent Statement

Not applicable.

Data Availability Statement

Not applicable.

Conflicts of Interest

The authors declare no conflict of interest.

References

  1. Obot, I.B. Under Deposit Corrosion on Steel Pipeline Surfaces: Mechanism, Mitigation and Current Challenges. J. Bio-Tribo-Corros. 2021, 7, 1–14. [Google Scholar] [CrossRef]
  2. Tan, Y.; Fwu, Y.; Bhardwaj, K. Electrochemical evaluation of under deposit corrosion and its inhibition using the wire beam electrode method. Corros. Sci. 2011, 53, 1254–1261. [Google Scholar] [CrossRef]
  3. Katerina, K.; Gubner, R. Development of standard test method for investigation of under deposit corrosion in carbon dioxide environment and its application in oil and gas industry. In Proceedings of the CORROSION 2010, San Antonio, TX, USA, 14–18 March 2010. [Google Scholar]
  4. Hoshowski, J.; Pineiro, R.P.; Nordvik, T.; Barnes, P.; Jenkins, A. The Development of Novel Corrosion Inhibitors for High Temperature Sour Gas Environments. In Proceedings of the CORROSION 2020, Online, 14–18 June 2020. [Google Scholar]
  5. Cao, M.; Liu, L.; Yu, Z.; Fan, L.; Li, Y.; Wang, F. Electrochemical corrosion behavior of 2A02 Al alloy under an accelerated simulation marine atmospheric environment. J. Mater. Sci. Technol. 2019, 35, 651–659. [Google Scholar] [CrossRef]
  6. Zheng, Y.; Brown, B.; Nešić, S. Electrochemical study and modeling of H2S corrosion of mild steel. Corrosion 2014, 70, 351–365. [Google Scholar] [CrossRef] [Green Version]
  7. Wen, X.; Bai, P.; Luo, B.; Zheng, S.; Chen, C. Review of recent progress in the study of corrosion products of steels in a hydrogen sulphide environment. Corros. Sci. 2018, 139, 124–140. [Google Scholar] [CrossRef]
  8. Wang, Q.; Wu, W.; Li, Q.; Zhang, D.; Yu, Y.; Cao, B.; Liu, Z. Under deposit corrosion of tubing served for injection and production wells of CO2 flooding. Eng. Fail. Anal. 2021, 127, 105540–105552. [Google Scholar] [CrossRef]
  9. Chang, Y.N.; Wei, F.I. High temperature chlorine corrosion of metals and alloys. J. Mater. Sci. 1991, 26, 3693–3698. [Google Scholar] [CrossRef]
  10. Zhang, S.; Hou, L.; Du, H.; Wei, H.; Liu, B.; Wei, Y. A study on the interaction between chloride ions and CO2 towards carbon steel corrosion. Corros. Sci. 2020, 167, 108531–108542. [Google Scholar] [CrossRef]
  11. Yang, L.; Zhu, S.; Lu, T. Study on the mechanism of elemental sulfur hydrolysis. Chem. Res. Appl. 2016, 28, 390–395. (In Chinese) [Google Scholar]
  12. Zhang, Y.N.; Wang, T.L.; Han, X.; Wang, Z.M.; Zhang, J. Corrosion of artificial rock layer covered steel electrodes in a CO2 environment: The influence of permeability. Corros. Sci. 2016, 105, 190–201. [Google Scholar] [CrossRef]
  13. Gong, K.; Wu, M.; Liu, G. Stress corrosion cracking behavior of rusted X100 steel under the combined action of Cl and HSO3 in a wet dry cycle environment. Corros. Sci. 2020, 165, 108382–108396. [Google Scholar] [CrossRef]
  14. MacDonald, D.D.; Roberts, B.; Hyne, J.B. The corrosion of carbon steel by wet elemental sulphur. Corros. Sci. 1978, 18, 411–425. [Google Scholar] [CrossRef]
  15. Gong, Q.; Xiang, Y.; Zhang, J.; Wang, R.; Qin, D. Influence of elemental sulphur on the corrosion mechanism of X80 steel in supercritical CO2 saturated aqueous phase environment. J. Supercrit. Fluids 2021, 176, 105320–105332. [Google Scholar] [CrossRef]
  16. Zhang, G.A.; Yu, N.; Yang, L.Y.; Guo, X.P. Galvanic corrosion behavior of deposit covered and uncovered carbon steel. Corros. Sci. 2014, 86, 202–212. [Google Scholar] [CrossRef]
  17. Xu, Y.; Liu, L.; Zhou, Q.; Wang, X.; Huang, Y. Understanding the influences of pre-corrosion on the erosion corrosion performance of pipeline steel. Wear 2020, 442, 203151. [Google Scholar] [CrossRef]
  18. Pan, C.q.; Zhong, Q.d.; Yang, J.; Frank Cheng, Y.; Chen, C. Investigating crevice corrosion of copper and copper alloys using wire beam electrode. Corros. Eng. Sci. Technol. 2021, 56, 407–418. [Google Scholar] [CrossRef]
  19. Tan, Y. Monitoring localized corrosion processes and estimating localized corrosion rates using a wire beam electrode. Corrosion 1998, 54, 403–413. [Google Scholar] [CrossRef]
  20. Wu, Y.L.; Zhang, D.P.; Cai, G.Y.; Zhang, X.X.; Dong, Z.H. Effects of temperature on polarity reversal of under deposit corrosion of mild steel in oilfield produced water. Corros. Eng. Sci. Technol. 2020, 55, 708–720. [Google Scholar] [CrossRef]
  21. Chen, J.; Wu, J.; Wang, P.; Zhang, D.; Chen, S.; Tan, F. Corrosion of 907 steel influenced by sulfate reducing bacteria. J. Mater. Eng. Perform. 2019, 28, 1469–1479. [Google Scholar] [CrossRef]
  22. Marcus, P. Surface science approach of corrosion phenomena. Electrochim. Acta 1998, 43, 109–118. [Google Scholar] [CrossRef]
  23. Bommersbach, P.; Alemany-Dumont, C.; Millet, J.P.; Normand, B. Formation and behaviour study of an environment friendly corrosion inhibitor by electrochemical methods. Electrochim. Acta 2005, 51, 1076–1084. [Google Scholar] [CrossRef]
  24. Jin, Z.; Ge, H.; Lin, W.; Zong, Y.; Liu, S.; Shi, J. Corrosion behaviour of 316L stainless steel and anti-corrosion materials in a high acidified chloride solution. Appl. Surf. Sci. 2014, 322, 47–56. [Google Scholar] [CrossRef]
  25. Cheng, Q.; Tao, B.; Song, L.; Zhang, W.; Liu, X.; Li, W.; Hou, B.; Liu, Q. Corrosion behaviour of Q235B carbon steel in sediment water from crude oil. Corros. Sci. 2016, 111, 61–71. [Google Scholar] [CrossRef]
  26. Tan, Y.; Aung, N.N.; Liu, T. Evaluating localised corrosion intensity using the wire beam electrode. Corros. Sci. 2012, 63, 379–386. [Google Scholar] [CrossRef]
  27. Fang, H.; Young, D.; Nesic, S. Corrosion of mild steel in the presence of elemental sulfur. Corrosion 2018. 08, Paper no.08637, OnePetro: 2008, NACE-08637. [Google Scholar]
  28. Schmitt, G. Effect of elemental sulfur on corrosion in sour gas systems. Corrosion 1991, 47, 285–308. [Google Scholar] [CrossRef]
  29. Zhao, Q.; Zhao, J.; Cheng, X.; Huang, Y.; Lu, L.; Li, X. Galvanic corrosion of the anodized 7050 aluminum alloy coupled with the low hydrogen embrittlement CdTi plated 300M steel in an industrial marine atmospheric environment. Surf. Coat. Technol. 2020, 382, 125171. [Google Scholar] [CrossRef]
  30. Yang, W.; Liu, Z.; Huang, H. Galvanic corrosion behavior between AZ91D magnesium alloy and copper in distilled water. Corros. Sci. 2021, 188, 109562. [Google Scholar] [CrossRef]
Figure 1. Potentiodynamic polarization curves with 3.5% NaCl at different pH values: (a) bare steel, (b) S8-coated steel.
Metals 11 01975 g001
Figure 2. Nyquist plots and Bode plots of the bare electrode and S8-coated electrode at different pH values: (ac) bare electrode, (df) S8-coated electrode.
Metals 11 01975 g002aMetals 11 01975 g002b
Figure 3. Potential (E) and galvanic current density (ig) distribution maps of WBE bare electrode at different pH values ((a,b): pH 3.10), ((c,d): pH 5.15), ((e,f): pH 7.18).
Metals 11 01975 g003aMetals 11 01975 g003b
Figure 4. Potential (E) and galvanic current density (ig) distribution maps of WBE with S8-coating at different pH values ((a,b): pH 3.10), ((c,d): pH 5.15), ((e,f): pH 7.18).
Metals 11 01975 g004aMetals 11 01975 g004b
Figure 5. Bare electrode statistical and calculated results for (a) the sum of anode current density itot, (b) the maximum anodic current density imax, (c) the localized corrosion intensity index LCII, and the number of anodes NA.
Metals 11 01975 g005
Figure 6. S8-coated electrode statistical and calculated results for (a) the sum of anode current density itot, (b) the maximum anodic current density imax, (c) the localized corrosion intensity index LCII, and the number of anodes NA.
Metals 11 01975 g006
Figure 7. Optical picture of WBE at pH = 3.10: (a) bare electrode, (b) S8−coated electrode.
Metals 11 01975 g007
Figure 8. SEM surface morphologies of the samples at different pH values: (a) bare steel, 3.10, (b) bare steel, 5.15, (c) bare steel, 7.18, (d) S8−coated steel, 3.10, (e) S8−coated steel, 5.15, (f) S8−coated steel, 7.18.
Metals 11 01975 g008
Figure 9. Three-dimensional profilometry measurement of corroded samples after removing corrosion products at pH = 3.10 for (ac) the bare electrode, (df) S8−coated electrode.
Metals 11 01975 g009
Figure 10. Elemental analysis (EDS) spectra: (a) bare electrode, (b) S8-coated electrode.
Metals 11 01975 g010aMetals 11 01975 g010b
Figure 11. XRD patterns of the bare electrode and S8-coated electrode at pH = 3.10.
Metals 11 01975 g011
Figure 12. Description of corrosion mechanism of L360 pipeline steel under S8 deposition in NaCl solution containing CO2: (a) S8 non-uniform deposition, (b) under S8 deposition.
Metals 11 01975 g012
Table 1. Parameters calculated by potentiodynamic polarization curve.
ElectrodepHEcorr (mV vs. SCE)Icorr (µA/cm2)ba (mV vs. SCE/dec)bc (mV vs. SCE/dec)
Bare3.10−640316264135
5.15−71042.043238.1
7.18−76134.426667.2
S8-coated3.10−55067873.766.3
5.15−57353621888.7
7.18−611490133126
Table 2. EIS data fitted electrochemical parameters.
ElectrodepHRs (Ω·cm2)Qdl (μF·cm−2)n1Rct (Ω·cm2)Qf(mF·cm−2)n2Rf (Ω·cm2)Chi-Squared
Bare3.101.500.2130.81463.9---2.22 × 10⁻³
5.151.040.3820.776230---5.14 × 10⁻³
7.181.702.040.570351---4.17 × 10⁻³
3.101.685.650.7314.020.4900.48521.74.85 × 10−4
S8-coated5.151.557.810.8258.460.1740.41337.33.08 × 10−3
7.181.851.170.73925.740.0580.45849.82.08 × 10−3
Table 3. Three−dimensional profilometry measurement depth at pH = 3.10.
Parameterp/µmd/µmPF
Bare electrode25.8421.021.23
S8-coated electrode137.1822.616.07
Publisher’s Note: MDPI stays neutral with regard to jurisdictional claims in published maps and institutional affiliations.

