
Heat Treatment Effects on Pristine and Cold-Worked Thin-Walled Inconel 625


Abstract
:1. Introduction
2. Materials and Methods
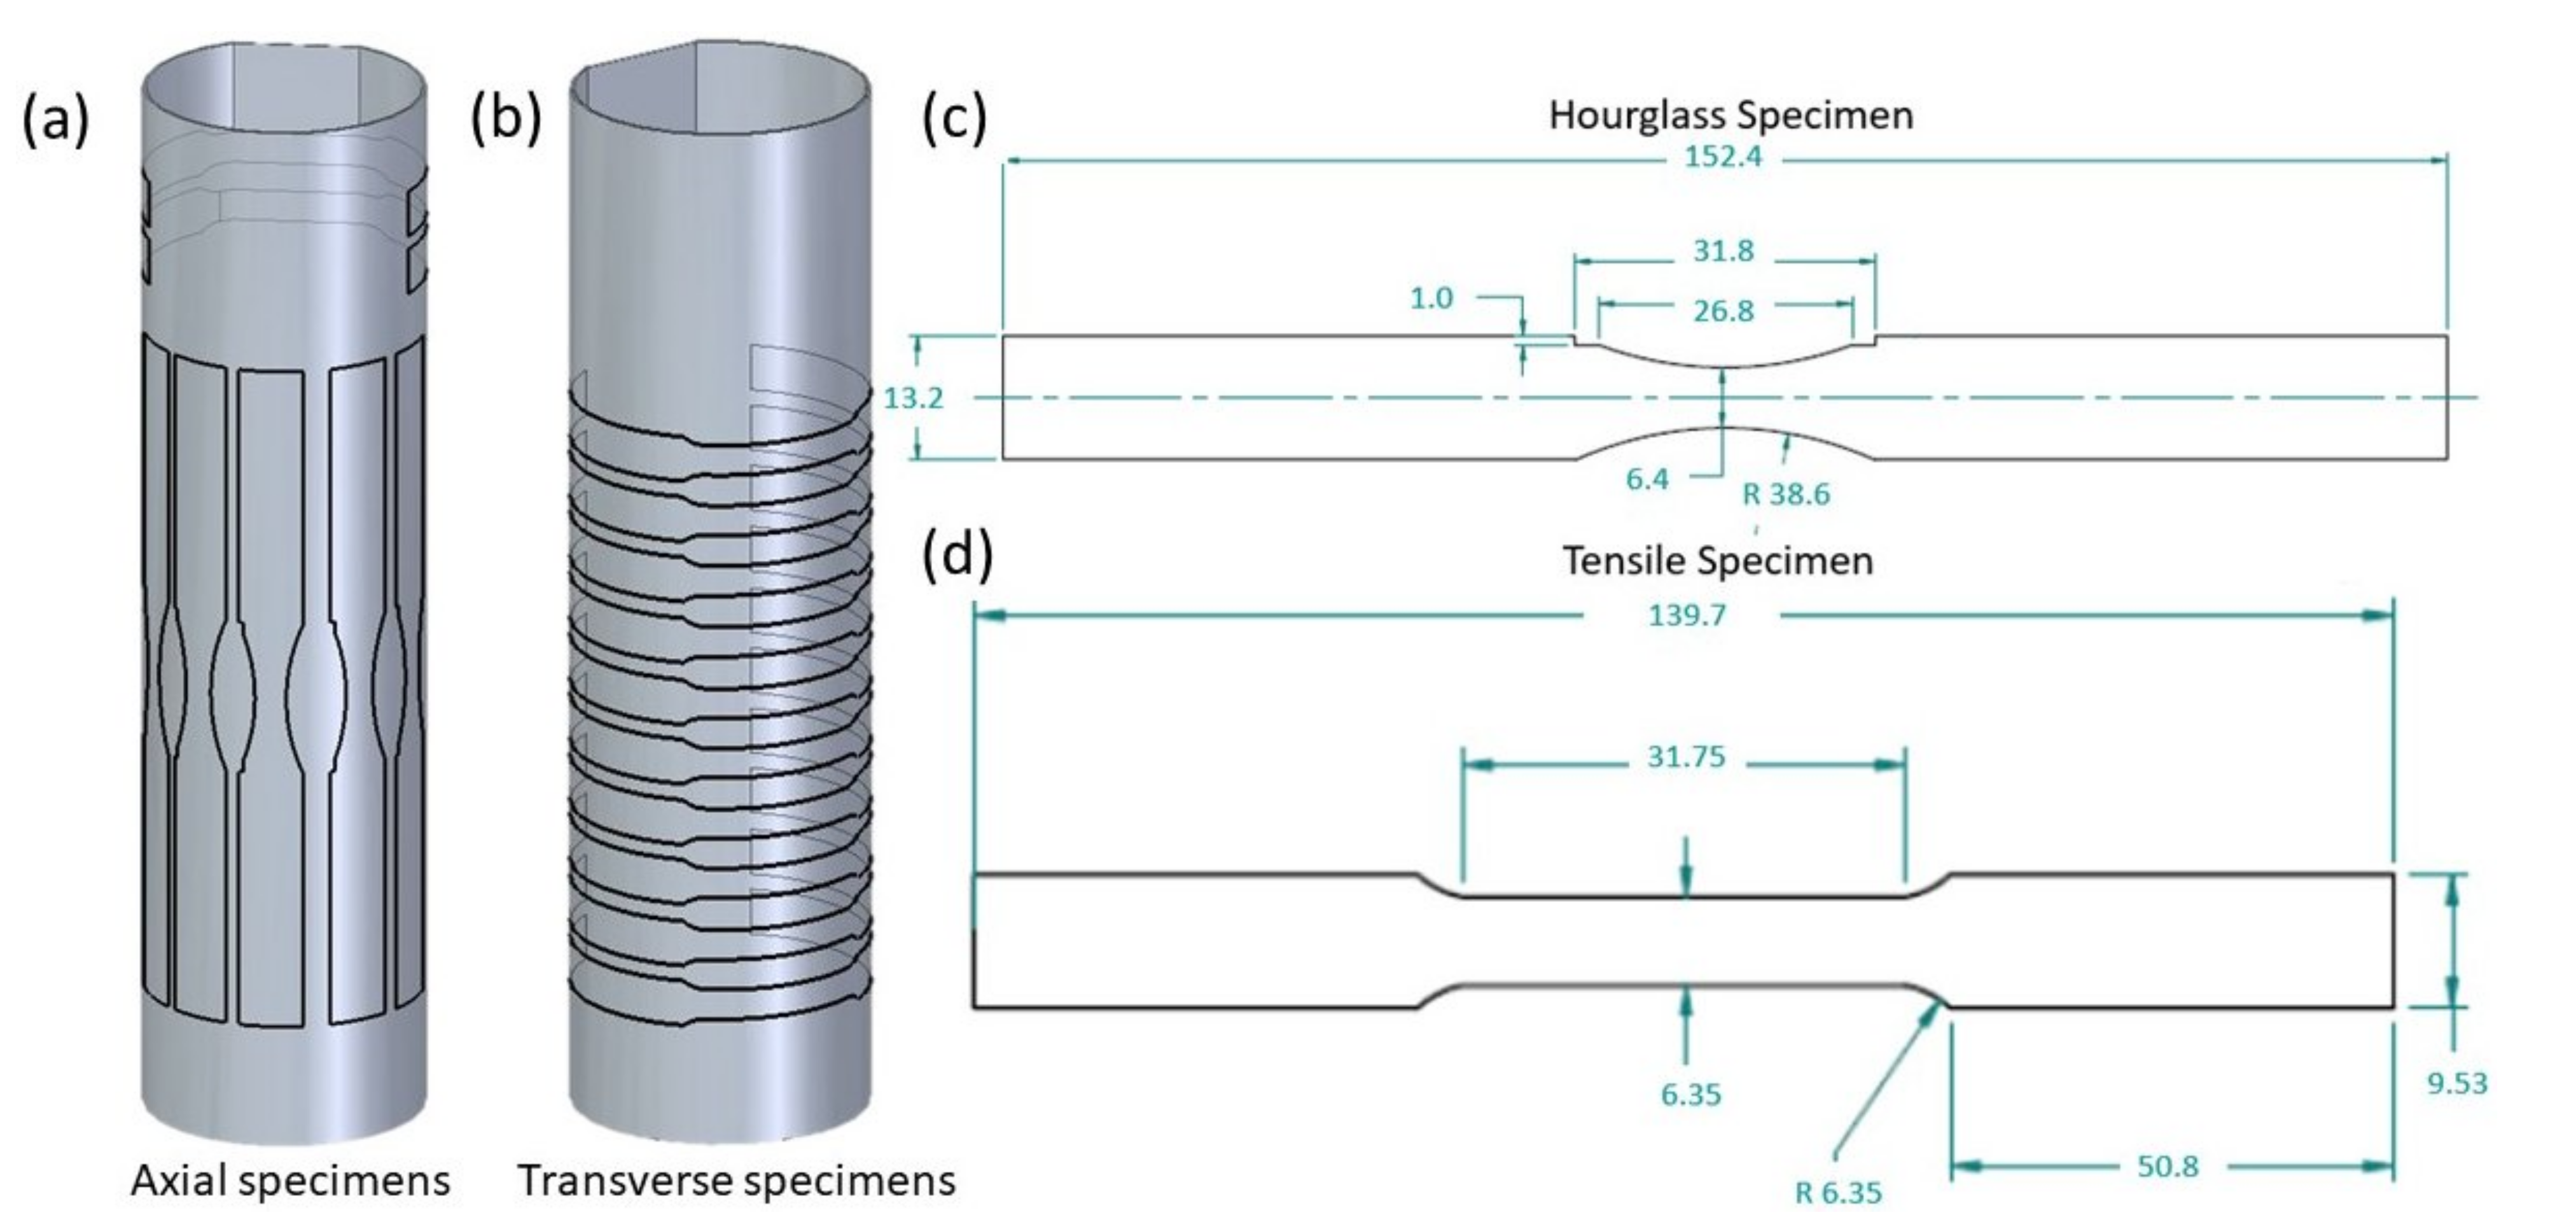
2.1. Specimen Cut Plan
2.2. Heat Treatment
2.3. Tensile Test
2.4. Metallography
2.4.1. Sample Preparation
2.4.2. Microscopy
2.5. Microhardness
DIC
3. Results and Discussion
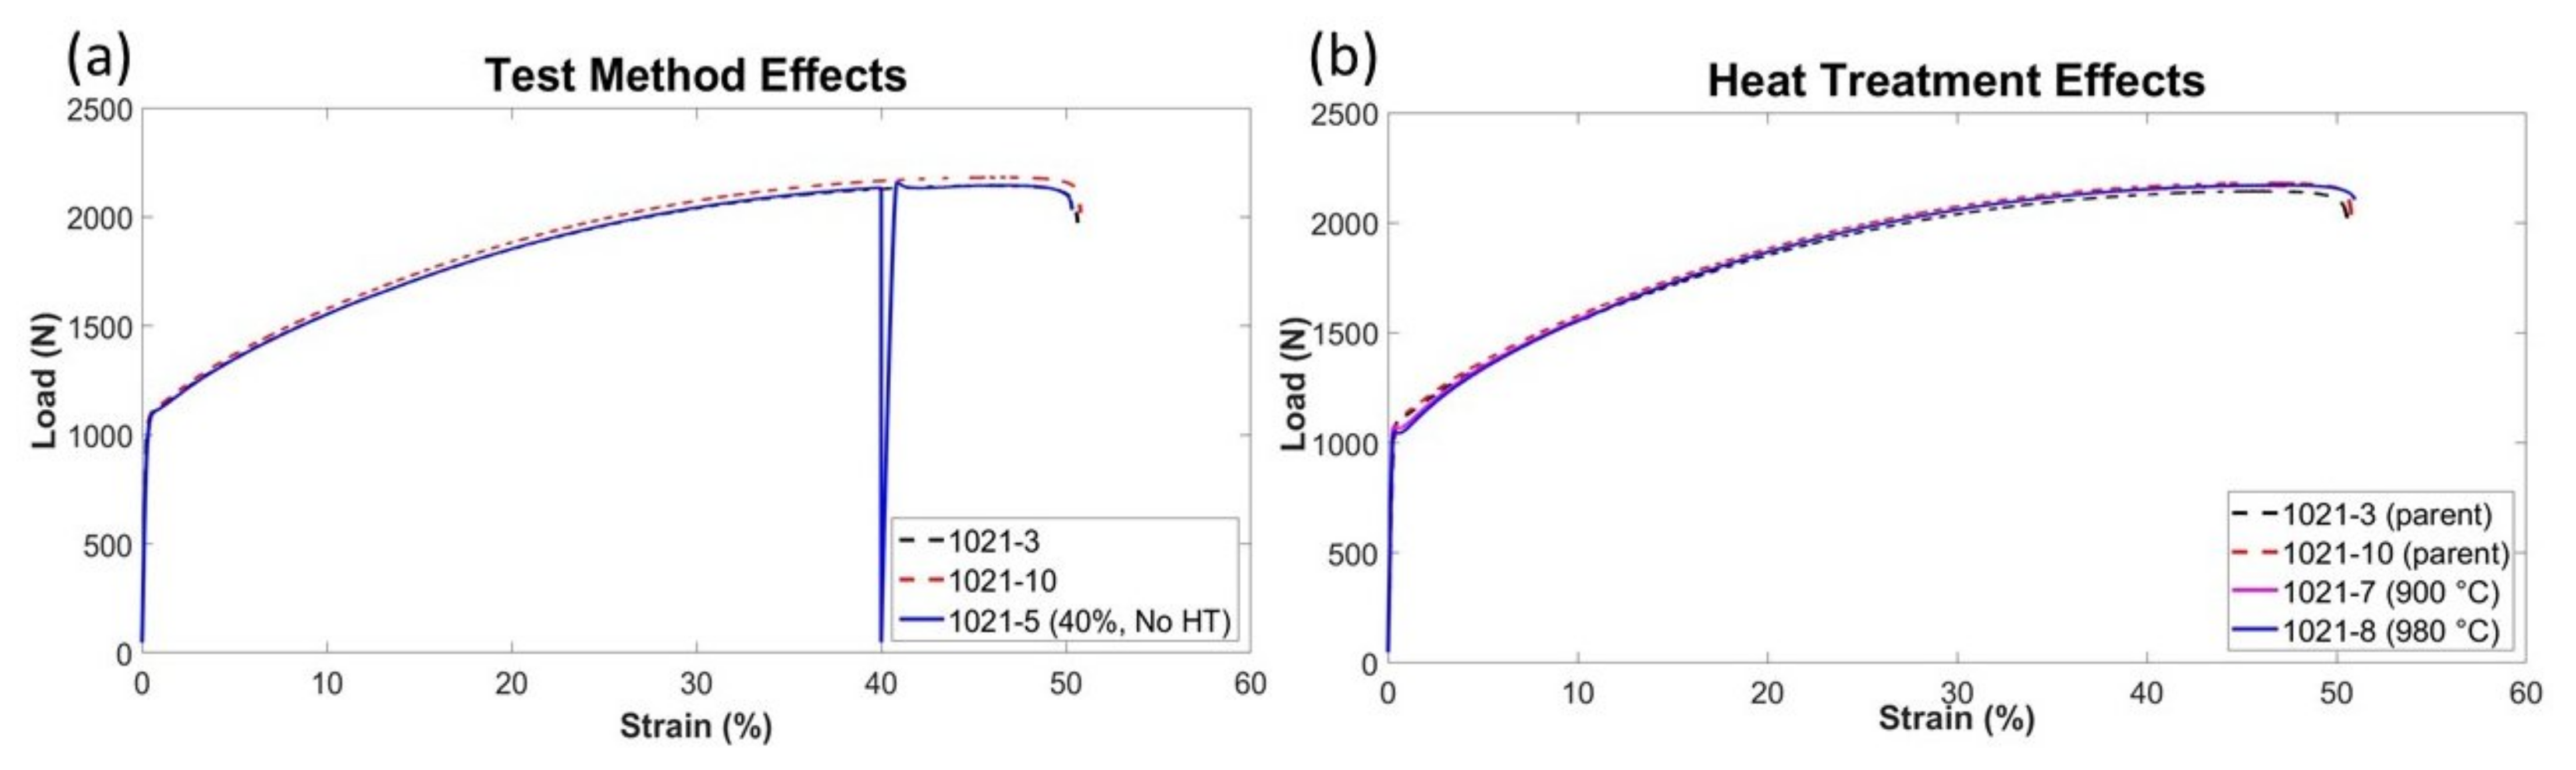
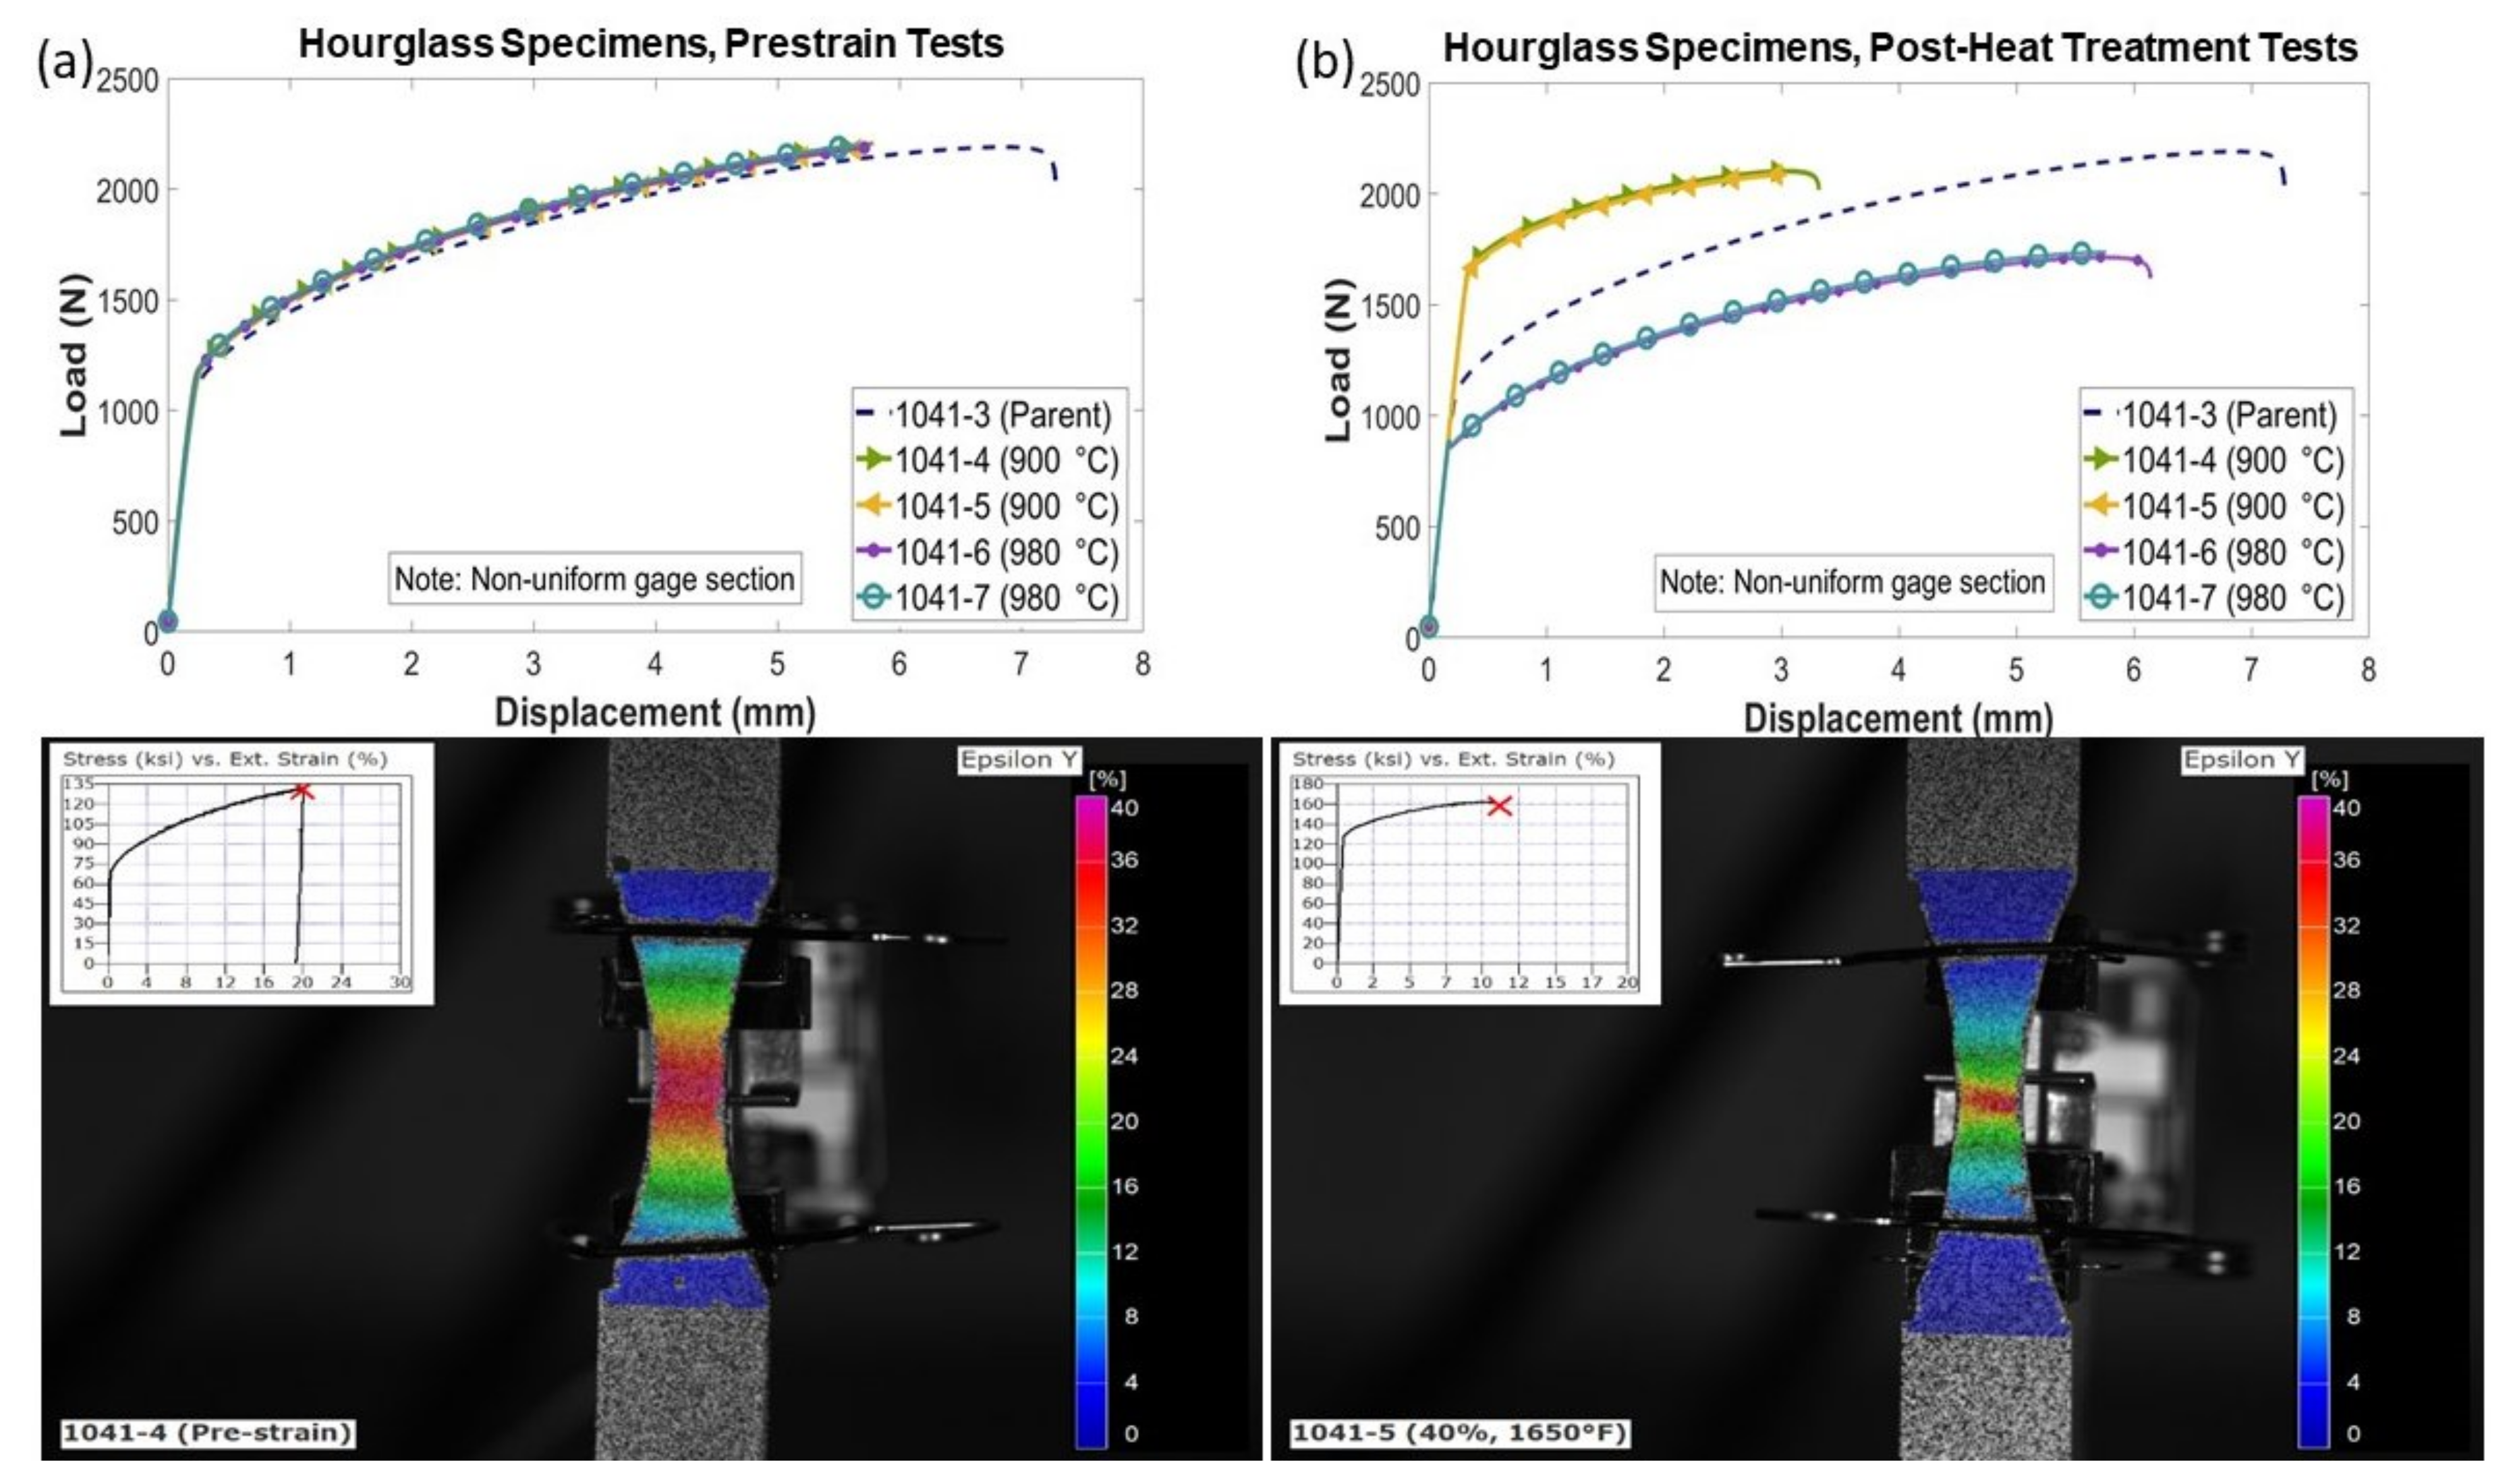
3.1. Mechanical Test
3.2. Microscopy
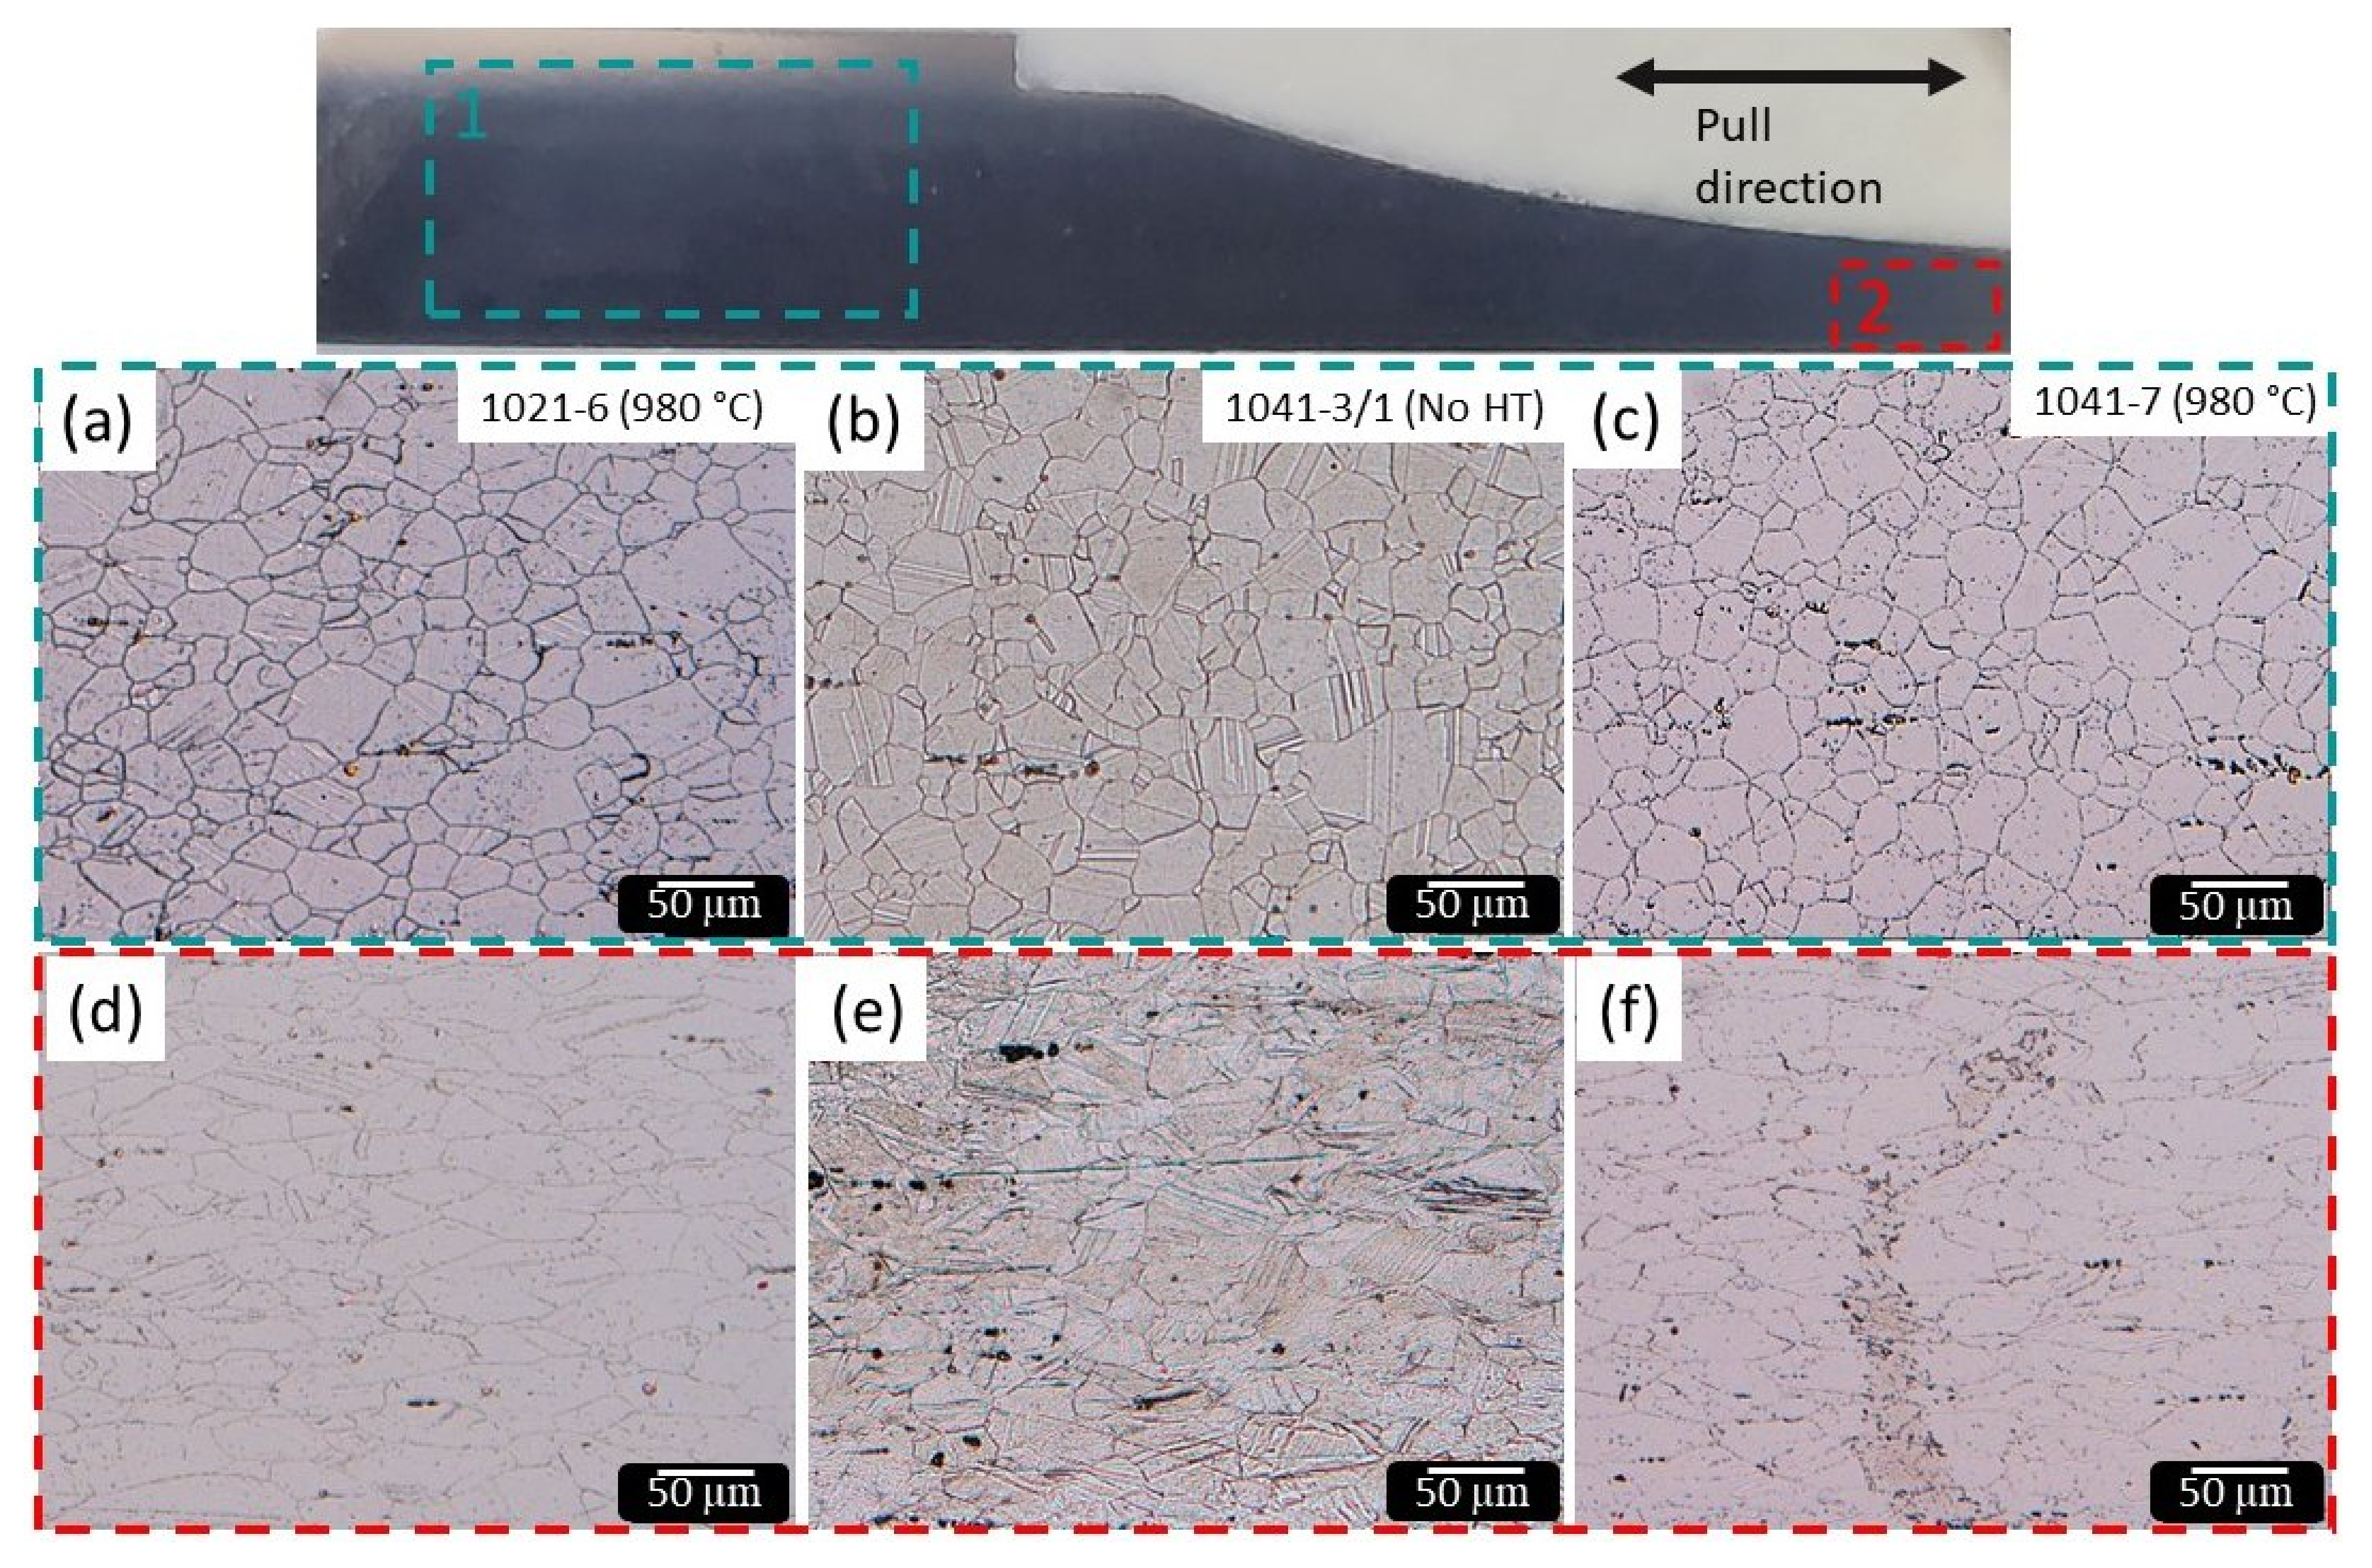
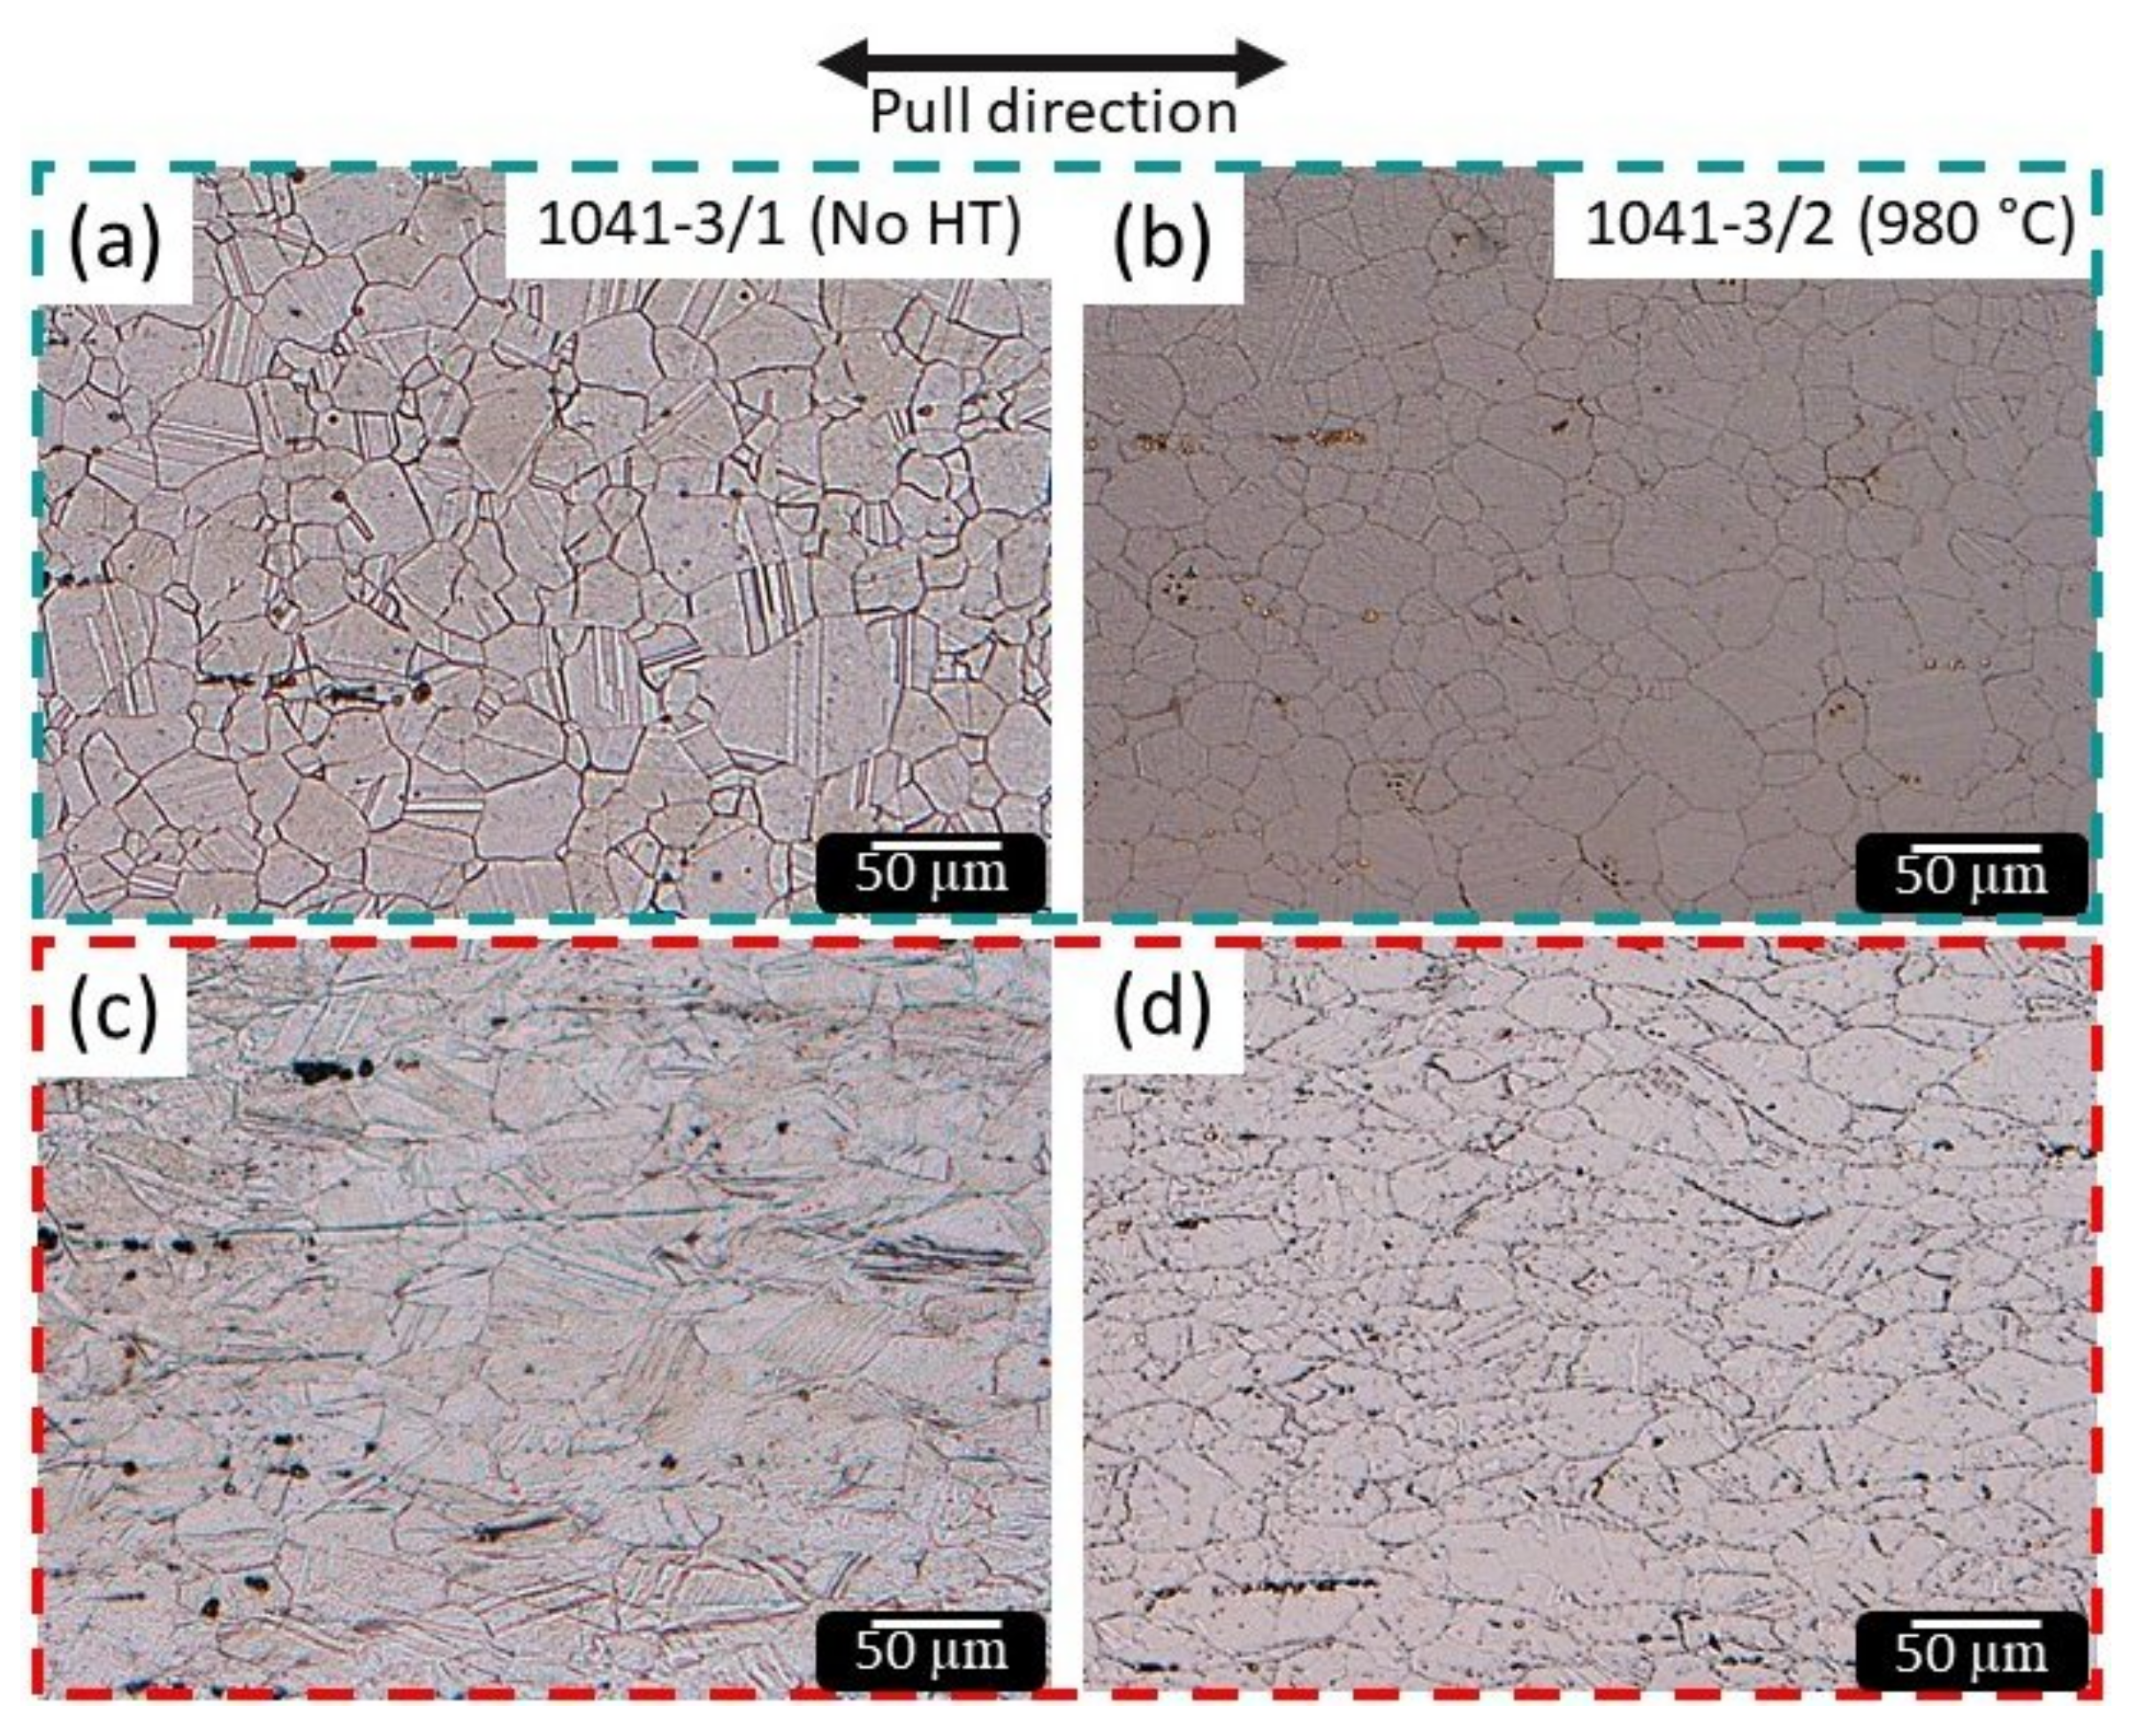
3.2.1. Optical
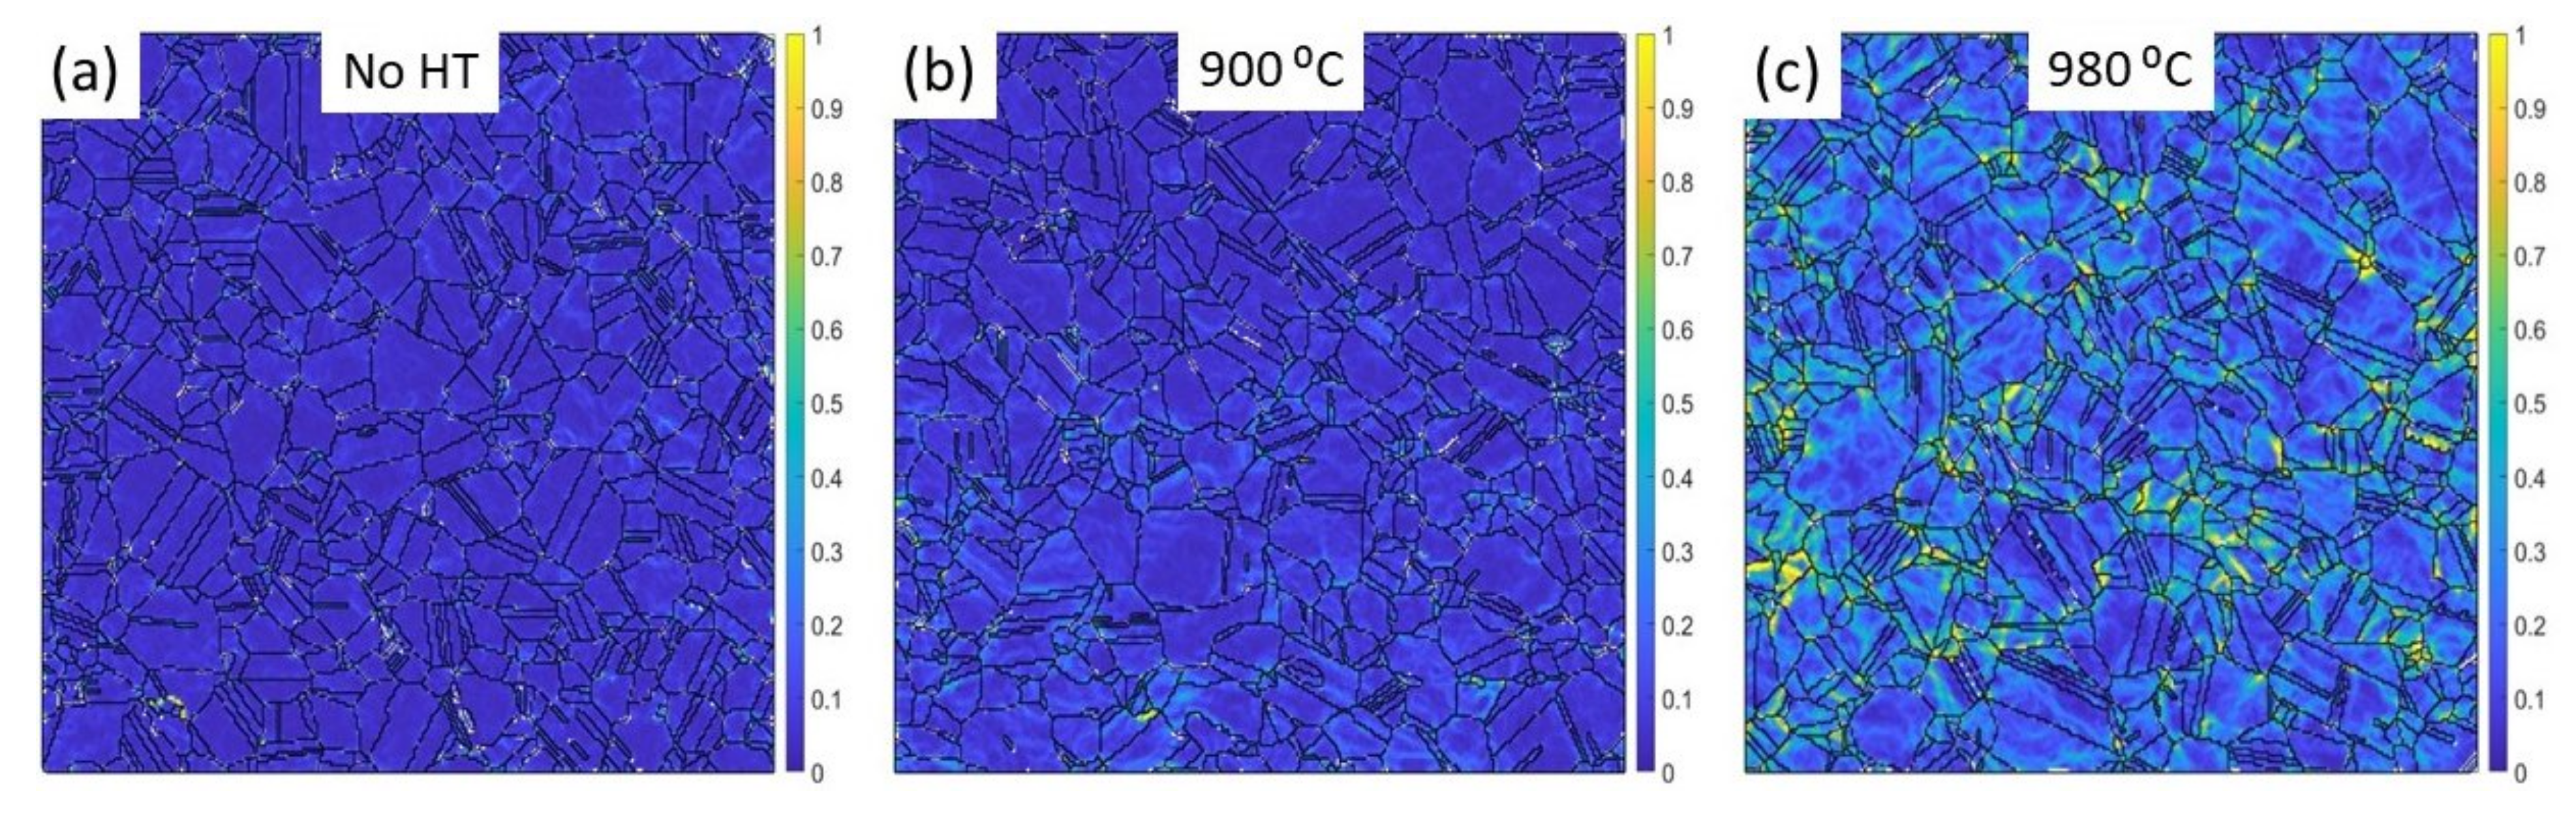
3.2.2. SEM/EBSD
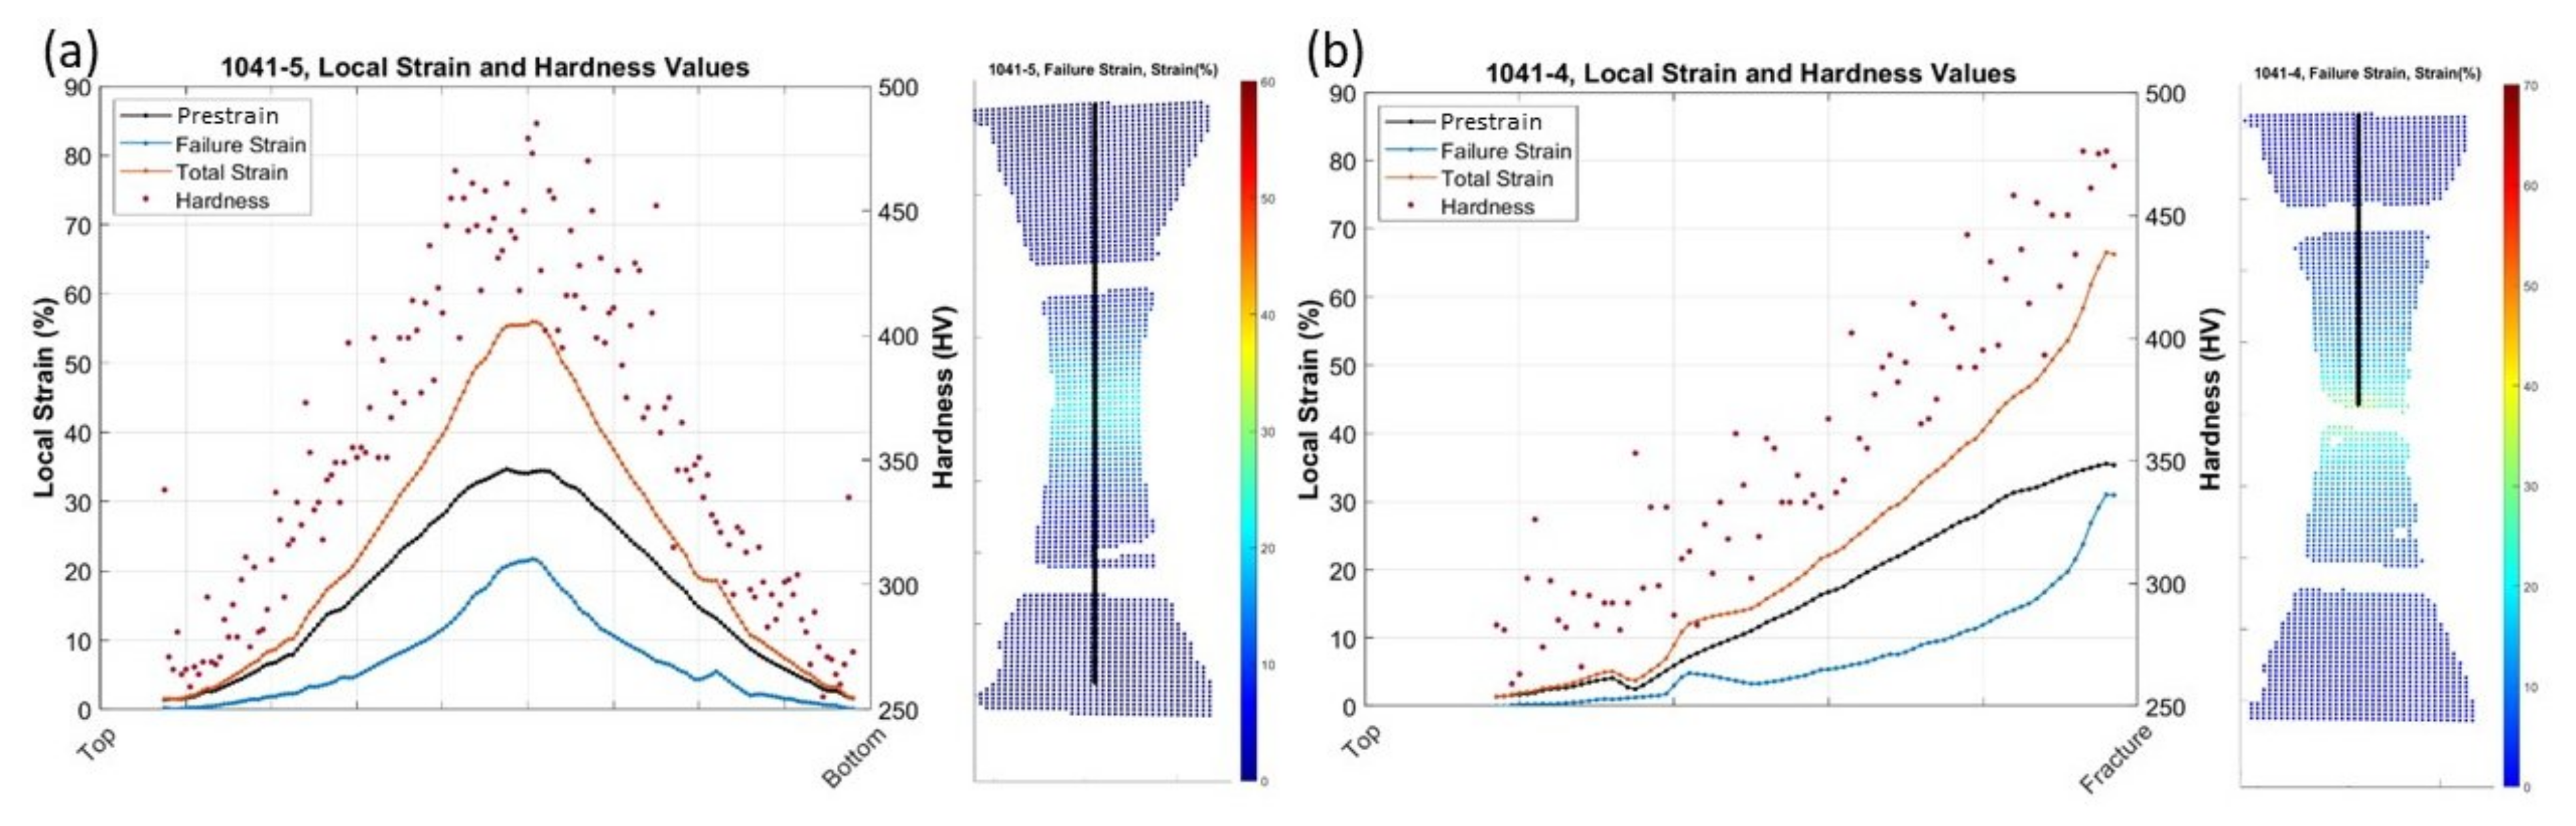
3.3. Strain and Hardness
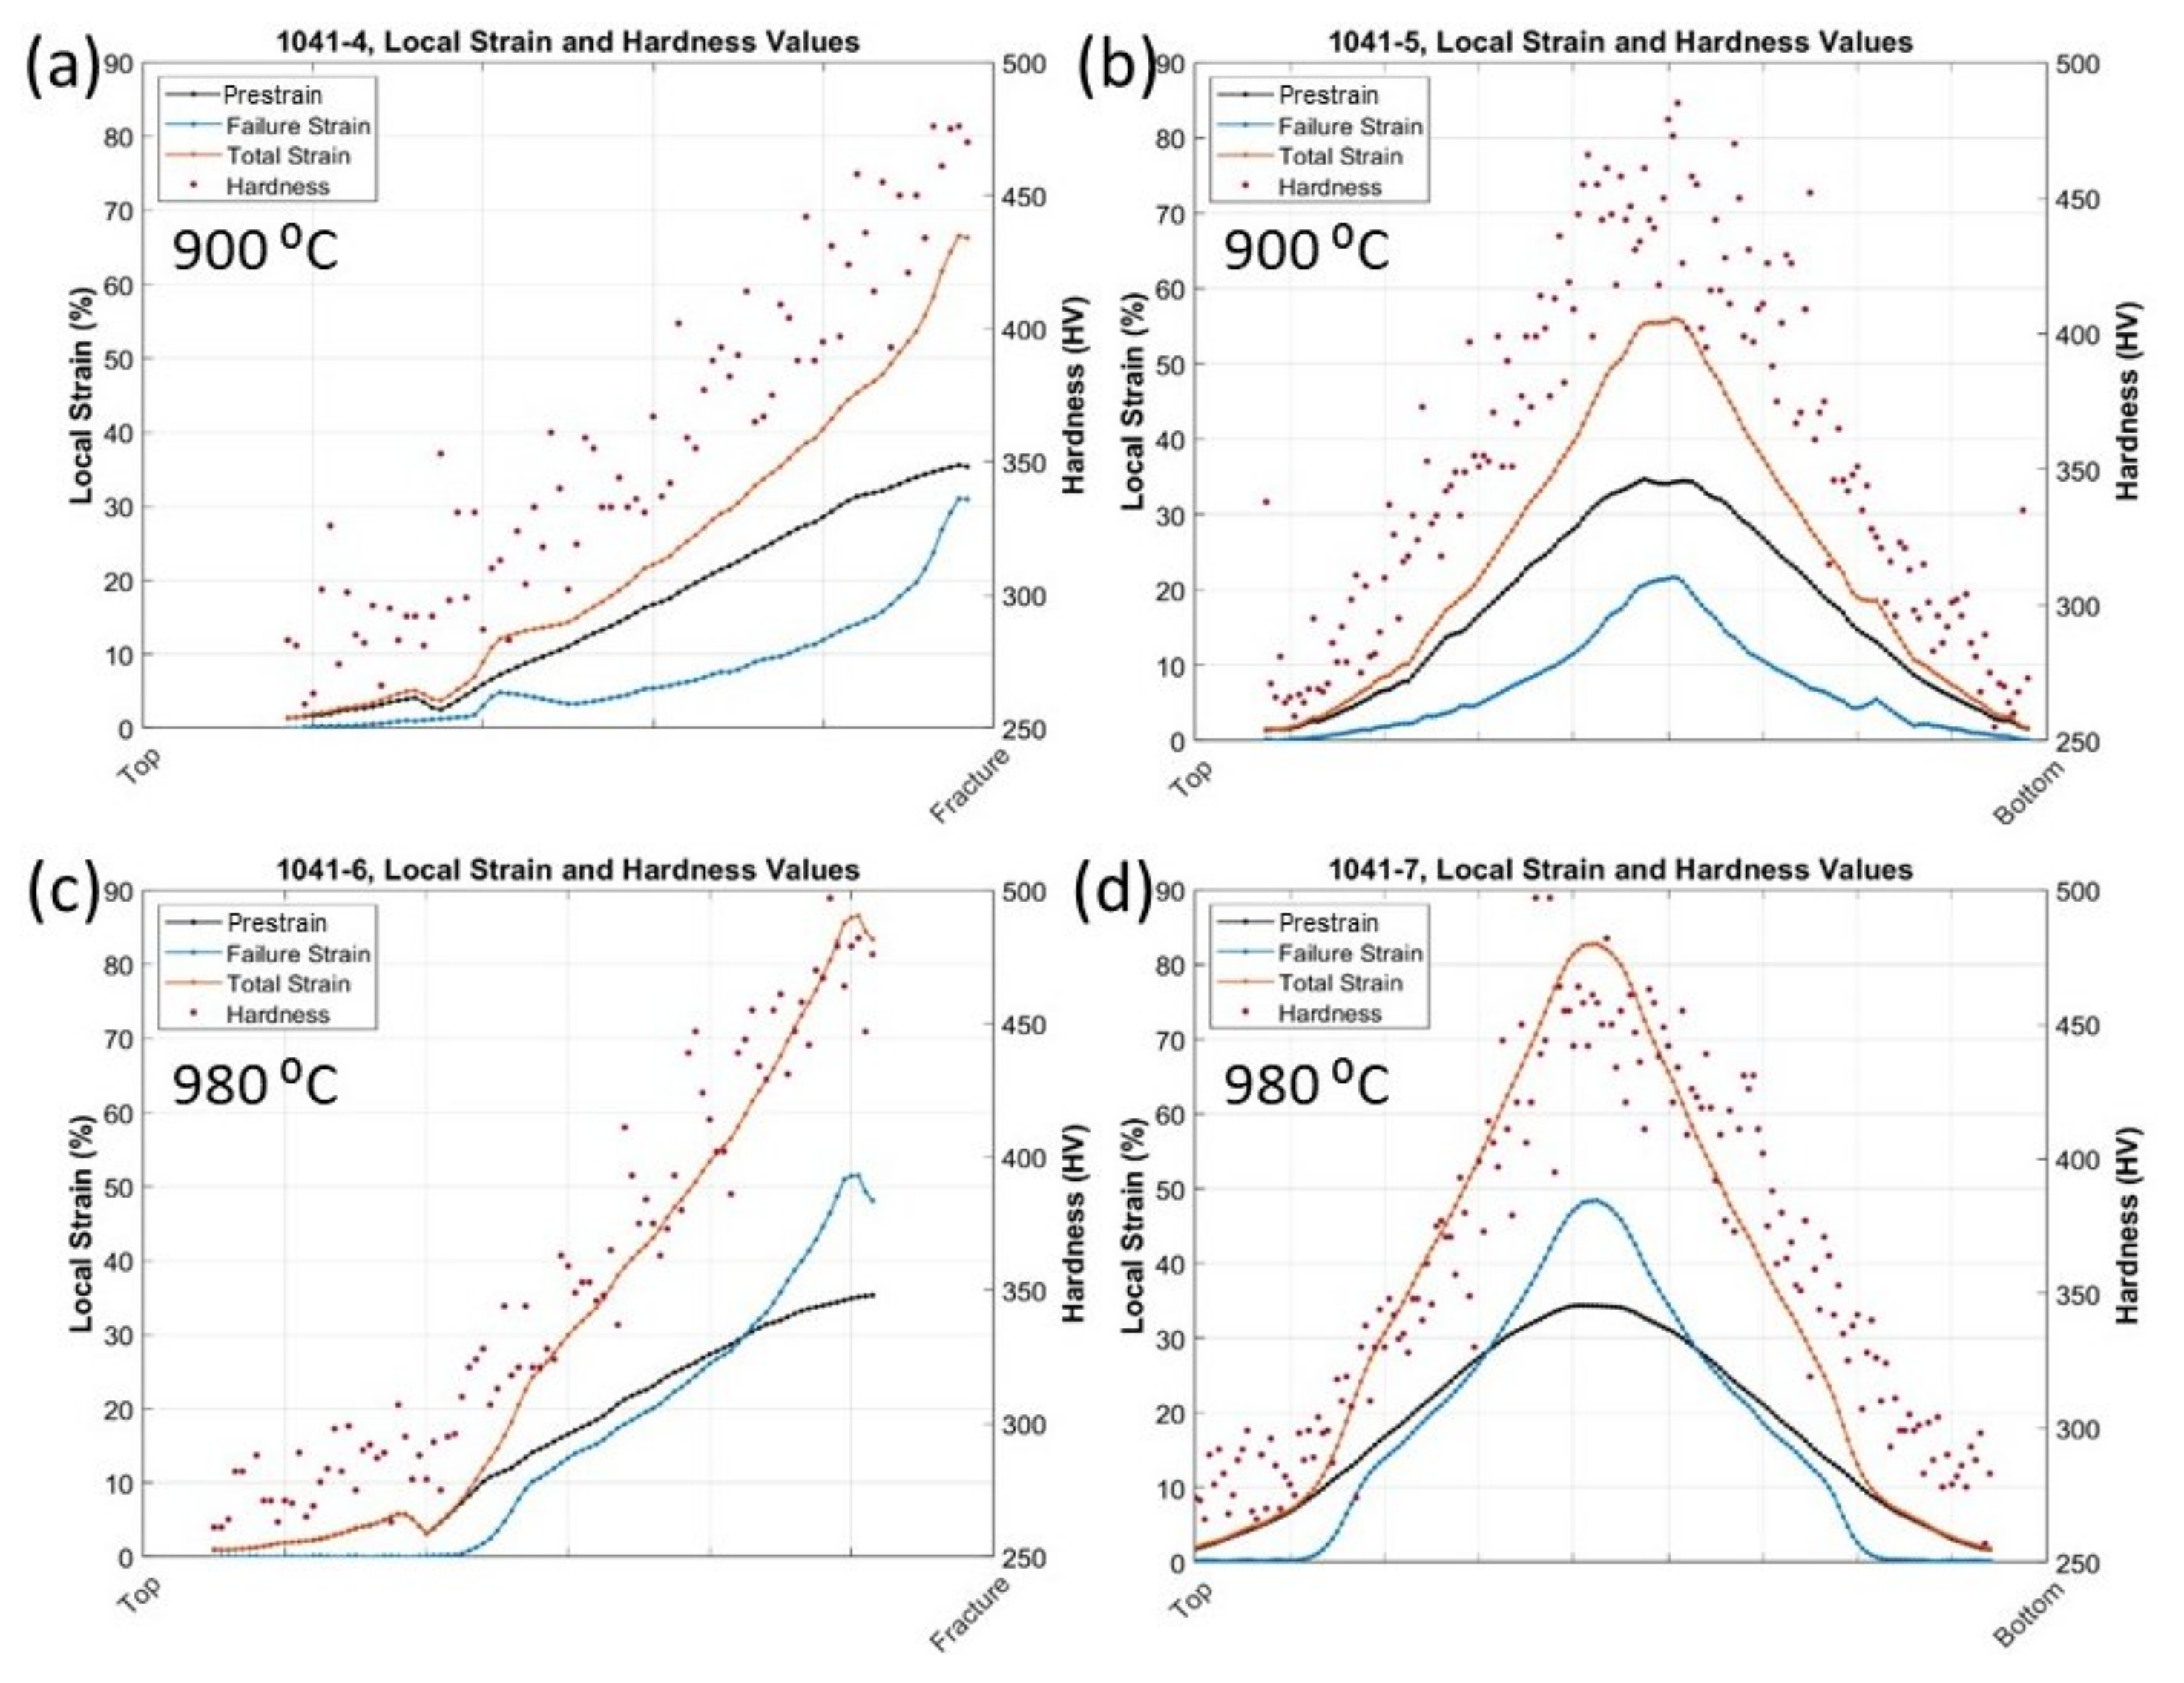
3.3.1. Strain Gradient
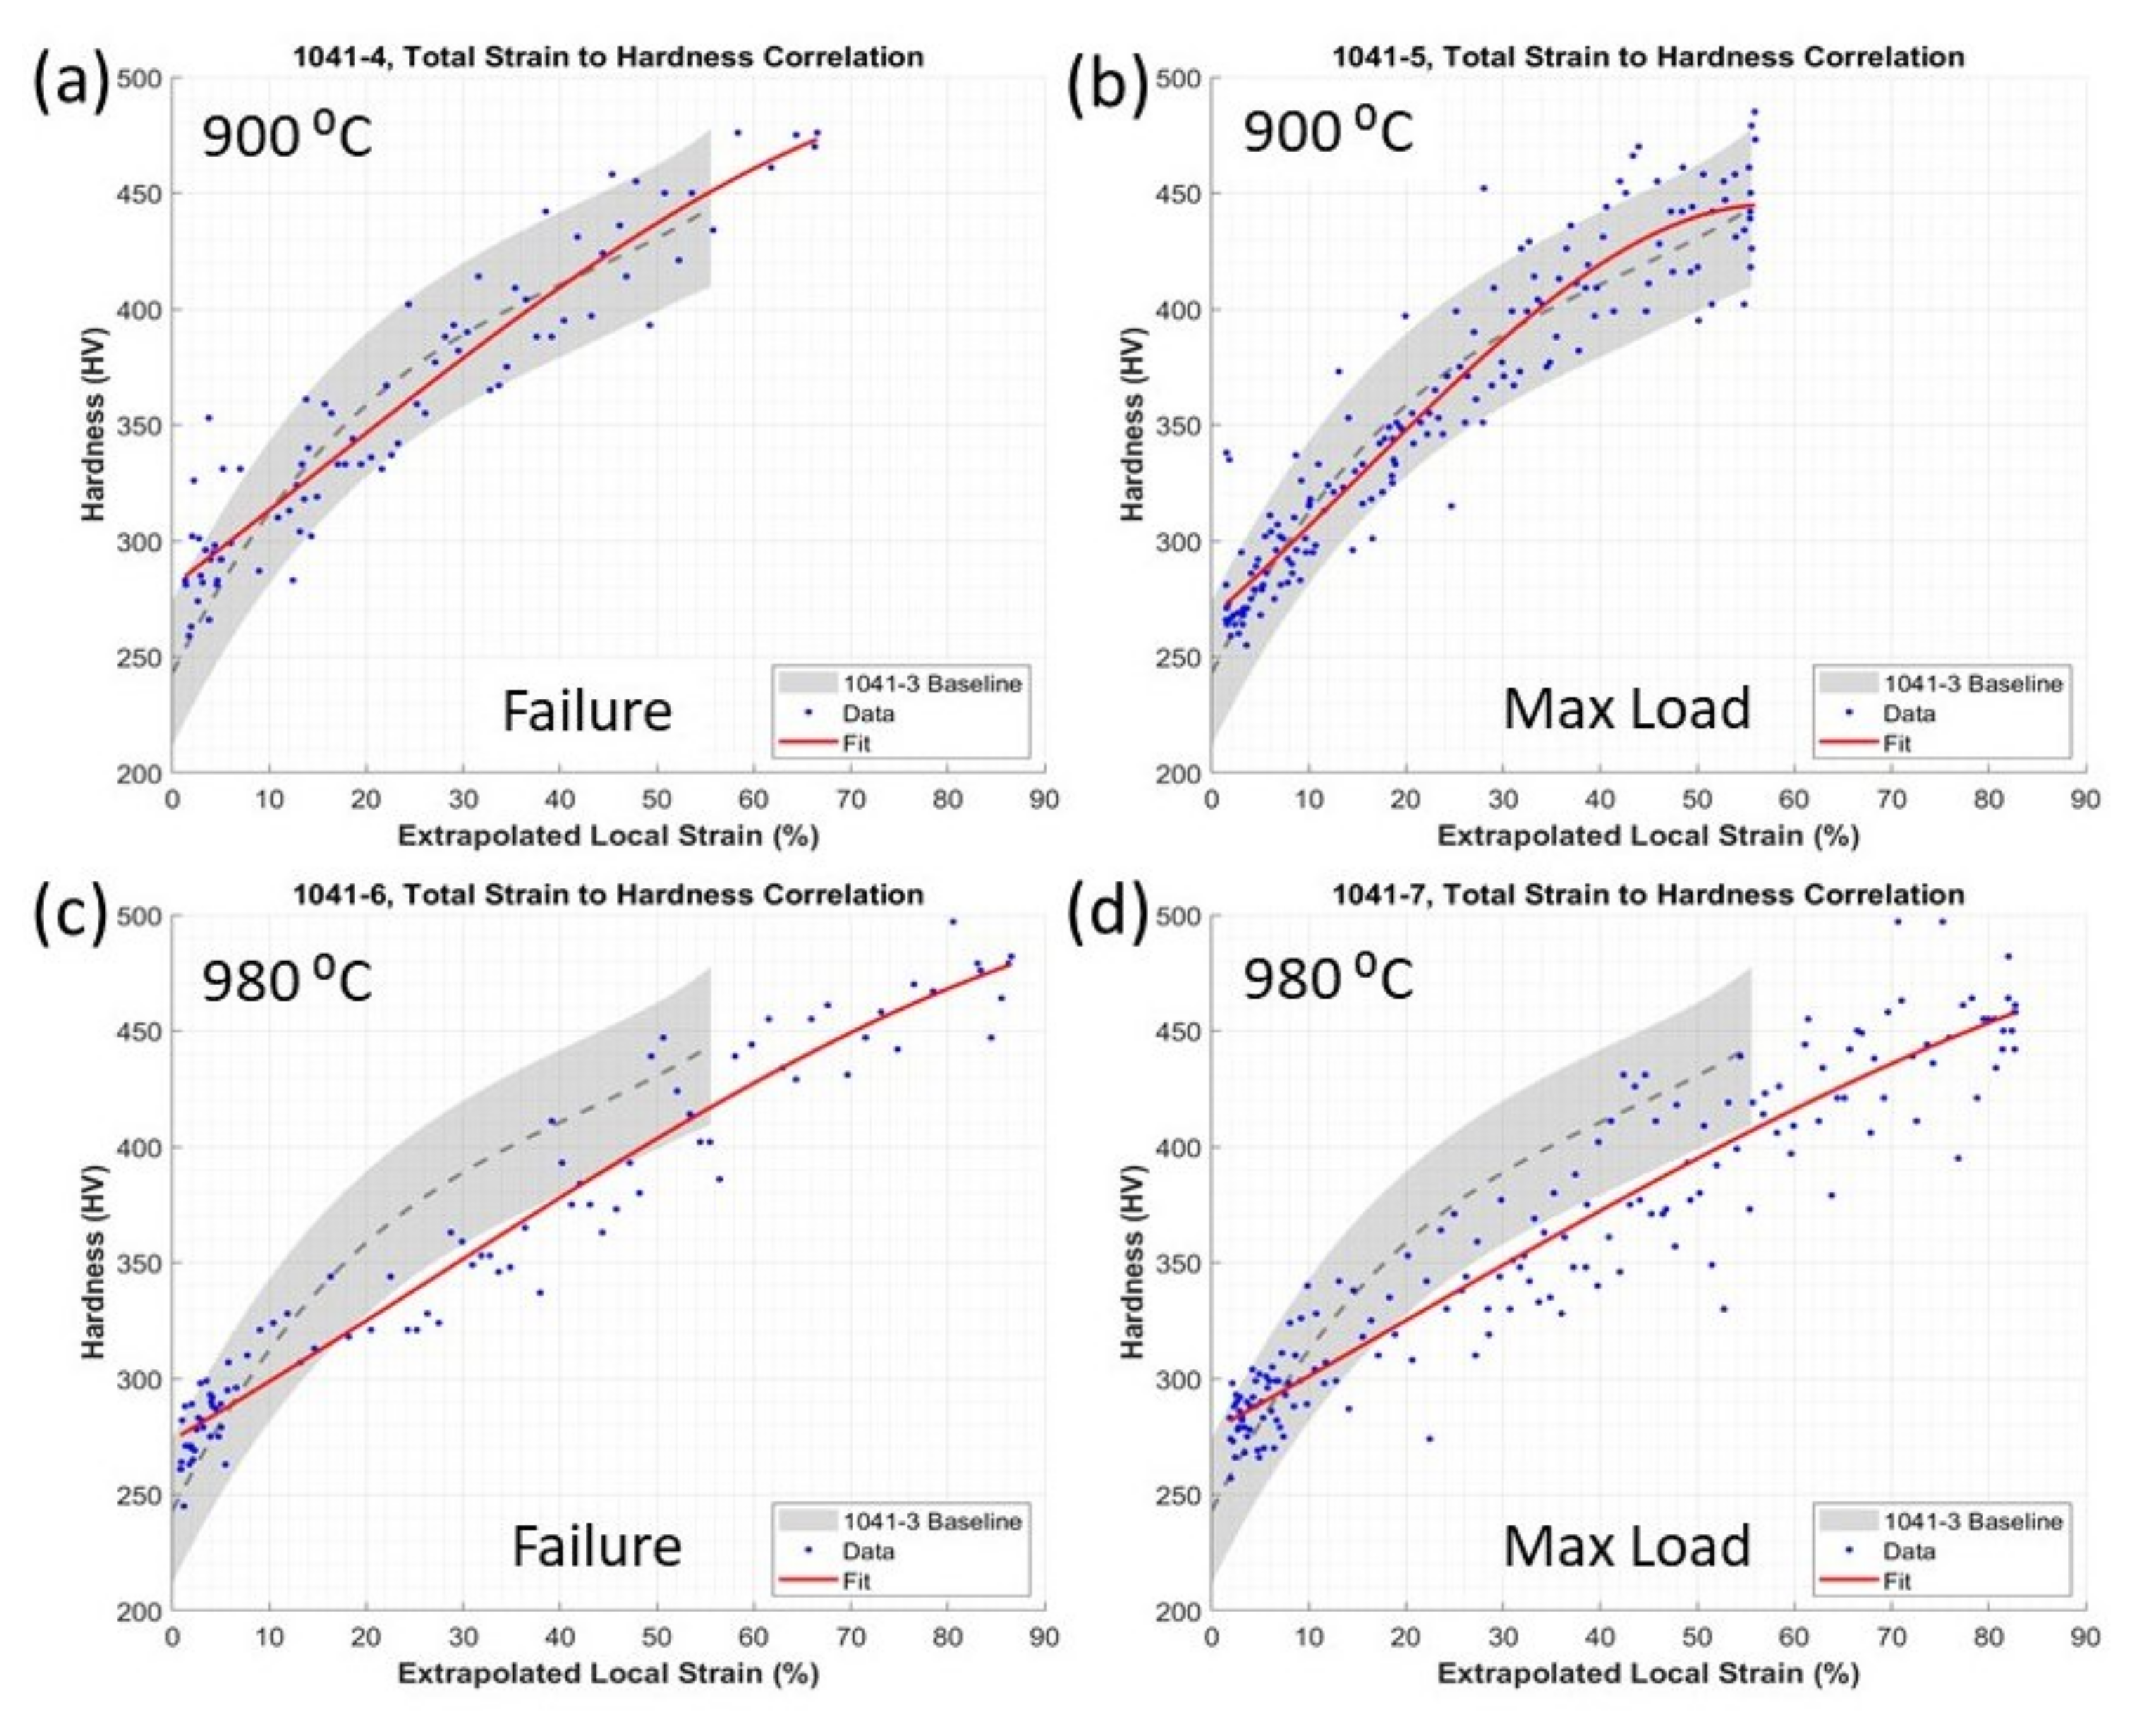
3.3.2. Strain-to-Hardness
4. Conclusions
- The results from the room-temperature tensile tests showed that appropriate heat treatments cold restore the ductility of prestrained material. Ductility recovery was most successful with specimens prestrained to 40% and heat treated to 980 °C.
- The material response to the heat treatments was affected by the degree of mechanical work imparted by the prestrain procedure. Specimens with 10% prestrain did not exhibit improved ductility, regardless of the heat treatment temperature. However, specimens with 40% prestrain exhibited improved ductility. Of these, specimens heat treated to 980 °C exhibited the most ductility recovery.
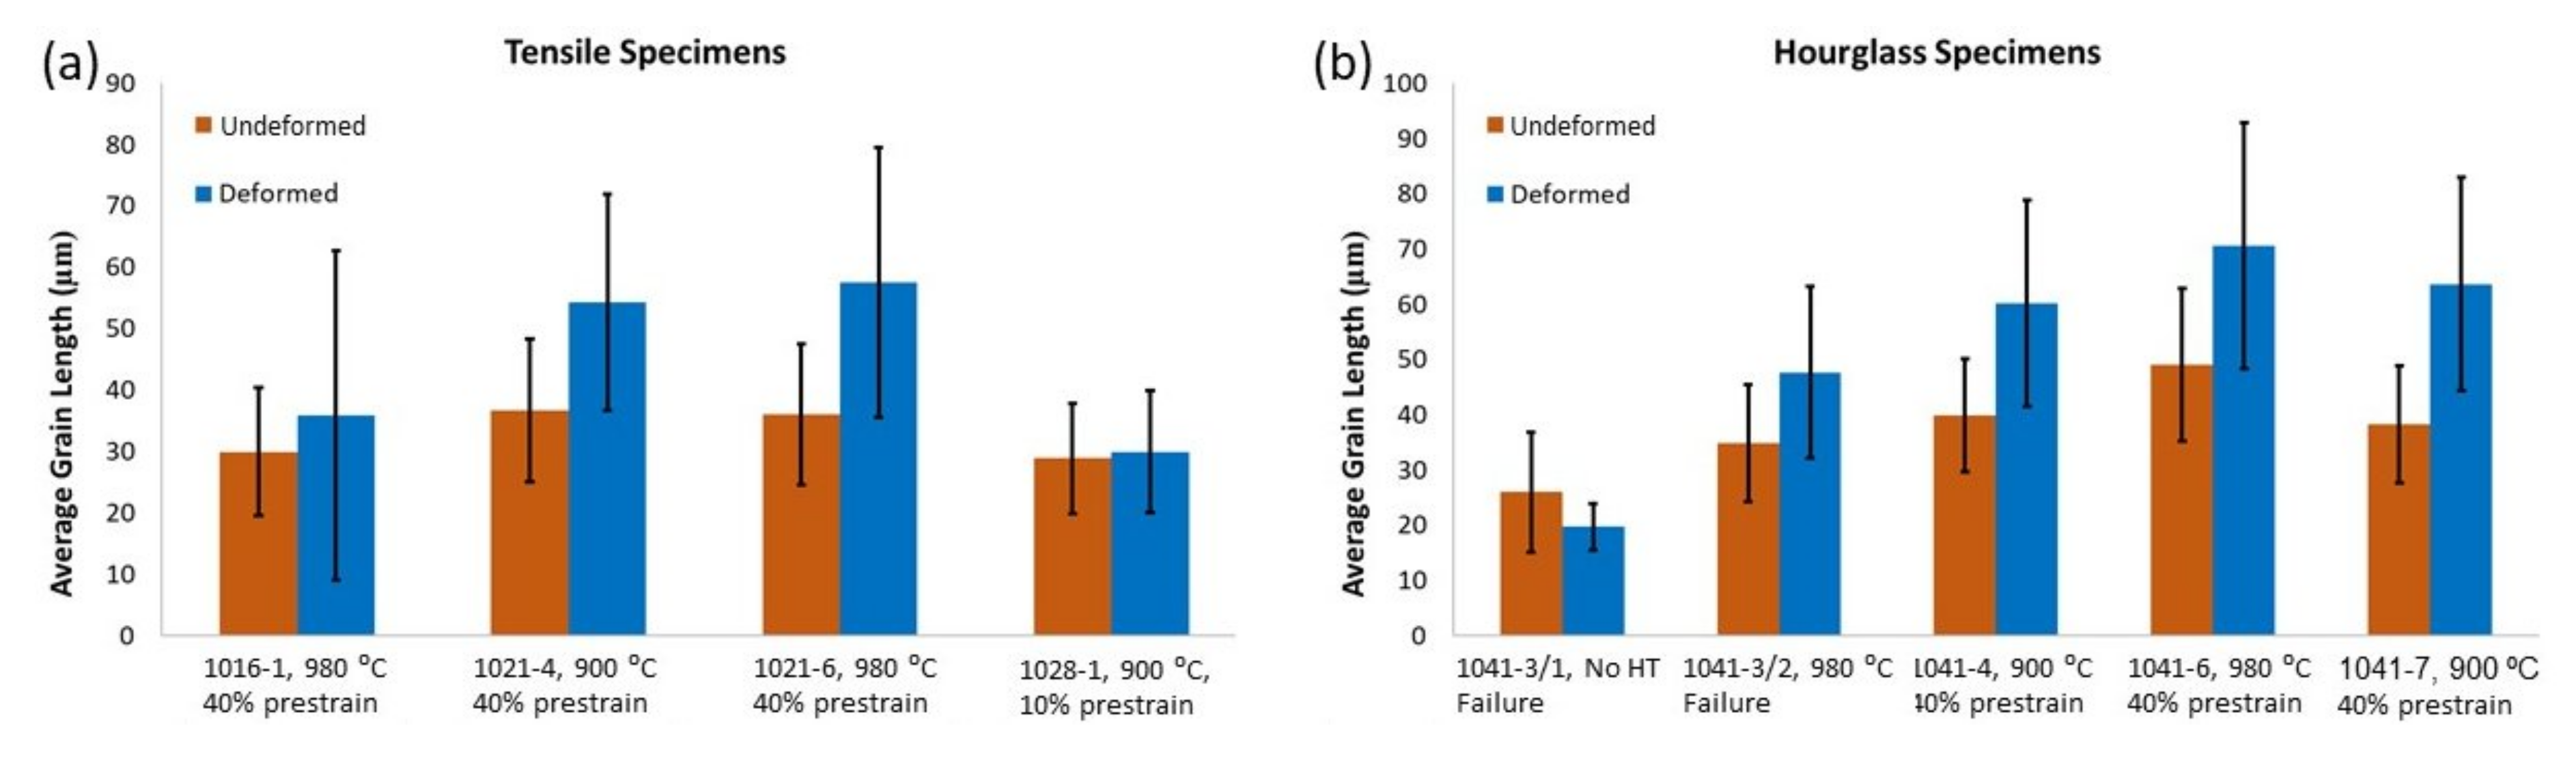
- Metallographic evaluations indicated that heat treatments did not lead to full recrystallization and that the combination of the prestrain and heat treatment may lead to increased grain size. Additionally, post-heat-treatment mechanical strain appeared to affect the resulting grain size to a greater extent than the heat treatment.
- EBSD results showed a slight increase in grain size and increase in KAM with increasing heat treatment temperature. The KAM increase confirmed that misorientation increased with heat treatment. Additionally, texturing changed from a weak [101] to a weak [111] with increasing heat treatment.
- Specimens heat treated to 900 °C exhibited microhardness values similar to the parent material. The correlations between hardness and total strain were similar to those for the as-received parent material, indicating minimal, if any, effect of the 900 °C treatment on final properties.
- Specimens heat treated to 980 °C exhibited microhardness values that were higher at low local strains and lower at high local strains compared to the as-received parent material, indicating that the 980 °C treatment resulted in an increased capacity to sustain higher total strains prior to reaching critical hardness values.
Author Contributions
Funding
Institutional Review Board Statement
Informed Consent Statement
Data Availability Statement
Acknowledgments
Conflicts of Interest
References
- Gao, Y.; Ding, Y.; Chen, J.; Xu, J.; Ma, Y.; Wang, X. Effect of twin boundaries on the microstructure and mechanical properties of Inconel 625 alloy. Mater. Sci. Eng. A 2019, 767, 138361. [Google Scholar] [CrossRef]
- Shankar, V.; Rao, K.B.S.; Mannan, S.L. Microstructure and mechanical properties of Inconel 625 superalloy. J. Nucl. Mater. 2001, 288, 222–232. [Google Scholar] [CrossRef]
- Mathew, M.; Parameswaran, P.; Rao, K.B.S. Microstructural changes in alloy 625 during high temperature creep. Mater. Charact. 2008, 59, 508–513. [Google Scholar] [CrossRef]
- Coorporation, S.M. Specials Metals Inconel alloy 625LCF. Specials Metals Coorporation 2006. Available online: https://www.haraldpihl.com/globalassets/pdf/033_inconel-alloy-625lcf.pdf (accessed on 25 November 2020).
- Yang, F.; Dong, L.; Hu, X.; Zhou, X.; Xie, Z.; Fang, F. Effect of solution treatment temperature upon the microstructure and mechanical properties of hot rolled Inconel 625 alloy. J. Mater. Sci. 2020, 55, 5613–5626. [Google Scholar] [CrossRef]
- Werber, A.; Liewald, M. Influence of pre-strain and heat treatment on mechanical properties of aluminum sheet. Int. J. Mater. Form. 2012, 5, 307–315. [Google Scholar] [CrossRef]
- Xu, Y.; Zhan, L.; Li, W. Effect of pre-strain on creep aging behavior of 2524 aluminum alloy. J. Alloy. Compd. 2017, 691, 564–571. [Google Scholar] [CrossRef]
- Bourget, J.-P.; Fafard, M.; Shakeri, H.R.; Côté, T. Optimization of heat treatment in cold-drawn 6063 aluminium tubes. J. Mater. Process. Technol. 2009, 209, 5035–5041. [Google Scholar] [CrossRef] [Green Version]
- O’Donnell, M.; Leacock, A.G.; Banabic, D.; Brown, D.; McMurray, R.J. The effect of pre-strain and solution heat treatment on the formability of a 2024 Aluminium alloy. Int. J. Mater. Form. 2008, 1, 257–260. [Google Scholar] [CrossRef]
- Indeck, J.; Demeneghi, G.; Mayeur, J.; Williams, C.; Hazeli, K. Influence of reversible and non-reversible fatigue on the microstructure and mechanical property evolution of 7075-T6 aluminum alloy. Int. J. Fatigue 2021, 145, 106094. [Google Scholar] [CrossRef]
- Demeneghi, G.; Barnes, B.; Gradl, P.; Mayeur, J.R.; Hazeli, K. Size effects on microstructure and mechanical properties of additively manufactured copper–chromium–niobium alloy. Mater. Sci. Eng. A 2021, 820, 141511. [Google Scholar] [CrossRef]
- Sukumaran, A.; Gupta, R.K.; Kumar, V.A. Effect of heat treatment parameters on the microstructure and properties of Inconel-625 superalloy. J. Mater. Eng. Perform. 2017, 26, 3048–3057. [Google Scholar] [CrossRef]
- Wang, X.; Ding, Y.; Gao, Y.; Ma, Y.; Chen, J.; Gan, B. Effect of grain refinement and twin structure on the strength and ductility of Inconel 625 alloy. Mater. Sci. Eng. A 2021, 823, 141739. [Google Scholar] [CrossRef]
- Shankar, V.; Valsan, M.; Rao, K.B.S.; Mannan, S.L. Room temperature tensile behavior of service exposed and thermally aged service exposed alloy 625. Scr. Mater. 2001, 44, 2703–2711. [Google Scholar] [CrossRef]
- Tanvir, A.N.M.; Ahsan, M.R.; Seo, G.; Kim, J.D.; Ji, C.; Bates, B.; Lee, Y.; Kim, D.B. Heat treatment effects on Inconel 625 components fabricated by wire+ arc additively manufacturing (WAAM)—Part 2: Mechanical properties. Int. J. Adv. Manuf. Technol. 2020, 110, 1709–1721. [Google Scholar] [CrossRef]
- Marchese, G.; Aversa, A.; Bassini, E. Microstructure and Hardness Evolution of Solution Annealed Inconel 625/TiC Composite Processed by Laser Powder Bed Fusion. Metals 2021, 11, 929. [Google Scholar] [CrossRef]
- Alam, M.Z.; Kamat, S.V.; Jayaram, V.; Karamched, P.S.; Ghosal, P.; Das, D.K. Dynamic recovery and recrystallization during high-temperature tensile deformation of a free-standing Pt-aluminide bond coat. Mater. Sci. Eng. A 2014, 604, 18–22. [Google Scholar] [CrossRef]
- Lin, D.; Hu, J.; Jiang, D. Superplasticity of Ni-rich single phase NiAl intermetallics with large grains. Intermetallics 2005, 13, 343–349. [Google Scholar] [CrossRef]
- Hu, Y.L.; Li, Y.L.; Zhang, S.Y.; Lin, X.; Wang, Z.H.; Huang, W.D. Effect of solution temperature on static recrystallization and ductility of Inconel 625 superalloy fabricated by directed energy deposition. Mater. Sci. Eng. A 2020, 772, 138711. [Google Scholar] [CrossRef]
- Donachie, M.J.; Donachie, S.J. Superalloys: A Technical Guide; ASM International: Materials Park, OH, USA, 2002. [Google Scholar]
- Tehovnik, F.; Burja, J.; Podgornik, B.; Godec, M.; Vode, F. Microstructural evolution of Inconel 625 during hot rolling. Mater. Tehnol. 2015, 49, 801–806. [Google Scholar] [CrossRef]
- Lee, W.-S.; Lin, C.-F. High-temperature deformation behaviour of Ti6Al4V alloy evaluated by high strain-rate compression tests. J. Mater. Process. Technol. 1998, 75, 127–136. [Google Scholar] [CrossRef]
- Sun, H.Q.; Shi, Y.-N.; Zhang, M.-X.; Lu, K. Plastic strain-induced grain refinement in the nanometer scale in a Mg alloy. Acta Mater. 2007, 55, 975–982. [Google Scholar] [CrossRef]
- Cao, Y.; Di, H.; Zhang, J.; Zhang, J.; Ma, T.; Misra, R.D.K. An electron backscattered diffraction study on the dynamic recrystallization behavior of a nickel–chromium alloy (800H) during hot deformation. Mater. Sci. Eng. A 2013, 585, 71–85. [Google Scholar] [CrossRef]
- Chen, Y.Q.; Pan, S.P.; Zhou, M.Z.; Yi, D.Q.; Xu, D.Z.; Xu, Y.F. Effects of inclusions, grain boundaries and grain orientations on the fatigue crack initiation and propagation behavior of 2524-T3 Al alloy. Mater. Sci. Eng. A 2013, 580, 150–158. [Google Scholar] [CrossRef]
- Zhai, T.-G.; Wilkinson, A.J.; Martin, J.W. A crystallographic mechanism for fatigue crack propagation through grain boundaries. Acta Mater. 2000, 48, 4917–4927. [Google Scholar] [CrossRef]
- Dempster, I.; Wallis, R. Heat Treatment Metallurgy of Nickel-Base Alloys. In Heat Treating of Nonferrous Alloys; ASM International: Materials Park, OH, USA, 2016; Volume 4, pp. 399–425. [Google Scholar]
- Nickel Alloy, Corrosion and Heat-Resistant, Sheet, Strip, and Foil 62Ni–21.5Cr–9.0Mo–3.7Cb (Nb): Cold Rolled and Annealed: AMS5879D; SAE International: Warrendale, PA, USA, 2015.
- Chandler, H. Heat Treater’s Guide: Practices and Procedures for Nonferrous Alloys; ASM International: Materials Park, OH, USA, 1996. [Google Scholar]
- ASTM American Society for Testing and Materials, Standard Test Methods for Tension Testing of Metallic Materials; ASTM International: West Conshohocken, PA, USA, 2009.
- Vander Voort, G.; Manilova, E. Metallographic techniques for superalloys. Microsc. Microanal. 2004, 10, 690–691. [Google Scholar] [CrossRef] [Green Version]
- Nosrati, H. How to Make Superpicral Etchant? Available online: https://www.researchgate.net/post/How_to_make_Superpicral_etchant (accessed on 10 September 2020).
- Munitz, A.; Cotler, C.; Talianker, M. Aging impact on mechanical properties and microstructure of Al-6063. J. Mater. Sci. 2000, 35, 2529–2538. [Google Scholar] [CrossRef]
- Marchese, G.; Parizia, S.; Rashidi, M.; Saboori, A.; Manfredi, D.; Ugues, D.; Lombardi, M.; Hryha, E.; Biamino, S. The role of texturing and microstructure evolution on the tensile behavior of heat-treated Inconel 625 produced via laser powder bed fusion. Mater. Sci. Eng. A 2020, 769, 138500. [Google Scholar] [CrossRef]
- Babamiri, B.B.; Indeck, J.; Demeneghi, G.; Cuadra, J.; Hazeli, K. Quantification of porosity and microstructure and their effect on quasi-static and dynamic behavior of additively manufactured Inconel 718. Addit. Manuf. 2020, 34, 101380. [Google Scholar] [CrossRef]
- Nagesha, A.; Parameswaran, P.; Kumar, N.; Sandhya, R.; Mathew, M.D. Influence of re-solutionising treatment on the cyclic deformation behaviour of a service-exposed Inconel 625 superalloy. Mater. High Temp. 2012, 29, 49–53. [Google Scholar] [CrossRef]
- Todaro, C.J.; Easton, M.A.; Qiu, D.; Zhang, D.; Bermingham, M.J.; Lui, E.W.; Brandt, M.; StJohn, D.H.; Qian, M. Grain structure control during metal 3D printing by high-intensity ultrasound. Nat. Commun. 2020, 11, 142. [Google Scholar] [CrossRef]
- Moussa, C.; Bernacki, M.; Besnard, R.; Bozzolo, N. About quantitative EBSD analysis of deformation and recovery substructures in pure Tantalum. IOP Conf. Ser. Mater. Sci. Eng. 2015, 89, 012038. [Google Scholar] [CrossRef]
- Mitsche, S.; Pölt, P.; Sommitsch, C. Recrystallization behaviour of the nickel-based alloy 80 A during hot forming. J. Microsc. 2007, 227, 267–274. [Google Scholar] [CrossRef]
- Liu, M.; Zheng, W.-J.; Xiang, J.-Z.; Song, Z.-G.; Pu, E.-X.; Feng, H. Grain growth behavior of inconel 625 superalloy. J. Iron Steel Res. Int. 2016, 23, 1111–1118. [Google Scholar] [CrossRef]


| Treatment | Atmosphere | Temp. (°C) | Time (min) | Cooling |
|---|---|---|---|---|
| Stress Relief | Vacuum | 900 ± 5 | 15 ± 5 | Air cool |
| Annealing | Vacuum | 980 ± 5 | 15 ± 5 | Air cool |
| Specimen | Orientation | Shape | Prestrain (%) | Temperature (°C) | Test |
|---|---|---|---|---|---|
| 1021-3 | Transverse | Tensile | 0 | — | Failure |
| 1021-10 | Transverse | Tensile | 0 | — | Failure |
| 1021-7 | Transverse | Tensile | 0 | 900 | Failure |
| 1021-8 | Transverse | Tensile | 0 | 980 | Failure |
| 1022-2 | Transverse | Tensile | 10 | 900 | Failure |
| 1022-4 | Transverse | Tensile | 10 | 980 | Failure |
| 1022-6 | Transverse | Tensile | 10 | 900 | Failure |
| 1028-1 | Axial | Tensile | 10 | 900 | Max Load |
| 1024-6 | Transverse | Tensile | 10 | 900 | Failure |
| 1024-8 | Transverse | Tensile | 40 | 980 | Failure |
| 1016-1 | Axial | Tensile | 40 | 980 | Max Load |
| 1021-4 | Transverse | Tensile | 40 | 900 | Failure |
| 1021-5 | Transverse | Tensile | 40 | — | Failure |
| 1021-6 | Transverse | Tensile | 40 | 980 | Failure |
| 1041-3 | Axial | Hourglass | — | — | Failure/Hardness |
| 1041-4 | Axial | Hourglass | 40 | 900 | Failure/Hardness |
| 1041-5 | Axial | Hourglass | 40 | 900 | Max Load/Hardness |
| 1041-6 | Axial | Hourglass | 40 | 980 | Failure/Hardness |
| 1041-7 | Axial | Hourglass | 40 | 980 | Max Load/Hardness |
| Specimen | Orientation | Prestrain (%) | Temp. (°C) | Final Test |
|---|---|---|---|---|
| 1021-3 | Transverse | — | — | Failure |
| 1021-10 | Transverse | — | — | Failure |
| 1021-7 | Transverse | — | 900 | Failure |
| 1021-8 | Transverse | — | 980 | Failure |
| 1022-2 | Transverse | 10 | 900 | Failure |
| 1022-4 | Transverse | 10 | 980 | Failure |
| 1022-6 | Transverse | 10 | 900 | Failure |
| 1021-4 | Transverse | 40 | 900 | Failure |
| 1021-5 | Transverse | 40 | — | Failure |
| 1021-6 | Transverse | 40 | 980 | Failure |
| 1022-8 | Transverse | 40 | 980 | Failure |
| Pre-Heat Treatment | Post-Heat Treatment | |||||||
|---|---|---|---|---|---|---|---|---|
| Specimen | Load at Yield (N) | Prestrain Load (N) | Prestrain (%) | Temp. (°C) | Load at Yield (N) | Max Load (N) | Strain at Fracture (%) | Reduction in Strain at Fracture (%) |
| 1022-2 | 995 | 1536 | 10 | 900 | 1307 | 2100 | 41 | 20 |
| 1022-4 | 964 | 1481 | 10 | 980 | 1198 | 2071 | 41 | 20 |
| 1024-6 | 996 | 1502 | 10 | 900 | 1274 | 2056 | 39 | 24 |
| 1024-8 | 1007 | 2099 | 40 | 980 | 740 | 1562 | 44 | 14 |
| 1021-4 | 1078 | 2164 | 40 | 900 | 1606 | 2020 | 20 | 61 |
| 1021-5 | 1069 | 2135 | 40 | — | 2161 | 2159 | 10 | 81 |
| 1021-6 | 1083 | 2161 | 40 | 980 | 815 | 1623 | 45 | 12 |
| 1021-3 | 1089 | 2144 | — | — | — | — | 51 | — |
| 1021-10 | 1088 | 2182 | — | — | — | — | 51 | — |
| Specimen | Undeformed Length (μm) | Deformed Length (μm) | Length Increase (%) | Initial Target Strain (%) | Temp. (°C) | Final Test |
|---|---|---|---|---|---|---|
| 1016-1 | 30 ± 10.4 | 35.9 ± 26.8 | 19.7 | 40 | 980 | — |
| 1021-4 | 36.7 ± 11.7 | 54.3 ± 17.6 | 48.0 | 40 | 900 | Failure |
| 1021-6 | 36.0 ± 11.5 | 57.6 ± 22.0 | 60.0 | 40 | 980 | Failure |
| 1028-1 | 28.9 ± 9.0 | 29.9 ± 9.9 | 3.5 | 10 | 900 | — |
| 1041-3/1 | 26.0 ± 10.9 | 19.7 ± 4.2 | −24.2 | Failure | — | — |
| 1041-3/2 | 34.9 ± 10.5 | 47.7 ± 15.6 | 36.7 | Failure | 980 | — |
| 1041-4 | 39.9 ± 10.3 | 60.2 ± 18.6 | 44.1 | 40 | 900 | Failure |
| 1041-6 | 49.0 ± 13.8 | 70.6 ± 22.2 | 44.1 | 40 | 980 | Failure |
| 1041-7 | 38.3 ± 10.6 | 63.7 ± 19.3 | 66.3 | 40 | 980 | Max Load |
| Specimen | Area (μm2) | Standard Deviation (μm2) |
|---|---|---|
| Parent | 310.28 | 341.68 |
| 900 °C | 327.05 | 350.59 |
| 980 °C | 339.84 | 383.05 |
| Specimen | Orientation | Prestrain (%) | Temp. (°C) | Final Test |
|---|---|---|---|---|
| 1041-3 | Axial | — | — | Failure |
| 1041-4 | Axial | 40 | 900 | Failure |
| 1041-5 | Axial | 40 | 900 | Max Load |
| 1041-6 | Axial | 40 | 980 | Failure |
| 1041-7 | Axial | 40 | 980 | Max Load |
Publisher’s Note: MDPI stays neutral with regard to jurisdictional claims in published maps and institutional affiliations. |
© 2021 by the authors. Licensee MDPI, Basel, Switzerland. This article is an open access article distributed under the terms and conditions of the Creative Commons Attribution (CC BY) license (https://creativecommons.org/licenses/by/4.0/).
Share and Cite
Demeneghi, G.; Elliott, S.; Rabenberg, E.; Girgis, A.; Tilson, W.; Gray, A.; Jerman, G. Heat Treatment Effects on Pristine and Cold-Worked Thin-Walled Inconel 625. Metals 2021, 11, 1746. https://doi.org/10.3390/met11111746
Demeneghi G, Elliott S, Rabenberg E, Girgis A, Tilson W, Gray A, Jerman G. Heat Treatment Effects on Pristine and Cold-Worked Thin-Walled Inconel 625. Metals. 2021; 11(11):1746. https://doi.org/10.3390/met11111746
Chicago/Turabian StyleDemeneghi, Gabriel, Skylar Elliott, Ellen Rabenberg, Ayman Girgis, William Tilson, Annette Gray, and Gregory Jerman. 2021. "Heat Treatment Effects on Pristine and Cold-Worked Thin-Walled Inconel 625" Metals 11, no. 11: 1746. https://doi.org/10.3390/met11111746
APA StyleDemeneghi, G., Elliott, S., Rabenberg, E., Girgis, A., Tilson, W., Gray, A., & Jerman, G. (2021). Heat Treatment Effects on Pristine and Cold-Worked Thin-Walled Inconel 625. Metals, 11(11), 1746. https://doi.org/10.3390/met11111746