
Design Implications and Opportunities of Considering Fatigue Strength, Manufacturing Variations and Predictive LCC in Welds


Abstract
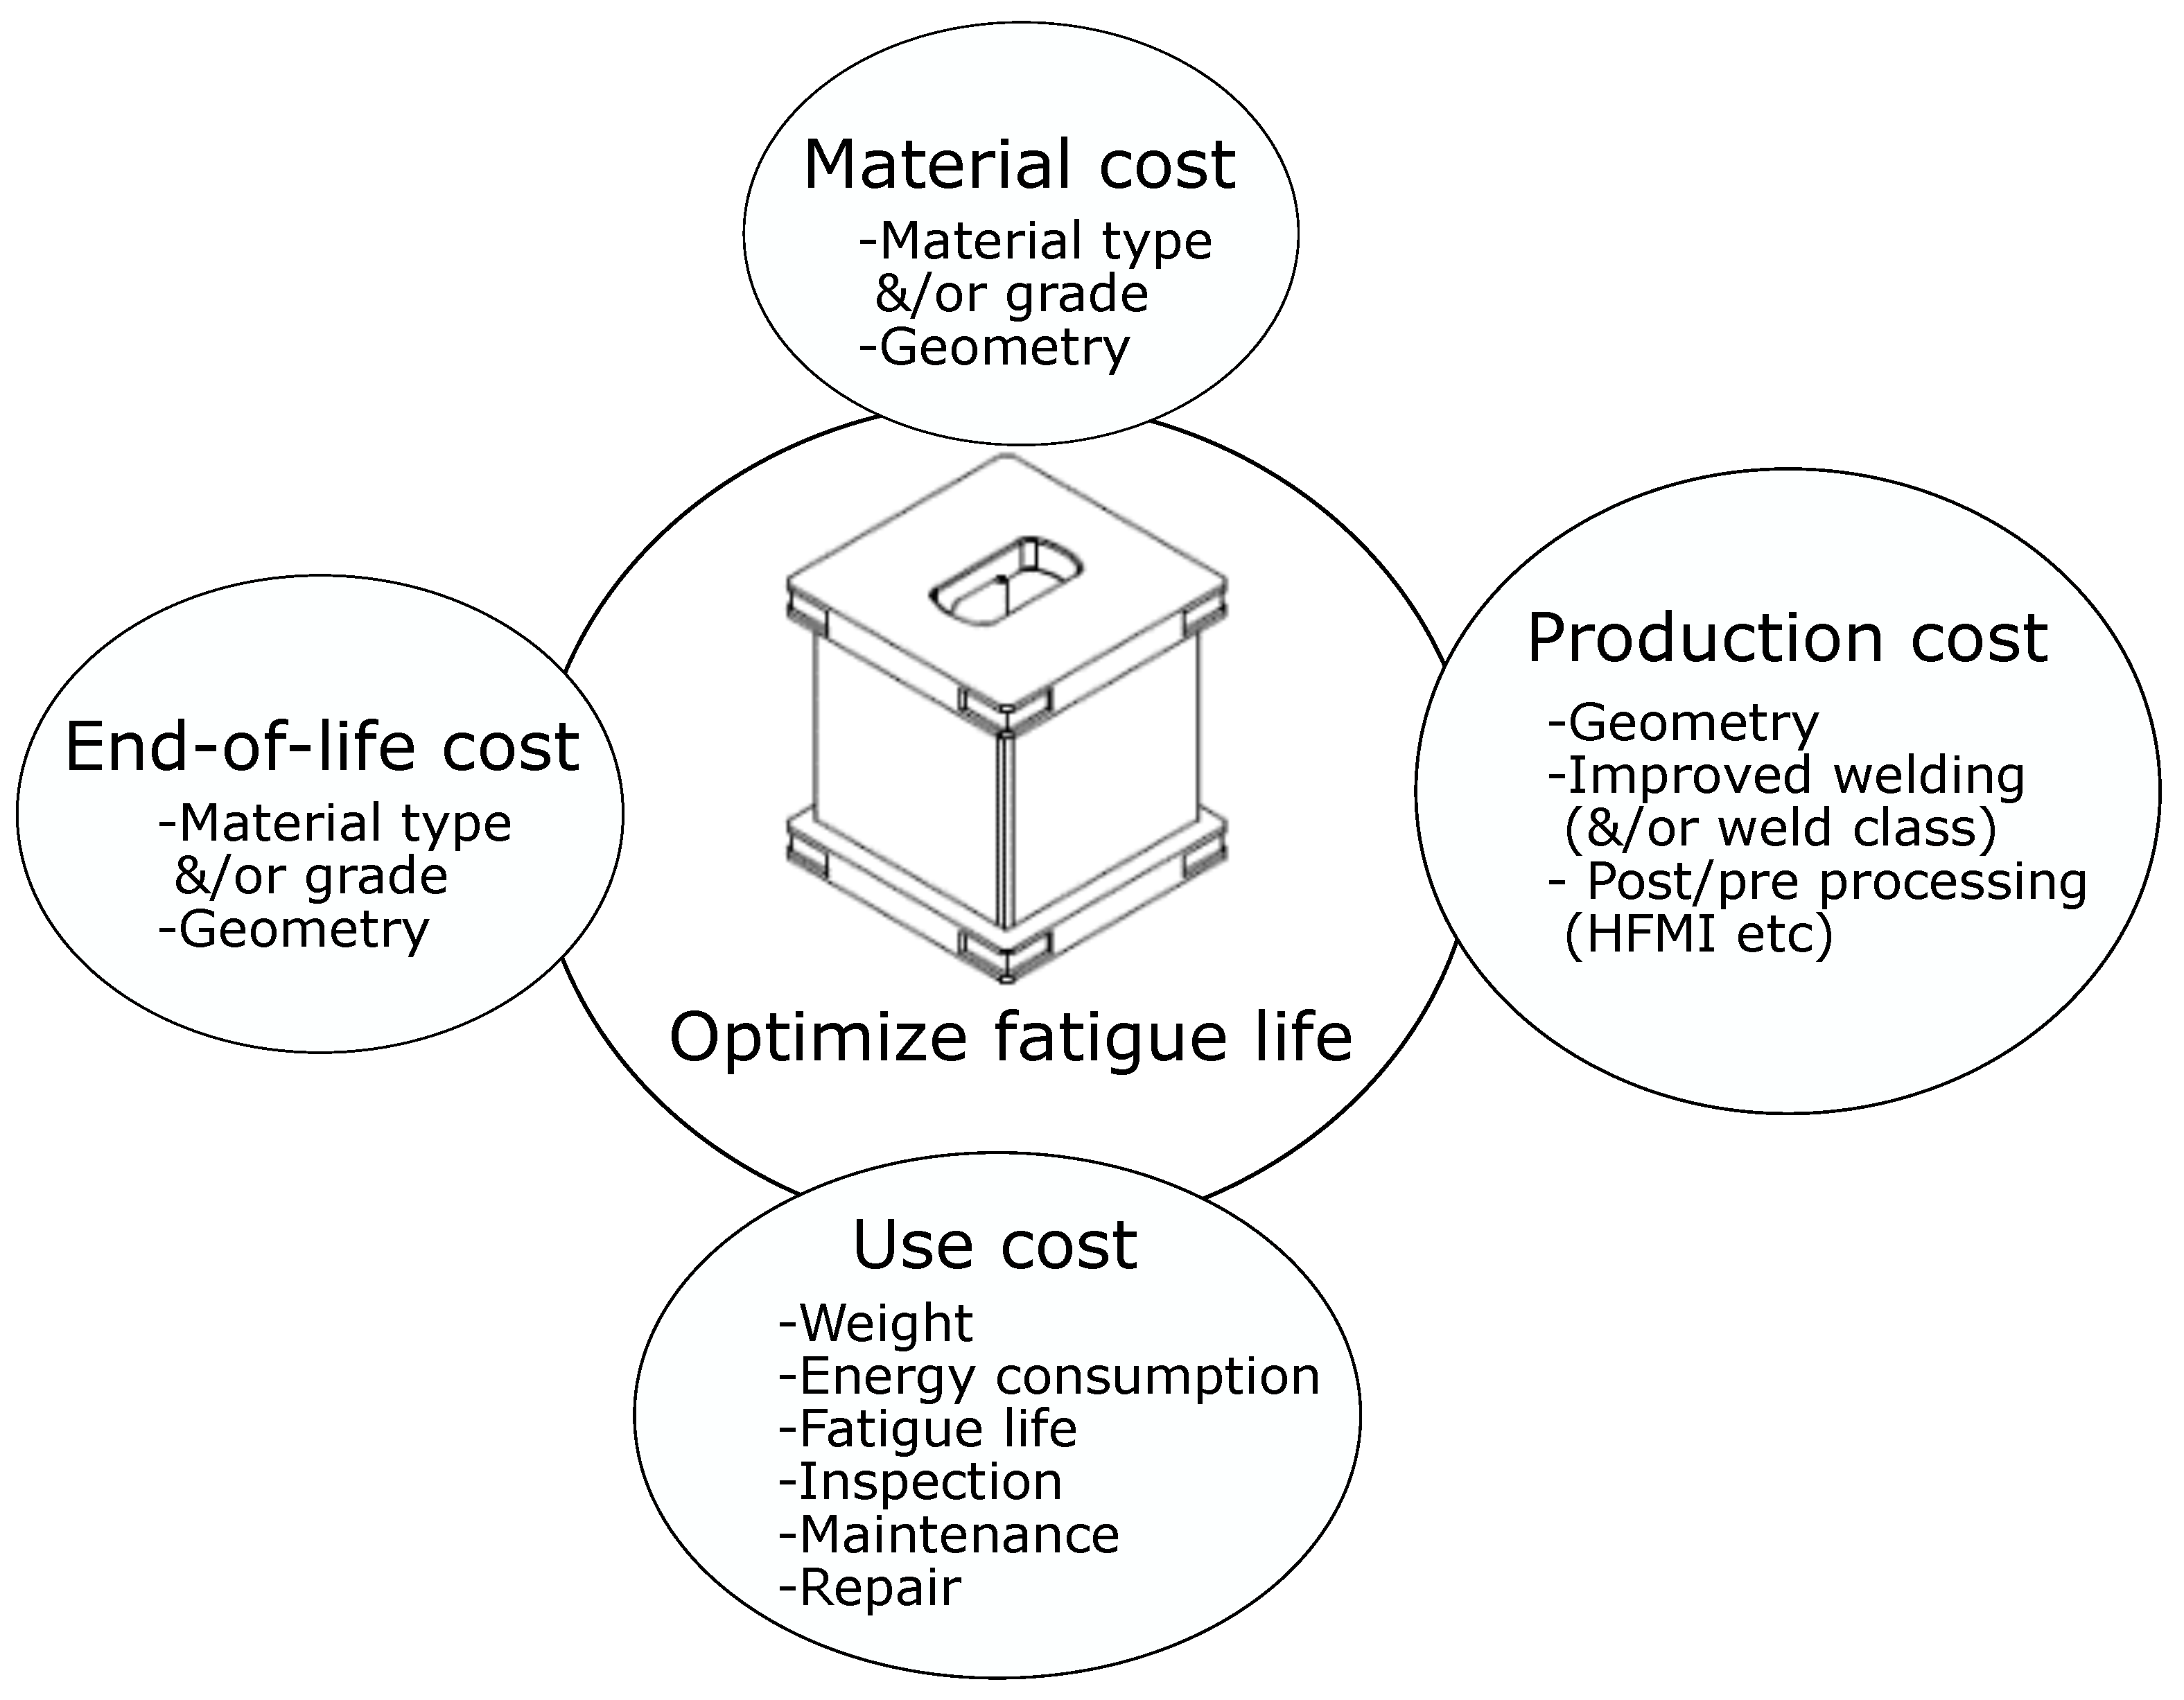
:1. Introduction
2. Scope
- A traditional lifecycle assessment include present distribution channels. However, for the scope of this study, distribution is deemed too uncertain to assess at an early design stage.
- Input cost data such as material cost per kg and equipment investments are retrieved from comparative, published, data to avoid assessing the result of specific supply-chains and internal business partnerships.
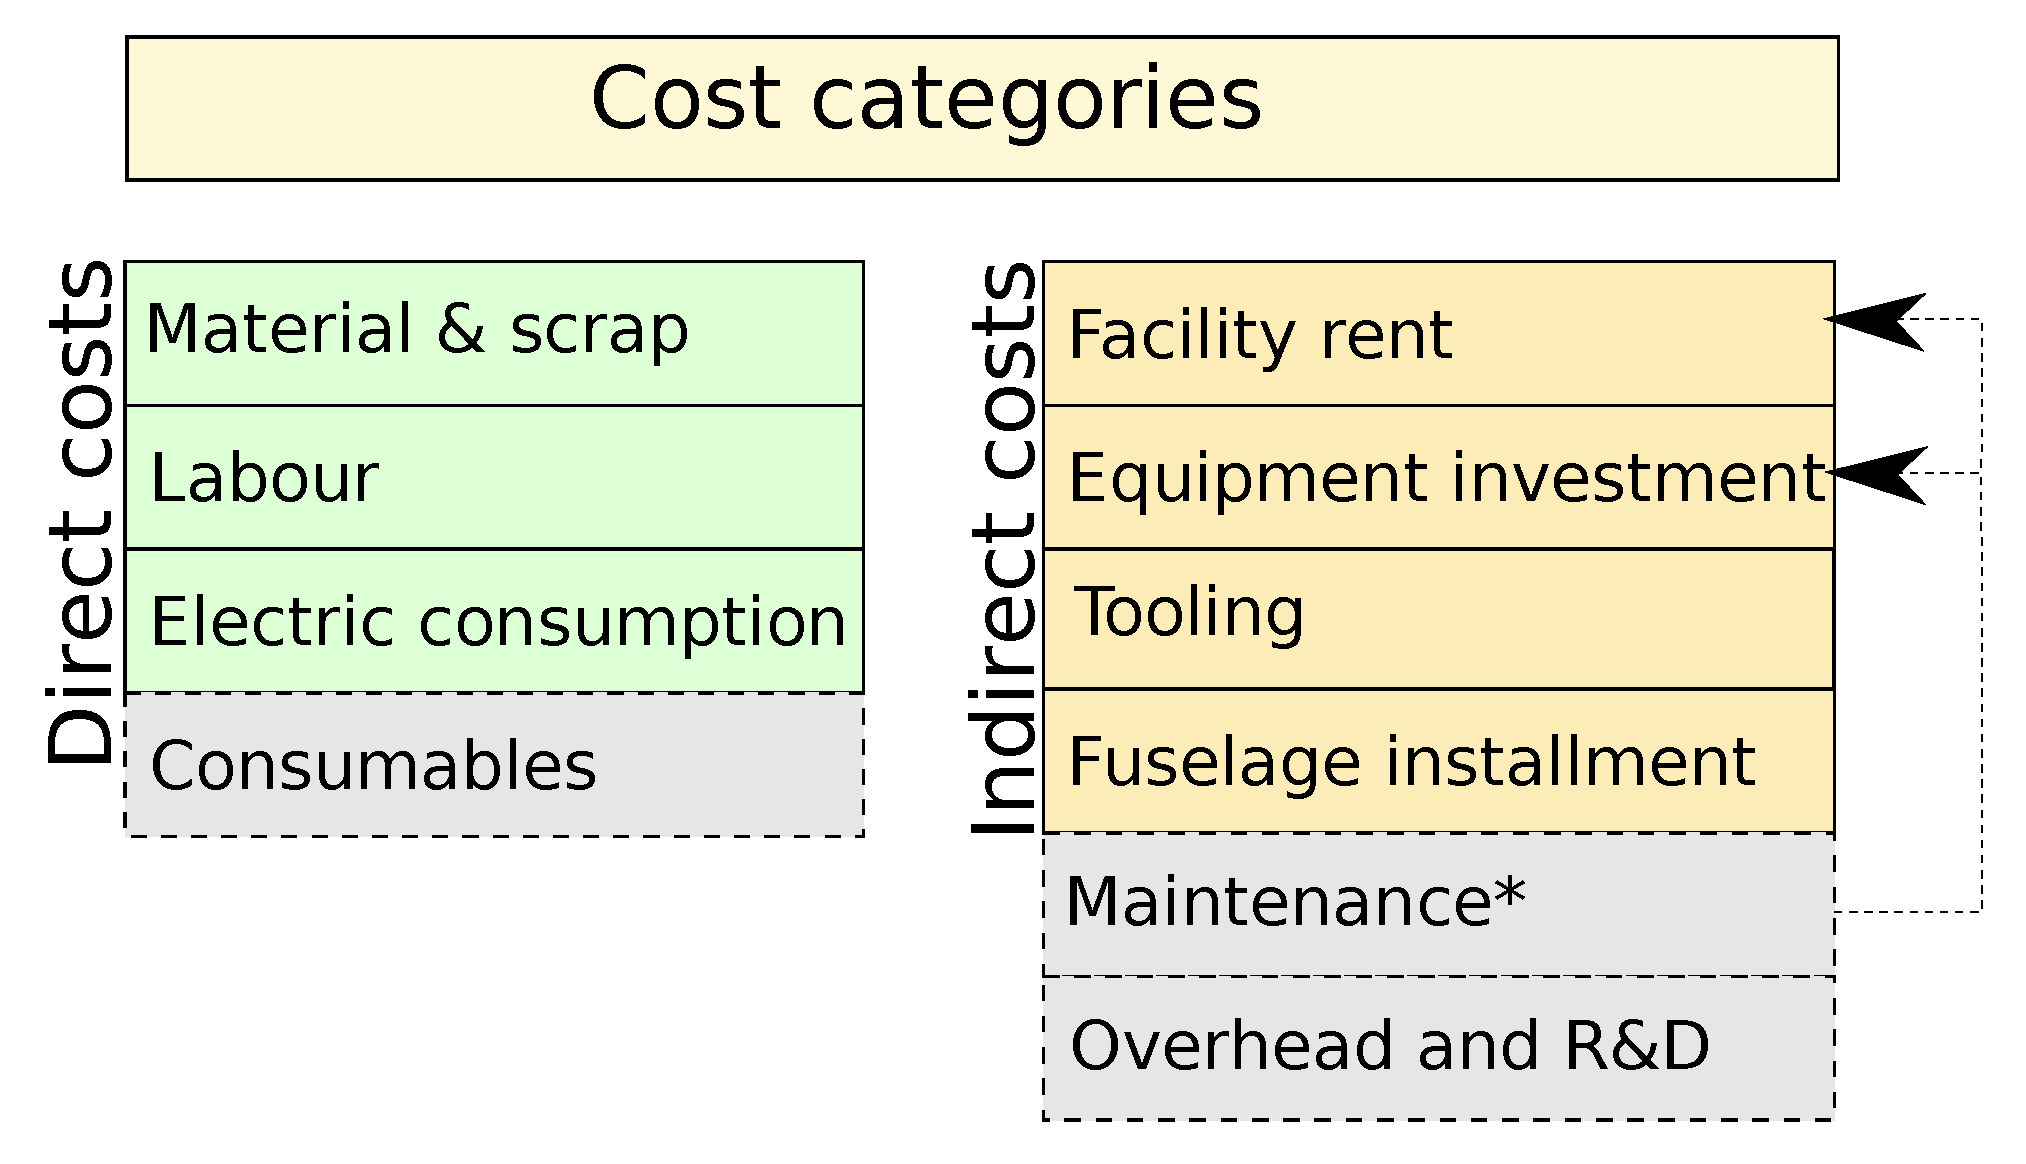
- Investment costs are sized for full use in specific production, this means shared equipment systems are not included.
- R&D and overhead costs are excluded from the modelling scope as they are highly tied to specific organizations and often difficult to credit any particular component.
- Inspection and control are not treated in this work, but are instead part of future work.
3. Methodology and Framework
4. Predictive Lifecycle Costing (PLCC)
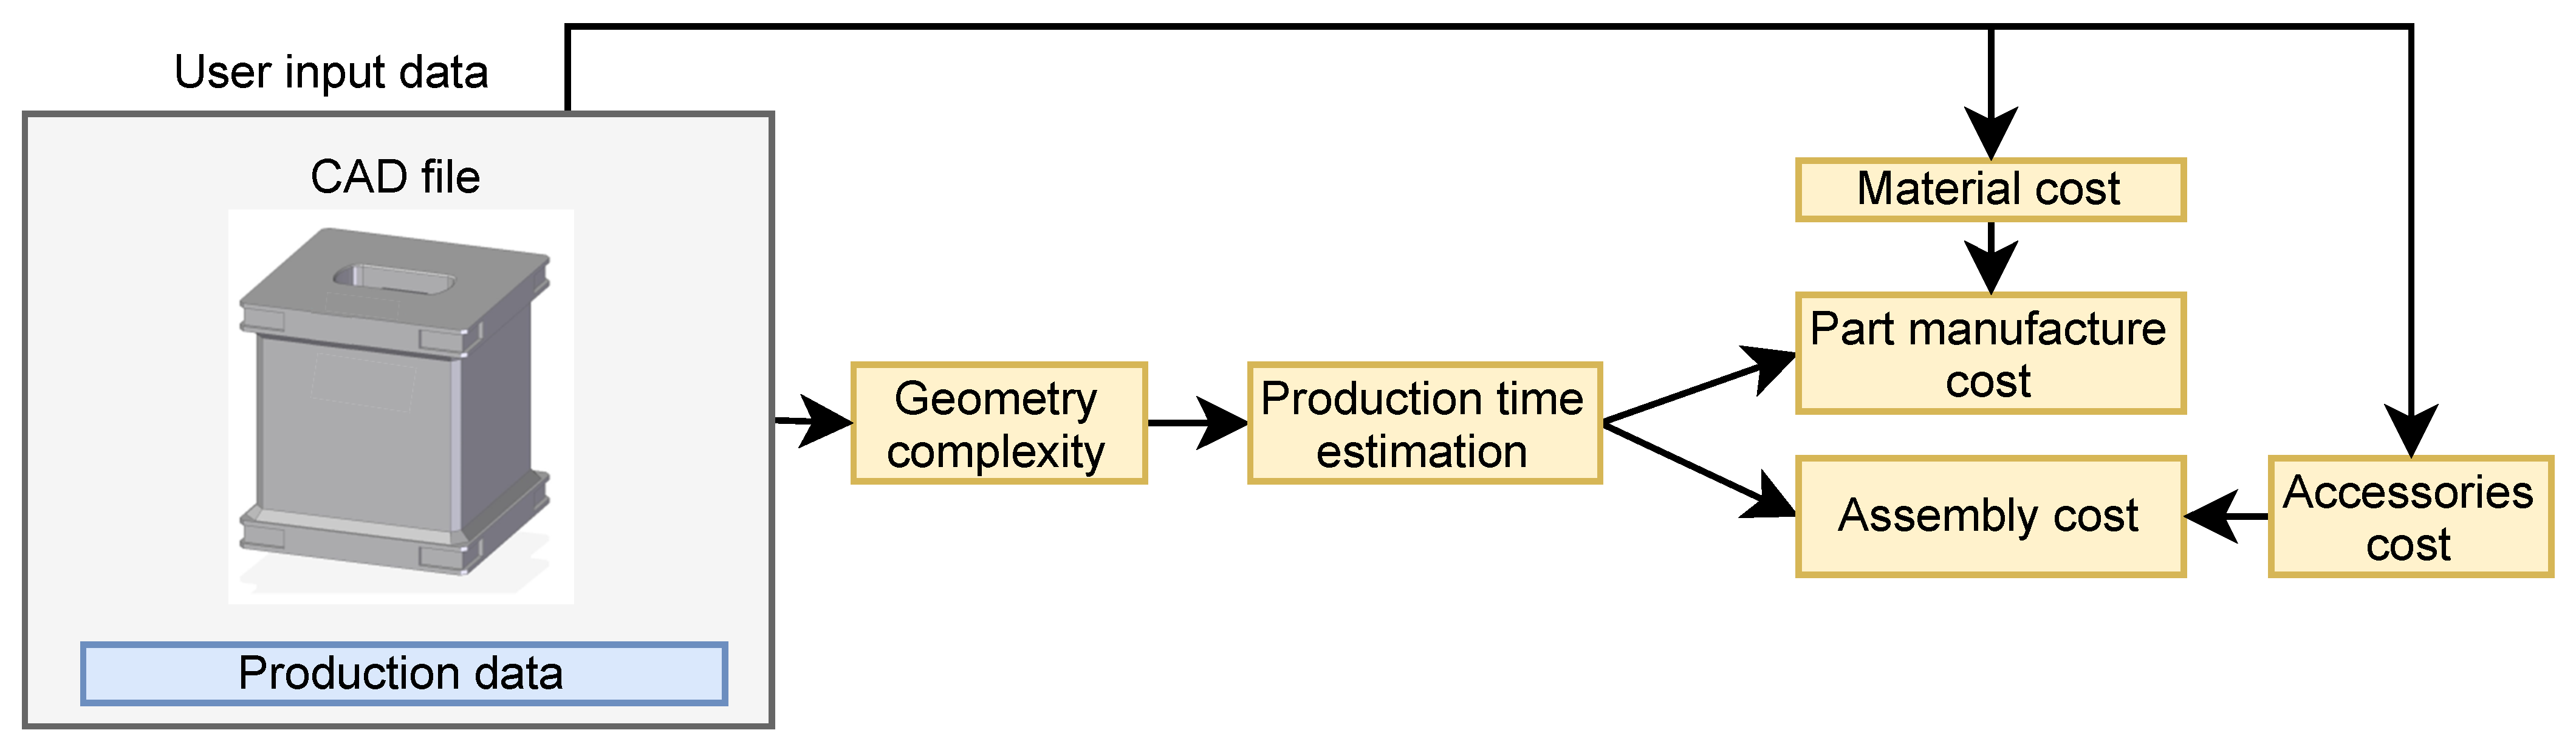
5. Predictive Technical Cost Model
5.1. Geometry Complexity
5.2. Production Time Estimation
5.2.1. Machining
5.2.2. Welding
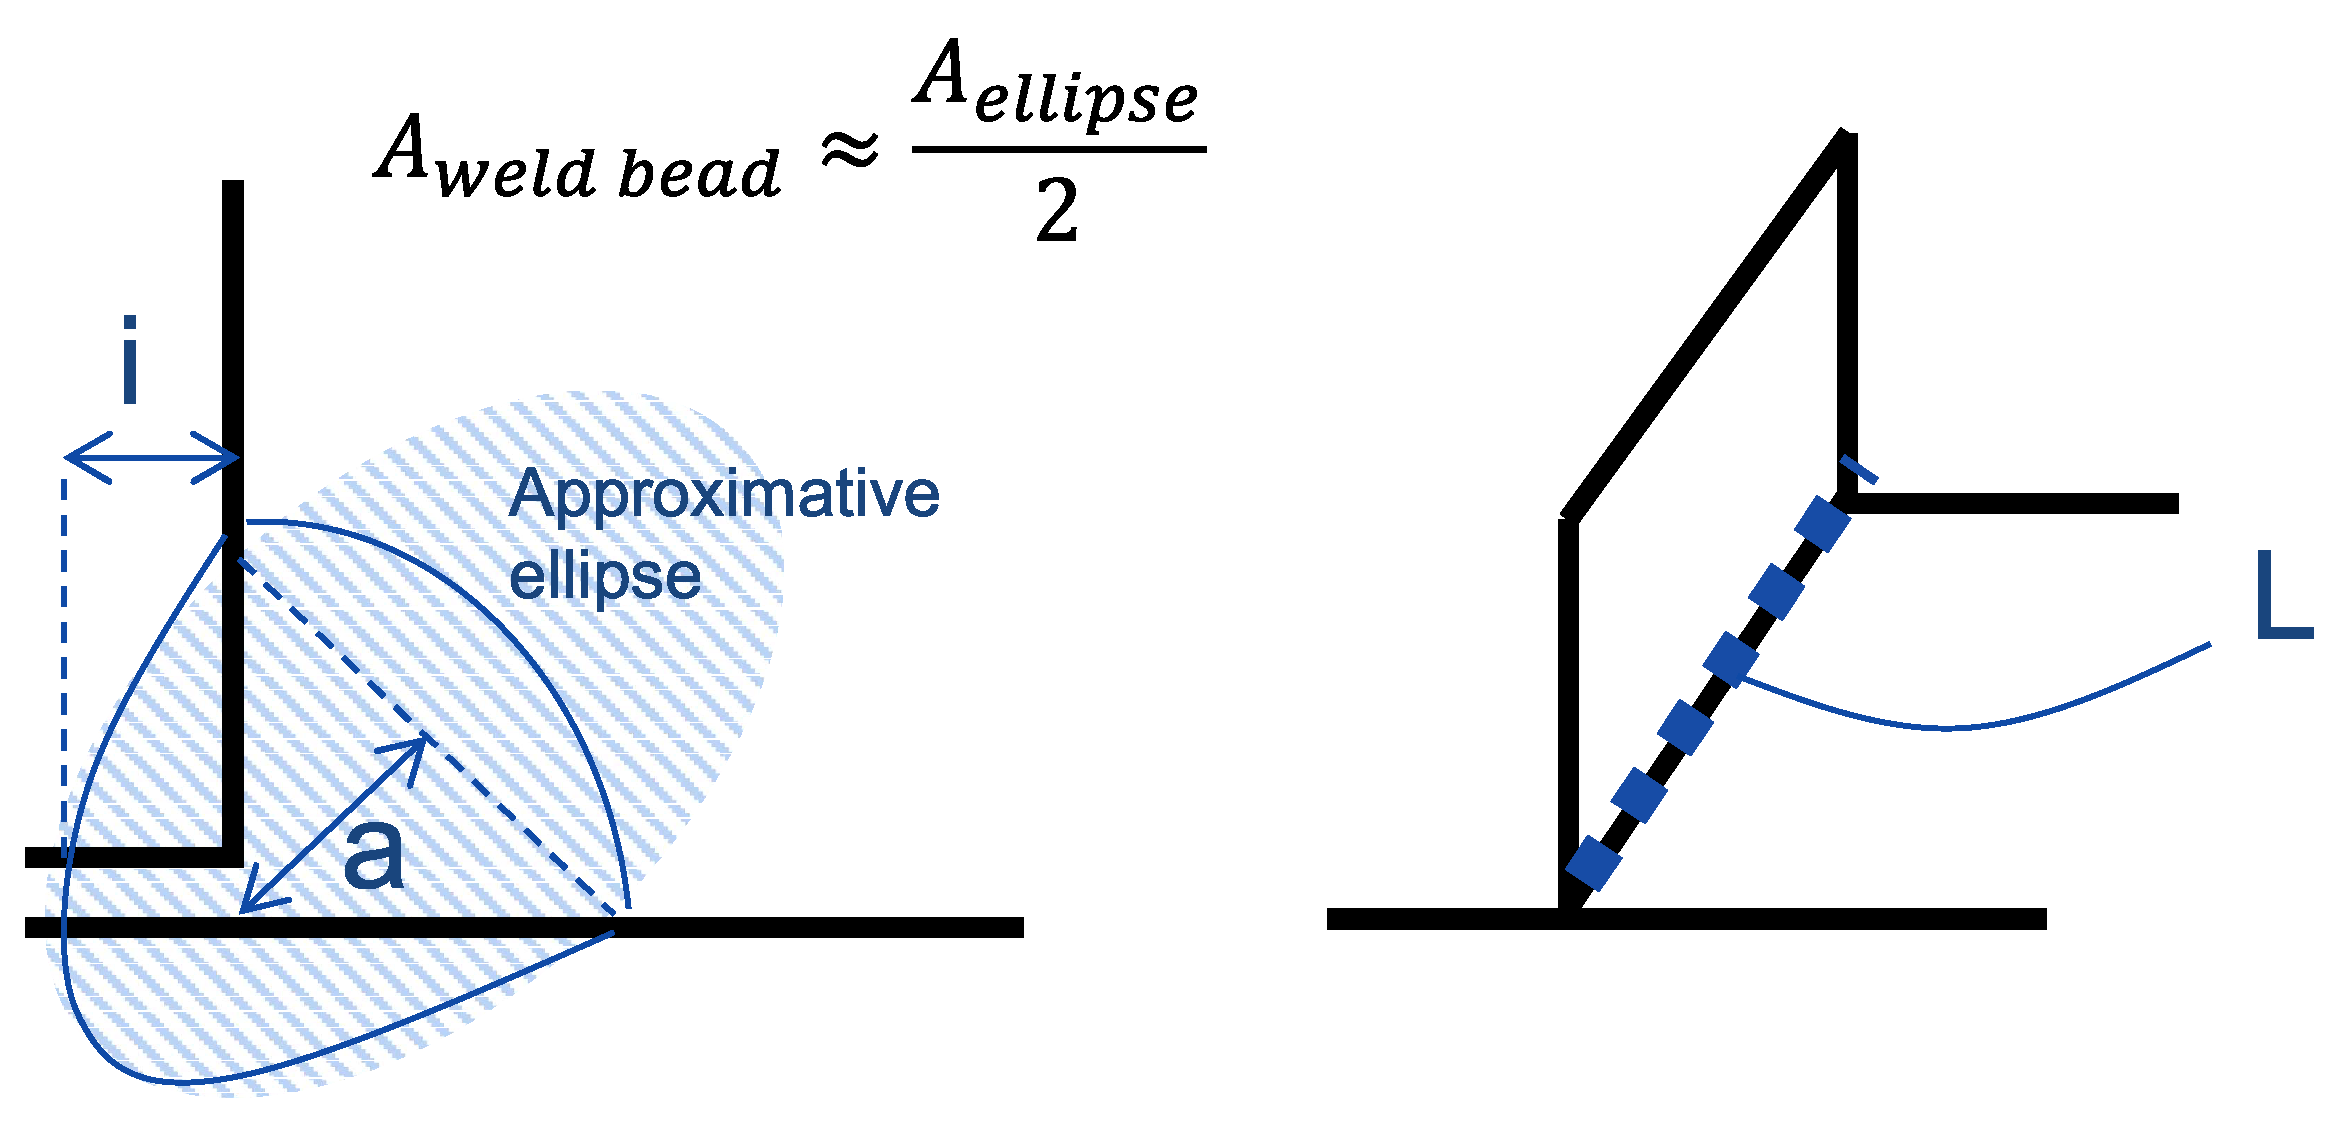
5.2.3. Weld Preparation
5.3. Material Cost
5.4. Part Manufacture Cost
Machining
5.5. Assembly Cost
Metal Arc Welding and Flux Cored Arc Welding
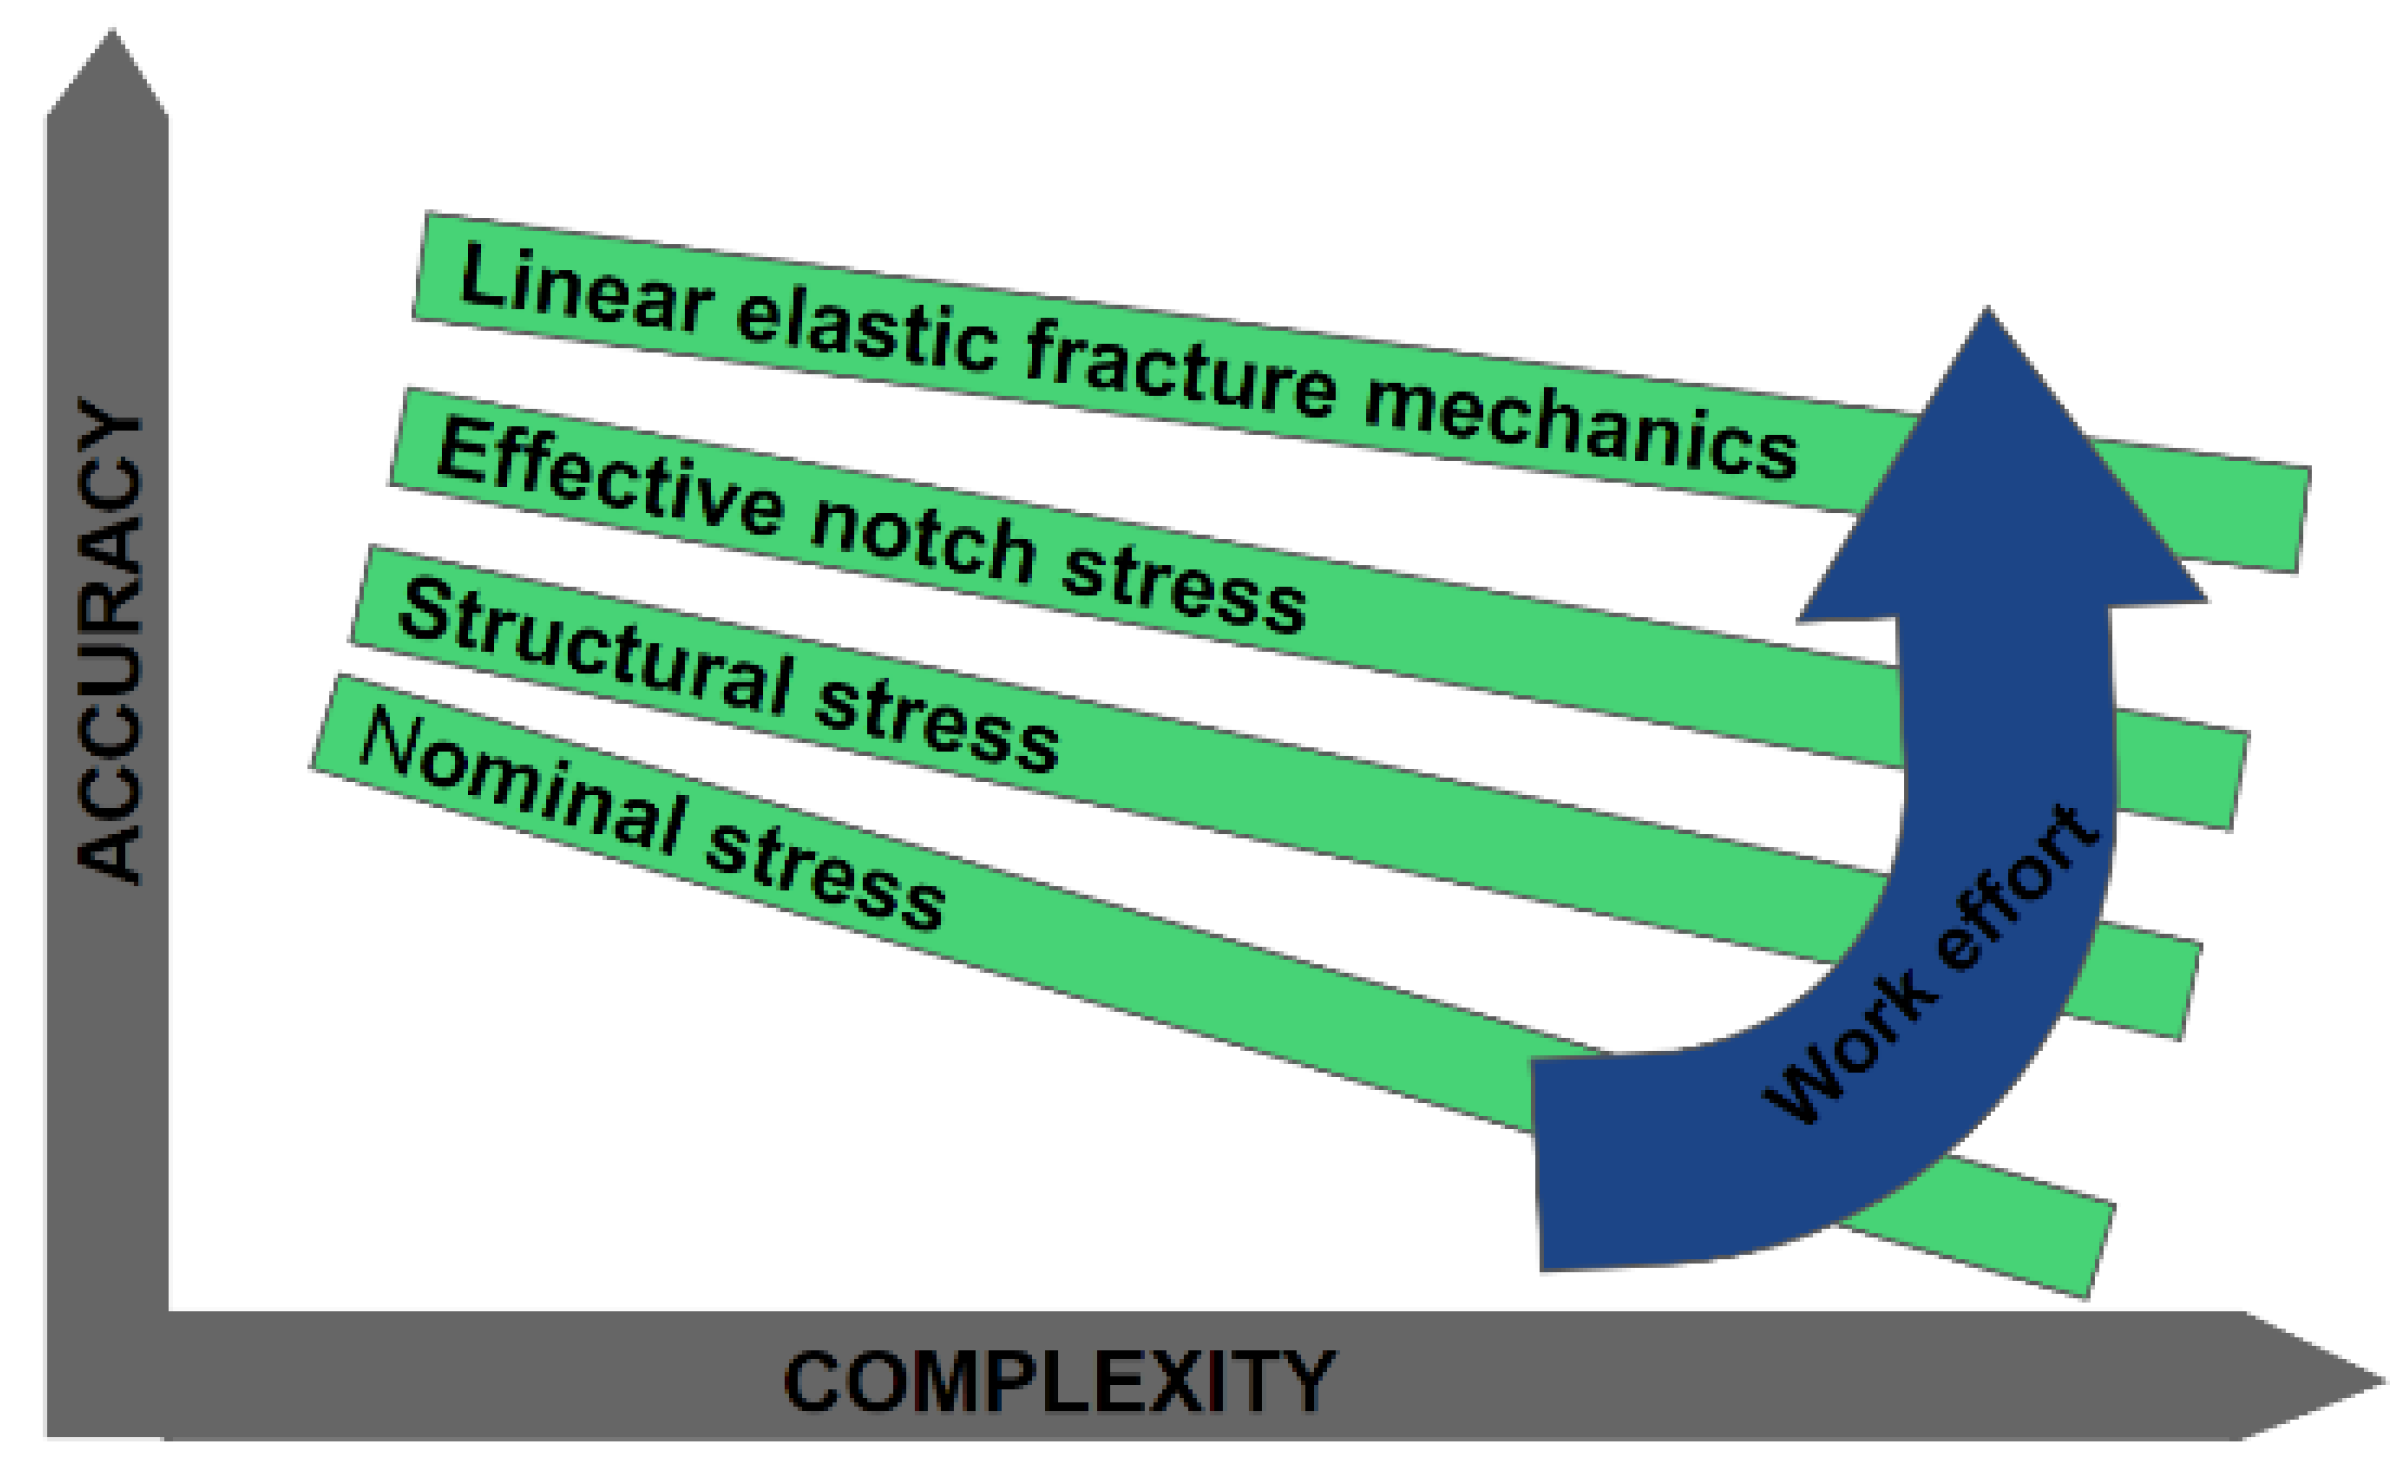
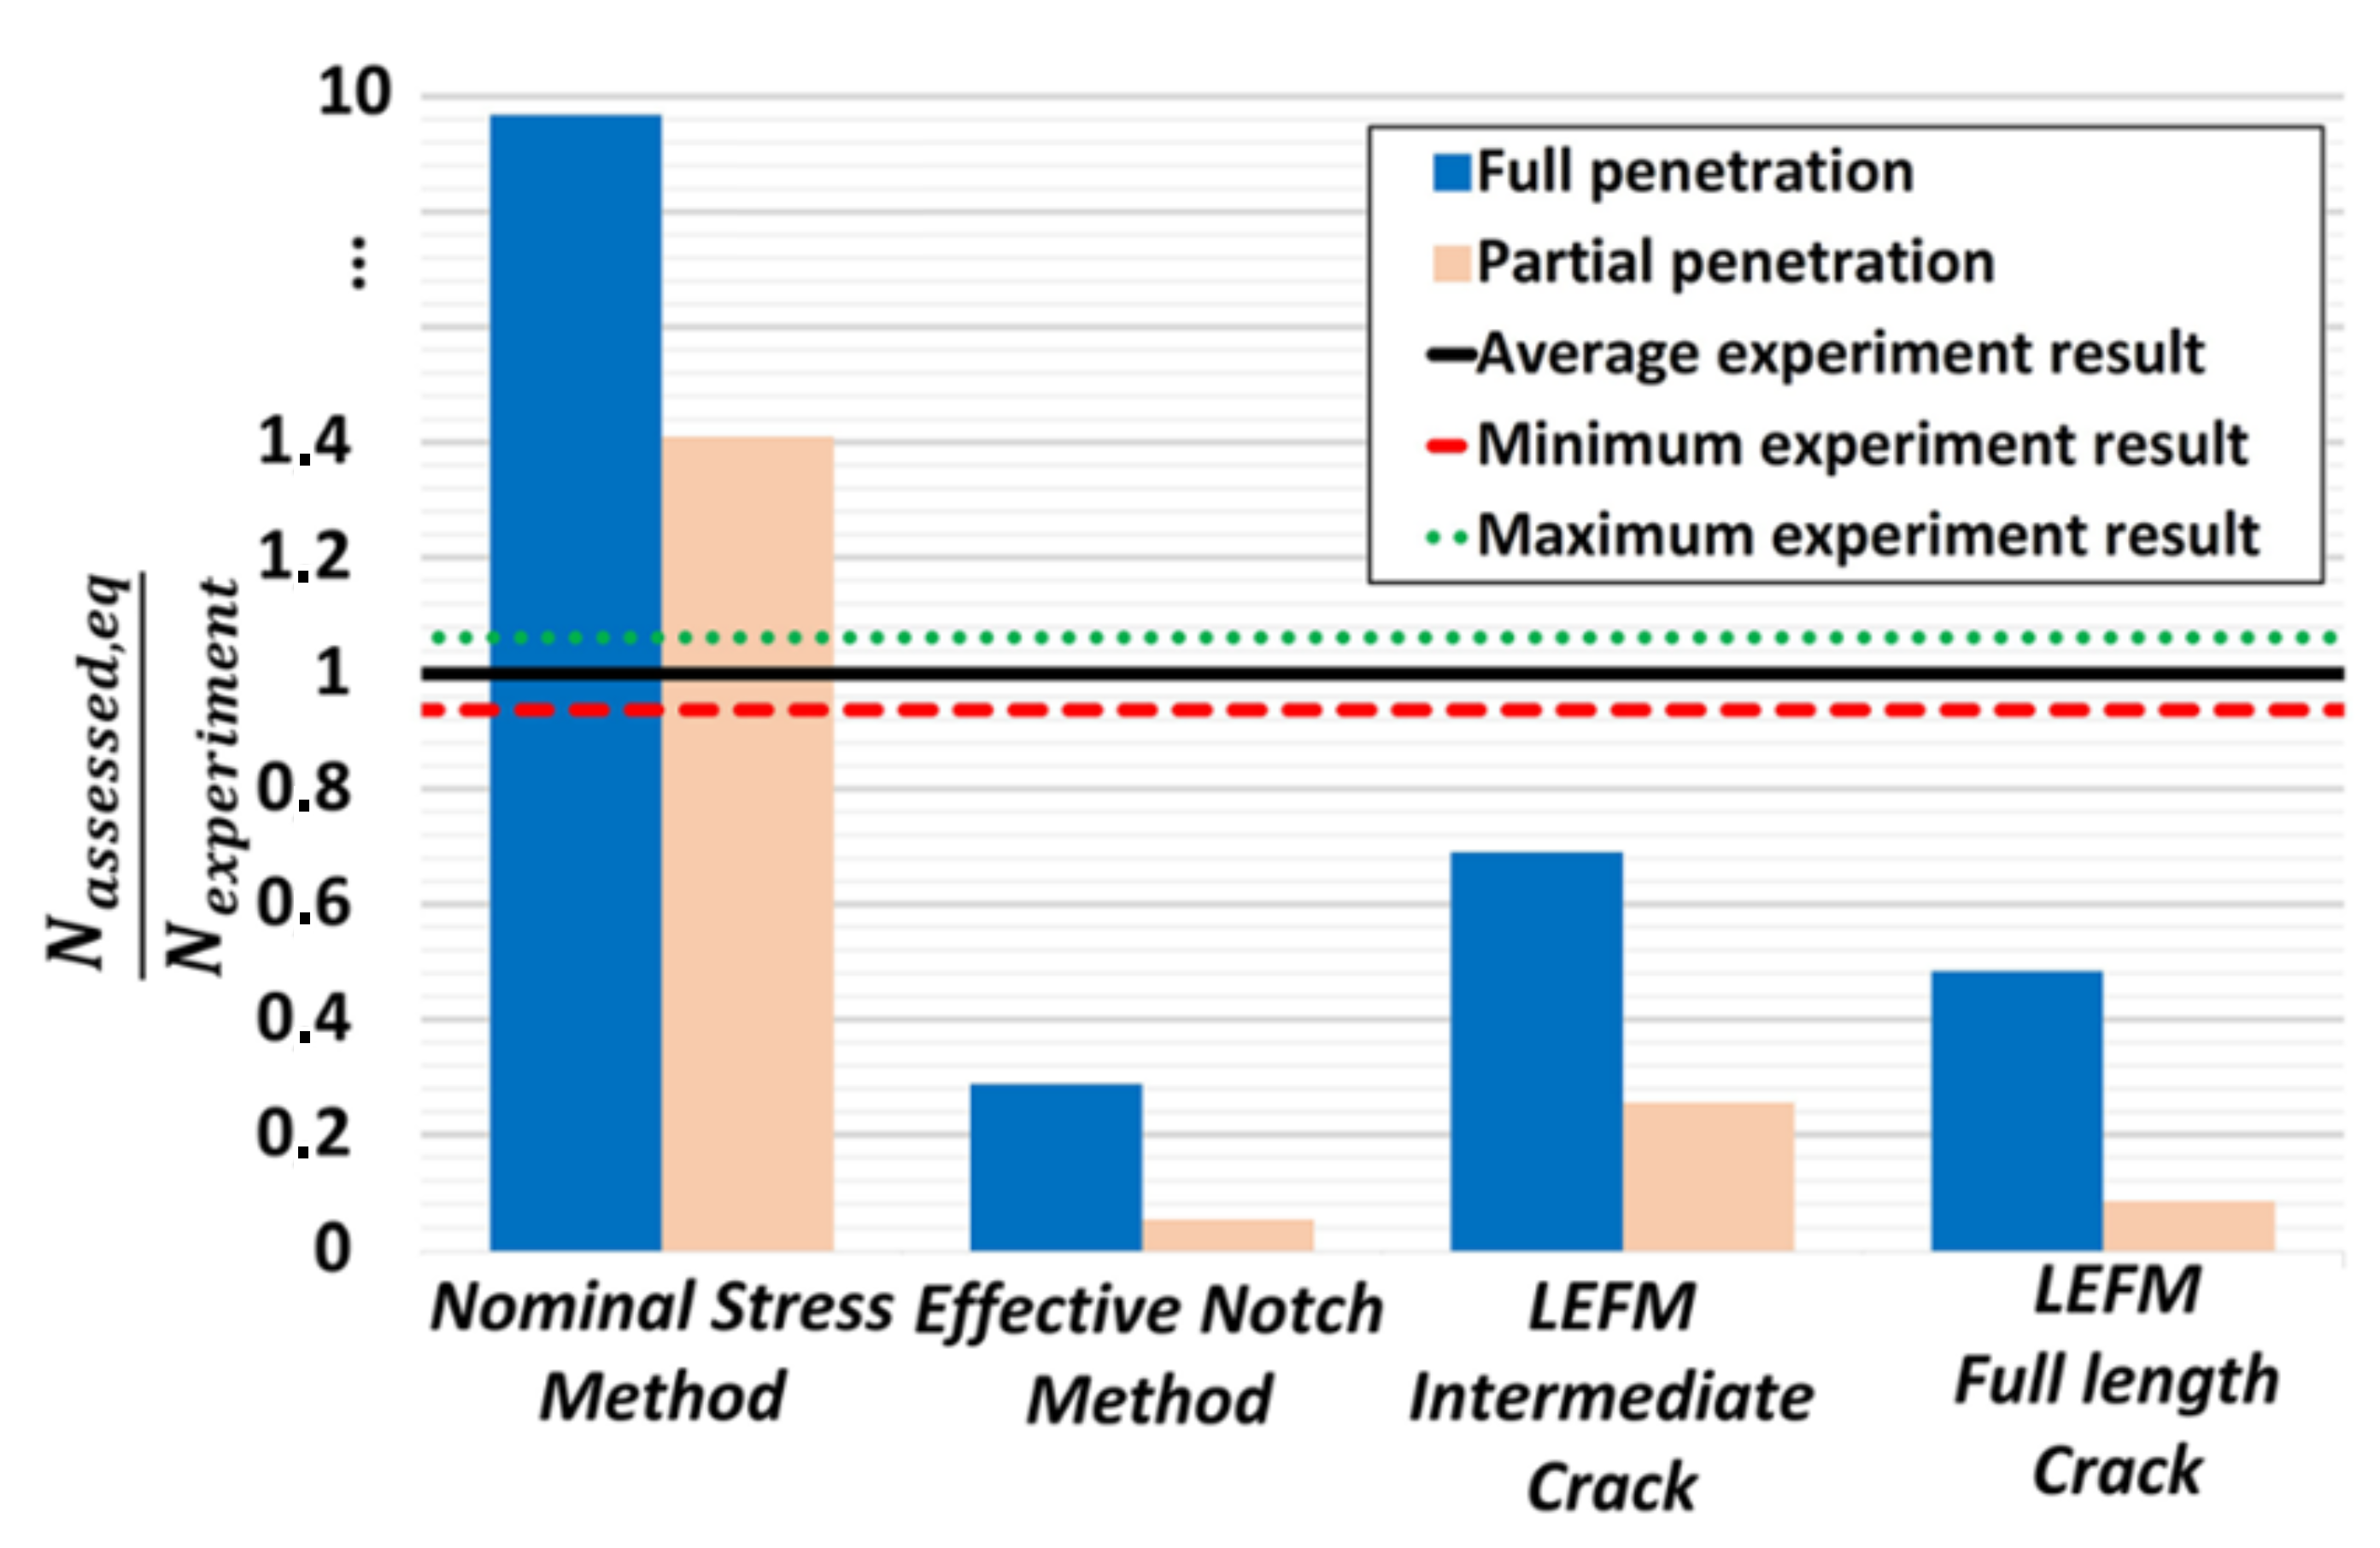
6. Fatigue Assessment
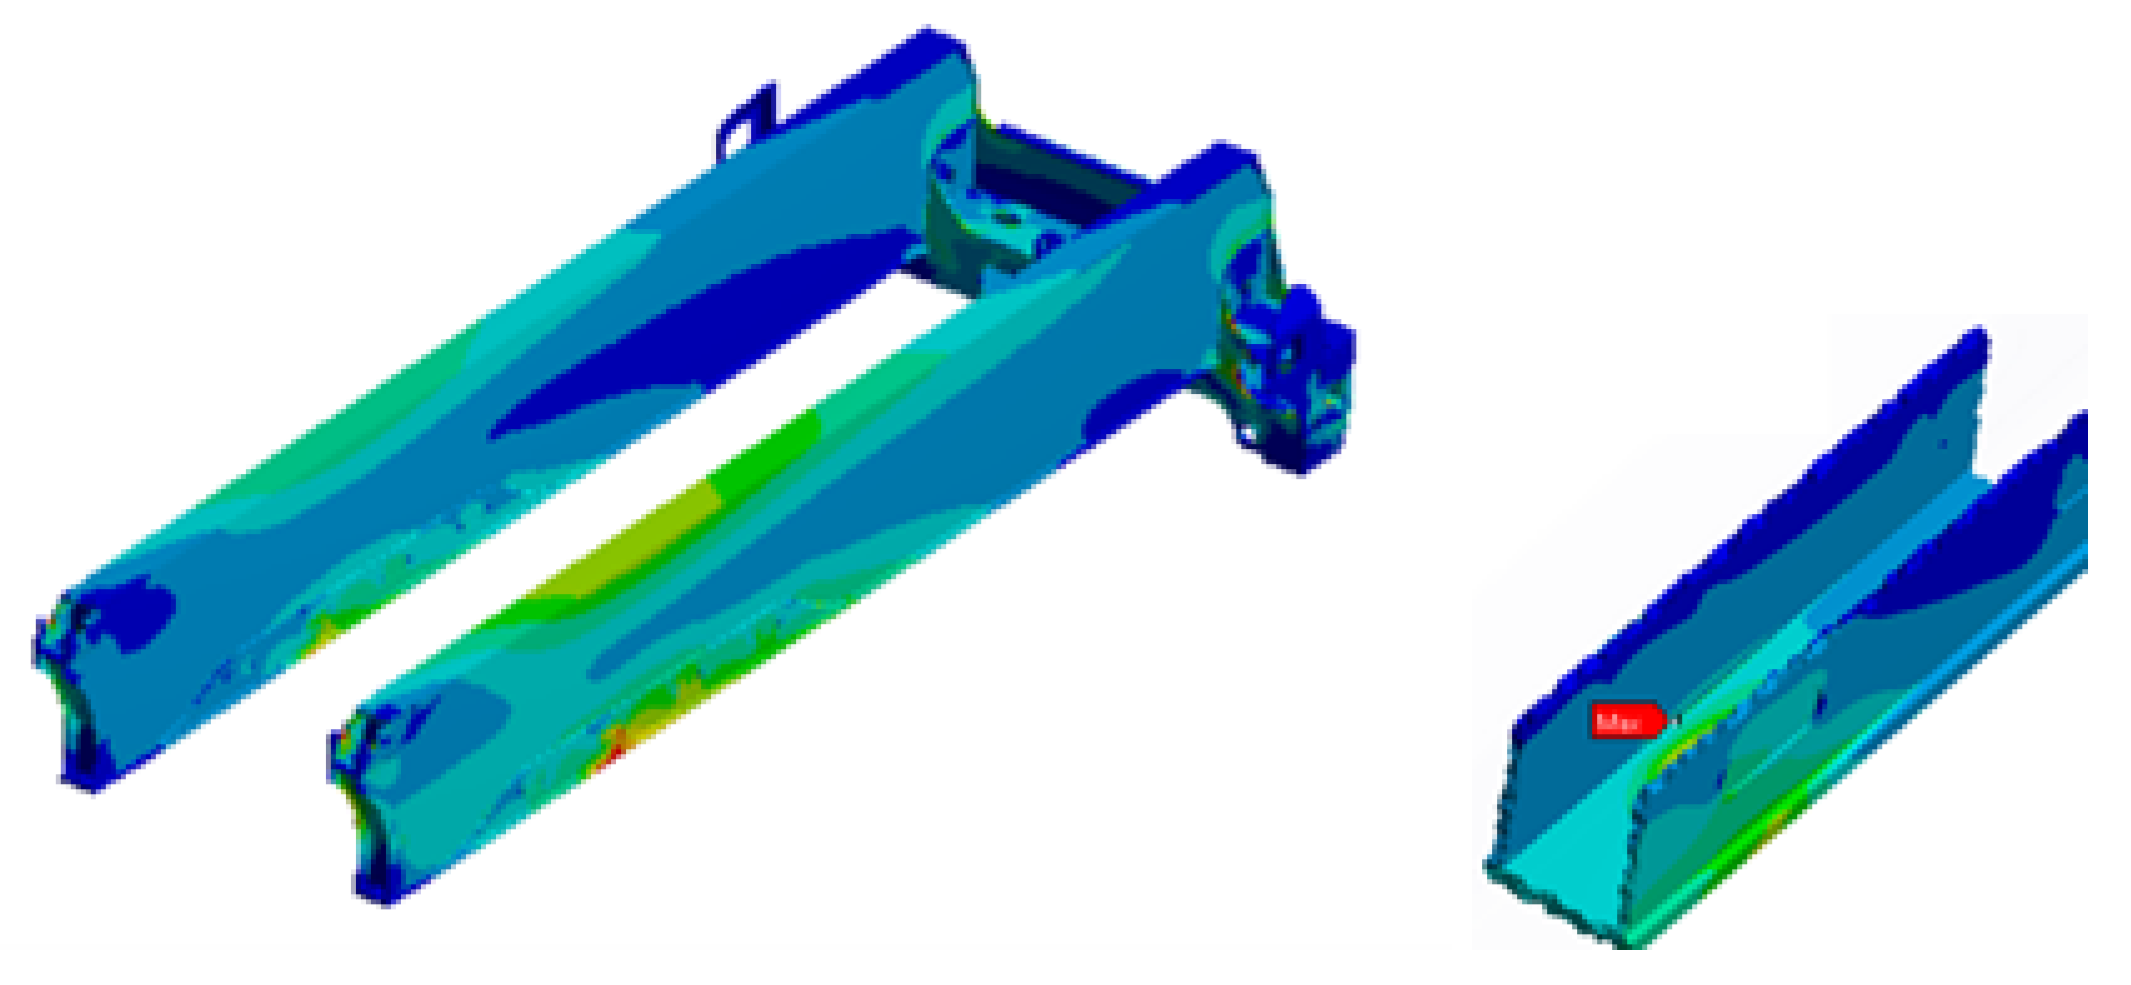
7. Case Study: PLCC of a Welded Box Structure
7.1. Fatigue Behavior and Estimated Life
7.2. Material Cost
7.3. Production Cost
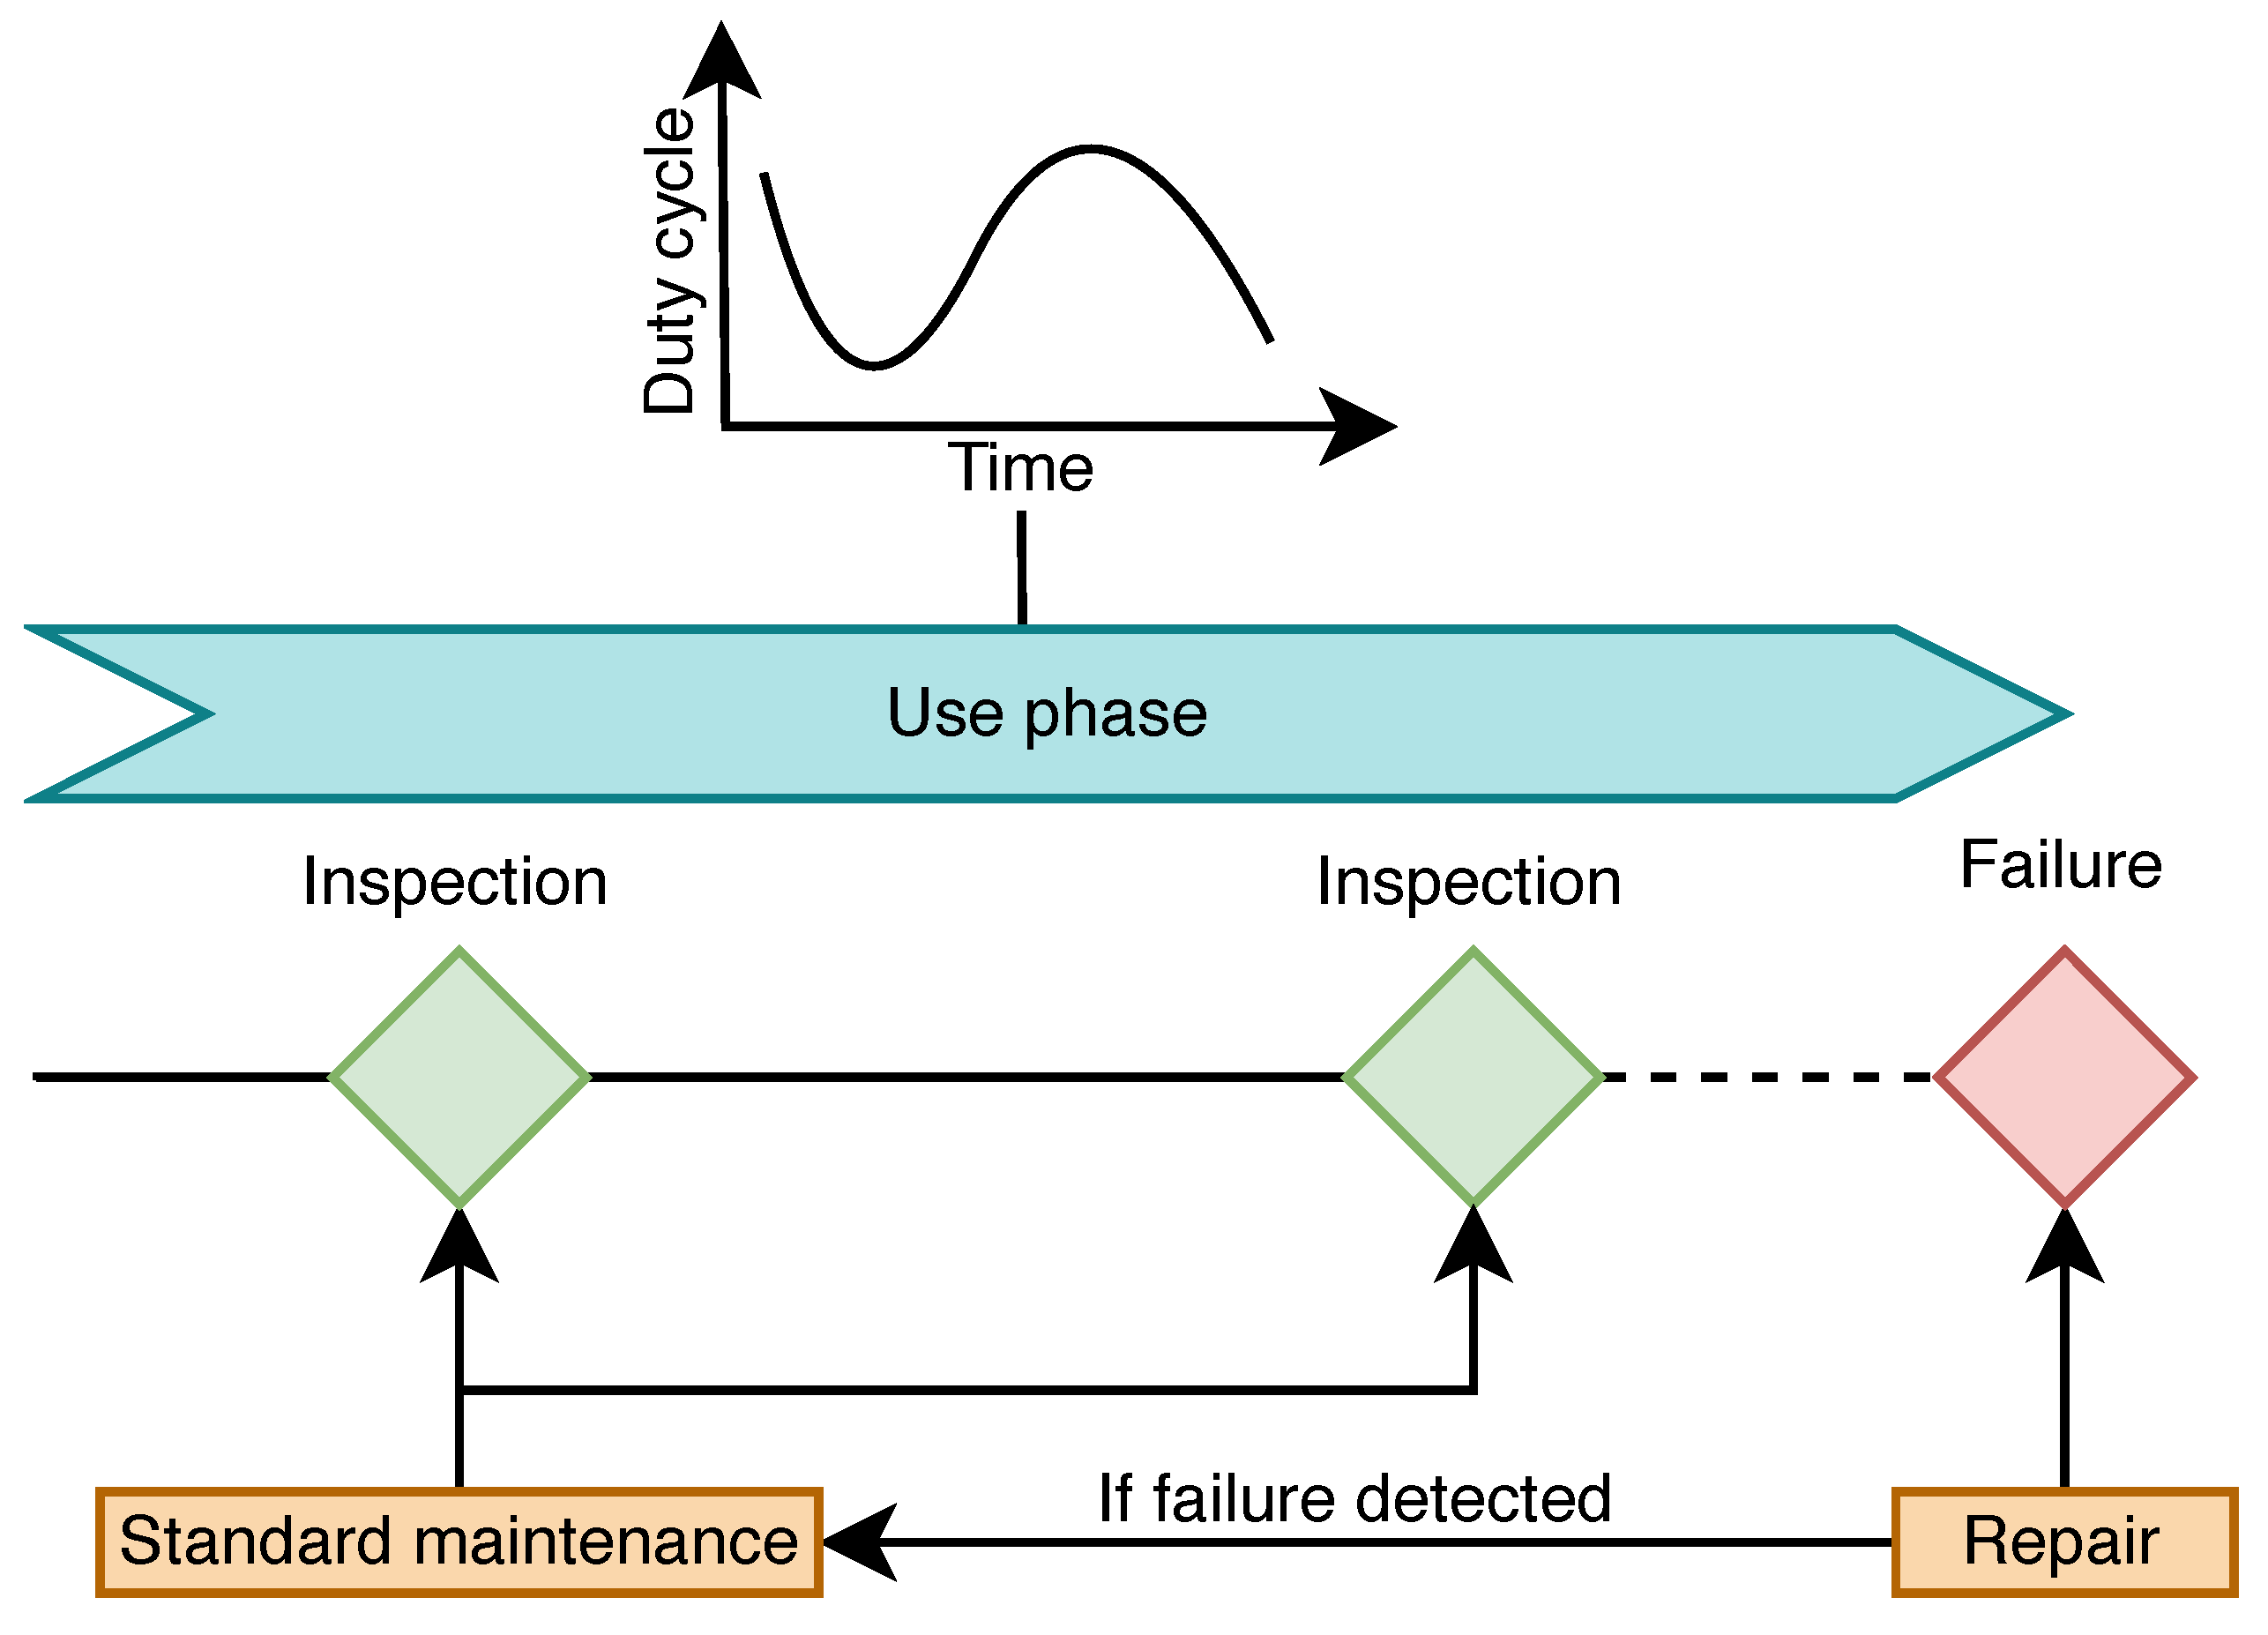
7.4. Use Phase Cost
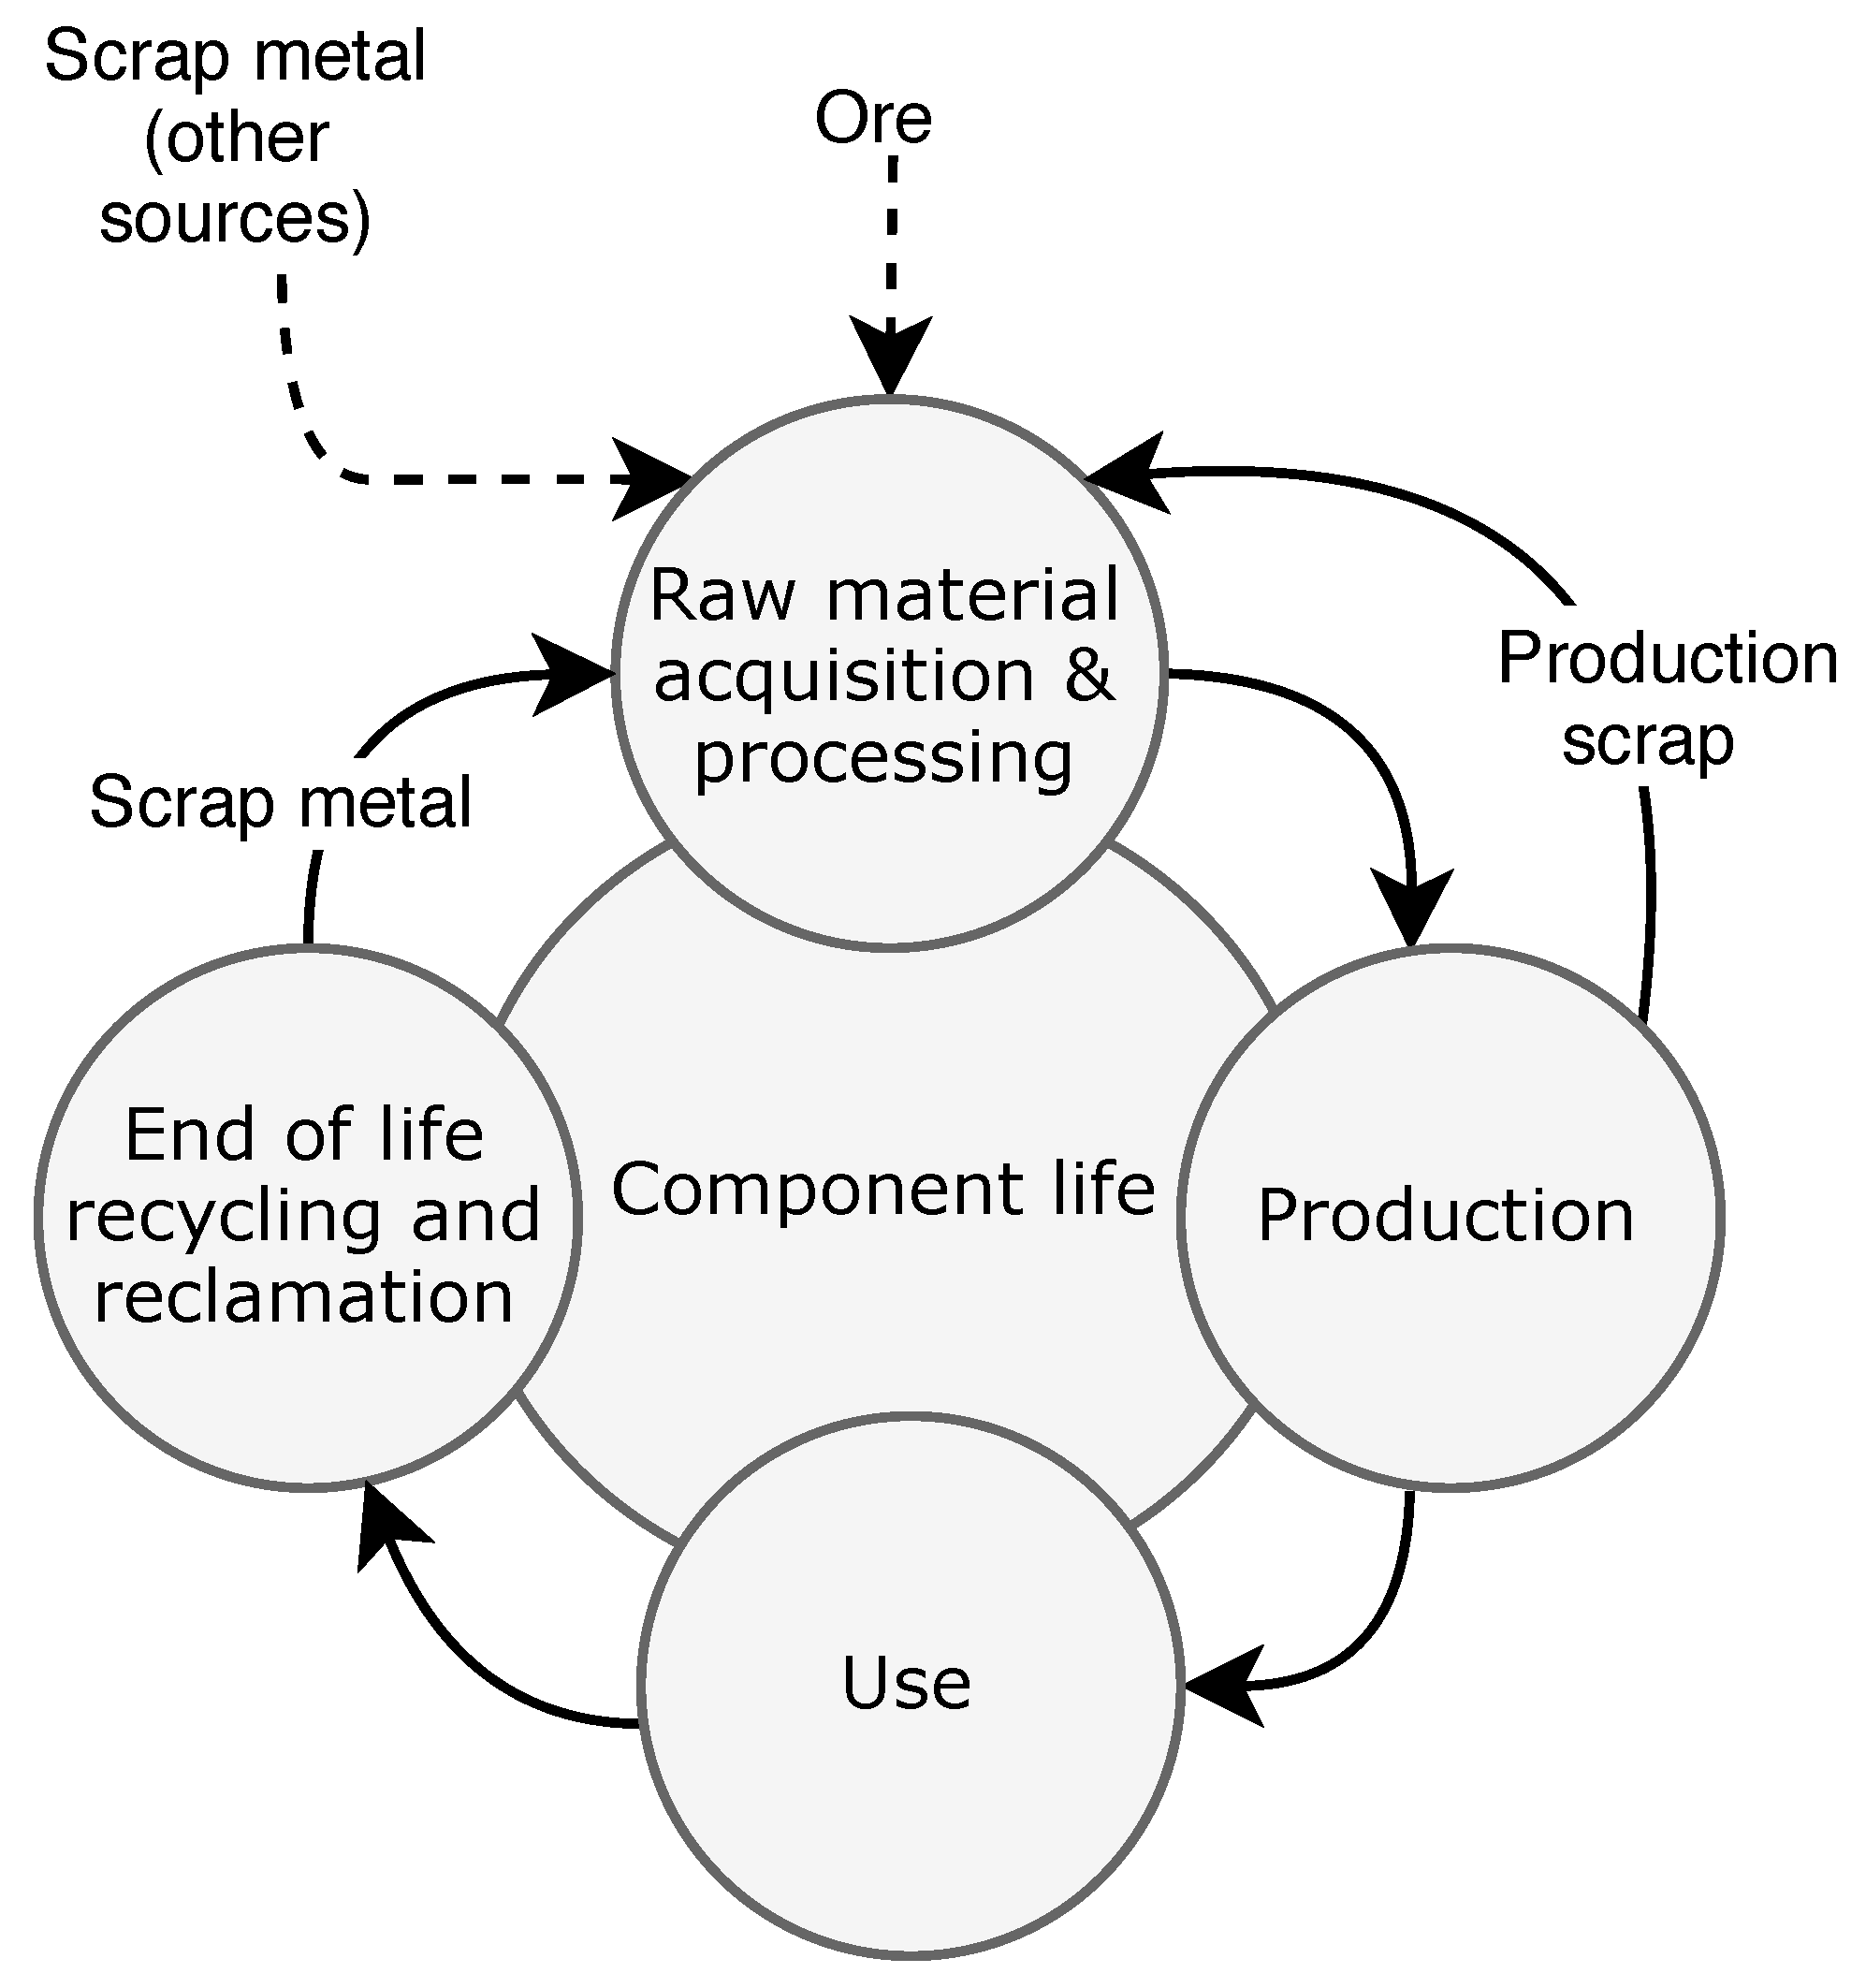
7.5. End-of-Life Cost
8. Results
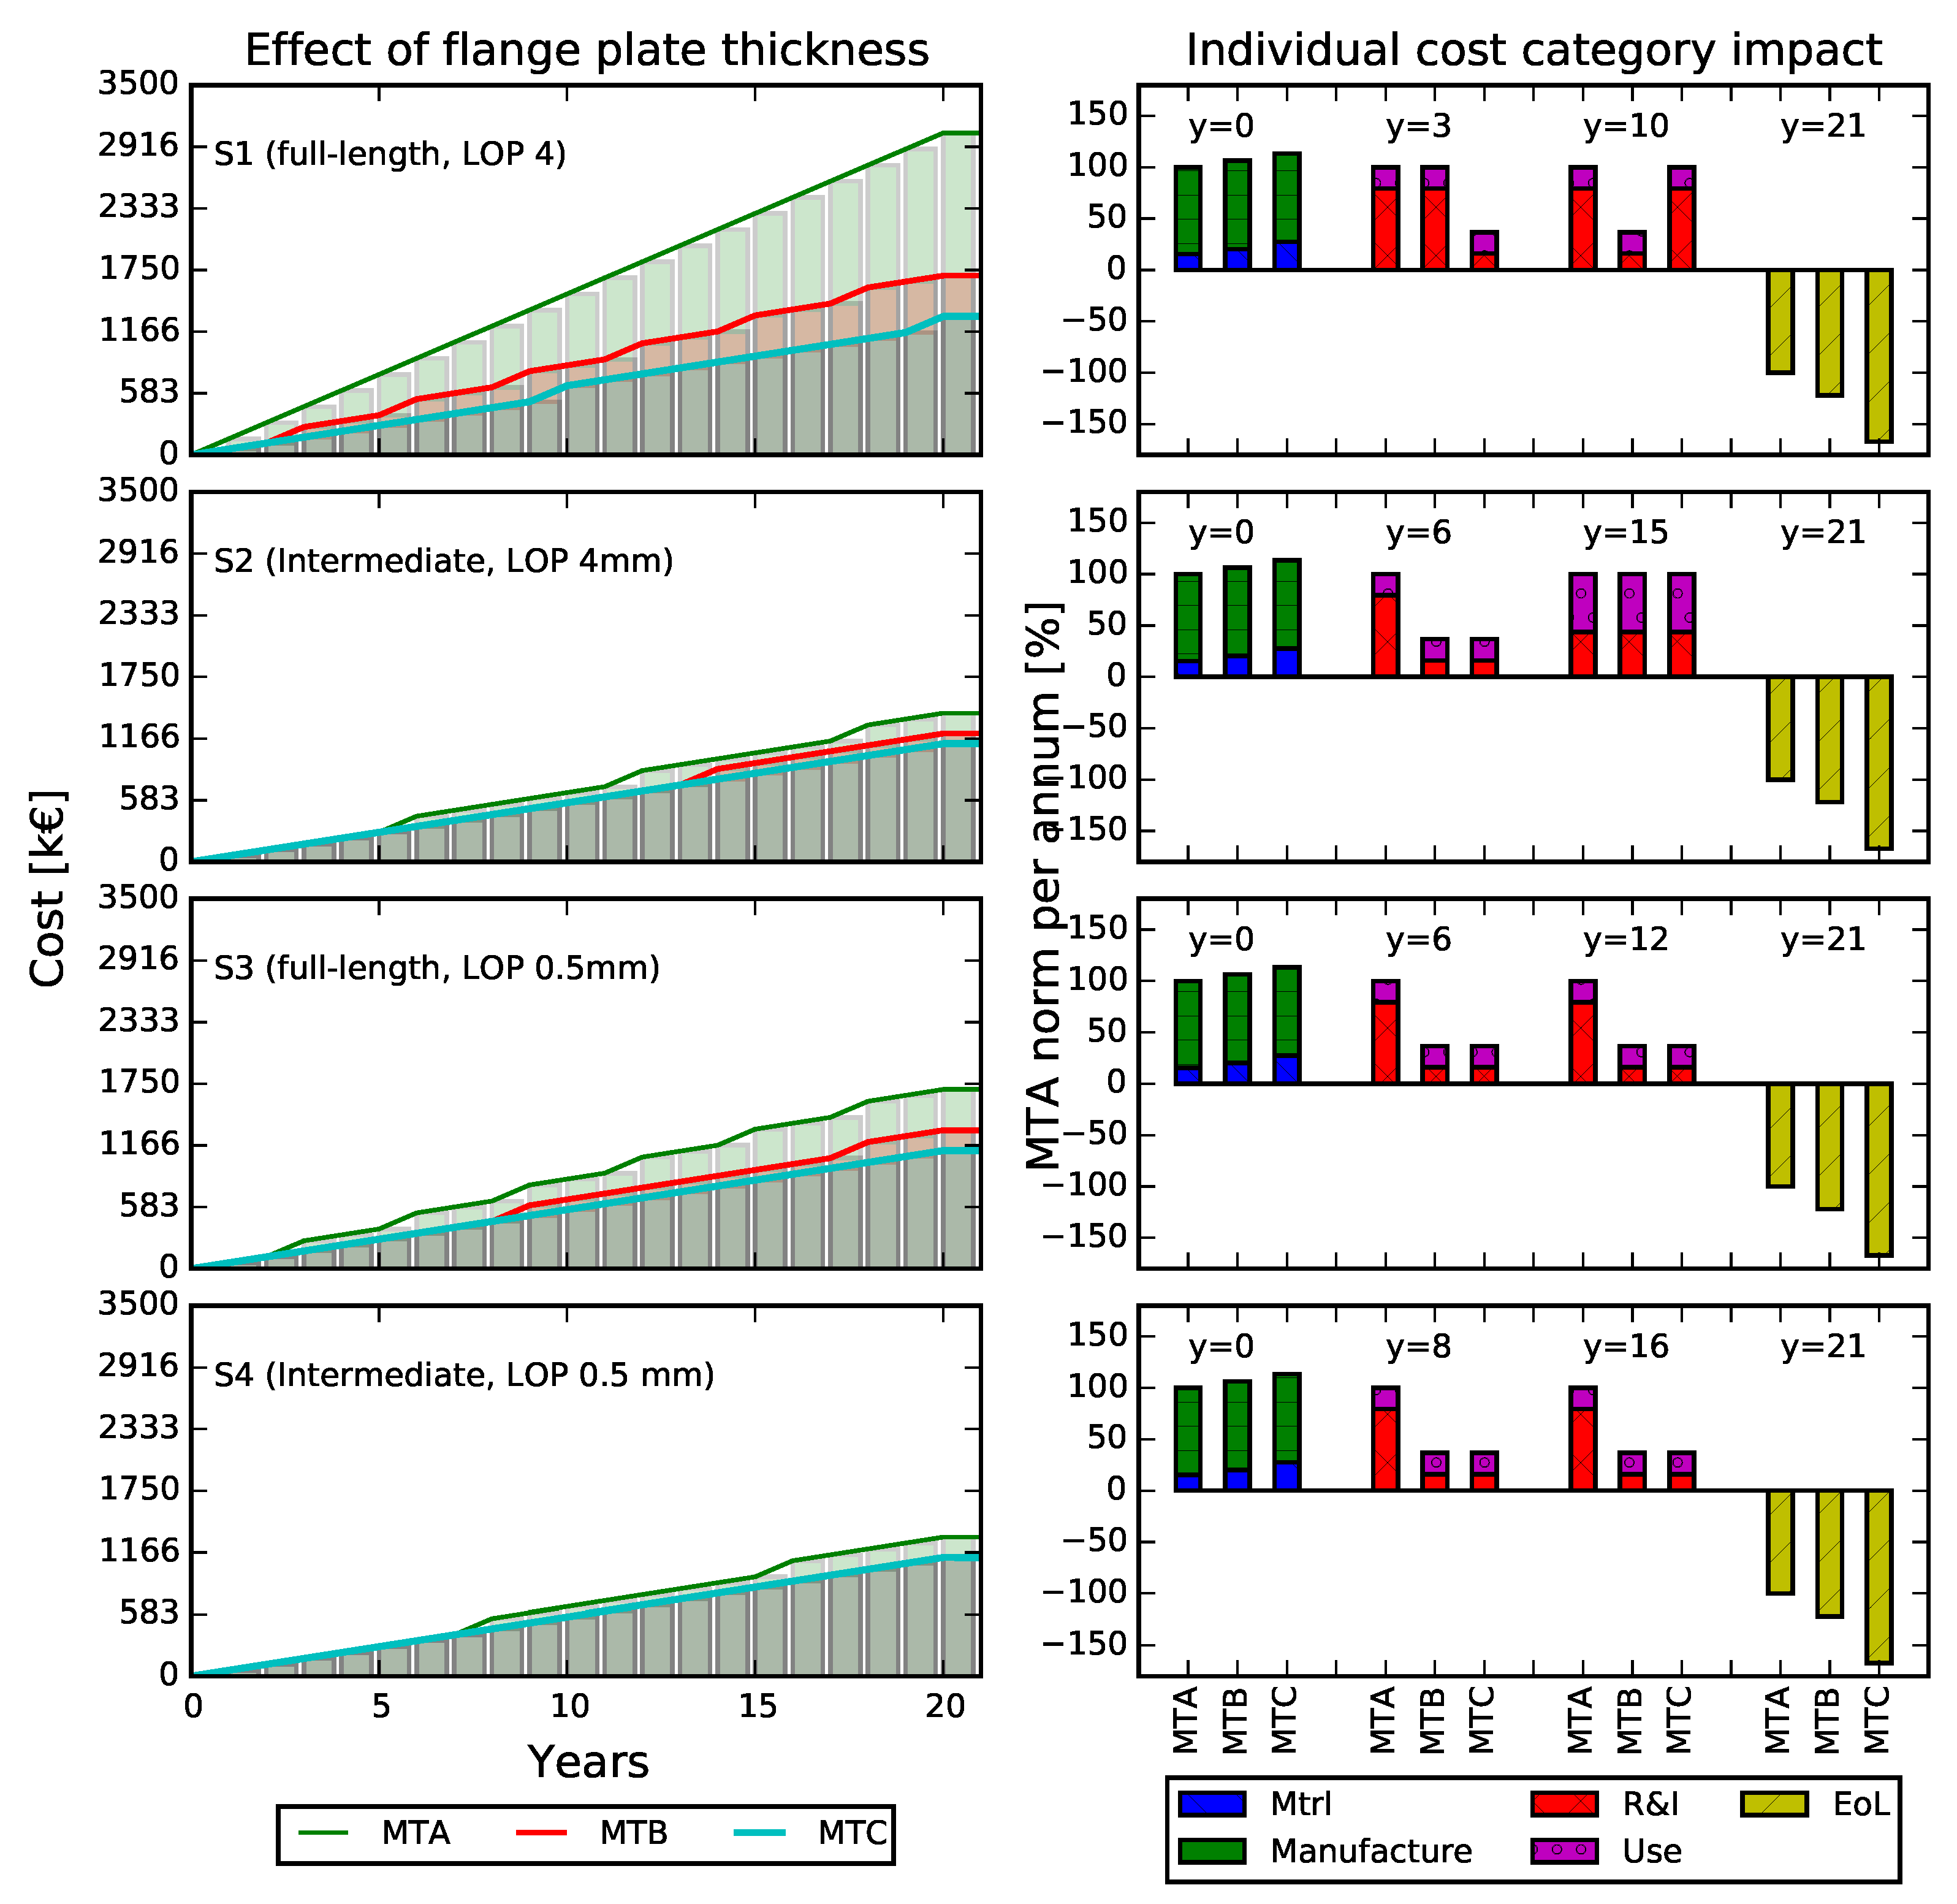
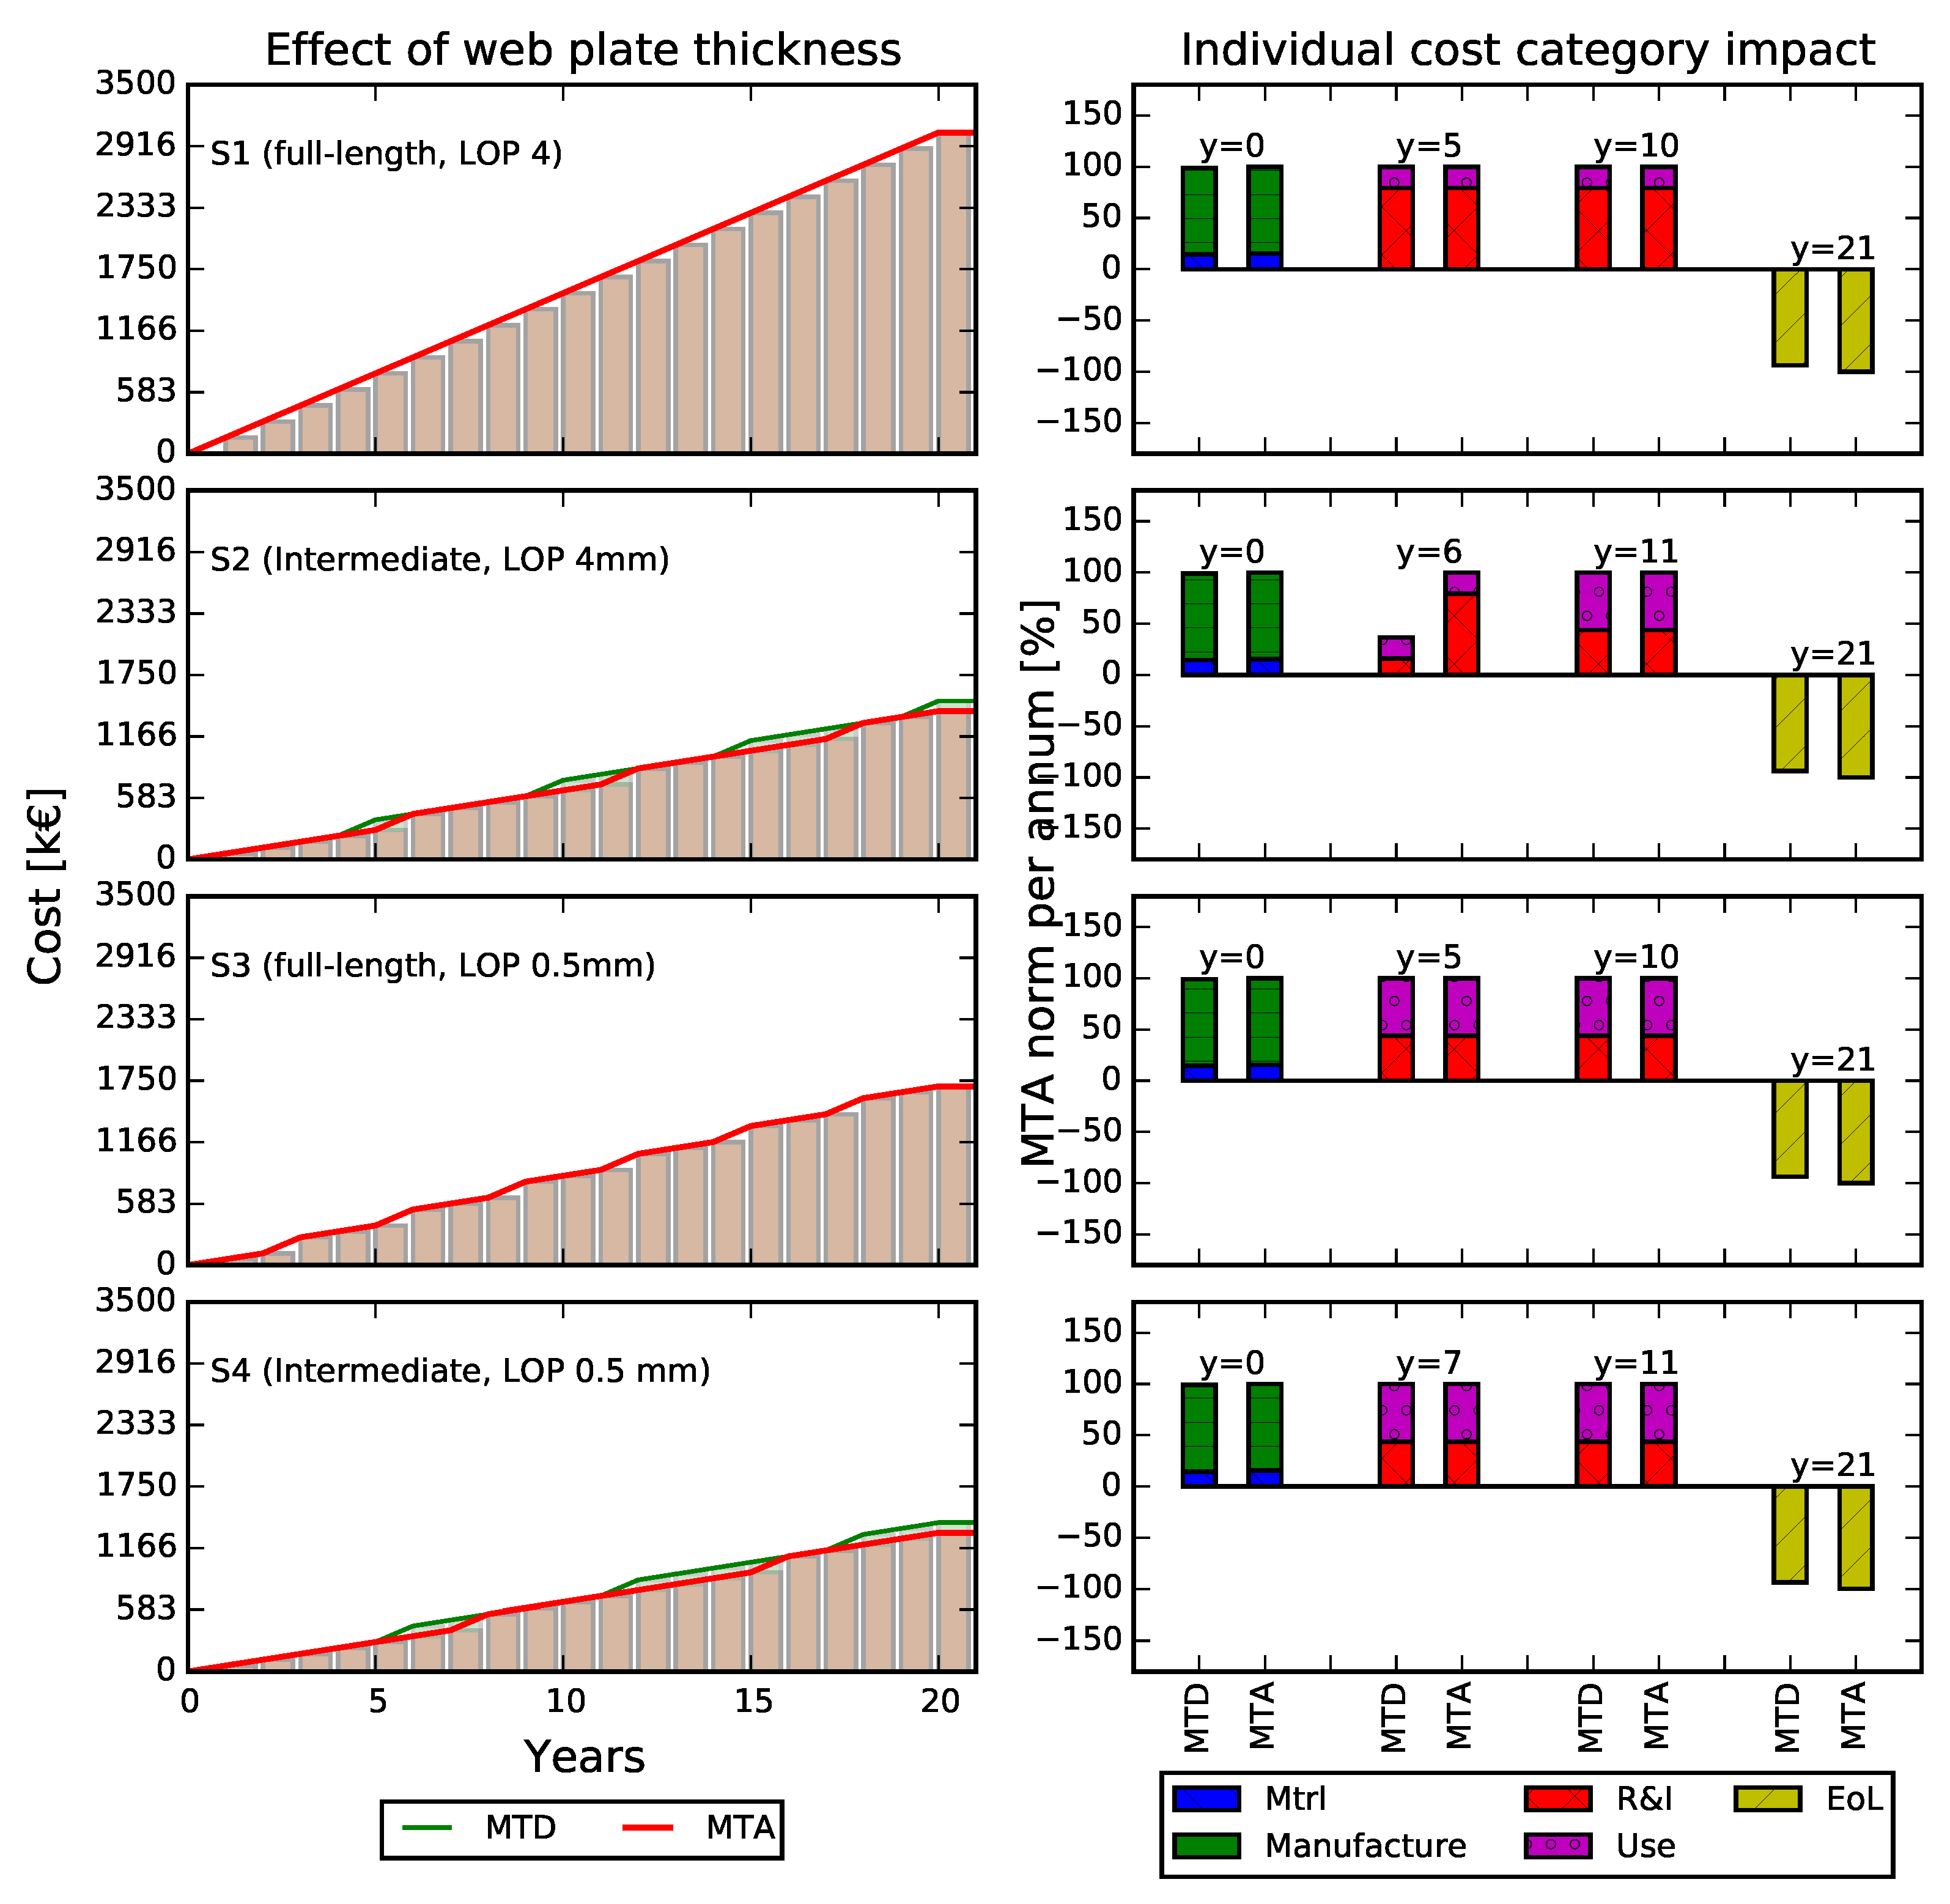
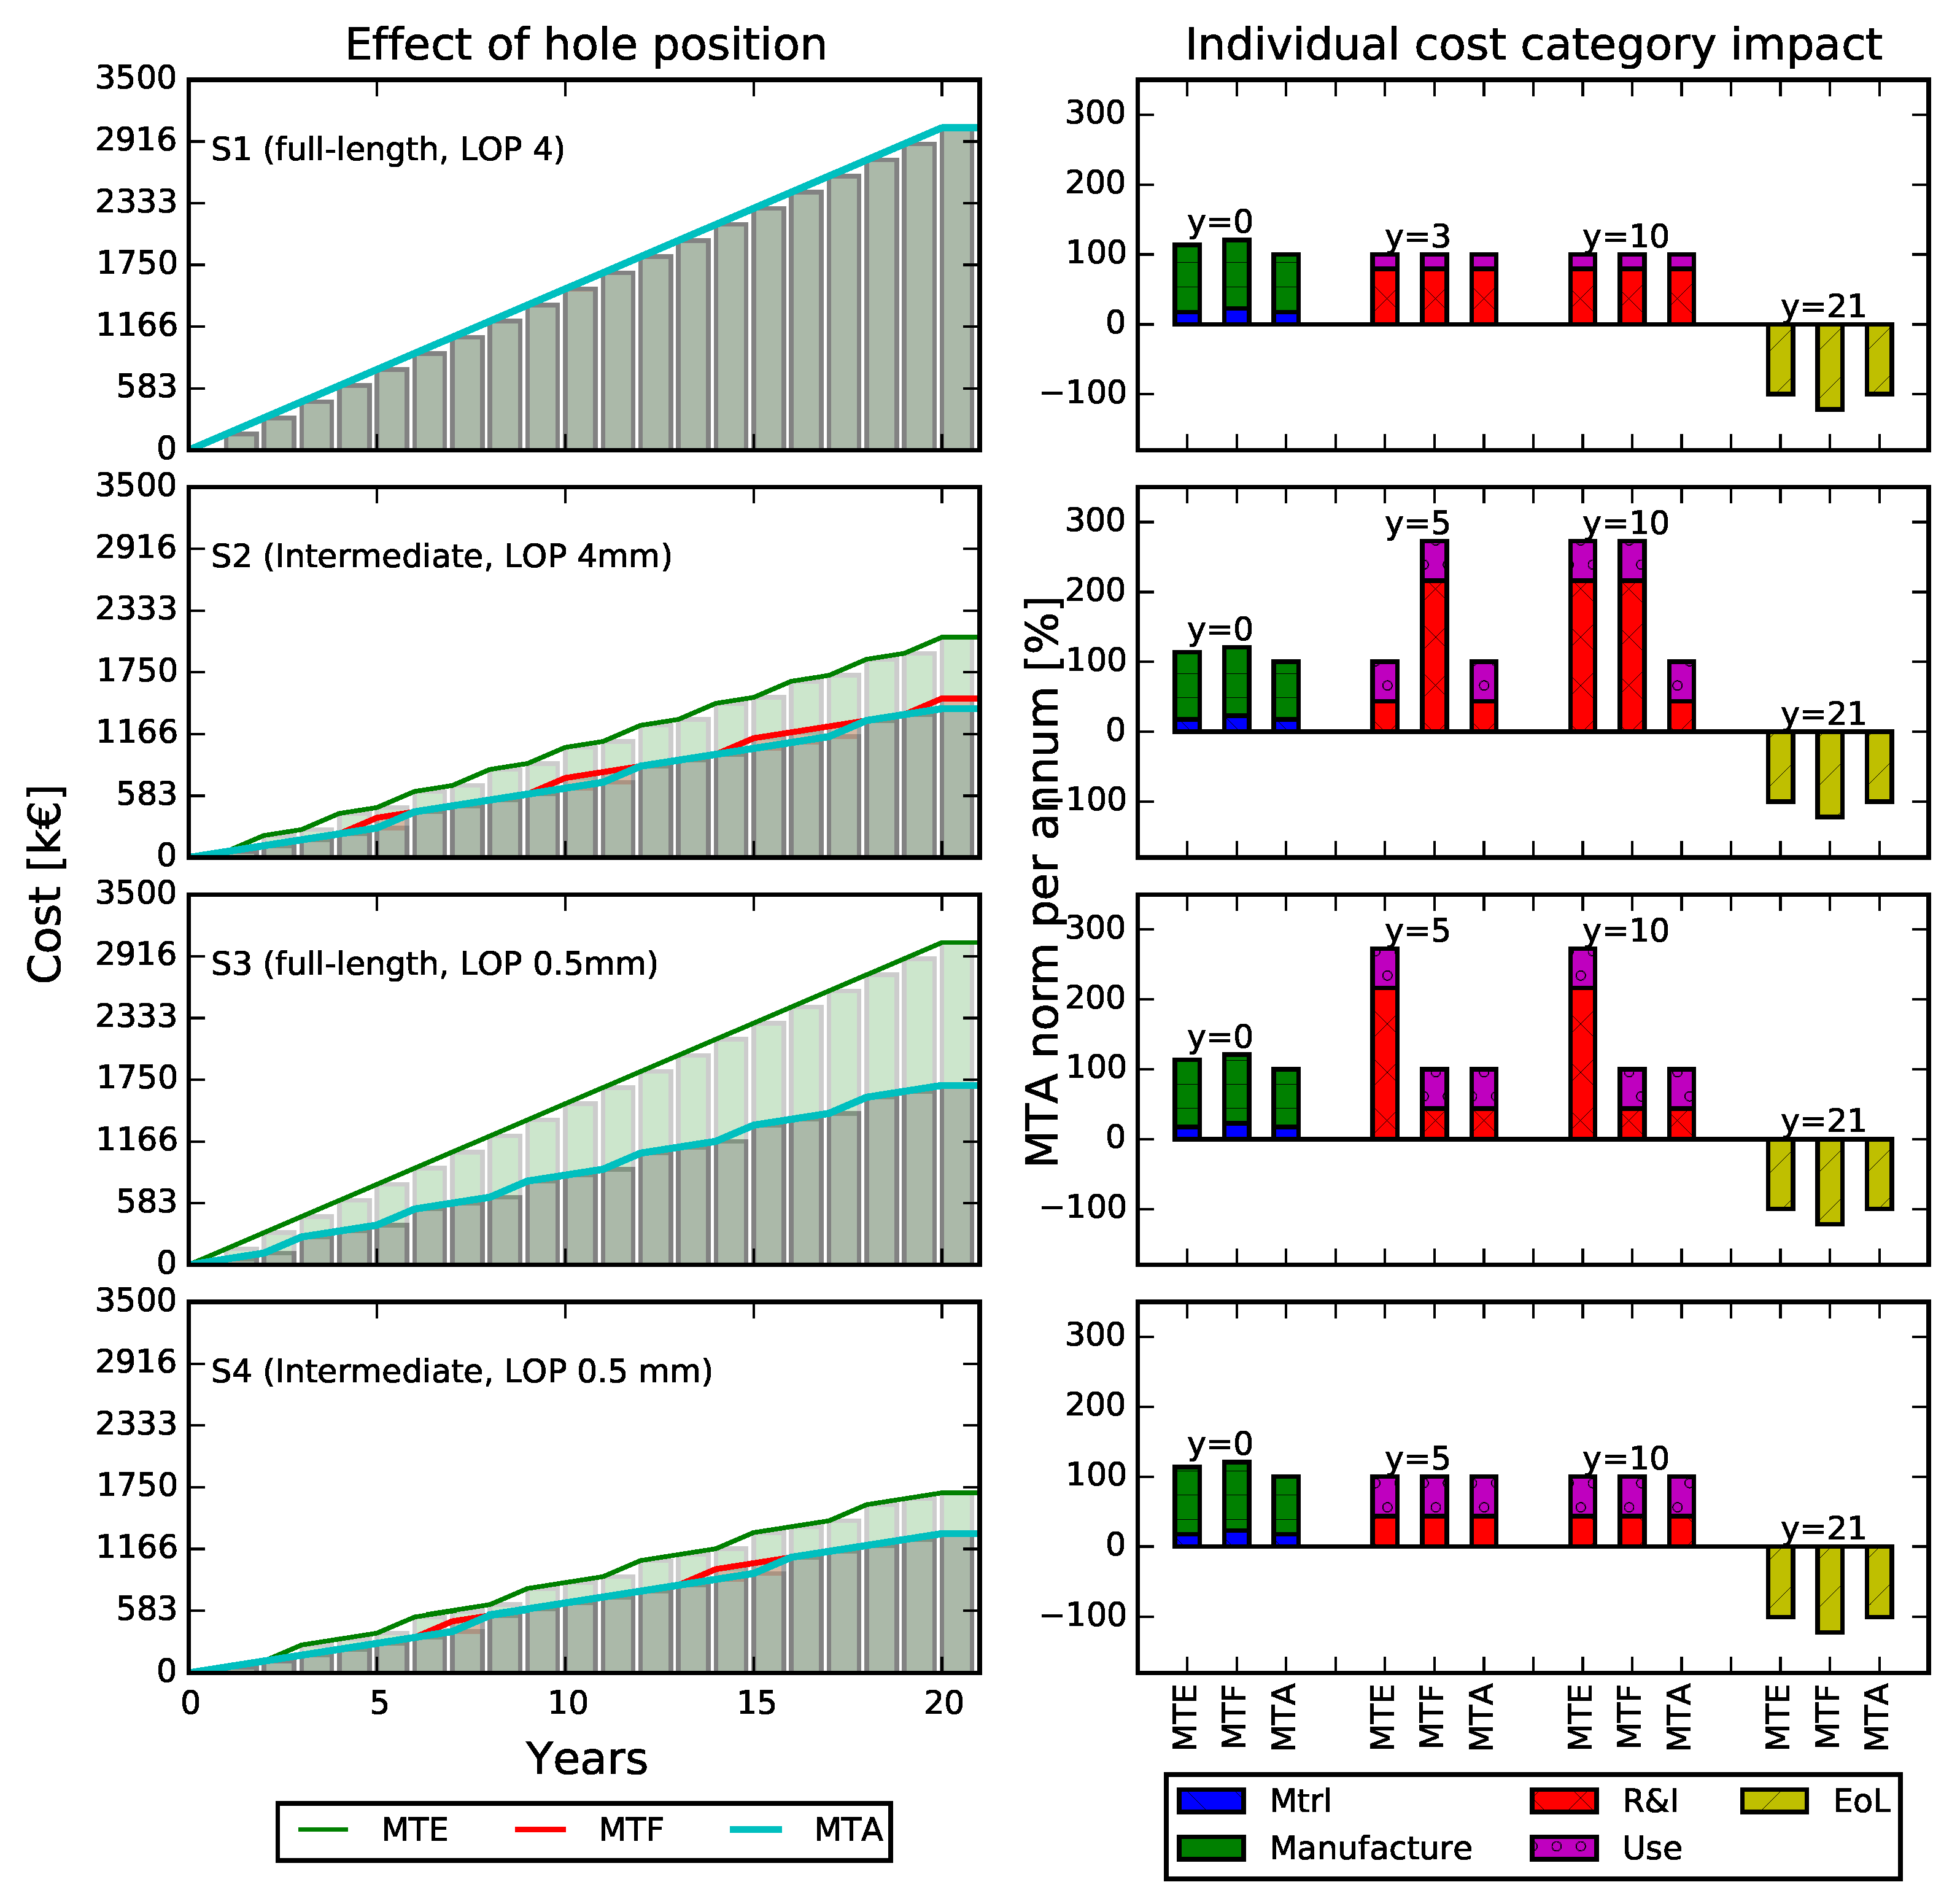
8.1. PLCC as a Function of Flange Plate Thickness, Web Plate Thickness and Hole Position
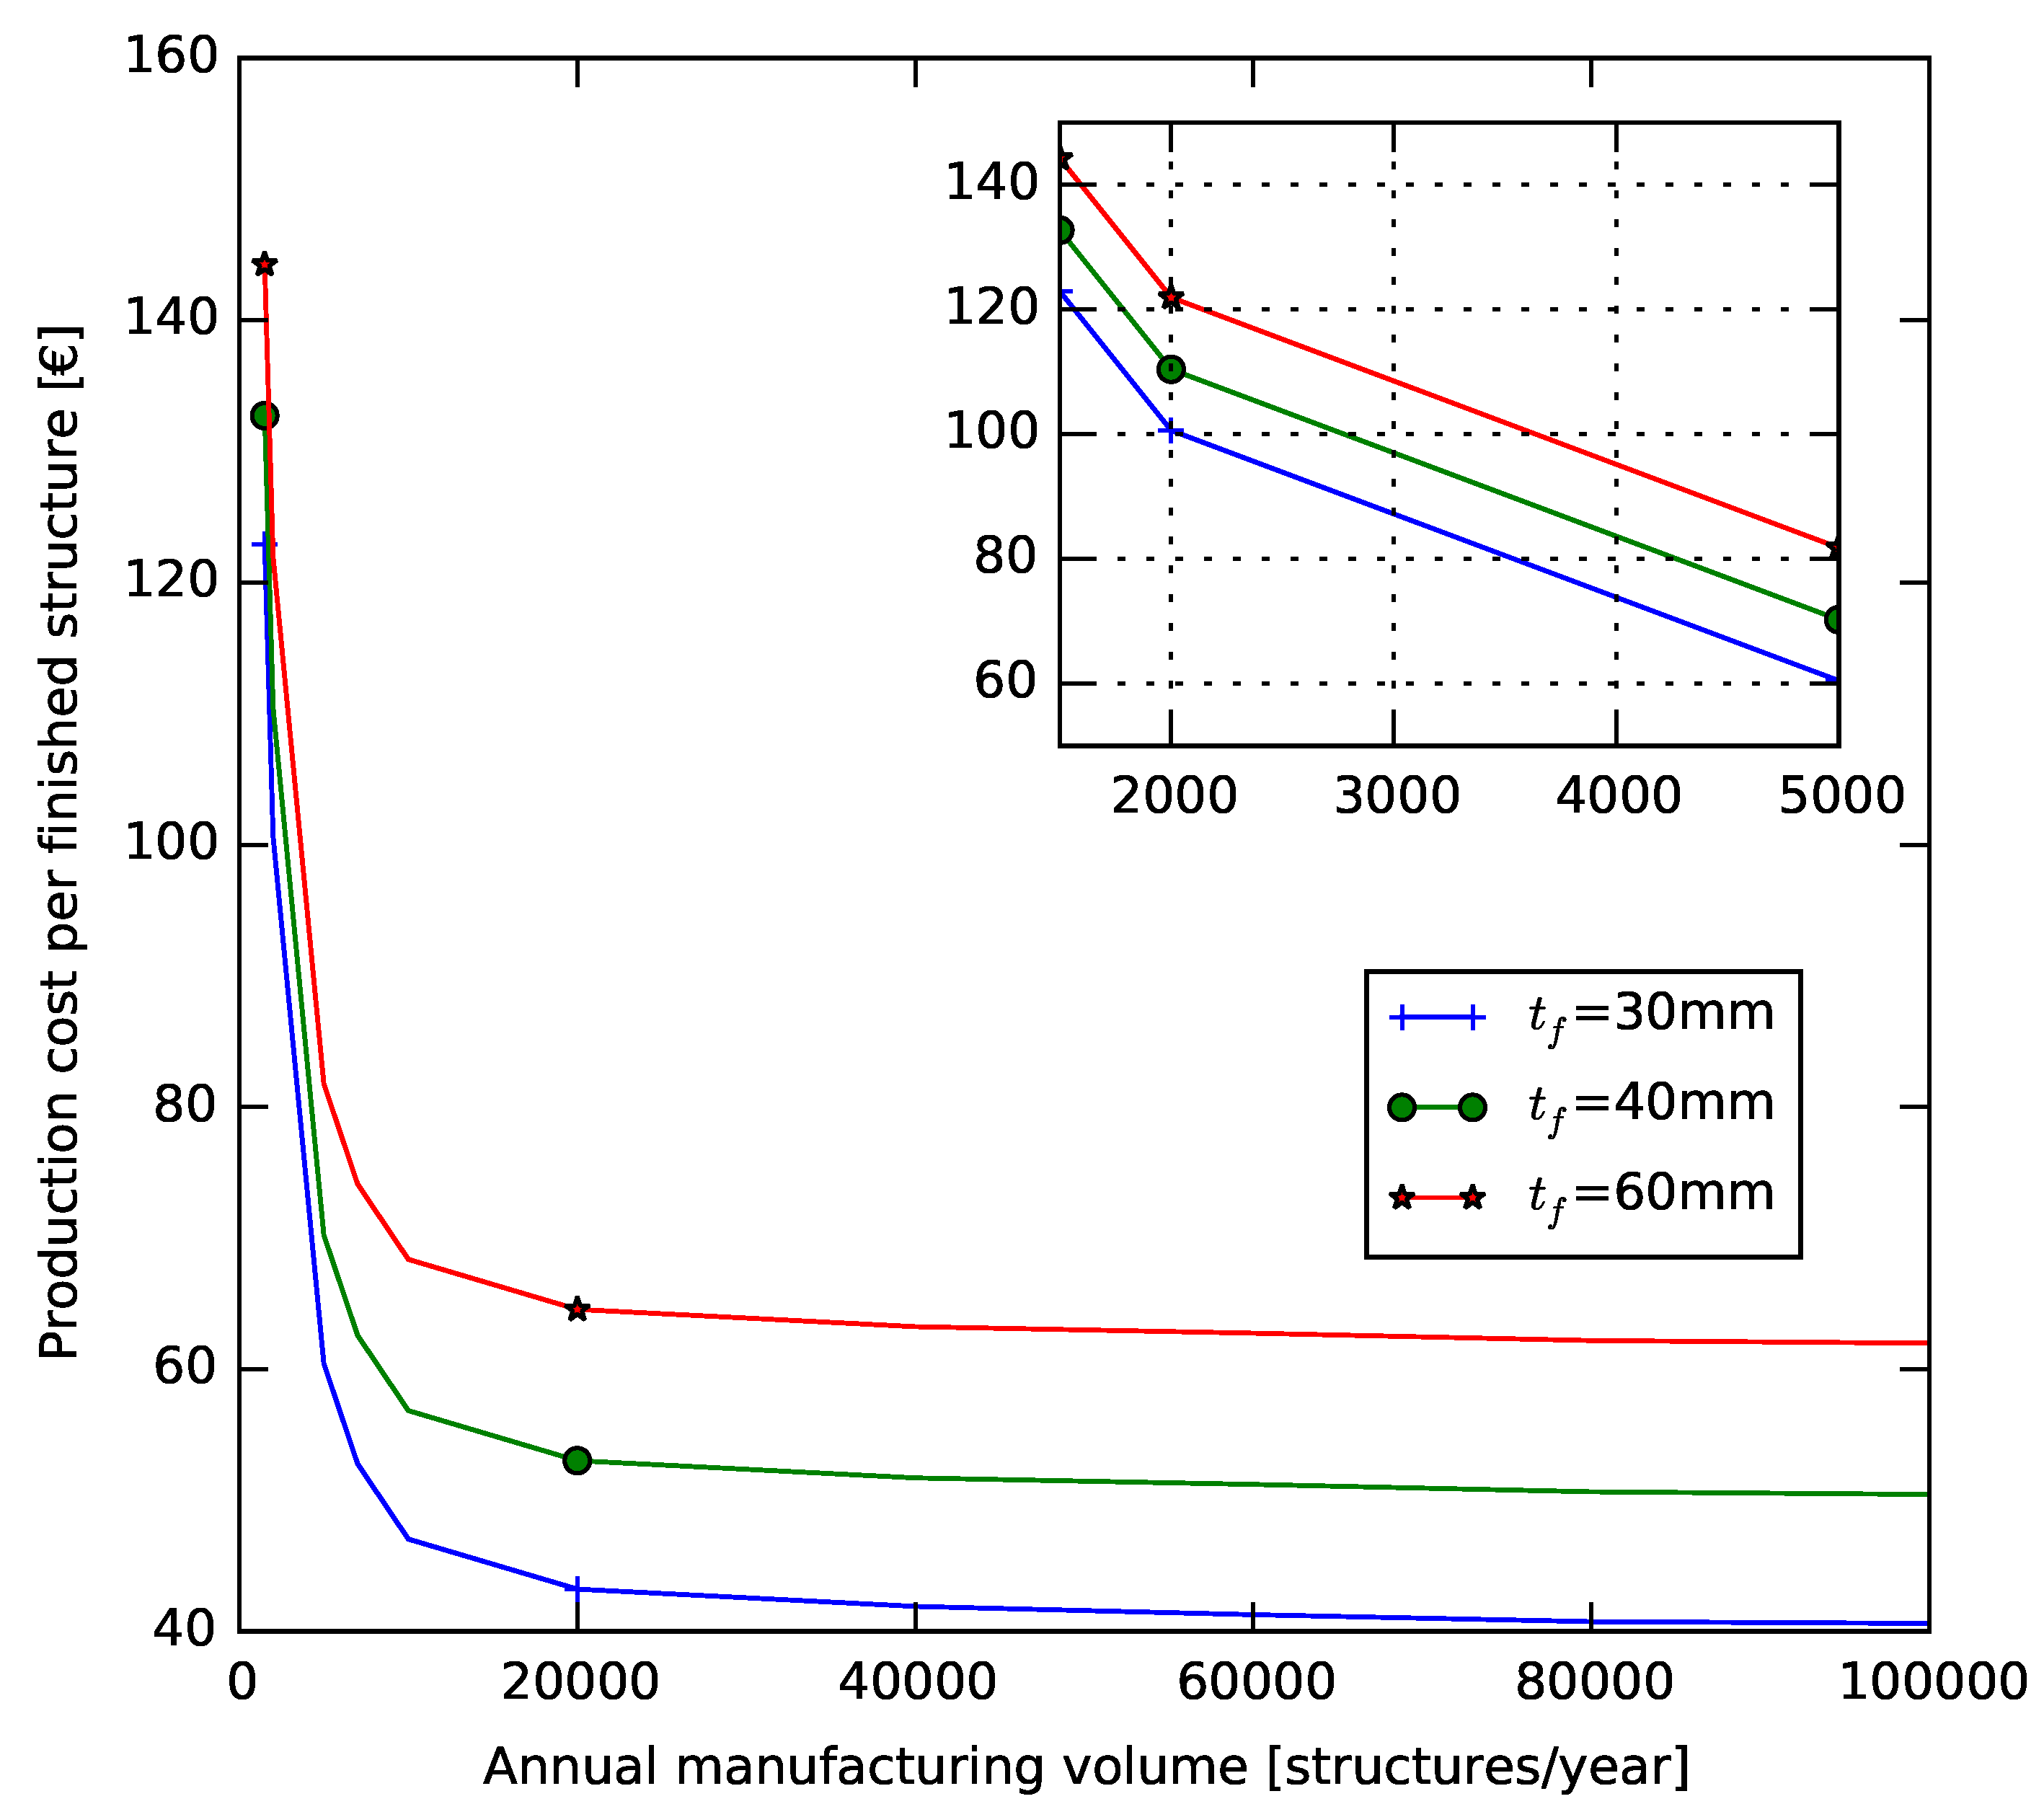
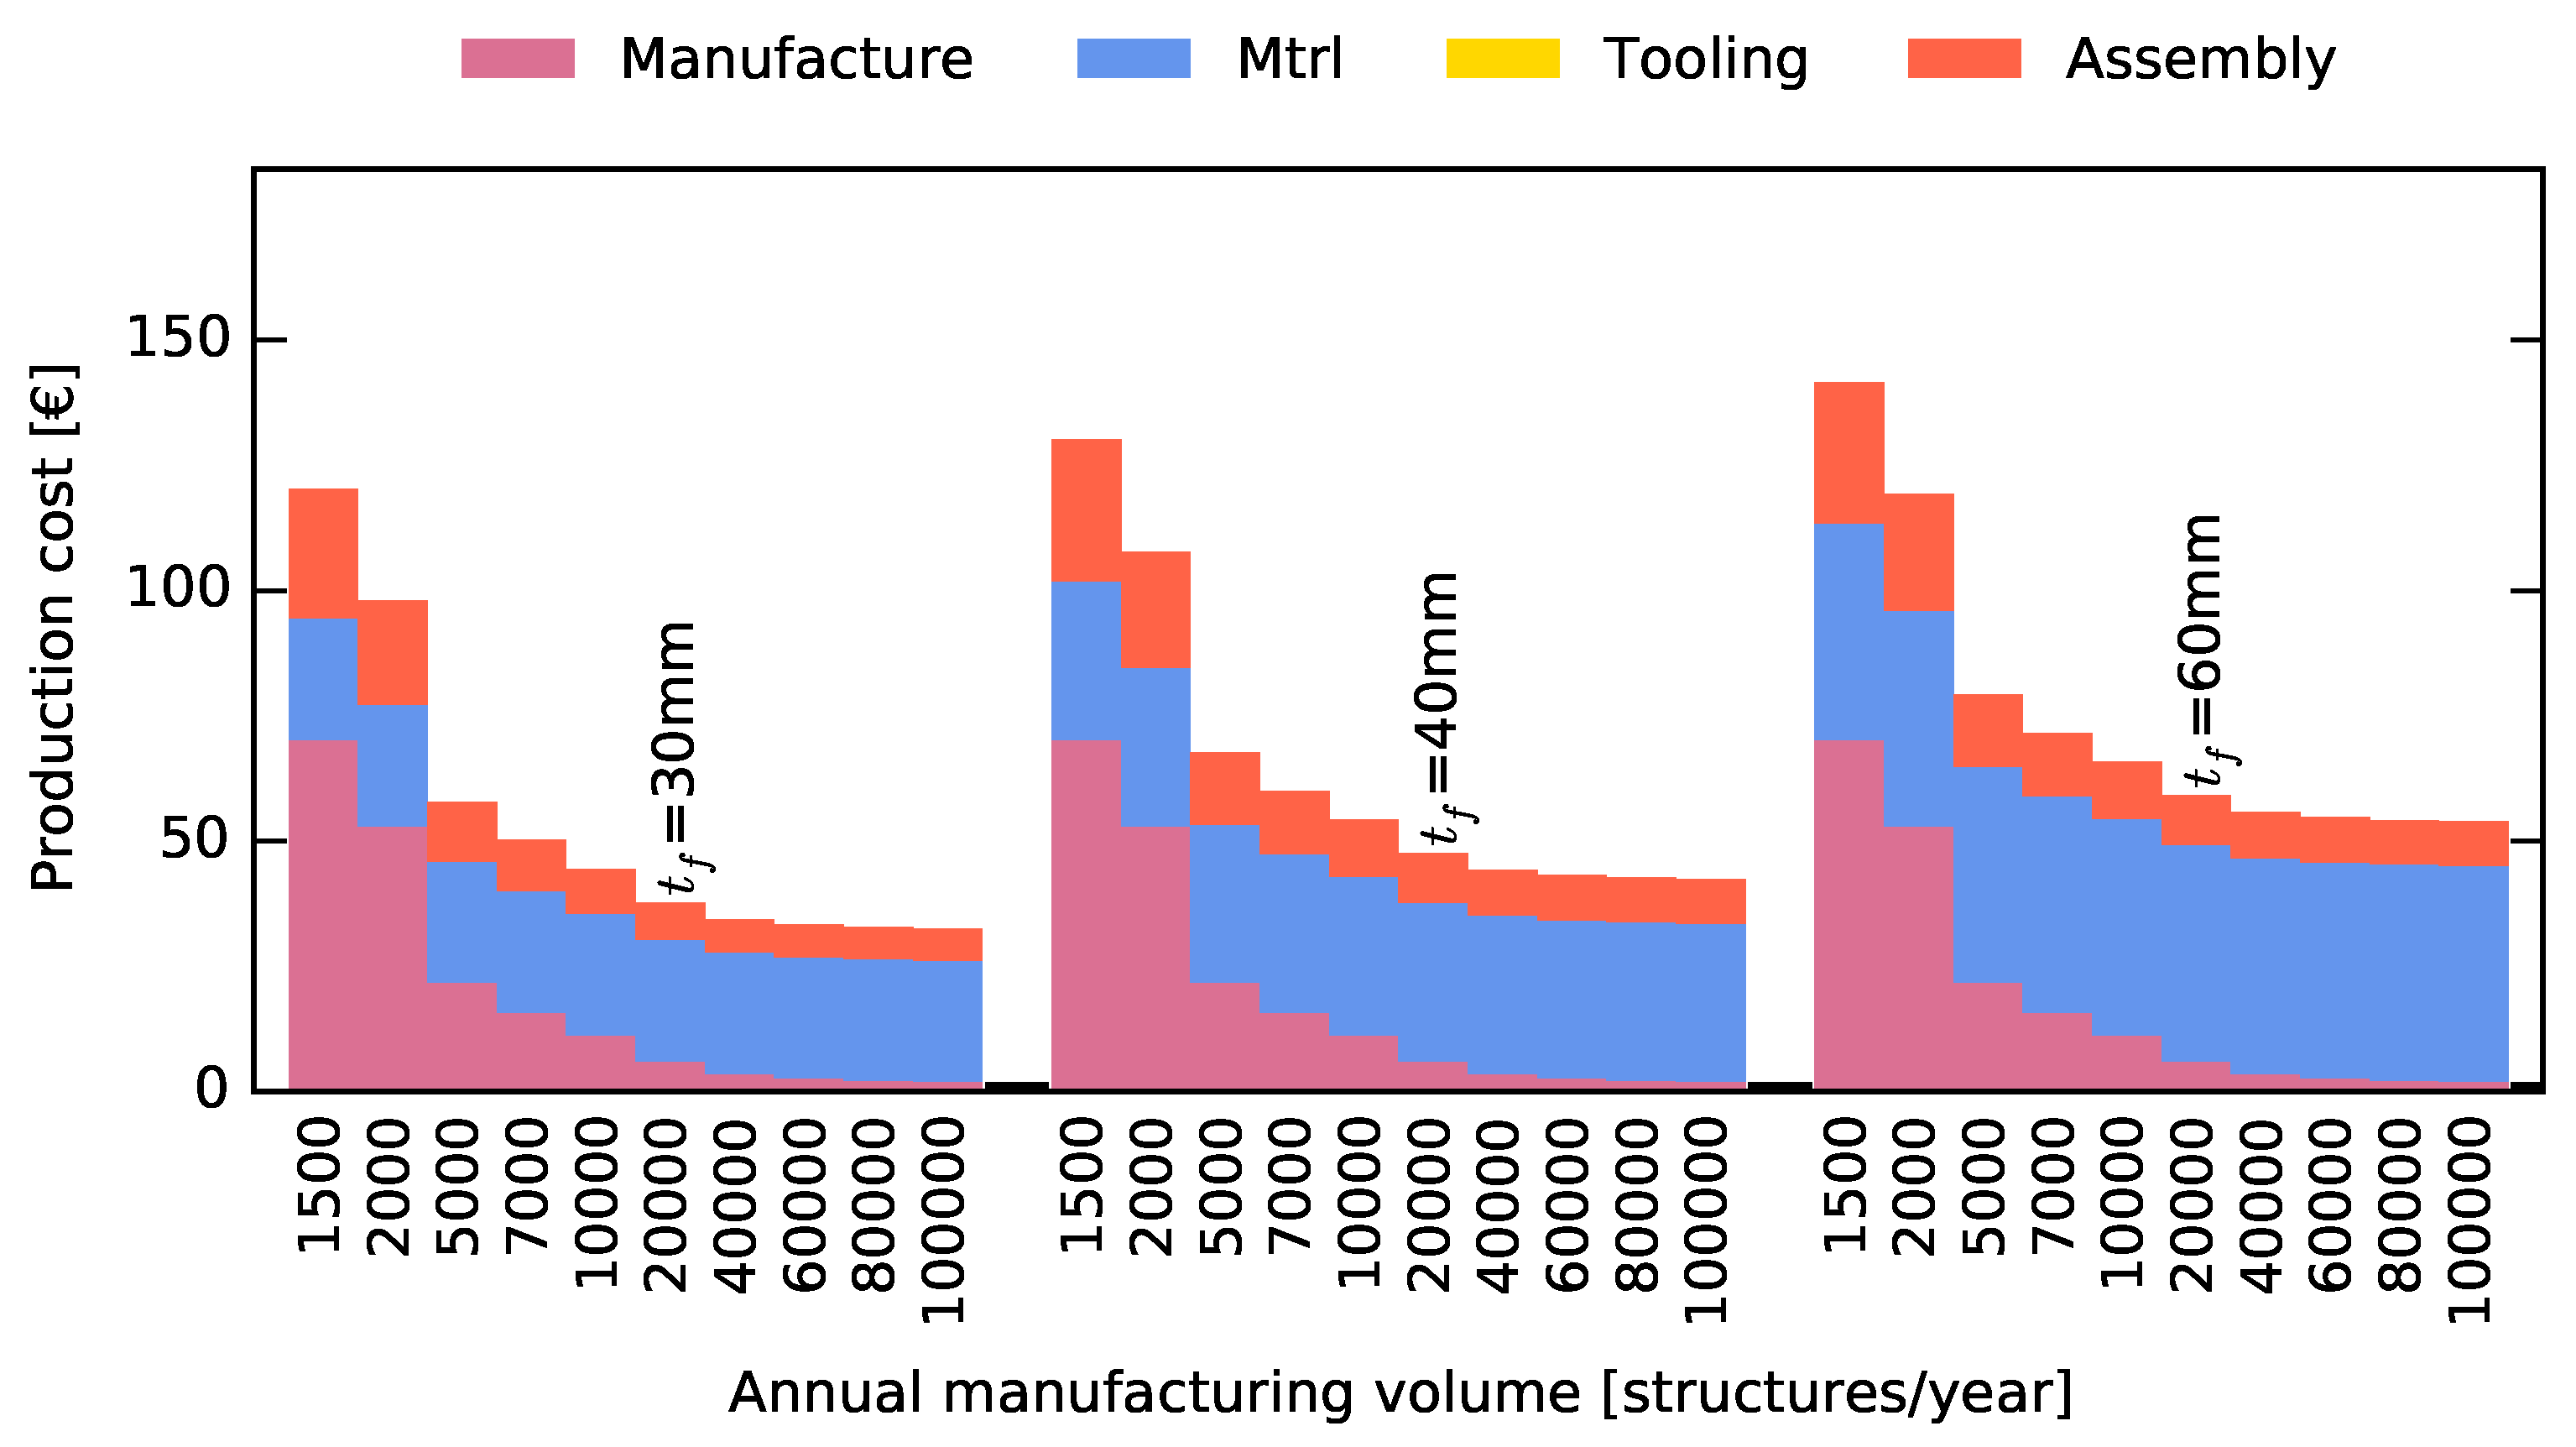
Production Cost
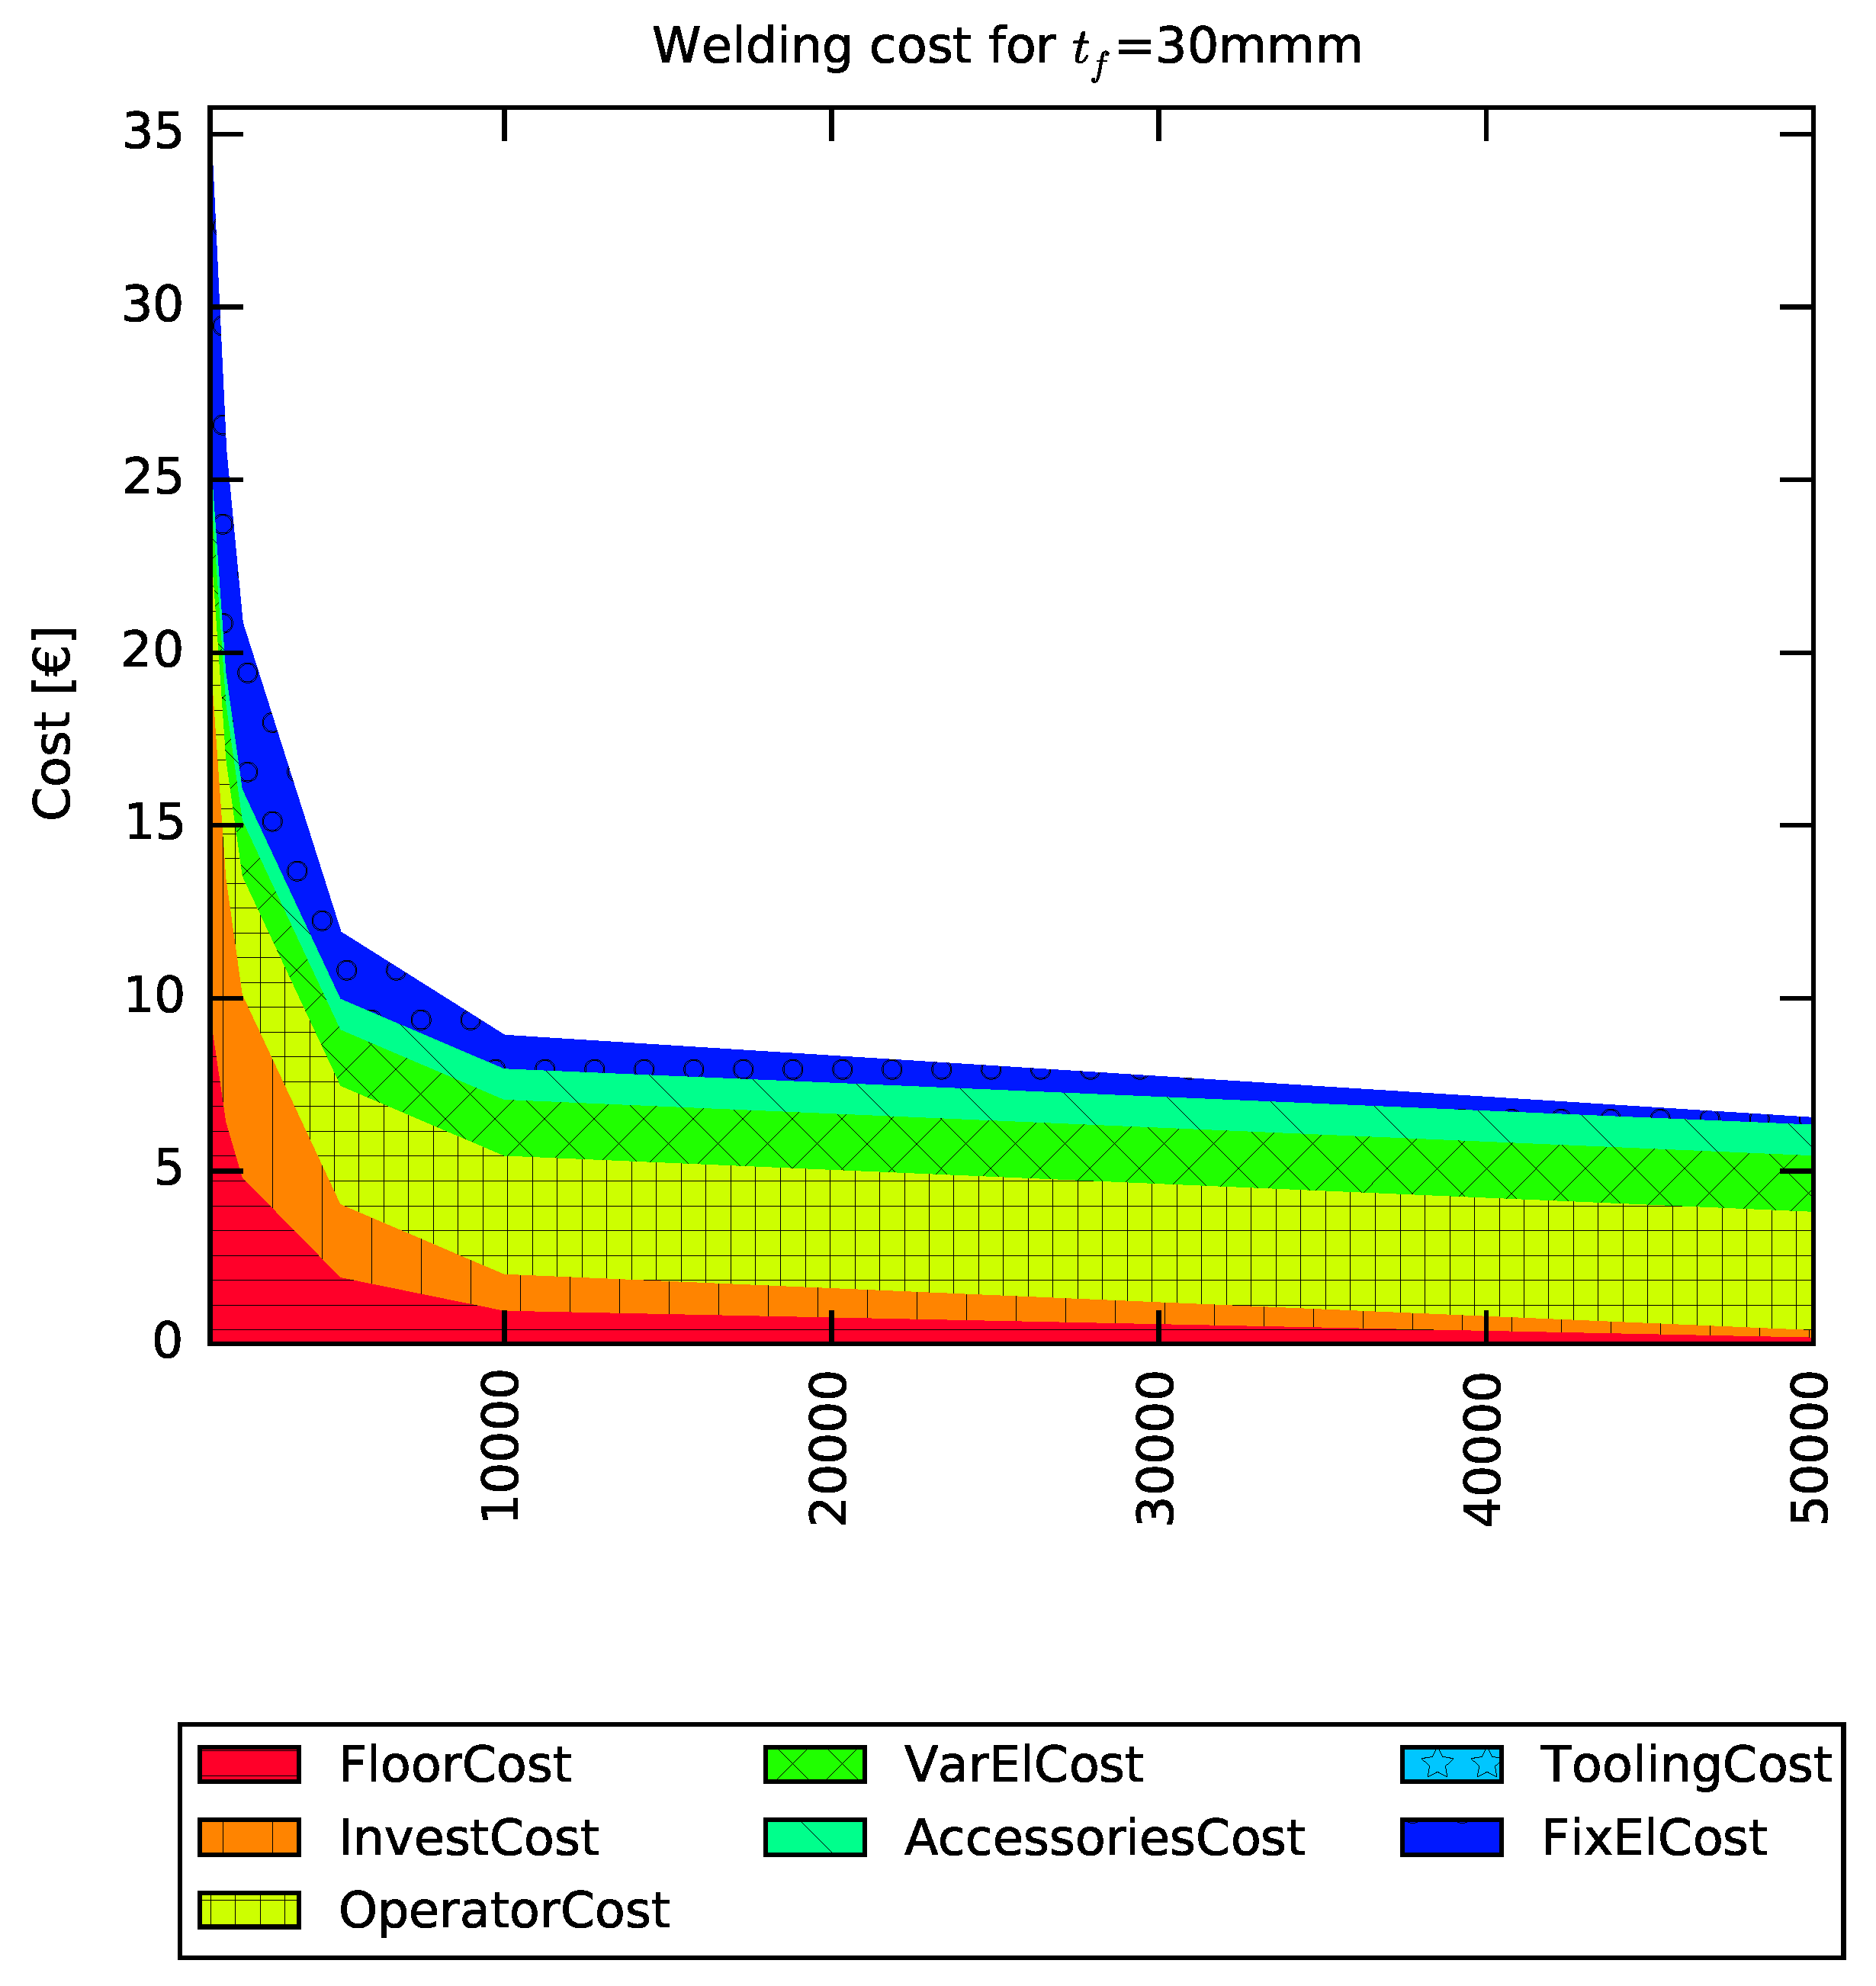
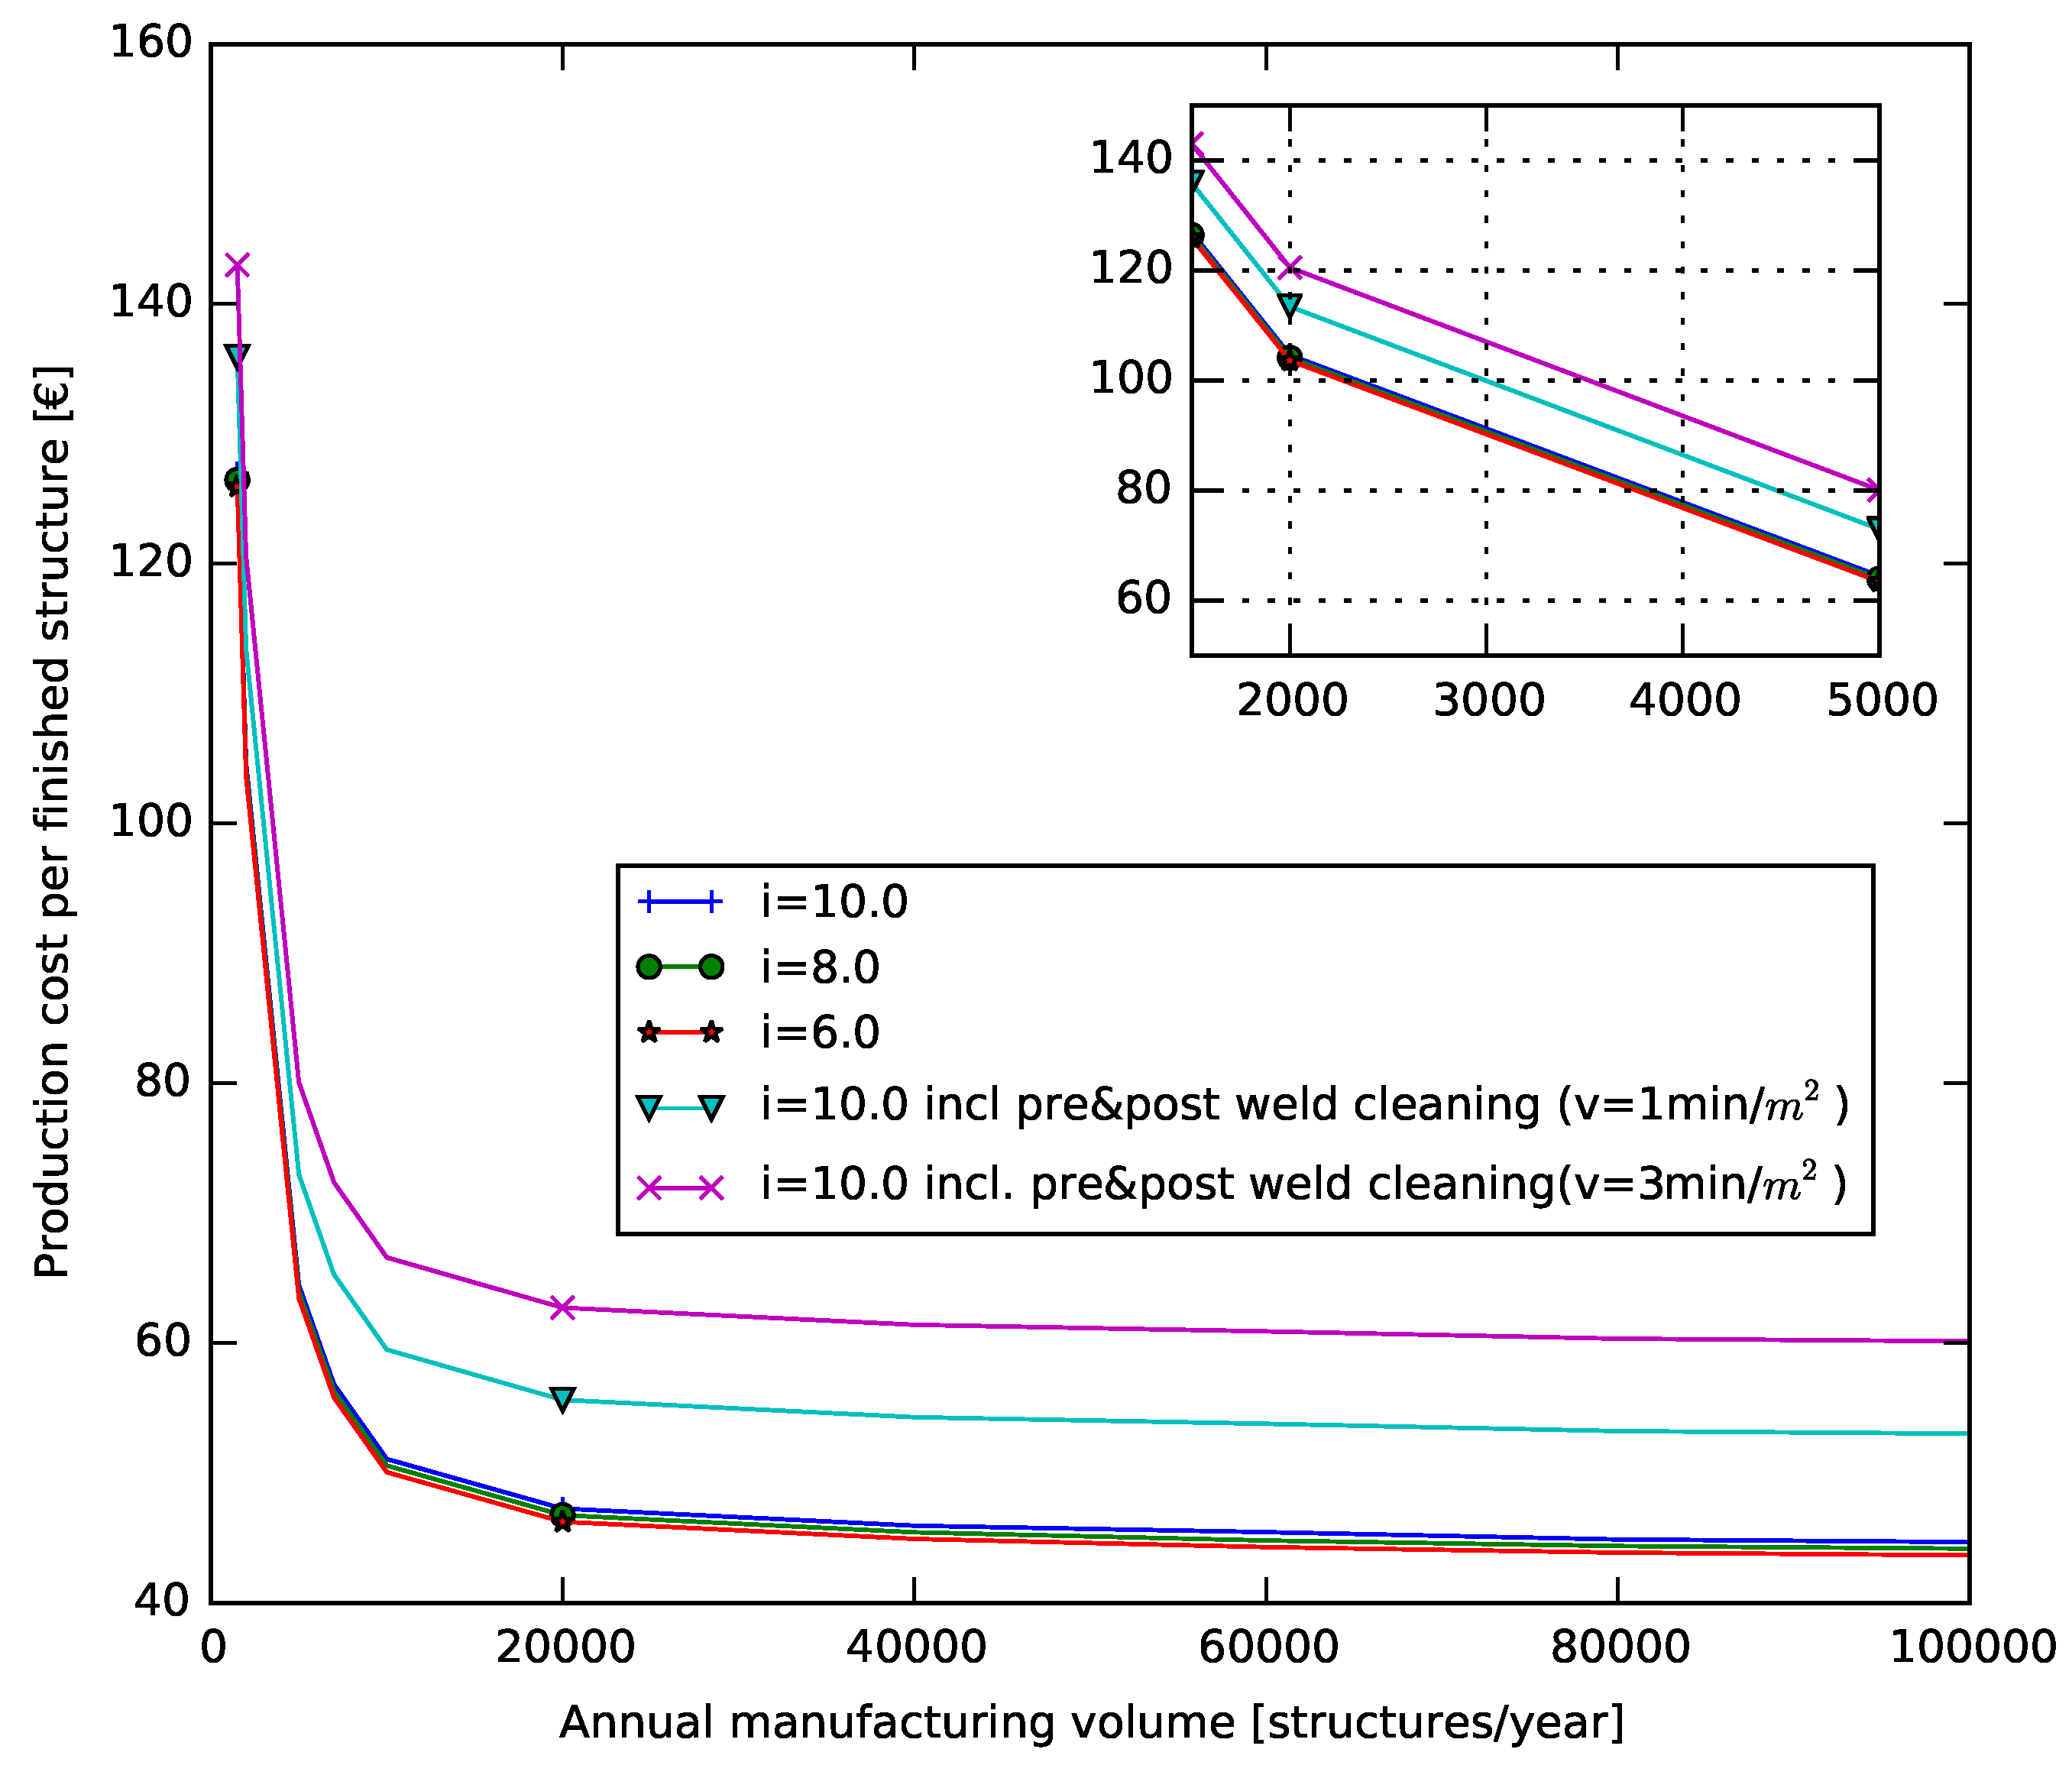
8.2. The Impact of Penetration Depth on Production Cost
9. Discussion
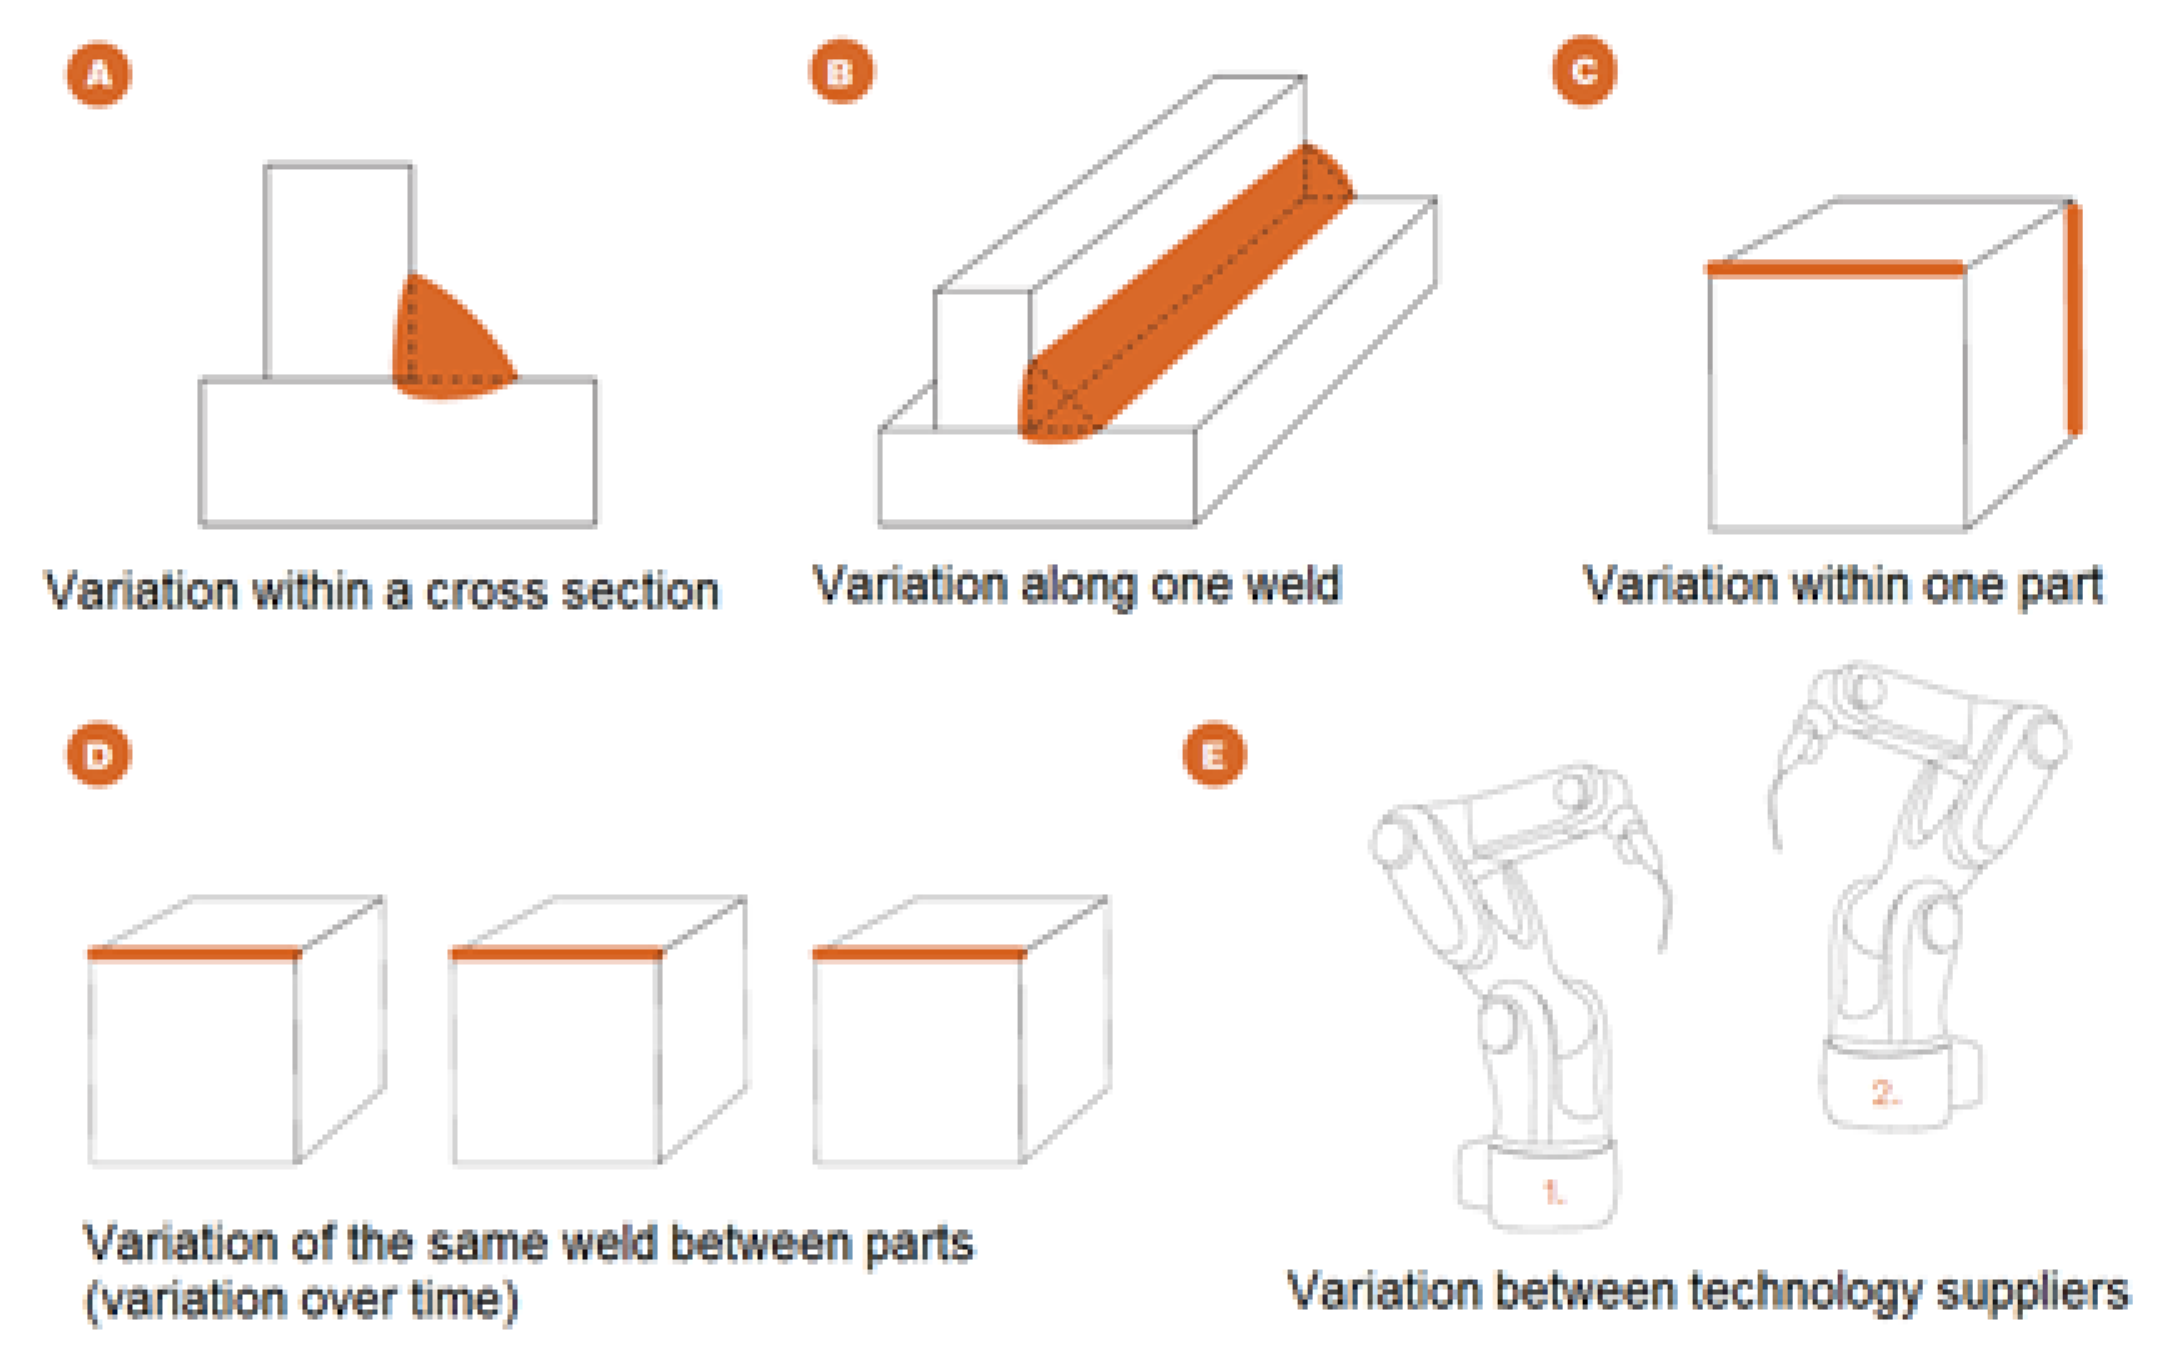
View of Variation
10. Conclusions
- Welding and production costs are negligible in relation to re-occurring repair costs for all considered design cases and fatigue scenarios.
- Repair and maintenance costs outweighs that of operational costs for the more severe fatigue scenarios considered.
- Increased flange plate thicknesses is the most effective means to reduce overall lifecycle costs, as it can increase the intervals between repairs significantly. Ultimately, increased flange plate thicknesses can result in lifecycle cost reductions of up to 60% (or about 1.75 M€) and fully compensate for hole position variations considered.
Author Contributions
Funding
Institutional Review Board Statement
Informed Consent Statement
Data Availability Statement
Conflicts of Interest
References
- Öberg, A.E.; Åstrand, E. Improved productivity by reduced variation in gas metal arc welding (GMAW). Int. J. Adv. Manuf. Technol. 2017, 92, 1027–1038. [Google Scholar] [CrossRef] [Green Version]
- Hobbacher, A. Recommendations for Fatigue Design of Welded Joints and Components, 2nd ed.; IIW Collection; Springer: Berlin/Heidelberg, Germany, 2016. [Google Scholar] [CrossRef]
- Radaj, C.D.; Fricke, W. Fatigue Assessment of Welded Joints by Local Approaches, 2nd ed.; Woodhead Publishing Limited: Sawston, UK, 2006. [Google Scholar]
- Fricke, W. IIW guideline for the assessment of weld root fatigue. Weld. World 2020, 57, 753–791. [Google Scholar] [CrossRef]
- Frank, K.H.; Fisher, J.W. Fatigue strength of fillet welded cruciform joints. J. Struct. Div. 1979, 105, 1727–1740. [Google Scholar] [CrossRef]
- Guha, B. A new fracture mechanics method to predict the fatigue life of welded cruciform joints. Eng. Fract. Mech. 1995, 52, 215–229. [Google Scholar] [CrossRef]
- Marquis, G.B.; Barsoum, Z. IIW Recommendations for the HFMI Treatment For Improving the Fatigue Strength of Welded Joints; Springer: Singapore, 2016; ISBN 978-981-10-2503-7. [Google Scholar]
- Aldén, R.; Barsoum, Z.; Vouristo, T.; Al-Emrani, M. Robustness and effect of weld quality on the fatigue life improvement of welded joints using HFMI techniques. Weld World 2020, 64, 1947–1956. [Google Scholar] [CrossRef]
- Yekta, R.T.; Ghahremani, K.; Walbridge, S. Effect of quality control parameter variations on the fatigue performance of ultrasonic impact treated welds. Int. J. Fatigue 2013, 55, 245–256. [Google Scholar] [CrossRef]
- Silva, F.J.G.; Pinho, A.P.; Pereira, A.B.; Paiva, O.C. Evaluation of Welded Joints in P91 Steel under Different Heat-Treatment Conditions. Metals 2020, 10, 99. [Google Scholar] [CrossRef] [Green Version]
- Sousa, V.F.C.; Silva, F.J.G.; Pinho, A.P.; Pereira, A.B.; Paiva,, O.C. Enhancing Heat Treatment Conditions of Joints in Grade P91 Steel: Looking for More Sustainable Solutions. Metals 2021, 11, 495. [Google Scholar] [CrossRef]
- Hagnell, M.K.; Åkermo, M. Cost efficiency, integration and assembly of a generic composite aeronautical wing box. Compos. Struct. 2016, 152, 1014–1023. [Google Scholar] [CrossRef]
- Rybicka, J.; Purse, T.; Parlour, B. A Generic Cost Estimating Approach for a Composite Manufacturing Process Assessment. Adv. Manuf. Technol. XXXIV 2021. [Google Scholar] [CrossRef]
- Tierney, C.; Higgins, C.; Quinn, D.; Backer, J.D.; Allen, C.; Örtnäs, A.; Persson, J.; McClelland, J.; Higgins, P.; Murphy, A. A scalable cost modelling architecture for evaluating the production cost-effectiveness of novel joining techniques for aircraft structures. Procedia Manuf. 2021, 54, 7–12. [Google Scholar] [CrossRef]
- Bouchouireb, H.; O’Reilly, C.J.; Göransson, P.; Schöggl, J.P.; Baumgartner, R.J.; Potting, J. Towards Holistic Energy-Efficient Vehicle Product System Design: The Case for a Penalized Continuous End-of-Life Model in the Life Cycle Energy Optimisation Methodology. Proc. Des. Soc. Int. Conf. Eng. Des. 2019, 1, 2901–2910. [Google Scholar] [CrossRef] [Green Version]
- Poulikidou, S.; Schneider, C.; Björklund, A.; Kazemahvazi, S.; Wennhage, P.; Zenkert, D. A material selection approach to evaluate material substitution for minimizing the life cycle environmental impact of vehicles. Mater. Des. 2015, 83, 704–712. [Google Scholar] [CrossRef] [Green Version]
- Penadés-Plà, V.; García-Segura, T.; Martí, J.V.; Yepes, V. An Optimization-LCA of a Prestressed Concrete Precast Bridge. Sustainability 2018, 10, 685. [Google Scholar] [CrossRef] [Green Version]
- Lee, K.M.; Cho, H.N.; Choi, Y.M. Life-cycle cost-effective optimum design of steel bridges. J. Constr. Steel Res. 2004, 60, 1585–1613. [Google Scholar] [CrossRef]
- Zou, G.; Banisoleiman, K.; González, A. Probabilistic maintenance optimization for fatigue-critical components with constraint in repair access and logistics. In Proceedings of the 14th International Conference on Probabilistic Safety Assessment and Management (PSAM 14), Los Angeles, CA, USA, 16–21 September 2018. [Google Scholar]
- Kim, S.; Frangopol, D.M.; Soliman, M. Generalized Probabilistic Framework for Optimum Inspection and Maintenance Planning. J. Struct. Eng. 2013, 139, 435–447. [Google Scholar] [CrossRef]
- Kim, S.; Ge, B.; Frangopol, D.M. Effective optimum maintenance planning with updating based on inspection information for fatigue-sensitive structures. Probabilistic Eng. Mech. 2019, 58, 103003. [Google Scholar] [CrossRef]
- Turan, O.; Ölçer, A.İ.; Lazakis, I.; Rigo, P.; Caprace, J.D. Maintenance/repair and production-oriented life cycle cost/earning model for ship structural optimisation during conceptual design stage. Ships Offshore Struct. 2009, 4, 107–125. [Google Scholar] [CrossRef] [Green Version]
- Hagnell, M.K.; Åkermo, M. A composite cost model for the aeronautical industry: Methodology and case study. Compos. Part B Eng. 2015, 79, 254–261. [Google Scholar] [CrossRef]
- Öberg, A.E. VariLight Reduced VARIation in the manufacturing processes enabling LIGHTweight welded structures, public report. Fordonsstrategisk Forsk. Och Innov. 2019. [Google Scholar]
- Broadbent, C. Steel’s recyclability: Demonstrating the benefits of recycling steel to achieve a circular economy. Int. J. Life Cycle Assess 2016, 21, 1658–1665. [Google Scholar] [CrossRef] [Green Version]
- Worrel, E.; Reuter, M.A. (Eds.) Handbook of Recycling; Elsevier: Amsterdam, The Netherlands, 2014. [Google Scholar]
- Harvey, L.D.D. Iron and steel recycling: Review, conceptual model, irreducible mining requirements, and energy implications. Renew. Sustain. Energy Rev. 2021, 138, 110553. [Google Scholar] [CrossRef]
- Hagnell, M.K. Technical Cost Modelling and Efficient Design of Lightweight Composites in Structural Applications. Ph.D. Thesis, KTH Royal Institute of Technology, Stockholm, Sweden, 2019. [Google Scholar]
- Foundation, P.S. Python Language Reference, Version 2.7. Available online: http://www.python.org (accessed on 31 March 2021).
- Coromant, S. Milling Formulas and Definitions. Available online: https://www.sandvik.coromant.com/en-gb/knowledge/machining-formulas-definitions/pages/milling.aspx (accessed on 31 March 2021).
- SSAB. Machining Recommendations for Strenx®. Available online: https://www.ssab.com/support/processing#downloads (accessed on 24 September 2021).
- Weman, K. Welding Processes Handbook, 2nd ed.; Woodhead Publishing: Sawston, UK, 2012. [Google Scholar]
- Jarmai, K.; Farkas, J. Cost calculation and optimisation of welded steel structures. J. Constr. Steel Res. 1999, 50, 115–135. [Google Scholar] [CrossRef]
- Zhu, J.; Khurshid, M.; Barsoum, Z. Accuracy of computational welding mechanics methods for estimation of angular distortion and residual stresses. Weld. World 2019, 63, 1391–1405. [Google Scholar] [CrossRef] [Green Version]
- MEPS International Ltd. World Steel Prices. Available online: https://worldsteelprices.com/;https://www.meps.co.uk/gb/en/products/europe-steel-prices (accessed on 31 March 2021).
- London Metal Exchange (LME). Metal Prices. Available online: https://www.lme.com/ (accessed on 31 March 2021).
- Maes, J. Make It from Metal. Available online: https://makeitfrommetal.com/how-much-does-a-cnc-machine-cost/ (accessed on 31 March 2021).
- EWM AG. Welding Machines. Available online: https://www.ewm-sales.com/ (accessed on 31 March 2021).
- The Indiana Oxygen Company. Welding Supplies from Ioc. Available online: https://www.weldingsuppliesfromioc.com/ (accessed on 31 March 2021).
- BS7608. Guide to Fatigue Design and Assessment of Steel Products, 2014–2015, 2nd ed.; BSI Standards: London, UK, 2015. [Google Scholar]
- EN1993-1-9. Eurocode 3: Design of STEEL structures—Part 1–9: Fatigue, 2003; BSI Standards: London, UK, 2003. [Google Scholar]
- EN13001. Cranes—General design—Part 1: General Principles and Requirements, 2015; BSI Standards: London, UK, 2015. [Google Scholar]
- Pettersson, G.; Barsoum, Z. Finite element analysis and fatigue design of a welded construction machinery component using different approaches. Eng. Fail. Anal. 2012, 26, 274–284. [Google Scholar] [CrossRef]
- Hultgren, G.; Khurshid, M.; Haglund, P.; Barsoum, Z. Mapping of scatter in fatigue life assessment of welded structures—A round robin study. Weld. World 2021, 65, 1841–1855. [Google Scholar] [CrossRef]
- Delkhosh, E.; Khurshid, M.; Barsoum, I.; Barsoum, Z. Fracture mechanics and fatigue life assessment of box-shaped welded structures: FEM analysis and parametric design. Weld. World 2020, 64, 1535–1551. [Google Scholar] [CrossRef]
- Zhu, J.; Khurshid, M.; Barsoum, Z. Assessment of computational weld mechanics concepts for estimation of residual stresses in welded box structures. Procedia Struct. Integr. 2019, 17, 704–711. [Google Scholar] [CrossRef]
- Kaltenbach. The Scrap Calculation in a CNC Plate Processing Line. Available online: https://www.kaltenbach.com/en/media/talking-steel/the-scrap-calculation-in-a-cnc-plate-processing-line/ (accessed on 31 March 2021).
- Eurostat. Hourly Labour Costs. Available online: https://ec.europa.eu/eurostat/statistics-explained/index.php?title=Hourly_labour_costs (accessed on 20 September 2021).
- The World Bank. Available online: https://www.worldbank.org/ (accessed on 31 March 2021).
- Haglund, M.K.P.; Barsoum, Z. Mapping of scatter in fatigue life assessment of welded structures—A Round Robin Study. In Proceedings of the IIW Annual Assembly and International Conference, Bratislava, Slovakia, 7–12 July 2019. [Google Scholar]
- Acculift. Demystifying The Duty Cycle of a Hoist. Available online: https://acculift.com/demystifying-the-duty-cycle-of-a-hoist/ (accessed on 20 September 2021).
- Eurostat. Electricity Price Statistics. Available online: https://ec.europa.eu/eurostat/statistics-explained/index.php?title=Electricity_price_statistics (accessed on 20 September 2021).
- Occupational Safety and Health Administration (OSHA). 1910.179—Overhead and Gantry Cranes. Available online: https://www.osha.gov/laws-regs/regulations/standardnumber/1910/1910.179 (accessed on 31 March 2021).
- European Commission Competition. Terminal Handling Charges during and after the Liner Conference Era. Available online: https://ec.europa.eu/competition/sectors/transport/reports/terminal_handling_charges.pdf (accessed on 31 March 2021).
- Container News. ZIM Updates THC/THD Rates. Available online: https://container-news.com/zim-updates-thc-thd-rates/ (accessed on 31 March 2021).
- Mazzella Companies. Lifting & Rigging Learning Center. Available online: https://www.mazzellacompanies.com/Resources/Blog/how-much-does-an-overhead-crane-inspection-cost (accessed on 20 September 2021).
- Free Encyclopedia for UK Steel Construction Information. Recycling and Reuse. Available online: https://www.steelconstruction.info/Recycling_and_reuse (accessed on 3 March 2021).


| Specimen Group | Case ID | Flange Thickness [mm] | Web Thickness [mm] | Loading Mode |
|---|---|---|---|---|
| Reference case | MTA | 30 | 10 | Centric |
| Varied | MTB | 40 | 10 | Centric |
| MTC | 60 | 10 | Centric | |
| Varied | MTD | 30 | 8 | Centric |
| Varied hole position | MTE | 30 | 10 | Eccentric |
| MTF | 40 | 10 | Eccentric |
| Scenario ID | Description | LOP [mm] |
|---|---|---|
| S1 | Full-length crack, partial penetration | 4 |
| S2 | Intermediate crack (width = 40 mm), partial penetration | 4 |
| S3 | Full-length crack, full penetration | 0.5 |
| S4 | Intermediate crack (width = 40 mm), full penetration | 0.5 |
| Fatigue Scenario | MTA | MTB | MTC | MTD | MTE | MTF |
|---|---|---|---|---|---|---|
| S1 | 102,841 | 287,933 | 1,103,500 | 67,768 | 33,366 | 96,467 |
| S2 | 589,198 | 1,538,700 | 5,486,300 | 458,650 | 182,450 | 517,390 |
| S3 | 311,108 | 925,034 | Infinite | 275,370 | 102,480 | 304,010 |
| S4 | 838,979 | 2,265,700 | Infinite | 664,850 | 255,420 | 731,070 |
| Steel Type | Density [kg/m] | Cost [€/kg] | Scrap Rate [%] |
|---|---|---|---|
| Cold rolled, quenched and tempered, HSS plate | 7850 | 0.7 | 26 |
| Hot rolled HSS plate | 7850 | 0.65 | 6 |
| Filler Material | [€/kg] |
|---|---|
| ER 70S-6 | 5.3 |
Publisher’s Note: MDPI stays neutral with regard to jurisdictional claims in published maps and institutional affiliations. |
© 2021 by the authors. Licensee MDPI, Basel, Switzerland. This article is an open access article distributed under the terms and conditions of the Creative Commons Attribution (CC BY) license (https://creativecommons.org/licenses/by/4.0/).
Share and Cite
Hagnell, M.K.; Khurshid, M.; Åkermo, M.; Barsoum, Z. Design Implications and Opportunities of Considering Fatigue Strength, Manufacturing Variations and Predictive LCC in Welds. Metals 2021, 11, 1527. https://doi.org/10.3390/met11101527
Hagnell MK, Khurshid M, Åkermo M, Barsoum Z. Design Implications and Opportunities of Considering Fatigue Strength, Manufacturing Variations and Predictive LCC in Welds. Metals. 2021; 11(10):1527. https://doi.org/10.3390/met11101527
Chicago/Turabian StyleHagnell, Mathilda Karlsson, Mansoor Khurshid, Malin Åkermo, and Zuheir Barsoum. 2021. "Design Implications and Opportunities of Considering Fatigue Strength, Manufacturing Variations and Predictive LCC in Welds" Metals 11, no. 10: 1527. https://doi.org/10.3390/met11101527
APA StyleHagnell, M. K., Khurshid, M., Åkermo, M., & Barsoum, Z. (2021). Design Implications and Opportunities of Considering Fatigue Strength, Manufacturing Variations and Predictive LCC in Welds. Metals, 11(10), 1527. https://doi.org/10.3390/met11101527