Article

The Study on Forming Property at High Temperature and Processing Map of 2219 Aluminum Alloy

1
College of Mechanical and Electrical Engineering, Nanjing Forestry University, Nanjing 210037, China
2
School of Mechanical Engineering, Yanshan University, Qinhuangdao 066004, China
*
Author to whom correspondence should be addressed.
Metals 2021, 11(1), 77; https://doi.org/10.3390/met11010077
Submission received: 11 November 2020 / Revised: 5 December 2020 / Accepted: 8 December 2020 / Published: 1 January 2021

Abstract

:
2219 aluminum alloy is a kind of high-strength Al-Cu-Mn alloy that can be strengthened by heat treatment. Its mechanical property parameters and forming properties are greatly affected by the deformation rate, temperature and strain. Taking 2219 aluminum alloy extruded bar as the research object, the Gleeble-3500 thermomechanical simulator was used to analyze the thermal compression deformation behavior of 2219 aluminum alloy under different temperatures and strain rates. The results show that the deformation behavior of 2219 aluminum alloy under high temperatures is greatly influenced by the deformation temperature and strain rate, and the flow stress is the result of high-temperature softening, strain hardening and deformation rate hardening. According to the experiment results, the Arrhenius constitutive model and the exponential constitutive model considering the influence of temperature and strain rate, respectively, were established, and the predicted results of the two constitutive models were in good agreement with the test results. On this basis, the processing map of 2219 aluminum alloy was established. Under the same strain rate condition with an increase of the deformation temperature, the power dissipation efficiency increases gradually, and the driving force of 2219 aluminum alloy to change its microstructure increases gradually. At the same deformation temperature, the lower the strain rate, the less possibility of plastic instability.

1. Introduction

With the development of industrial technology, aluminum alloy, as a lightweight structural material, has been widely used in the aerospace and automobile manufacturing industries. 2219 aluminum alloy is a kind of heat-treatable strengthening Al-Cu-Mn alloy that has good mechanical properties [1] and welding properties [2] in both high and low temperatures, and is widely used in the production of various structural parts in the fields of aviation and aerospace [3]. However, the mechanical properties and forming performance indexes of 2219 aluminum alloy are greatly affected by the deformation rate, temperature and strain [4]. Therefore, revealing the mechanisms of different deformation conditions on the forming performance indexes and mechanical performance parameters of 2219 aluminum alloy is the key content of current research and has been widely addressed by scholars.
Chen [5] et al. studied the coarse grain (CG) and ultra-crystal (UFG) mechanical properties and local corrosion behavior of 2219 aluminum alloy after aging treatment and point out that due to the grain size, dislocation and the influence of aged precipitated phases, compared with the coarse grain (CG) of 2219 aluminum alloy, ultra-crystal (UFG) significantly increases the hardness and strength of 2219 aluminum alloy, while intergranular corrosion sensitivity is decreased obviously. Zhang [6] et al. studied the thermal compression characteristics of 2219 aluminum alloy with different initial tissues and obtained the constitutive equation under different initial tissue conditions and the influence mechanism of different initial tissues on the thermal deformation characteristics of 2219 aluminum alloy. Based on studying the thermal compression characteristics of 2219 aluminum alloy, Liu [7] et al. modified the parameters of the Arrhenius constitutive model and obtained the variation law of deformation activation energy with temperature and strain rate under different conditions. Ghosh [8] et al. studied the corrosion behavior of 2219 aluminum alloy under two tempering conditions, T81 and T851, and the influence of corrosion on fatigue properties. The research results showed that the corrosion behavior promoted the initiation of fatigue cracks, and the selection of reasonable heat treatment conditions to improve the corrosion resistance of 2219 aluminum alloy has a positive significance for improving its fatigue performance. Olasumboye et al. [9] studied the dynamic deformation behavior of 2219 aluminum alloy under two different tempering conditions, T4 and T6, by means of a Split Hopkinson pressure bar experiment and microstructure test, and determined the flow behavior and microstructure characteristics of 2219 aluminum alloy with different heat treatment and high strain rate conditions. Fang [10] and Lu [11] et al. pointed out that different pre-deformation conditions have a great impact on the microstructure, mechanical properties and corrosion properties of 2219 aluminum alloy, and that pre-deformation is an effective means to improve the mechanical properties of 2219 aluminum alloy. Zhang [12] et al. studied the mechanical properties and microstructure characterization of 2219 aluminum alloy under different thermal deformation conditions by means of an isothermal deformation test, and the research results show that dynamic recovery and partial continuous dynamic recrystallization (CDRX) are the main softening mechanisms of 2219 aluminum alloy.
In the process of an industrial application of 2219 aluminum alloy, especially in the hot working process, in addition to understanding the mechanical properties and microstructure of 2219 aluminum alloy under high temperature conditions, an understanding of the instability characteristics in the hot working process is essential. However, the precondition of achieving this goal is to establish the processing map of 2219 aluminum alloy. The mathematical model of the processing map mainly includes the atomic model [13], dynamic material model [14] and polarity interaction model [15]; due to the limitations of the atomic model, the dynamic material model is most widely used. The processing map of the dynamic material model is mainly based on the dynamic material model established by Prasad [16] and the instability criterion established by Murty [17], which considers the influence of the strain rate on the deformation process. Based on the above theoretical model, researchers have studied the deformation behavior of titanium alloy [18,19,20], magnesium alloy [21,22], aluminum alloy [23,24,25] and other light metal materials (such as titanium-matrix composite) [26,27,28] in the thermal deformation process, and the 2D and 3D processing map were established respectively.
Therefore, this paper takes 2219 aluminum alloy as the research object, and the deformation behavior of 2219 aluminum alloy was studied through a thermal compression test under different temperature and strain rate conditions so as to obtain the mechanical properties of 2219 aluminum alloy under different deformation conditions. On this basis, the processing map of 2219 aluminum alloy was studied, to provide a theoretical basis for the formulation and optimization of the thermal processing technology of 2219 aluminum alloy.

2. Experiment and Result Analysis

2.1. Experiment

During the test, 2219 aluminum alloy extruded bar was taken as the research object, and the 10 mm × 15 mm cylindrical specimens were processed according to the size shown in Figure 1. The Gleeble-3500 thermomechanical simulator (DSI, St. Paul, MN, American) was used to analyze the thermal compression deformation behavior according to the heating curve shown in Figure 2 and the test scheme shown in Table 1. In order to reduce the influence of friction on the test results, graphite and tantalum chips were added to both end faces of the specimens.
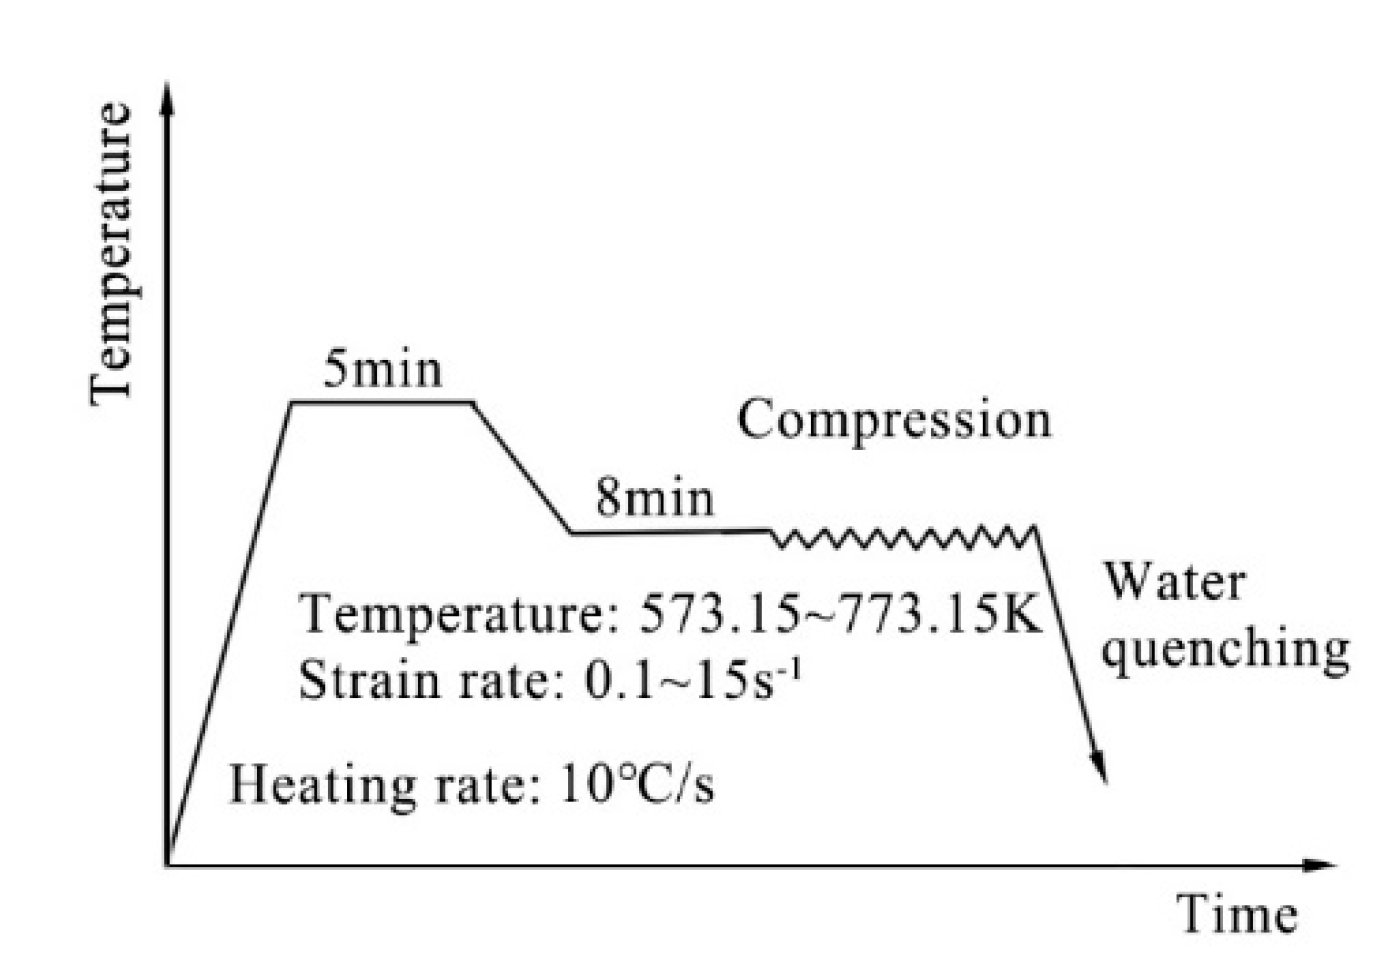
In order to accurately simulate the deformation behavior of 2219 aluminum alloy during the hot working process, compression specimens are first heated at a heating rate of 10 °C/s to the beginning of the 2219 aluminum alloy forging temperature (500 °C). After holding the temperature of all specimens evenly for 8 min, the temperature was lowered to the test temperature set in Table 1. The mechanical properties of 2219 aluminum alloy under different deformation conditions were obtained by isothermal compression of the specimens at this temperature.

2.2. True Stress–Strain Curve

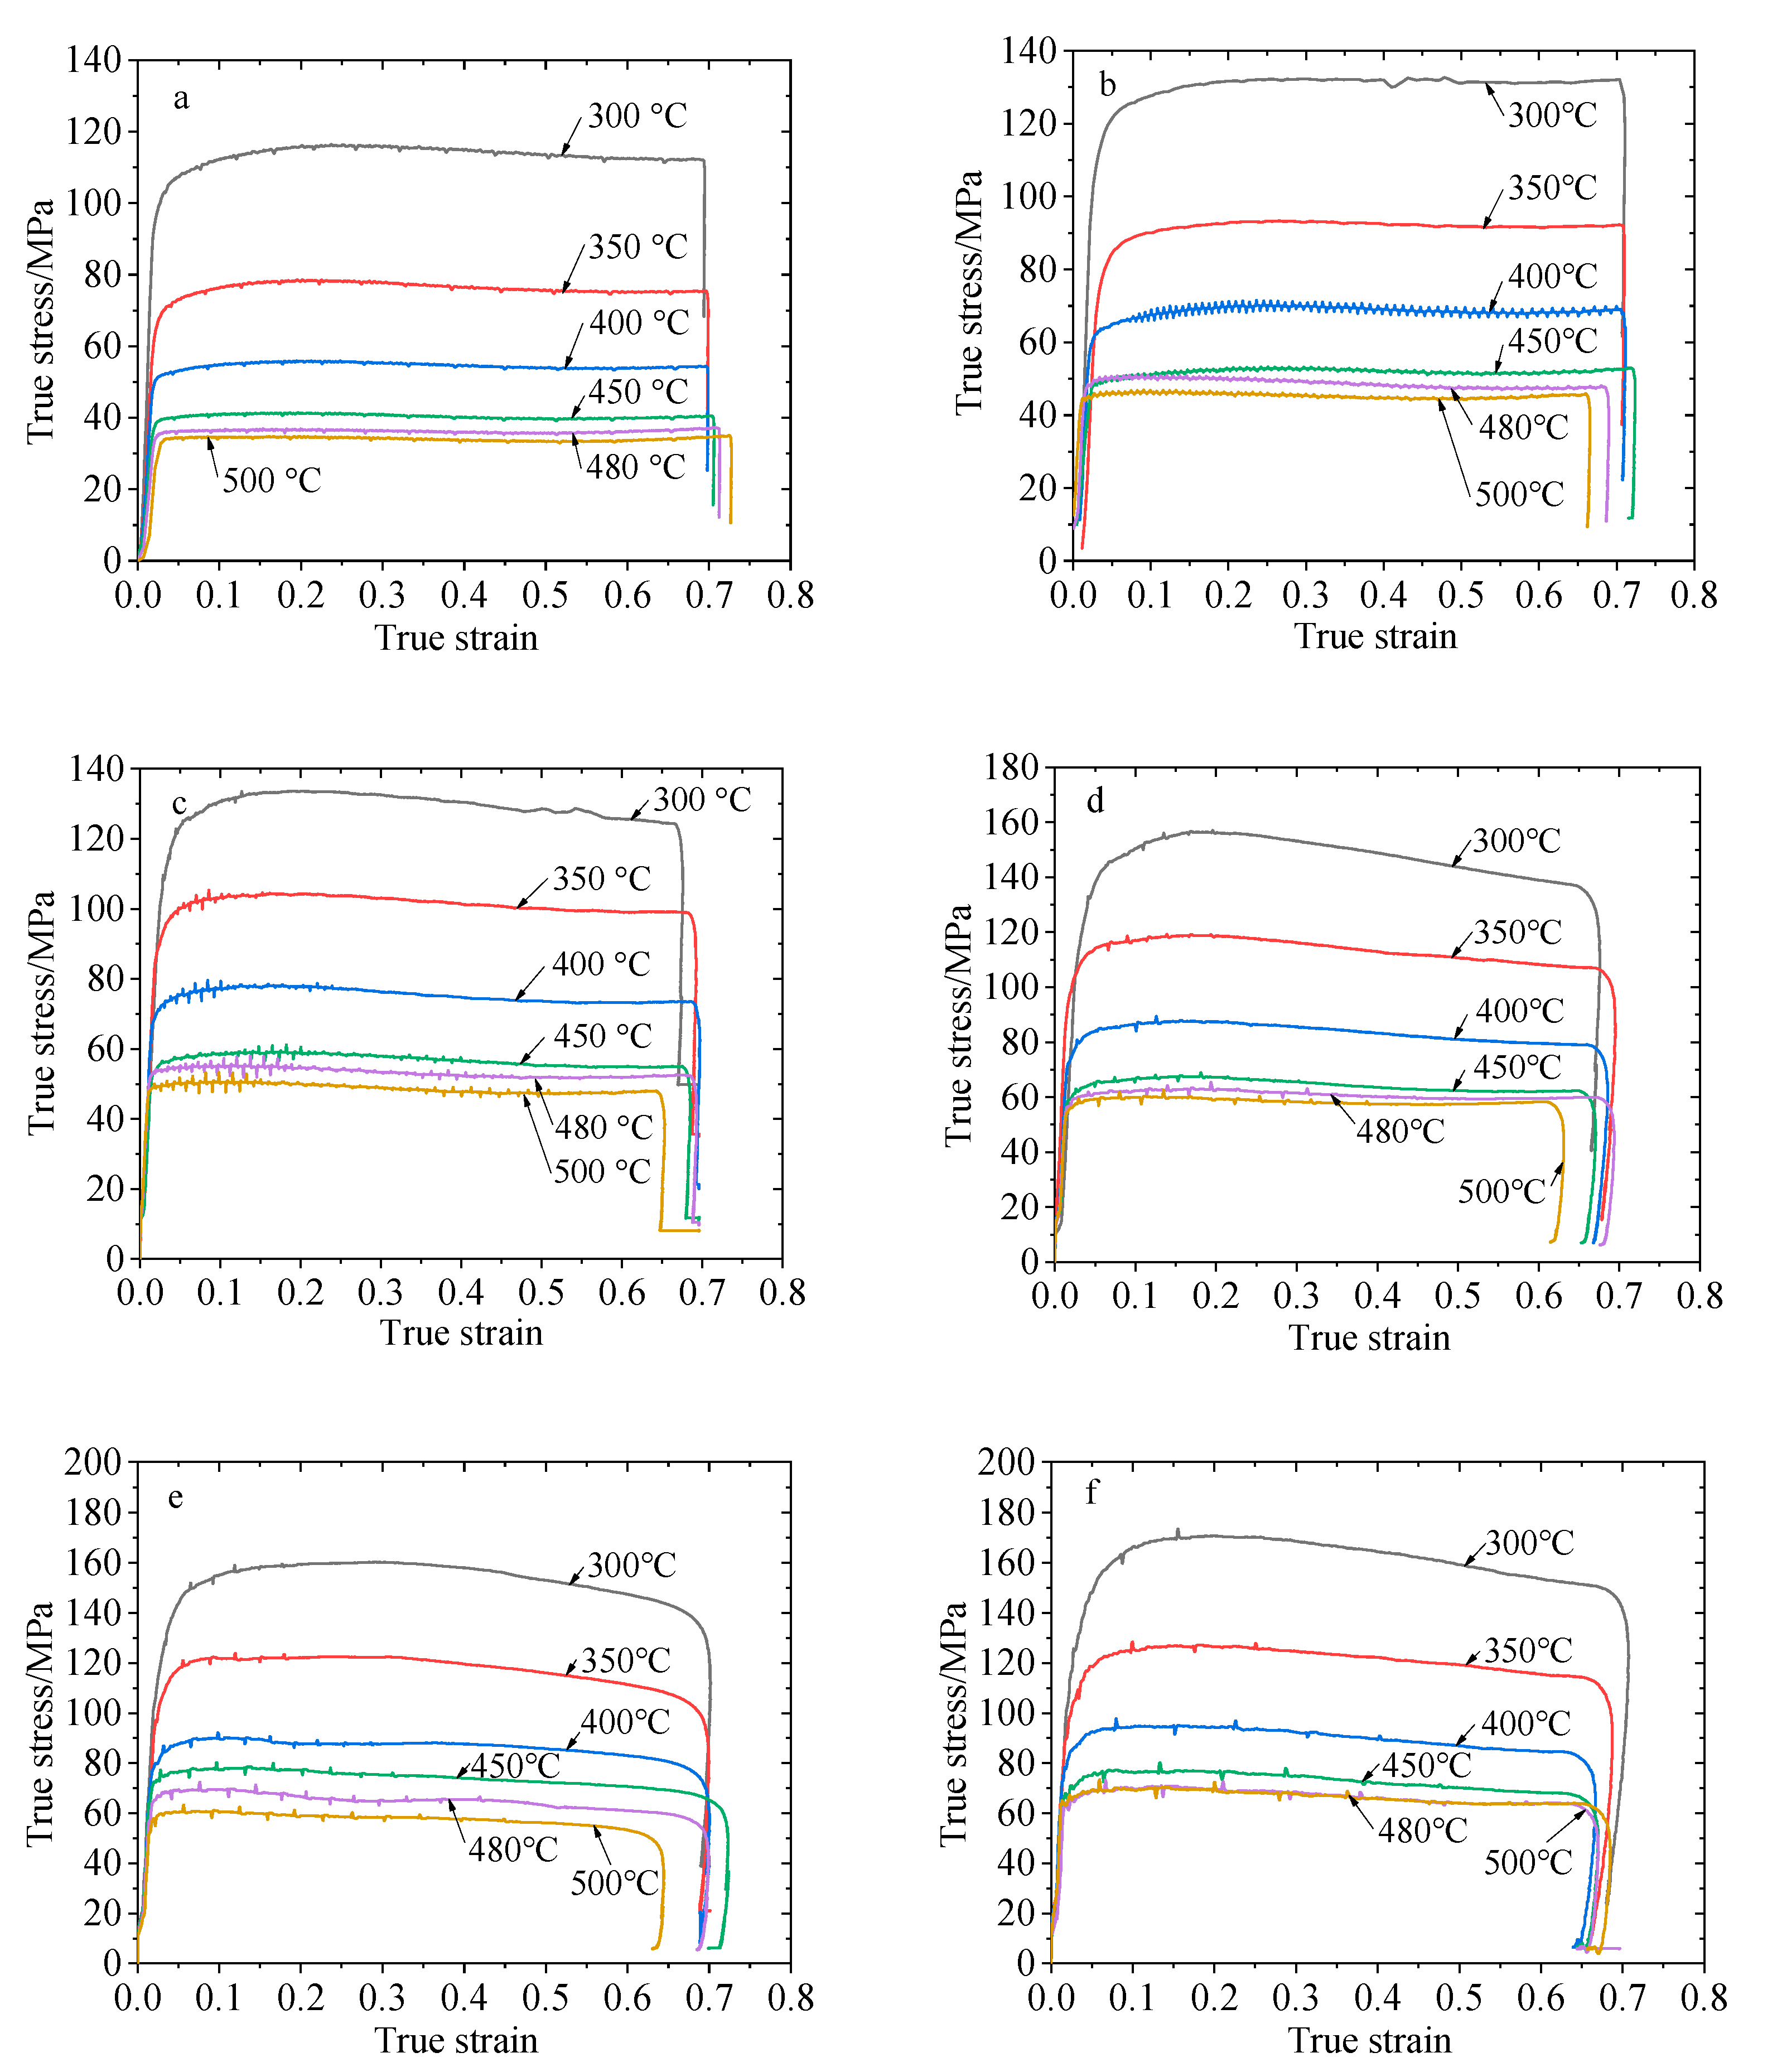
Through the compression test, the flow stress curve of 2219 aluminum alloy at high temperatures under different deformation conditions was obtained, as shown in Figure 3.
It can be seen from the test results that under the condition of high temperatures, the flow stress of 2219 aluminum alloy has obvious dynamic recrystallization characteristics. With the same deformation rate conditions, the softening effect is enhanced with the increase of the deformation temperature. However, in the initial stage of deformation, the strain hardening is greater than the softening effect (strain hardening plays a leading role), and the flow stress curve rises slowly. When the deformation reaches a certain degree, the dynamic softening strength is greater than the strain hardening strength, and the flow stress shows a downward trend. At the same deformation temperature, with the increase of the deformation rate, the flow stress gradually increases, and the 2219 aluminum alloy is a positive strain rate sensitive material. Thus, according to the characteristics of the flow stress curve, it can be seen that under the high temperature conditions, the deformation behavior of 2219 aluminum alloy was greatly influenced by the temperature and deformation rates, and the flow stress is the result of the coordinated action of high temperature softening, strain hardening and deformation rate hardening.

2.3. Influence of Temperature on Steady Flow Stress

In order to further explore the influence of the deformation temperature on the flow stress of 2219 aluminum alloy, the variation curve of steady flow stress with the deformation temperature under the same deformation rate is obtained according to the test results, as shown in Figure 4.
According to the change curve of steady flow stress of 2219 aluminum alloy with the deformation temperature shown in Figure 4, under the same strain rate condition, when the deformation temperature increased from 300 °C to 450 °C, the steady flow stress of 2219 aluminum alloy decreased rapidly with the increase of the deformation temperature. This is because with the increase of the deformation temperature, the bonding force between atoms becomes smaller, which increases the atomic kinetic energy, and then increases the climbing motion of dislocation and the slip system of the 2219 aluminum alloy. In addition, the difference of free energy between the parent phase and the new phase of the material increases due to the rising temperature, and the driving force of nucleation becomes stronger, which stimulates the recrystallization nucleation and grain growth, and the softening effect is gradually enhanced, thus rapidly reducing the flow stress of the 2219 aluminum alloy. When the deformation temperature continues to rise above 480 °C, the steady flow stress of 2219 aluminum alloy decreases with the deformation temperature. This is because within the range of the deformation temperature, the driving effect of the temperature on the dynamic recrystallization of 2219 aluminum alloy gradually tends to be stable, and the softening effect shown under dynamic recrystallization gradually decreases, so that the steady flow stress decreases with the increase of the deformation temperature.

2.4. Influence of Deformation Rate on Steady Flow Stress

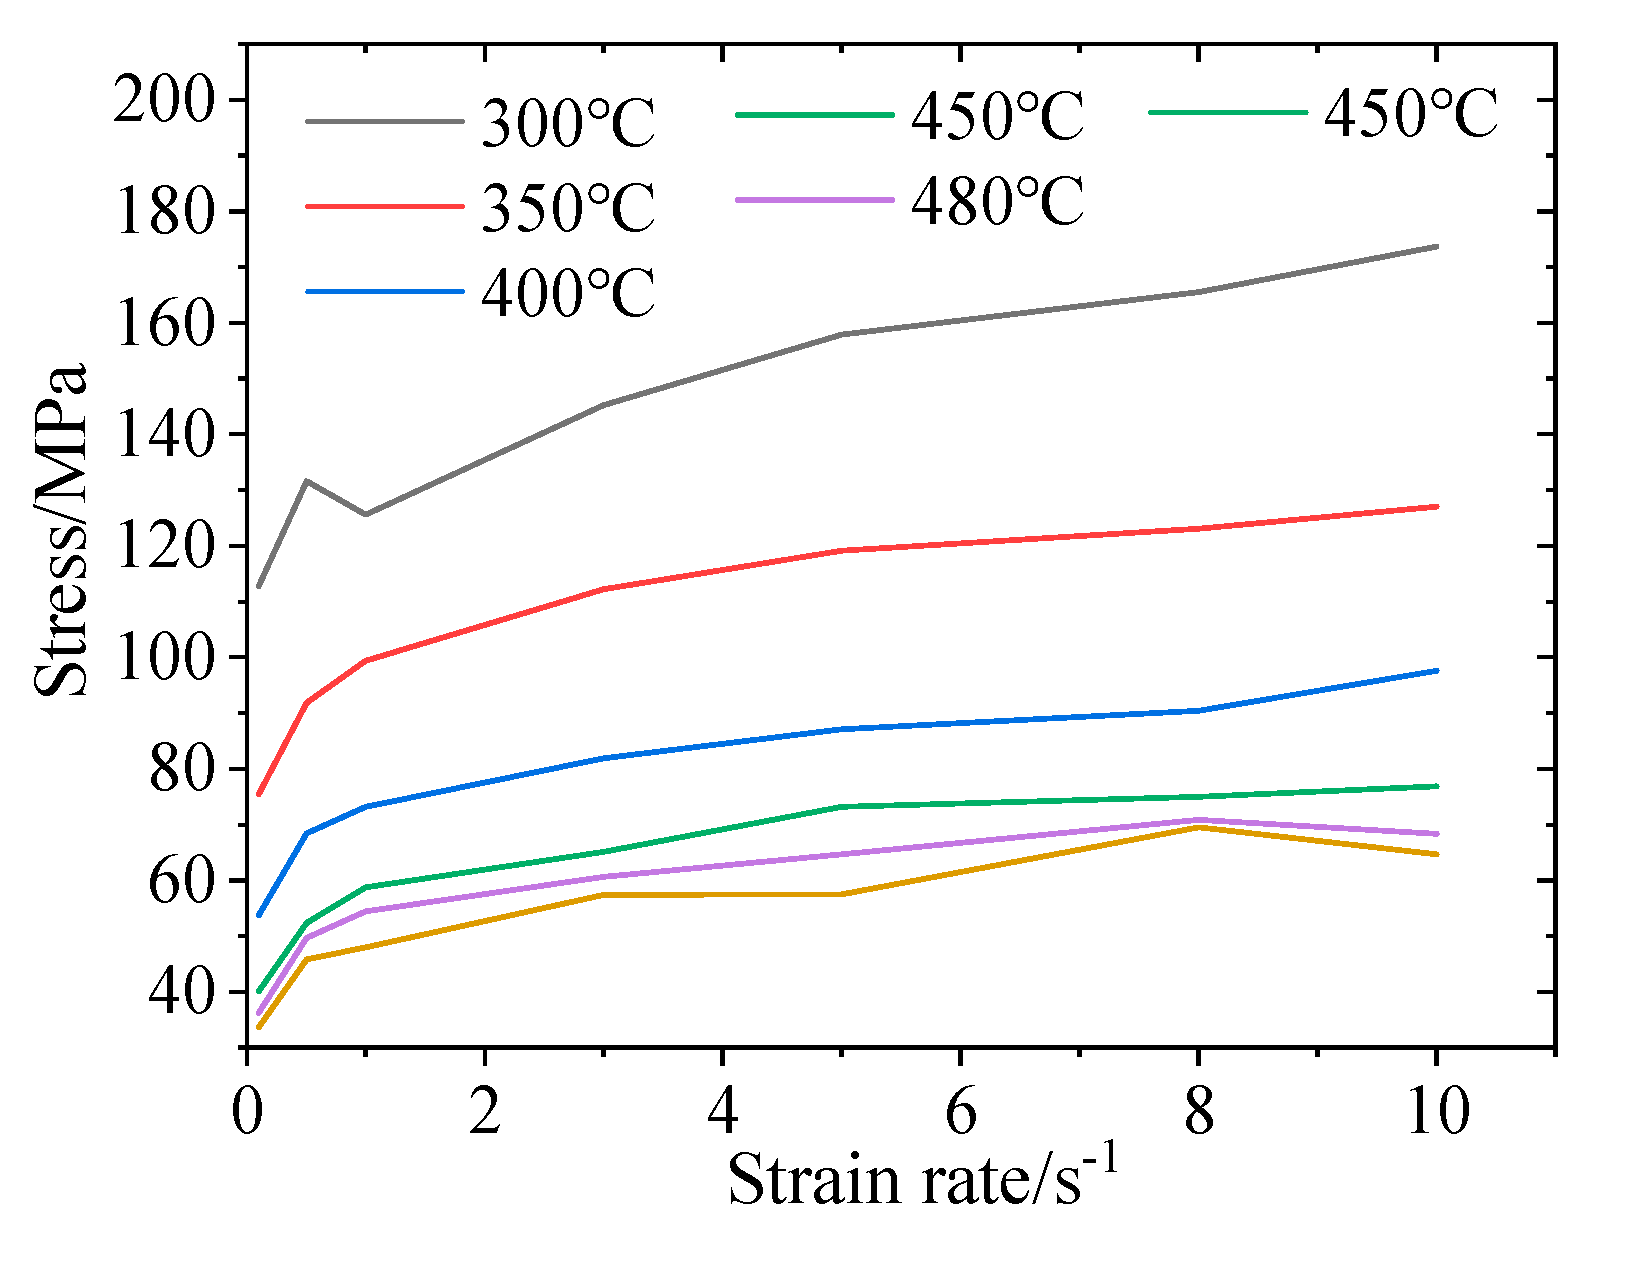
Under the thermal deformation conditions, the steady-state flow stress of 2219 aluminum alloy is also affected by the deformation rate. According to the test results, the curve of steady-state flow stress with a strain rate under different temperatures can be obtained. As shown in Figure 5.
It can be seen from the test results shown that, under the same deformation temperature, the steady-state flow stress of 2219 aluminum alloy increases with the increase of the strain rate. This is because, with the increase of the strain rate, the deformation of the material cycle is shortened, and the dynamic recrystallization grains do not have enough time to grow and begin to the next deformation directly; this makes the dynamic recrystallization softening effect not obvious. Therefore, the steady-state flow stress is characterized by work hardening. In other words, with the increase of the strain rate, the steady-state state flow stress increases.

3. Constitutive Model

3.1. Arrhenius Constitutive Model

According to the test results of 2219 aluminum alloy under high temperature deformation conditions, the flow stress of 2219 aluminum alloy is closely related to the deformation temperature and deformation rate.
Senars and Tegart established the Arrhenius-type constitutive model by studying the relationship between flow stress σ, strain rate ε ˙ and deformation temperature T of material under high temperature deformation [16].
ε ˙   =   A [ s i n h ( α σ ) ] n · e x p [ Q / ( R T ) ]
where A is the material constant, n is the strain rate sensitive index, R is the molar constant of gas, R = 8.31 J/mol·K; α is the stress level parameter, Q is the activation energy of the material, J/mol.
Under the condition of low stress levels, namely, ασ < 0.8, the function sinh(ασ) in Equation (1) is expanded by Taylor’s formula, and substituted it into Equation (1). The relationship between flow stress σ and strain rate ε ˙ can be approximately shown as
ε ˙   =   A 1 σ n 1 e x p [ Q / ( R T ) ]
where n1 is the stress index and A1 is the constant relevant to the material.
Under the condition of high stress levels, namely, ασ > 1.2, the flow stress σ and strain rate ε ˙ can be expressed as the formula as follows
ε ˙   =   A 2 e x p [ β σ ] · e x p [ Q / ( R T ) ]
where A2 and β, are the constants relevant to the material, and β = α·n1.
By taking logarithms of both sides of Equations (2) and (3) and rearranging them, we can see that
l n ε ˙   =   l n A 1 + n 1 l n σ Q / ( R T )
l n ε ˙   =   l n A 2 + β σ Q / ( R T )
From Equations (4) and (5) it can be seen that, when the temperature T is fixed, the l n ε ˙ satisfies the linear equation with σ and l n σ respectively, namely both l n ε ˙ -σ and l n ε ˙ -lnσ show a linear relationship. The slope of the linear equation is the stress index n1 and the material constant β, respectively.
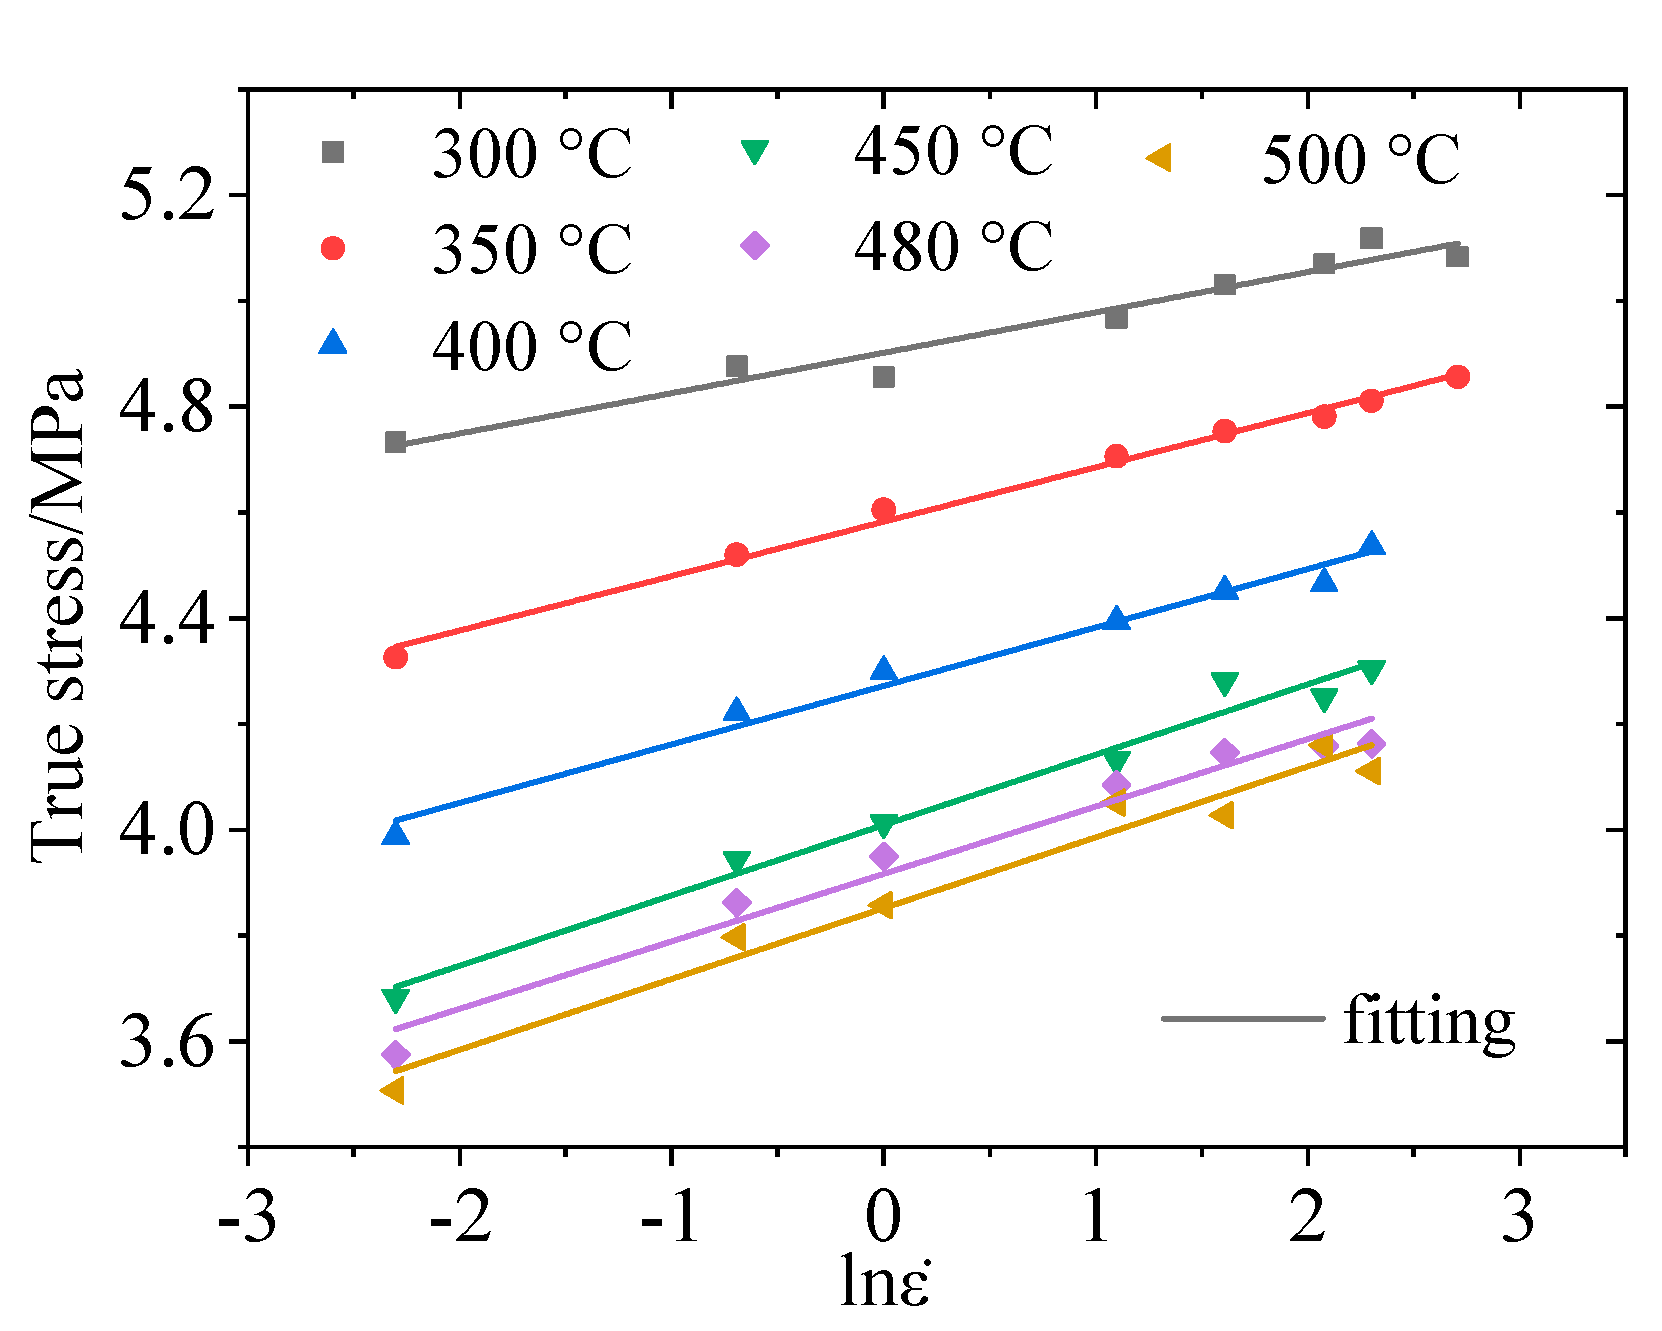
Therefore, under certain strain conditions, the test results obtained under the same deformation temperature and different strain rates are fitted linearly according to Equations (4) and (5) respectively, and the stress index n1 and material constant β under different stress levels can be obtained. For example, taking the test results under the condition of plastic strain ε = 0.5, the values and linear fitting results of l n ε ˙ -σ and l n ε ˙ -lnσ under different deformation conditions are shown in Figure 6 and Figure 7. The values of the stress index n1 and material constant β obtained under different conditions are shown in Table 2.
Since Equation (4) is obtained under the condition of a low stress level, Equation (5) is obtained under the condition of a high stress level. Therefore, in the research process of this paper, the average value of the two lines with low peak stress (480 °C, 500 °C) is the value of n1, and the calculated value n1 = 7.413. Take the average value of the two lines with the higher peak value (300 °C, 350 °C) as the value of β, thus β = 0.09208.
According to the equation of the stress index n1 and the material constant β, β = α·n1, the stress level parameter α = 0.01242 Mpa−1 can be obtained.
Similarly, the logarithm of both sides of Equation (1) can be obtained as follows
l n ε ˙   =   l n A + n l n s i n h ( α σ ) Q / ( R T )
When the deformation temperature T is fixed, the partial derivative of Formula (6) with respect to l n ε ˙ can be obtained.
1 n   =   l n [ s i n h ( α σ ) ] l n ε ˙
When the strain rate ε ˙ is fixed, the partial derivative of Formula (6) with respect to 1/T can be obtained as follows.
Q n R   =   [ l n s i n h ( α σ ) ] ( 1 / T )
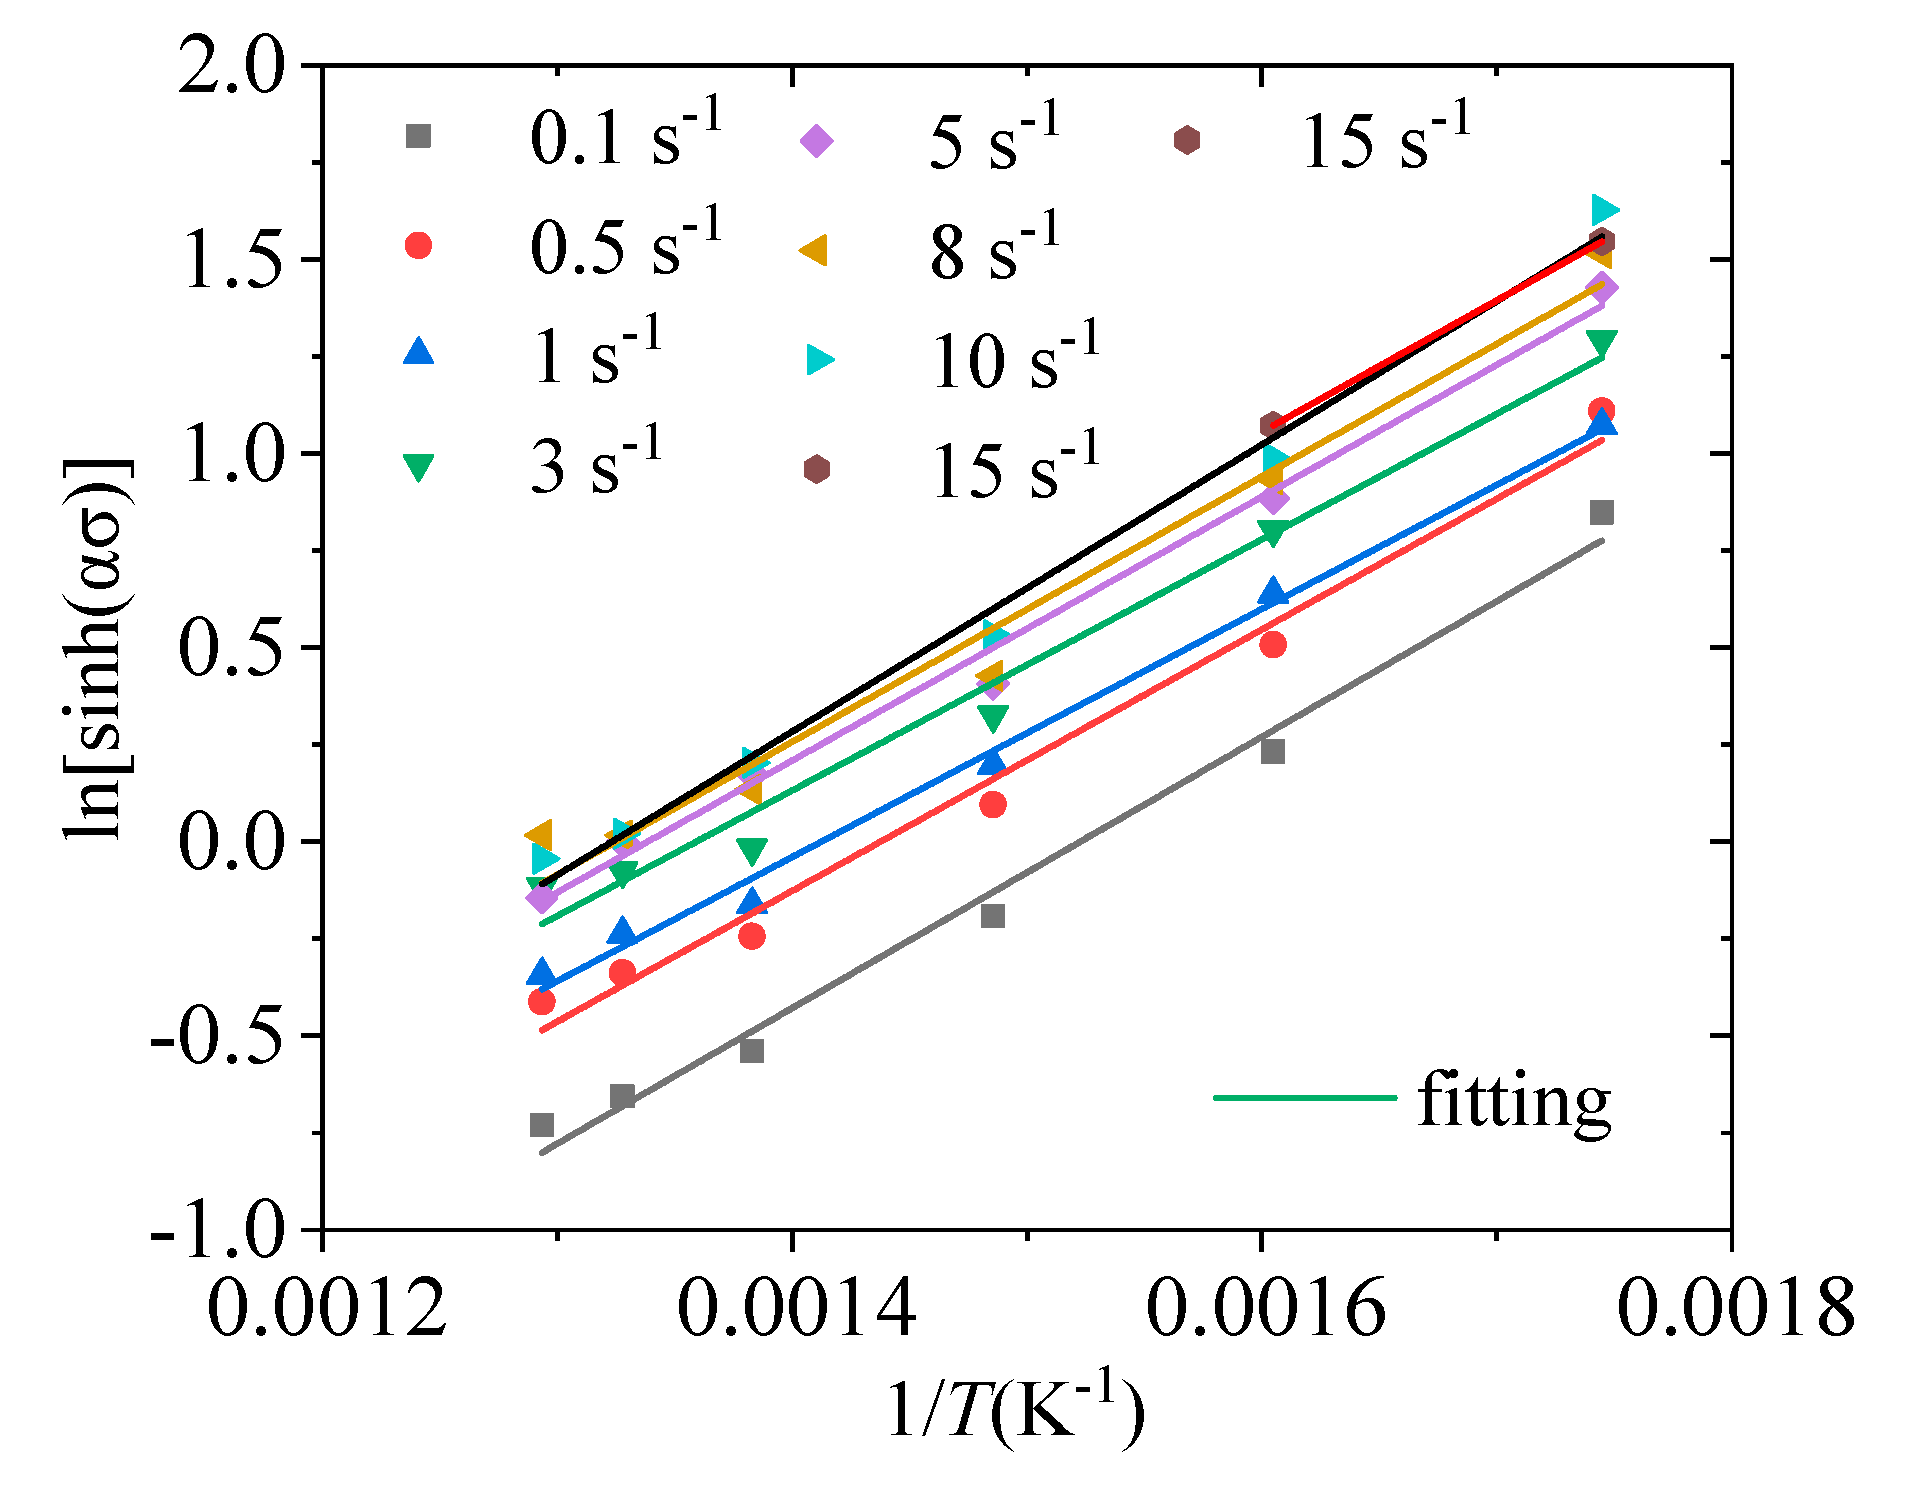
It can be seen from Equations (6) and (7) that when the deformation temperature T is fixed, the logarithm of the strain rate l n ε ˙ and l n s i n h ( α σ ) satisfy the linear equation. Reciprocal of the strain rate sensitivity index, 1/n1 is the slope of the linear function curve of l n [ s i n h ( α σ ) ] with respect to l n ε ˙ , and Q / n R T l n A / n is the intercept with the longitudinal axis. From Equations (6) and (8), it can be seen that Q / n R is the slope of the linear function curve of   l n [ s i n h ( α σ ) ] 1 / T .
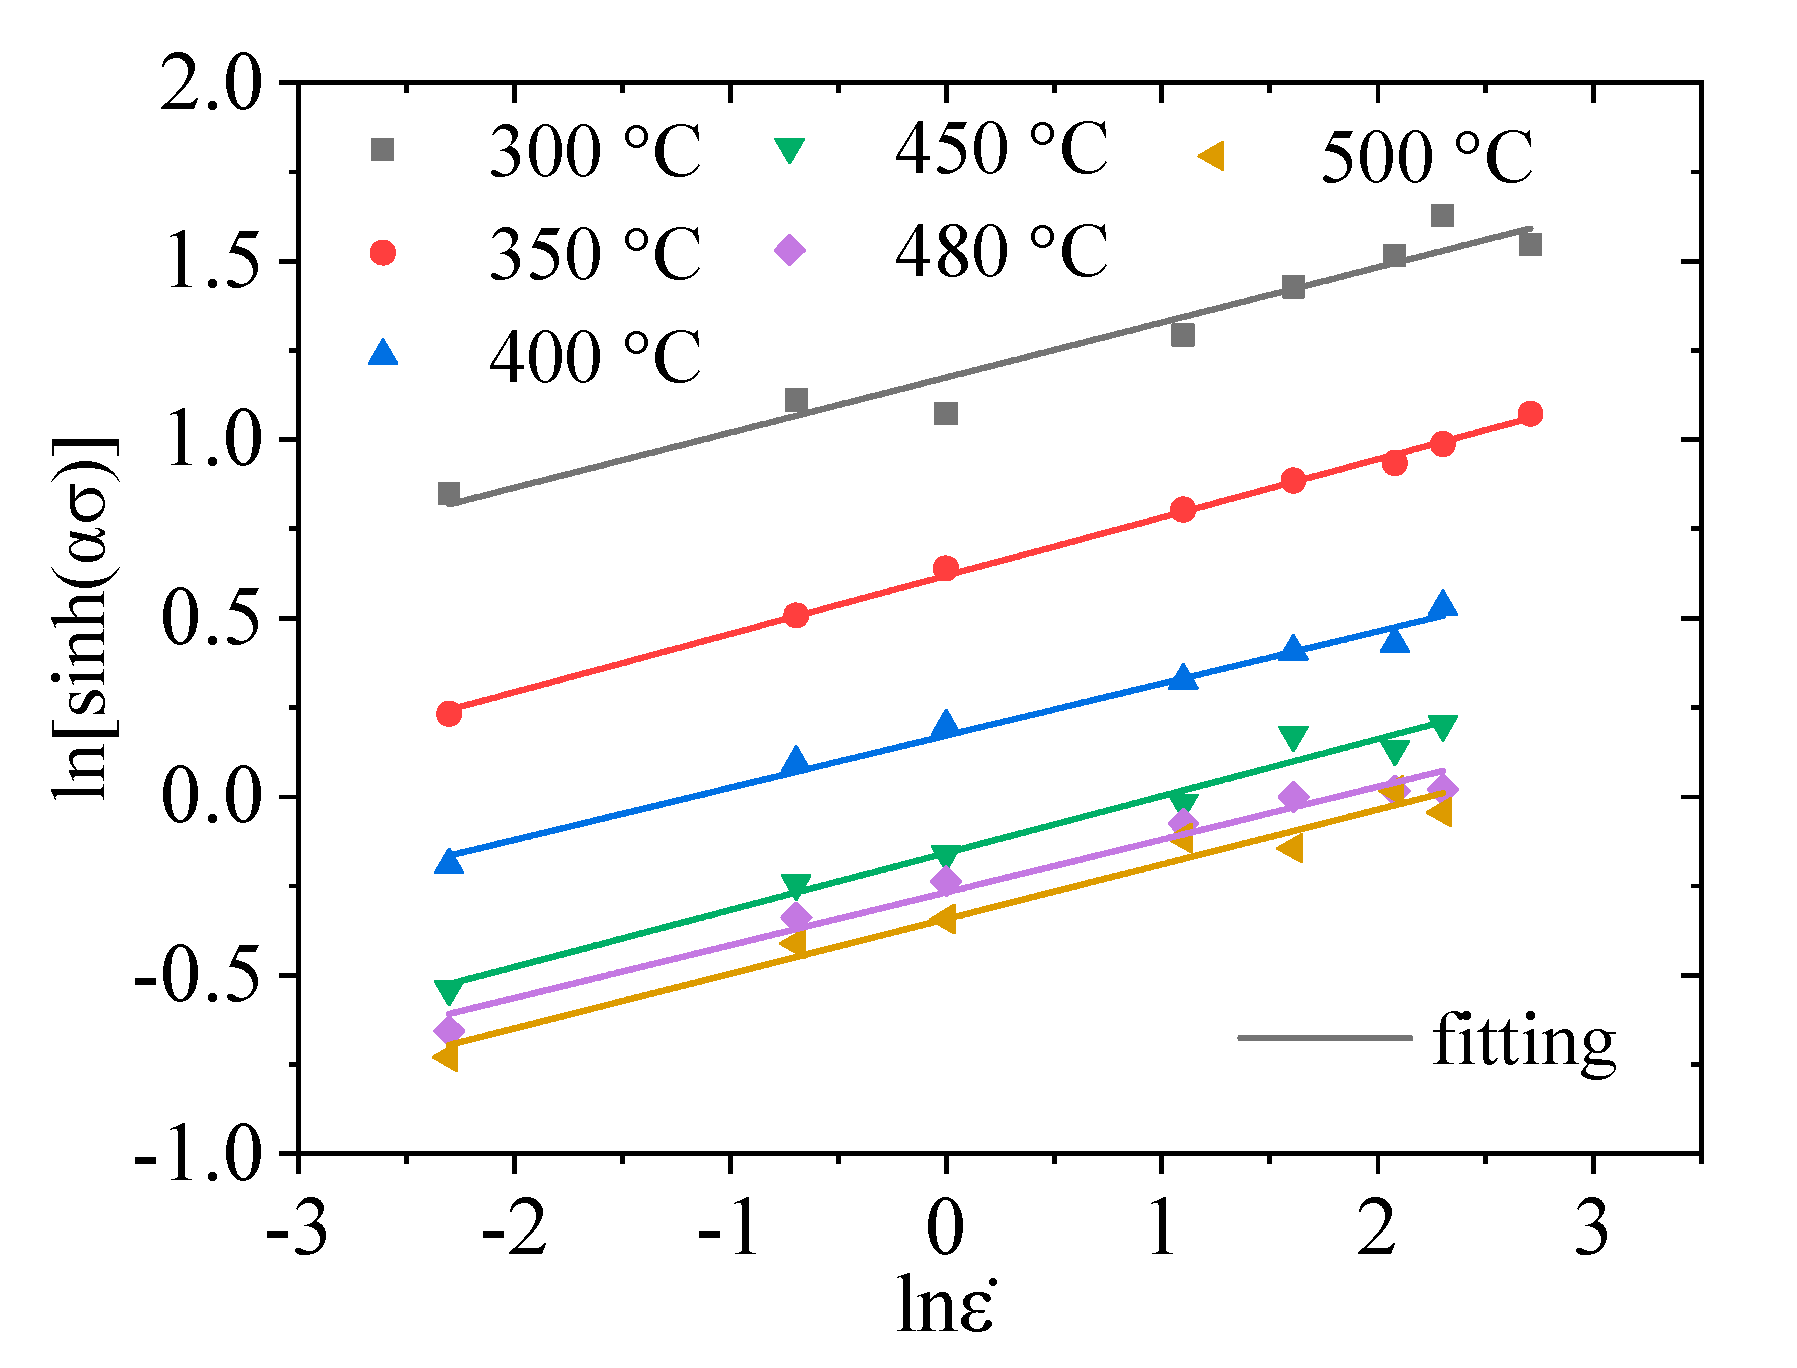
Therefore, combining the obtained value α and the experimental results obtained under different deformation conditions, linear fitting results of l n s i n h ( α σ ) l n ε ˙ and l n [ s i n h ( α σ ) ] 1 / T are shown in Figure 8 and Figure 9. The values of n and lnA under different deformation temperatures are calculated according to Figure 8 and Figure 9, which are shown in Table 3, and the deformation activation energy Q at different strain rates is shown in Table 4.
According to the experiment results shown in Figure 3, it can be seen that the flow stress curve of 2219 aluminum alloy is not only related to the deformation temperature and strain rate, but is also affected by plastic strain. Therefore, all parameters in the Arrhenius model will be affected by plastic strain. In order to determine the influence of strain on the parameters of the constitutive model, the value of the model parameters under different strain conditions is obtained by using the same solution method as above and shown in Table 5. The variation rule of each parameter with strain is shown in Figure 10.
From Table 5 and Figure 10, it can be seen that at the initial stage of plastic deformation, with the increase of plastic deformation, the stress level parameter α in the Arrhenius model decreases gradually. When the strain reaches 0.2, α increases with the increase of plastic deformation. The deformation activation energy Q, strain rate sensitivity index n and material constant lnA all increase with the increase of plastic deformation.
In order to further reveal the internal relationship between various parameters of the Arrhenius model and plastic strain, a fifth degree polynomial was used to fit the parameter results obtained under different strain conditions, and the functional relationship between various parameters of the model and strain was obtained as shown in Equations (9)–(12); the fitting curve is shown in Figure 10.
α   =   1.7453   ε 5 + 3.0219 ε 4 2.0073 ε 3 + 0.64584   ε 2 0.098329 ε + 0.016805
n   =   130.8964 ε 5 + 246.1244 ε 4 162.0617 ε 3 + 45.4542 ε 2 3.6433 ε + 6.0335
Q   =   1093941.8354 ε 5 + 2446288.2121 ε 4 1624984.8994 ε 3 + 346309.6102   ε 2 + 65835.8888 ε +   140722.0552
l n A   =   1093941.8354 ε 5 + 2446288.2121 ε 4 1624984.8994 ε 3 + 346309.6102 ε 2   + 65835.8888 ε + 140722.0552
According to,
s i n h ( α σ )   =   [ e x p ( α σ ) e x p ( α σ ) ] 2
Substituting Equation (13) into the Arrhenius-type constitutive model (Equation (1)), the flow stress can then be expressed as
σ   =   1 α { ( ε ˙ e x p [ R R T ] A ) 1 n + [ ( ε ˙ e x p [ R R T ] A ) 2 n + 1 ] 1 2 }
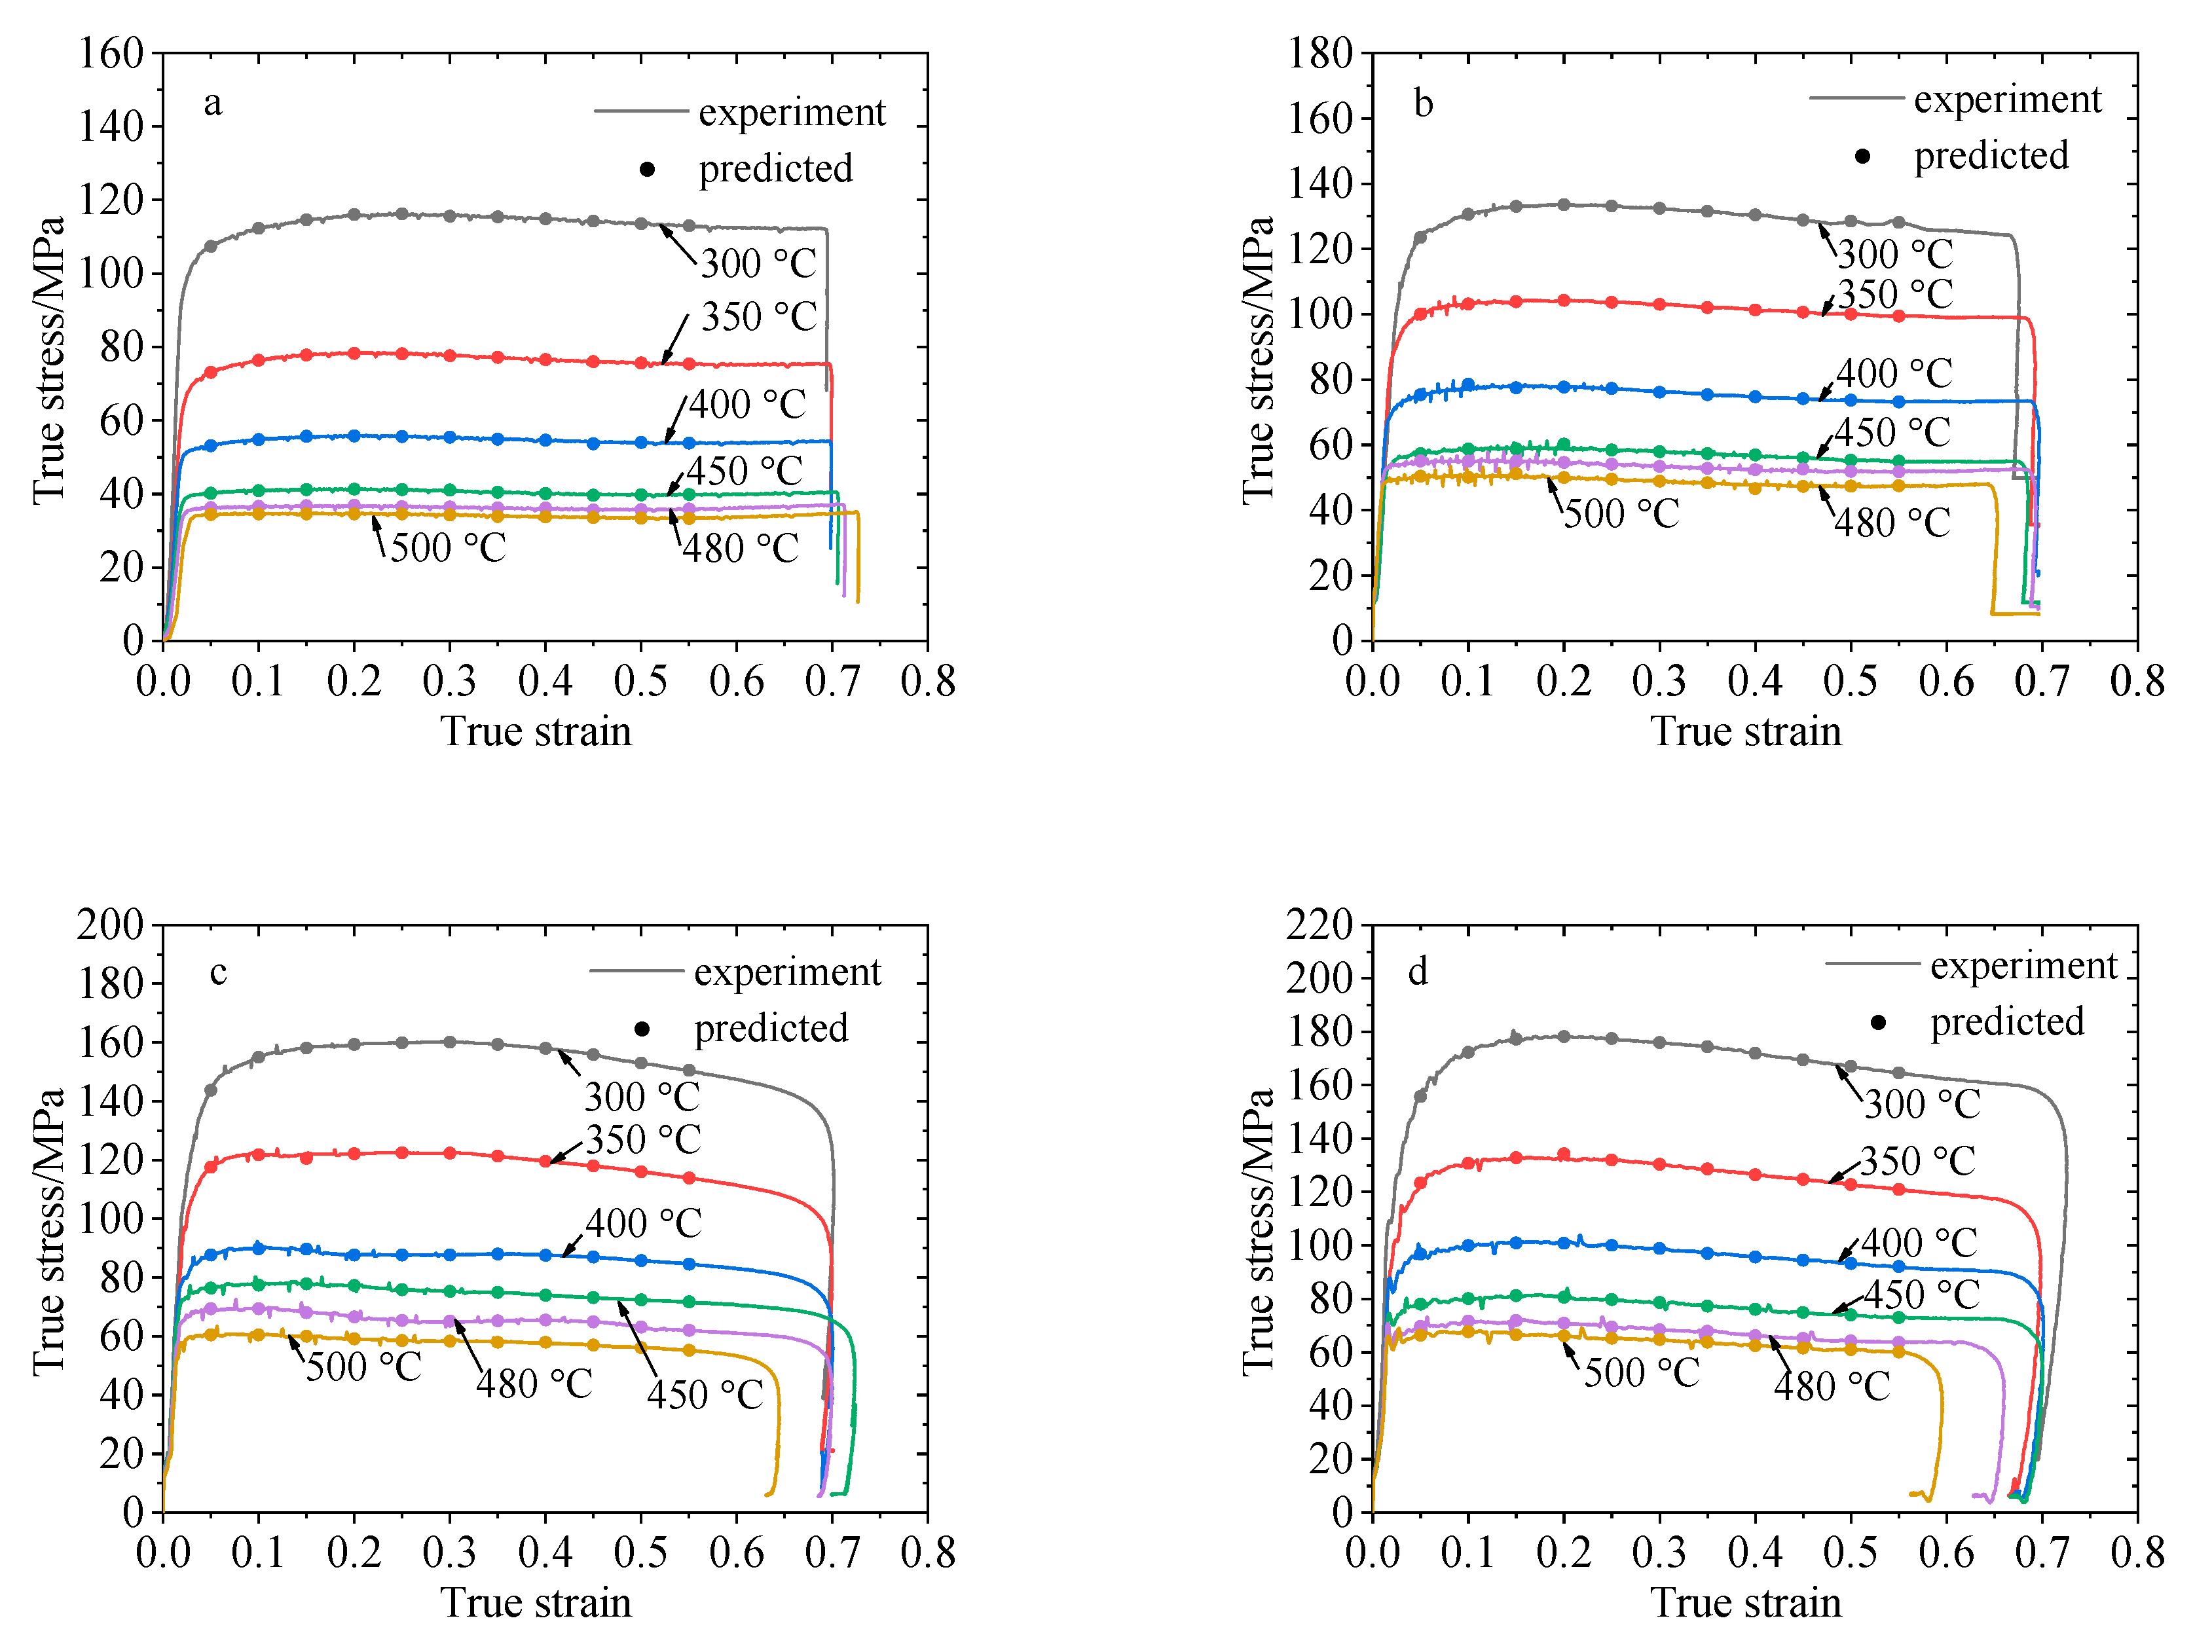
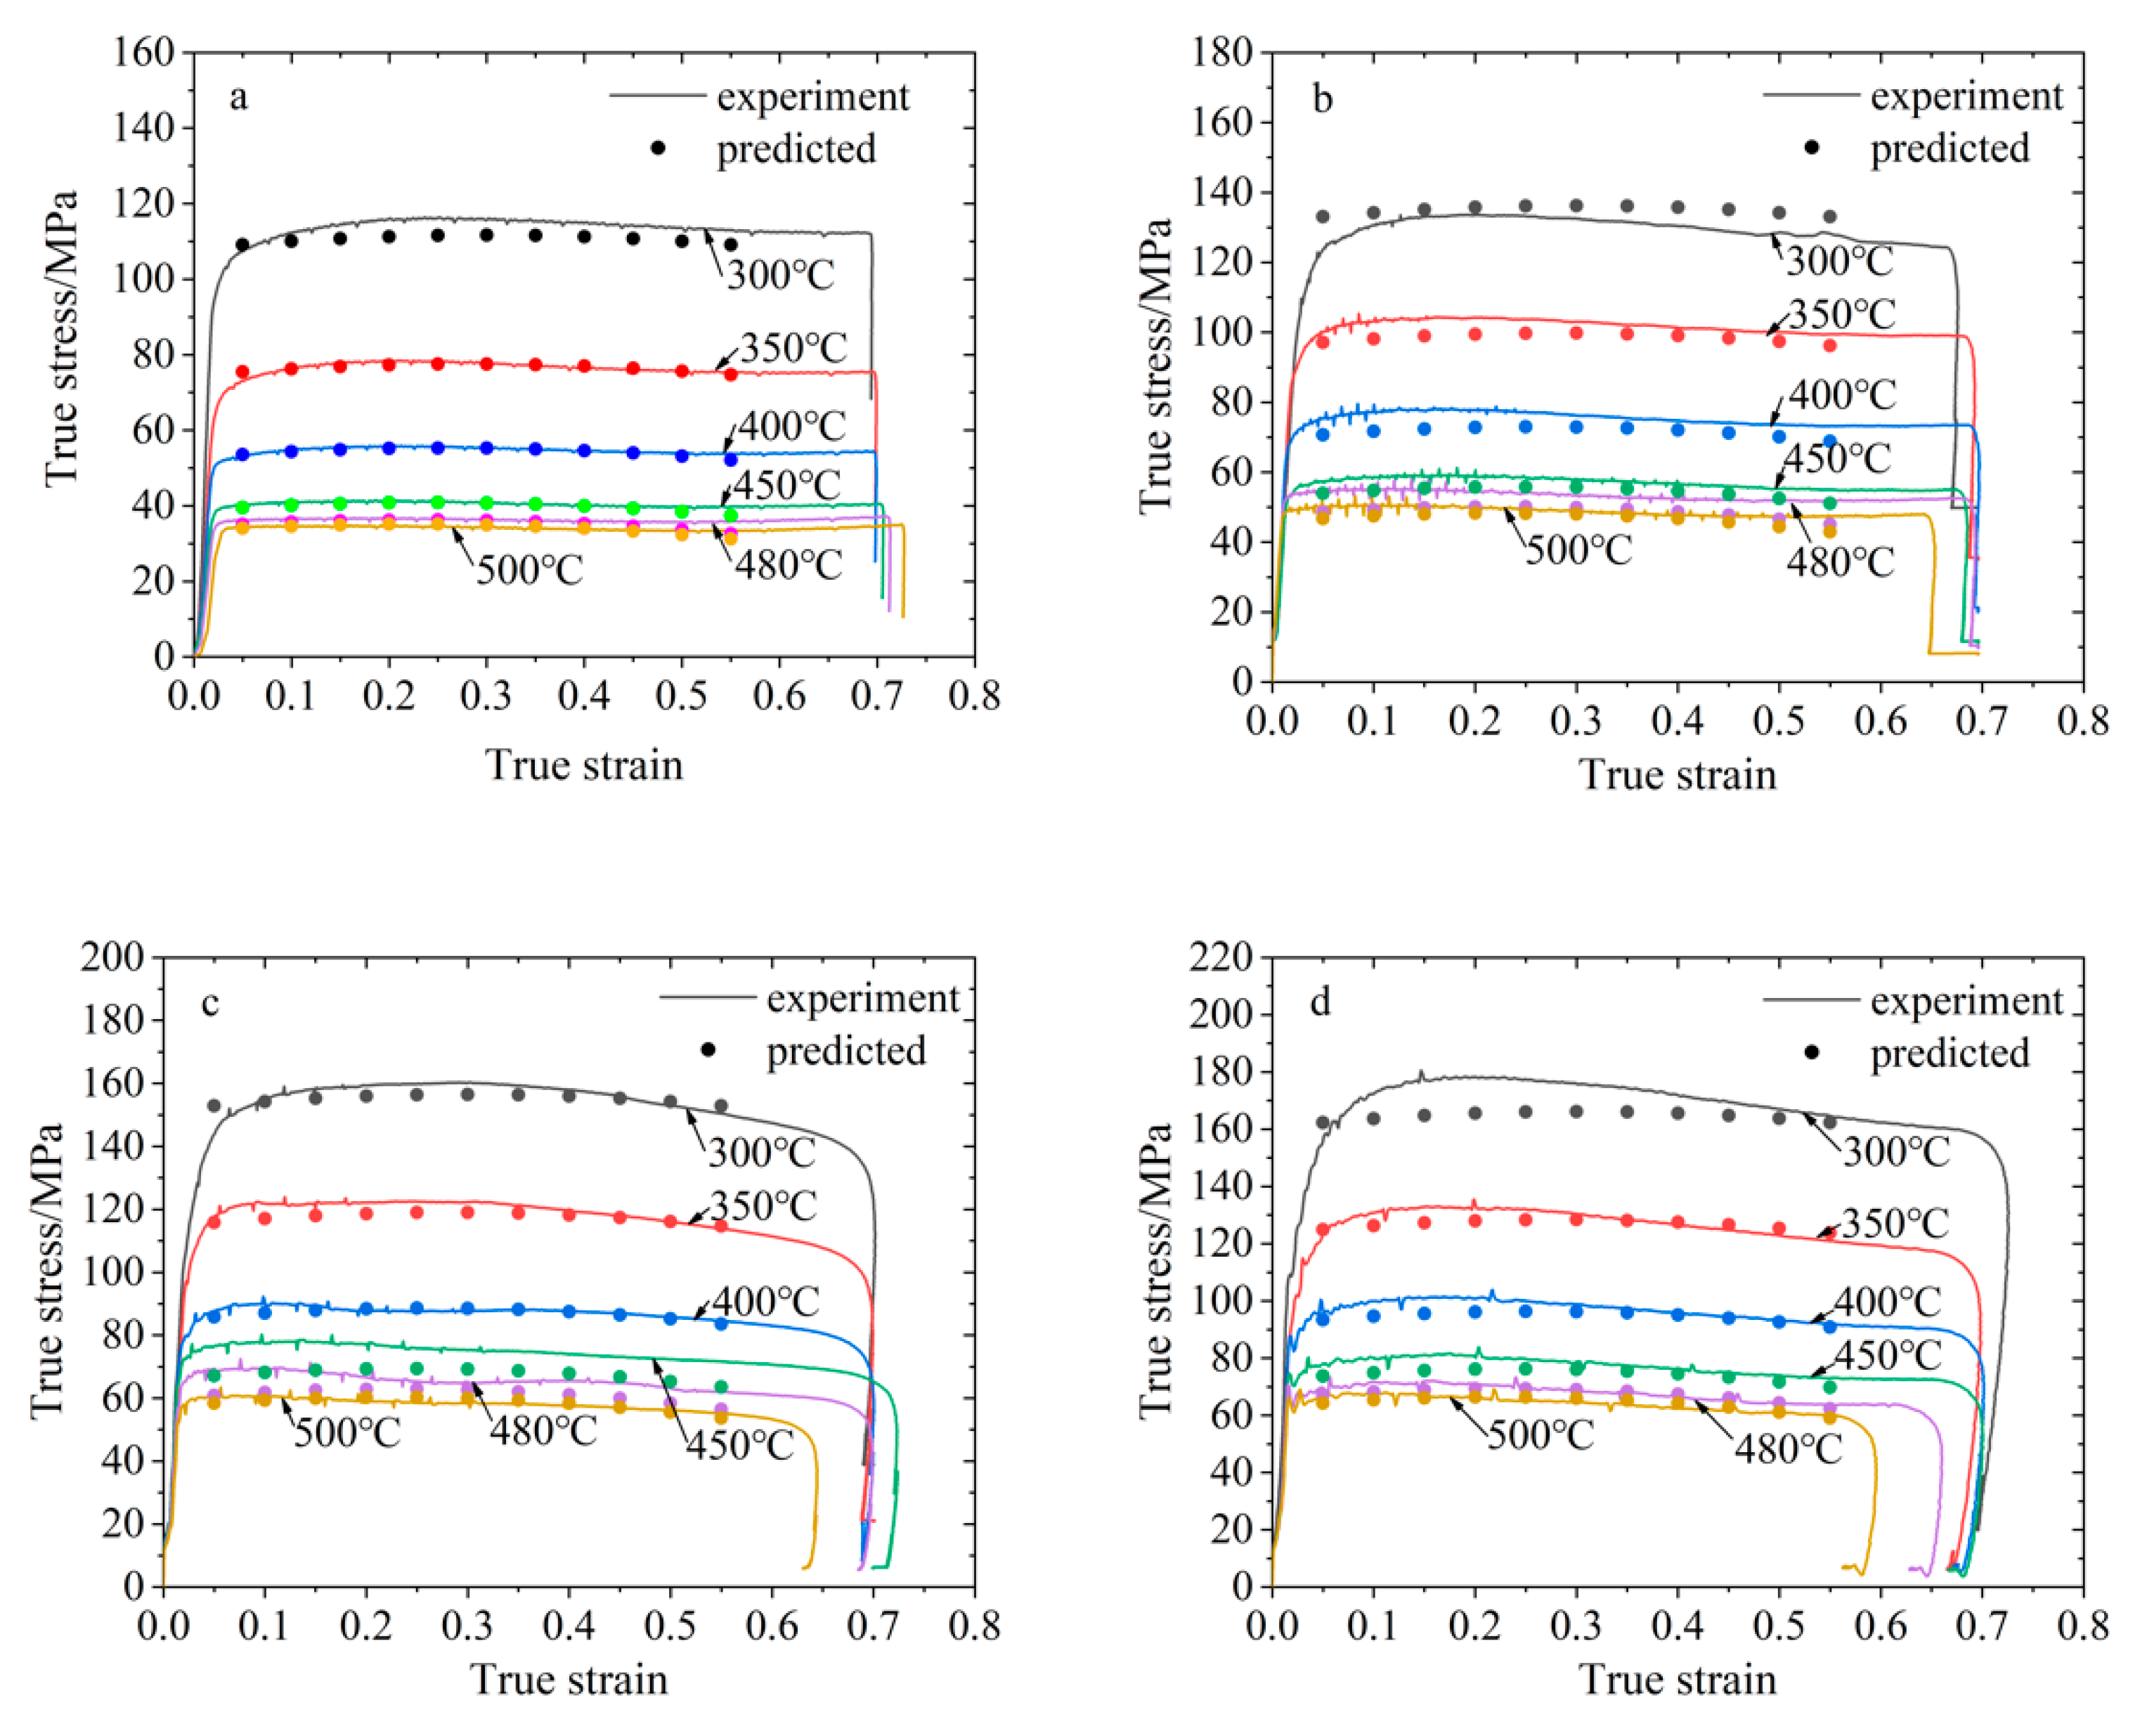
The prediction results of the flow stress of 2219 aluminum alloy under high temperature deformation conditions can be obtained by substituting the parameters obtained from Equations (9)–(12) into Equation (14), as shown in Figure 11. According to Equations (15) and (16), the correlation coefficient between the predicted results and the experiment results was calculated respectively, R = 0.995, and the average relative error was AARE = 3.542%. Therefore, the constitutive equation established based on the Arrhenius model can accurately predict the deformation behavior of 2219 aluminum alloy under the condition of high temperature deformation, and the prediction result of the constitutive equation is highly consistent with the experiment results.
R   =   i   =   1 N ( E i E ¯ ) ( P i P ¯ ) i   =   1 N ( E i E ¯ ) 2 i   =   1 N ( P i P ¯ ) 2
A A R E   =   1 N | E i P i E i |   ×   100 %

3.2. Exponential Constitutive Model

In the exponential constitutive model, the relationship between the flow stress and the strain rate under thermal deformation can be expressed as follows
σ   =   K · ε ˙ m
where σ is rheological stress, ε ˙ is the strain rate, m is the strain rate sensitivity index and K is material parameters, which is related to the deformation temperature T and strain ε.
Taking a logarithm of both sides of Equation (17), Equation (17) will be changed as follows
l n σ   =   l n K + m l n ε ˙
From Equation (18) we can see that when the deformation temperature T is fixed, logarithmic results of flow stress lnσ and strain rate l n ε ˙ satisfy the linear equation, the slope of the linear equation equals the strain rate sensitivity index m and the equation of the straight line intercept equals lnK.
The experimental data are linearized according to Equation (18); thus, the strain rate sensitivity index m and material constant K of 2219 aluminum alloy under different deformation temperatures can be obtained.
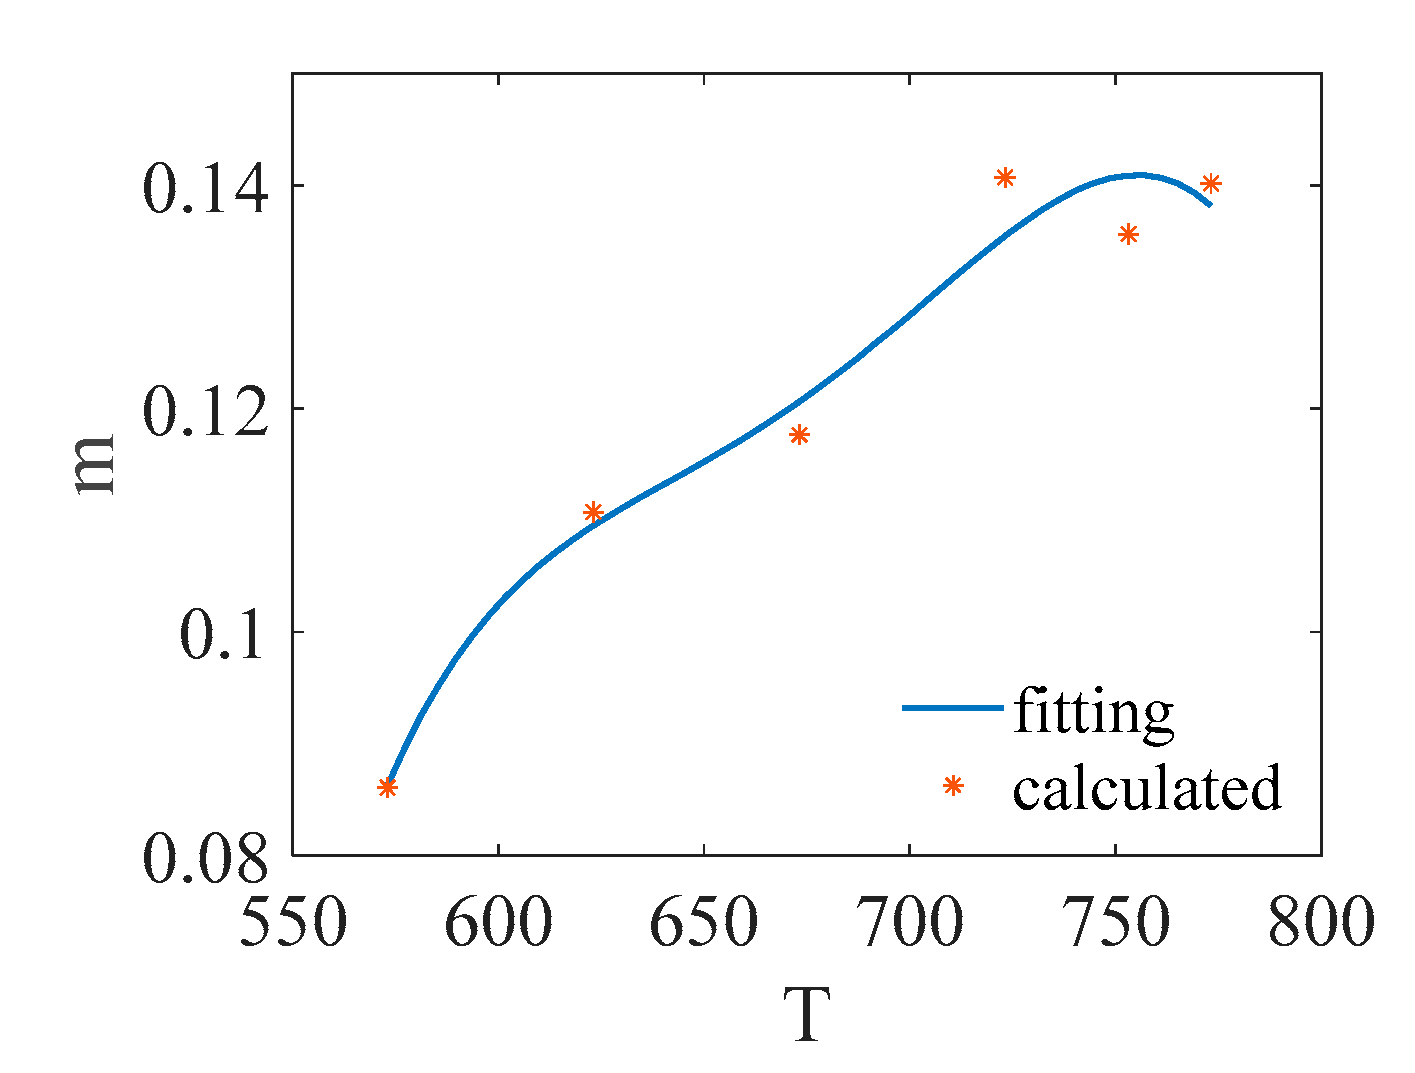
According to Equation (18), the fitting results of the strain rate sensitivity index m of 2219 aluminum alloy under different deformation temperatures are shown in Table 6 and Figure 12. It can be seen from the fitting results of the strain rate sensitivity index m that the strain rate sensitivity index of 2219 aluminum alloy increases with the increase of the deformation temperature. A 4th-degree polynomial was used to fit the strain rate sensitive index under different deformation temperatures, as shown in Figure 12. Then, the function expression of the strain rate sensitive index m on the deformation temperature T is obtained, as shown in Equation (19).
m   =   2.1165   ×   10 10   T 4 + 5.699   ×   10 7 T 3 0.00057416   T 2 + 0.25678   T 42.9336
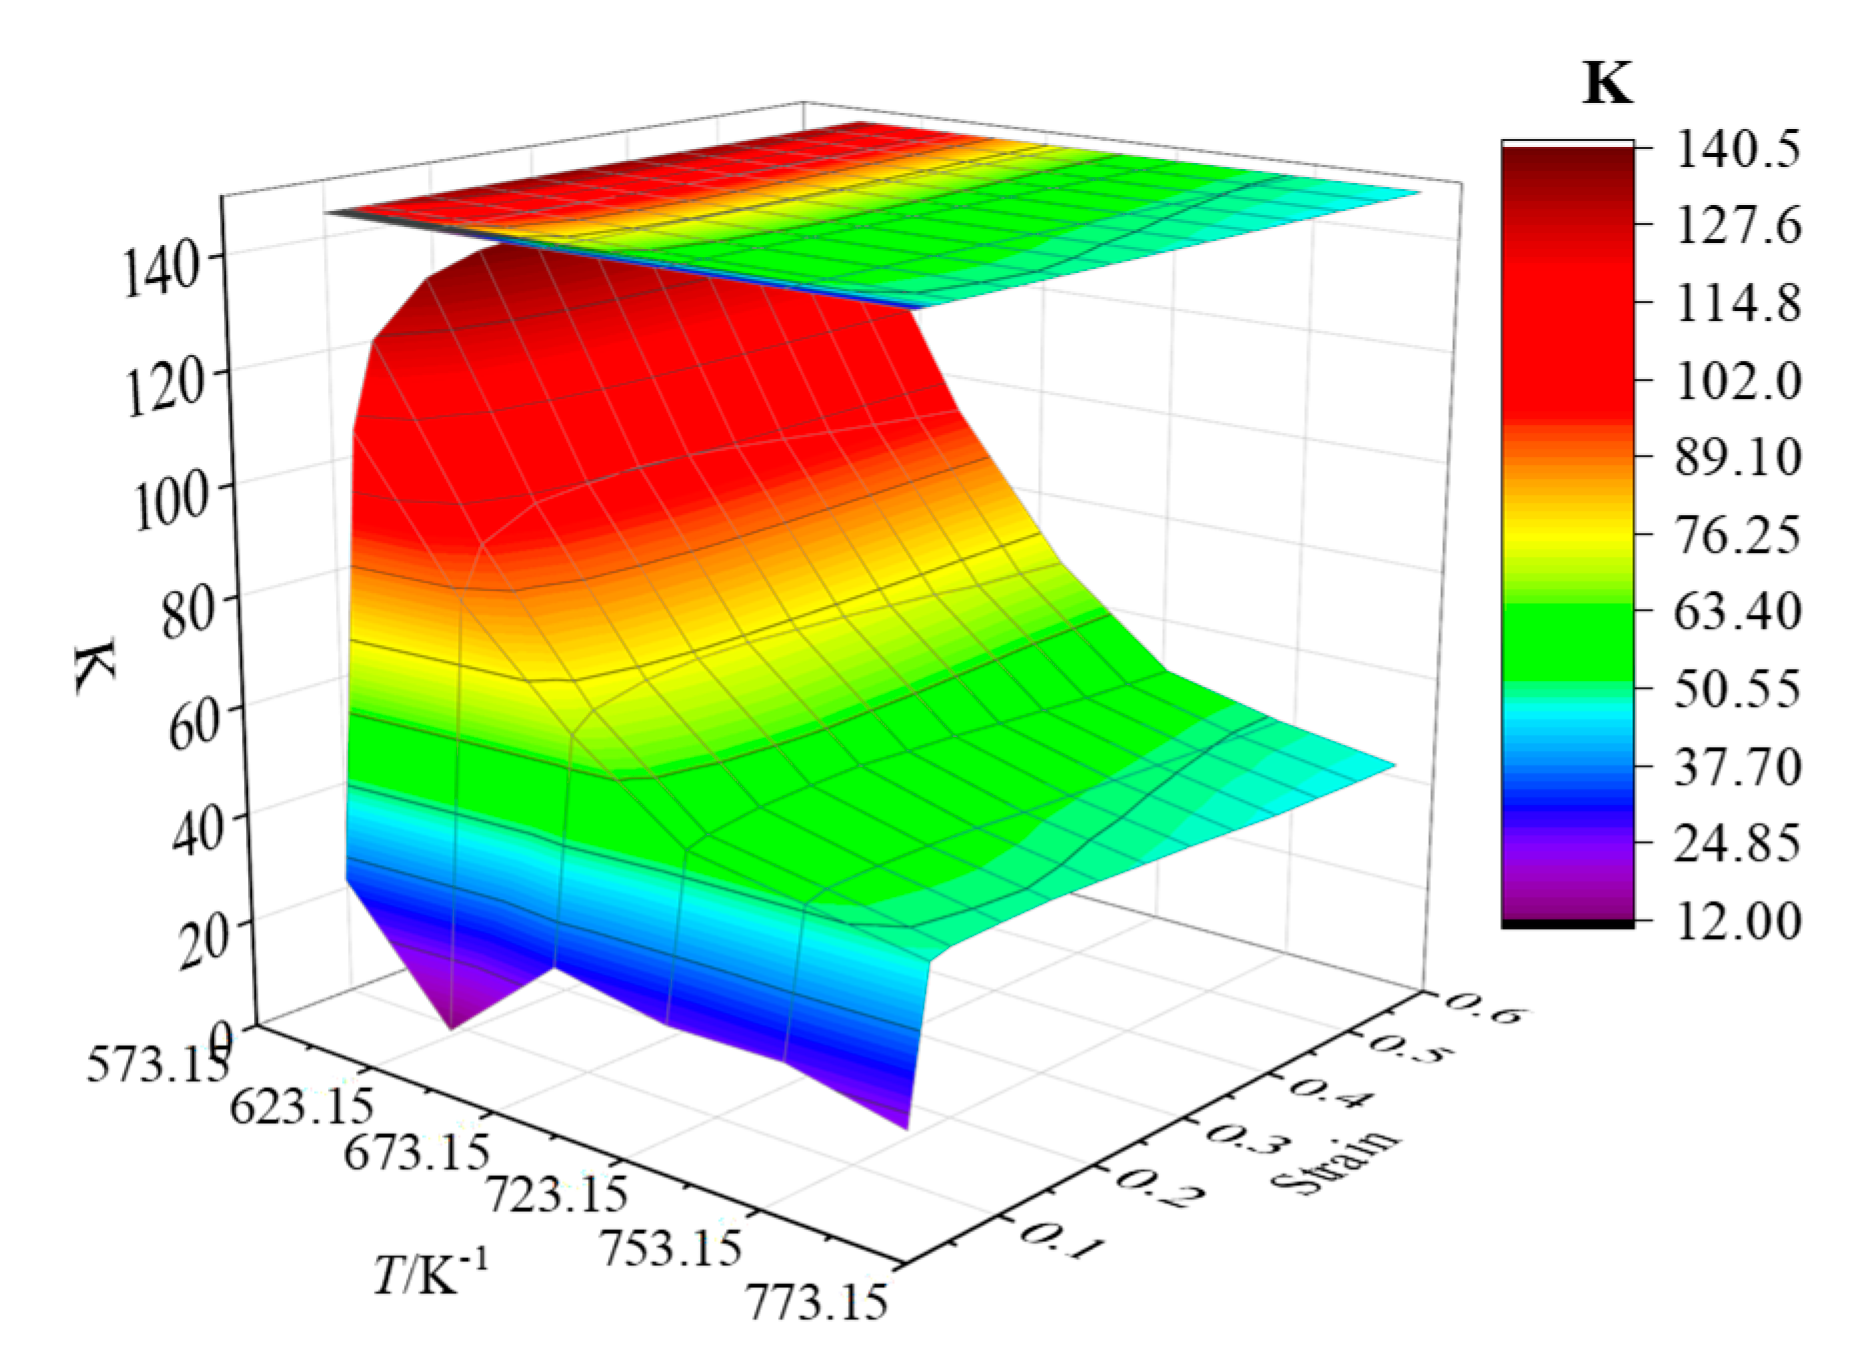
Similarly, according to Equation (18), the values of the material parameter K under different deformation temperatures T and strain conditions can be obtained, as shown in Table 7 and Figure 13.
It can be seen from the fitting results that the constant parameter K of 2219 aluminum alloy is affected by both plastic strain and the deformation temperature. At the same deformation temperature, at the beginning of the plastic deformation (when the plastic strain is small), the material parameter K increases rapidly with the increase of the plastic deformation. When the plastic deformation is large (plastic strain is greater than 0.3), the material parameter K gradually decreases and tends to be stable under the influence of the plastic deformation. Under the same plastic strain conditions, the material constant K decreases with the increase of the deformation temperature.
The value of the material parameter K changing with deformation temperature and plastic strain is obtained through nonlinear fitting, as shown in Figure 13. The function expression of the material constant K on plastic strain ε and the deformation temperature T is shown in Equation (20).
K   =   1228.66719 3.01442 T + 52.45246 ε + 0.00192   T 2 50.43138   ε 2 0.03862   ε · T
By substituting the strain rate sensitive index m and material constant K obtained by Equations (19) and (20) into Equation (17), the exponential constitutive model with the strain rate and deformation temperature considered can be established. The comparison between the flow stress predicted by the exponential constitutive model and the test results is shown in Figure 14. According to Equations (15) and (16), the correlation coefficient between the predicted result and the test result is R = 0.996, and the average relative error is AARE = 3.789%.

4. Processing Map

The processing map is a superposition of the power dissipation diagram and the instability diagram, which is used to describe the structure change of the material under the high temperature deformation process. The processing map is the basis for the reasonable technological parameters of the material in the thermal deformation process.
According to the dynamic material model (DMM model) proposed by Prasad [16], the thermal deformation process of 2219 aluminum alloy can be regarded as an energy dissipation system, and the energy consumption is closely related to the rheological behavior of the material. According to the dynamic material model (DMM) theory, the total energy P absorbed by the workpiece during thermal processing can be expressed as
P   =   σ ε ˙   =   G + J
where G represents the energy consumed by the plastic deformation of material, it can be expressed as
G   =   0 ε ˙ σ d ε ˙
J represents the energy dissipation caused by changes in material organization.
J   =   0 σ ε ˙ d σ   =   σ ε ˙ 0 ε ˙ σ d ε ˙
When the flow stress model of the material under the condition of high temperature deformation satisfies Equation (17), the energy dissipation J caused by the change of material structure will become
J   =   σ ε ˙ m m + 1
When the deformation temperature and deformation amount (plastic strain) are constant, the ratio between the energy consumed by the plastic deformation and the energy consumed by the change of the structure in the thermal deformation process of the material is mainly affected by the strain rate sensitive index m, which satisfies Equation (25).
m   =   J G   =   ε ˙ d σ σ d ε ˙
When the material meets the ideal linear power dissipation system, the strain rate sensitivity index of the material in the thermal deformation process is m = 1. On this condition, the energy dissipation J caused by the change of material structure reaches the maximum value Jmax. According to Equation (24), the Jmax can be written as
J m a x   =     σ ε ˙ 2
Take J/Jmax as the energy dissipation factor η, which is used to represent the ratio between the dissipated energy of the microstructure structure transformation and the ideal linear dissipated energy. The expression of the power dissipation coefficient can be obtained from the definition of the energy dissipation factor η and the Murty criterion [17].
η   =   2 ( 1 0 ε ˙ σ d ε ˙ )
When the material flow stress model satisfies the exponential constitutive model shown in Equation (17), the expression of energy dissipation factor η under this condition can be obtained according to Equations (24) and 26).
η   =   2 m m + 1
The greater the value of the energy dissipation factor η, the greater the change of the microstructure of the material during the deformation. The energy consumed by the microstructure changes not only includes the energy needed to improve the deformation capacity, refine the microstructure of the dynamic recovery and dynamic recrystallization, but also includes the energy consumption of various microscopic defects that do not utilize plastic deformation, such as voids, adiabatic shear bands, wedge-shaped cracking and other microscopic defects. Therefore, in the power dissipation diagram, it is not the higher the power dissipation rate, the better the forming performance of the material. In this paper, the flow instability criterion proposed by Prasad [16] is used as the instability criterion for 2219 aluminum alloy during thermal deformation. That is,
ζ ( ε ˙ )   =   l n ( m m + 1 ) l n ε ˙ + m < 0
where ζ( ε ˙ ) is instability factors and is a function of strain rate and deformation temperature. When ( ε ˙ ) < 0, the fluidity instability will occur during the thermal deformation.
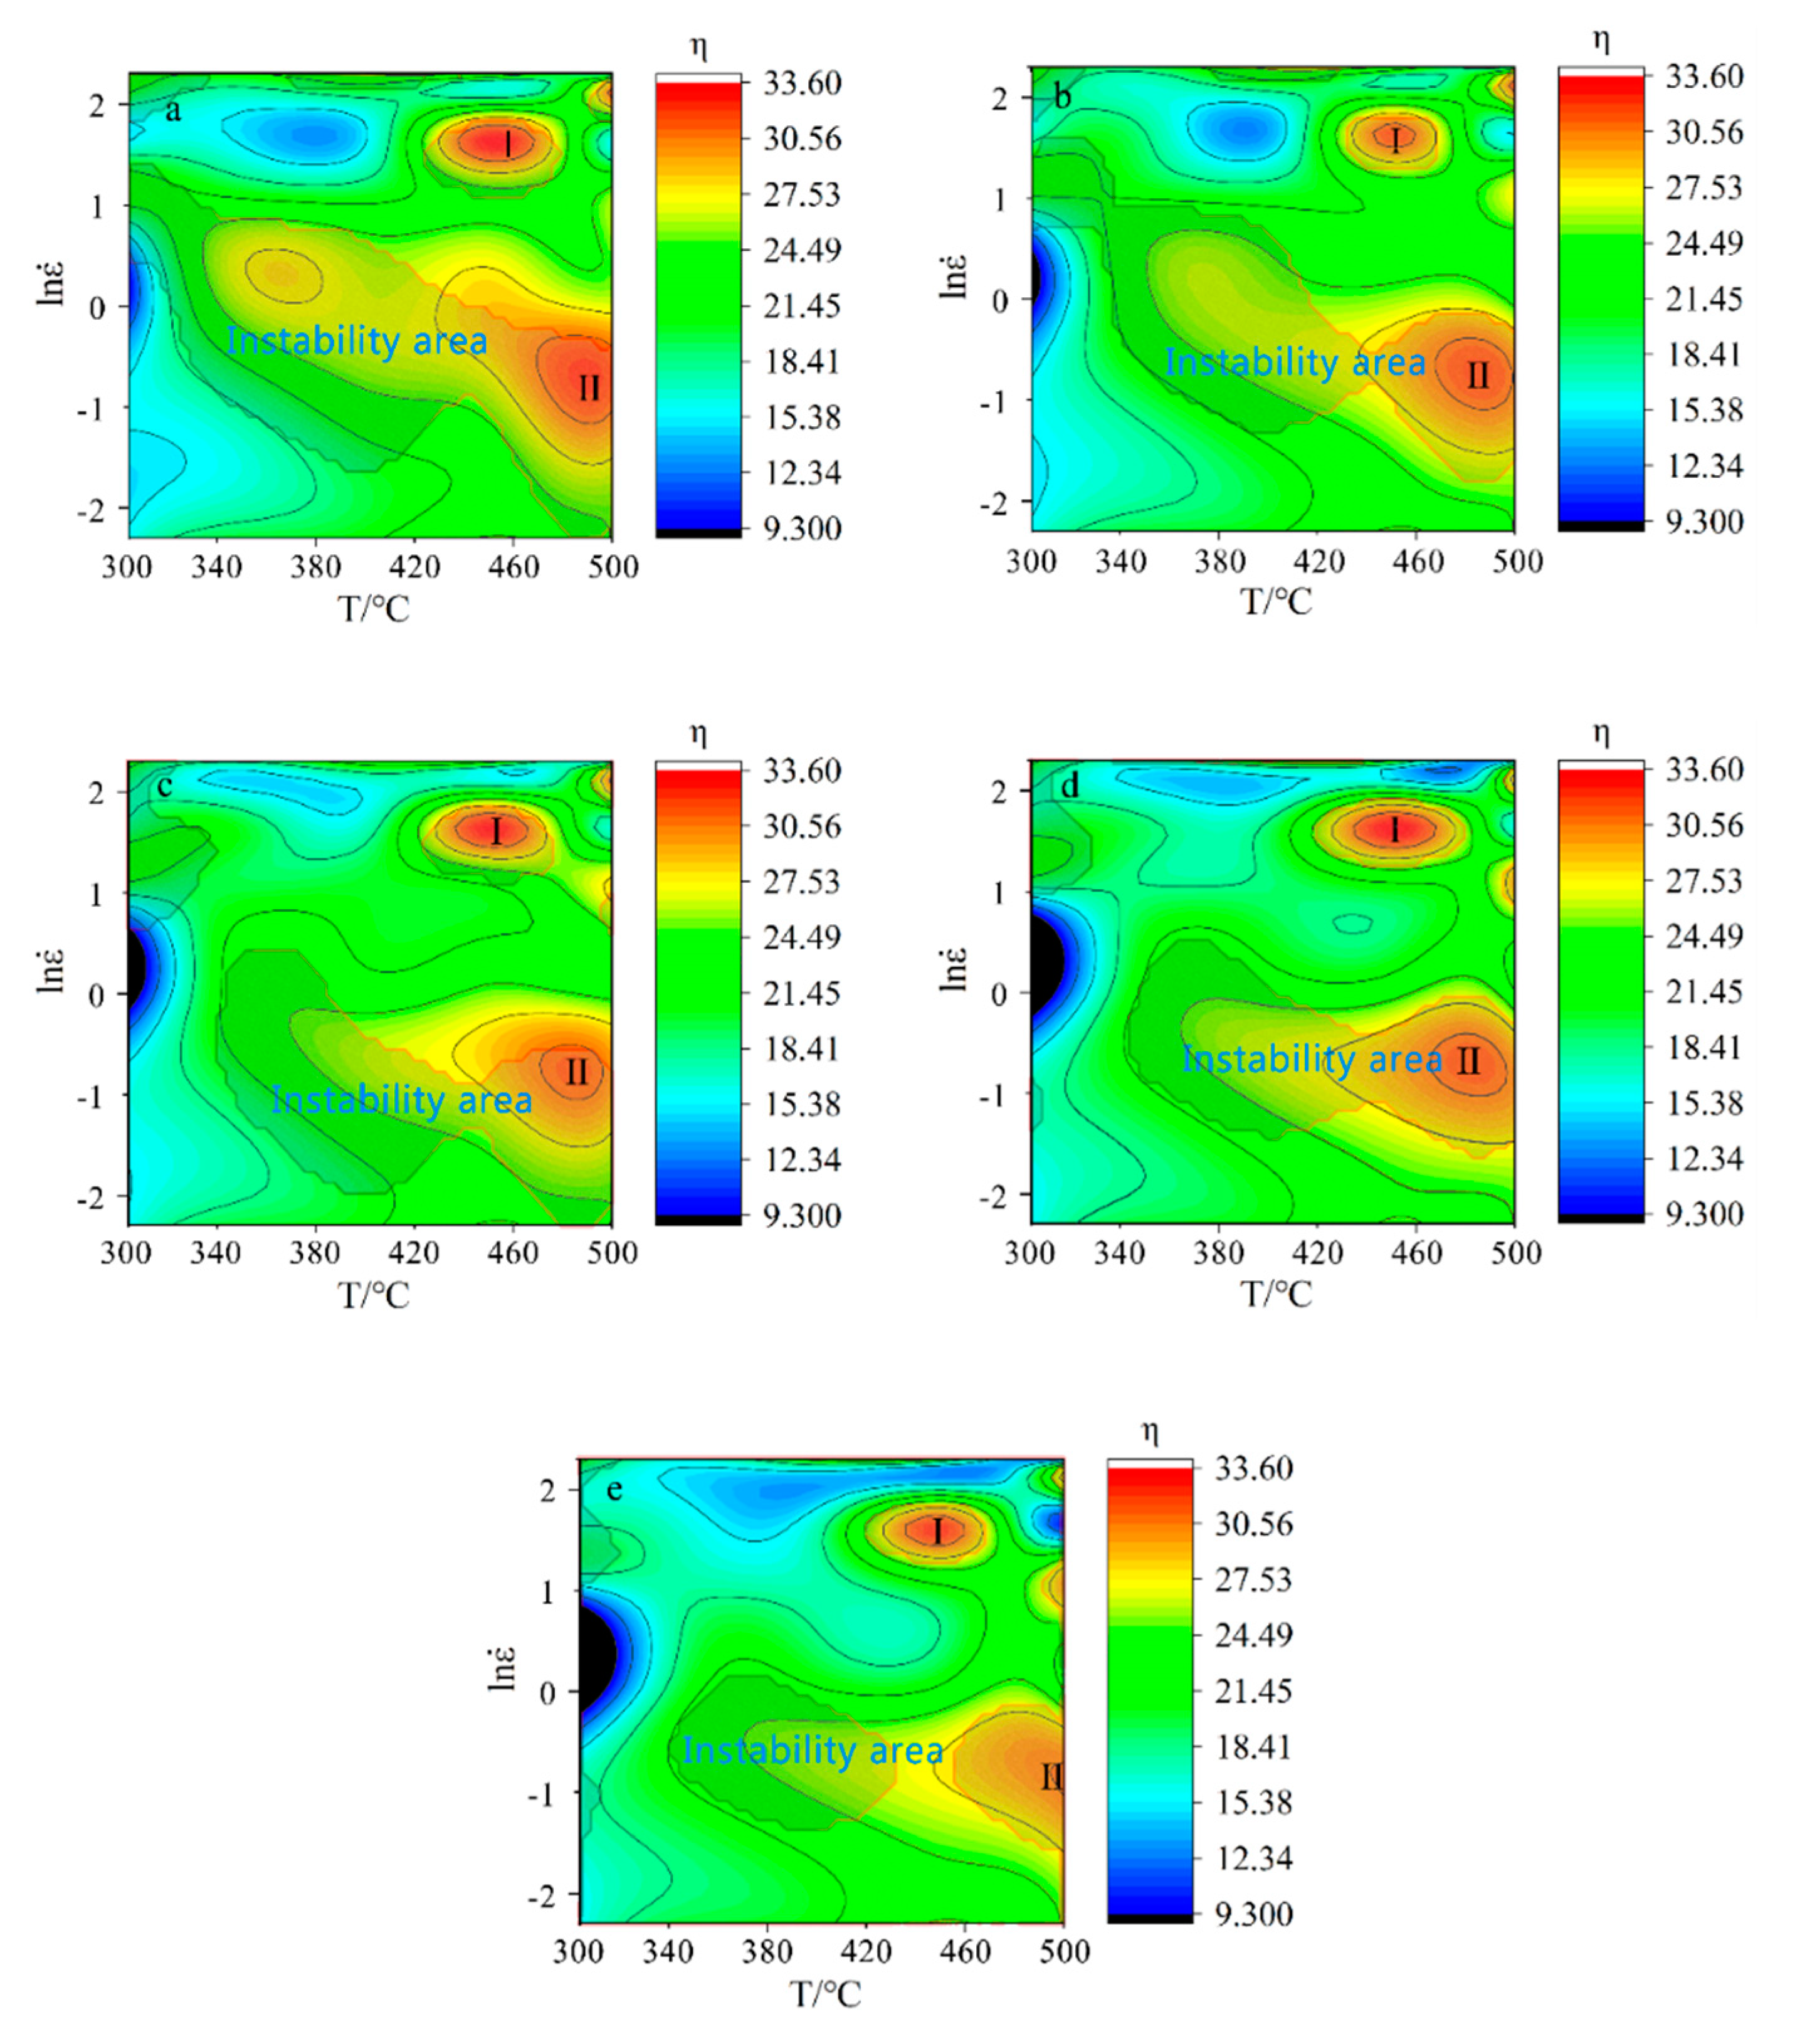
The exponential constitutive model and test results of 2219 aluminum alloy established in Section 2 of this paper are introduced into Equations (28) and (29); the energy dissipation diagram and plastic instability diagram of 2219 aluminum alloy under different strains can be drawn respectively. Then, the processing map of 2219 aluminum alloy under different thermal deformation conditions can be obtained by superpositioning the energy dissipation diagram and the plastic instability diagram, as shown in Figure 15. In the processing map, the contour line represents the percentage of power dissipation efficiency, and the shaded part represents the plastic instability area.
According to the processing map of 2219 aluminum alloy, we can see that in the process of thermal deformation, the energy dissipation formed two peak areas, as shown in Figure 15 (areas Ⅰ and Ⅱ). By comparing these with the plastic instability area, it is found that the energy dissipating peak area is also the plastic instability area of 2219 aluminum alloy in thermal deformation process.
When the 2219 aluminum alloy is deformed under the peak zone of energy dissipation Ⅰ conditions (deformation temperature, 420 °C < T < 460 °C, strain rate, 4.2 s−1 < ε ˙ < 5.7 s−1), due to the high strain rate, the material does not have enough time to make the deformation temperature diffusion and perform dynamic recrystallization. Therefore, the local temperature of the deformed specimen is increased, and the deformation inhomogeneity of the specimen is increased. Then the material shows cavities, adiabatic shear bands, wedge-shaped cracks and other microscopic defects. Thus, the 2219 aluminum alloy is prone to plastic instability during deformation under this deformation condition.
When the 2219 aluminum alloy is deformed under the peak zone of energy dissipation Ⅱ conditions (deformation temperature, 470 °C < T < 500 °C, strain rate, 0.25 s−1 < ε ˙ < 0.65 s−1), with the increase of deformation temperature, although the driving force of recrystallization is enhanced, the tendency of recrystallization grains to grow continuously increases under the conditions of high temperature and low strain rate, which makes the recrystallization grains of 2219 aluminum alloy larger. Therefore, this will cause instability in the 2219 aluminum alloy in the deformation process.
By comparing the processing map under different strain conditions, it can be seen that the area of plastic instability zone decreases gradually with the increase of strain. Under the same deformation temperature, the lower the strain rate, the less possibility of plastic instability. Under the same strain rate condition, with the increase of deformation temperature, the power dissipation efficiency increases gradually in the plastic deformation process, and the driving force of the 2219 aluminum alloy to change its microstructure increases gradually. The comprehensive analysis shows that the optimal thermal deformation conditions of 2219 aluminum alloy are a deformation temperature range of 420 °C to 460 °C and a strain rate of no more than 0.3 s−1.

5. Conclusions

  • The deformation behavior of 2219 aluminum alloy in high temperatures is greatly influenced by the deformation temperature and deformation velocity. The rheological stress is the result of the interaction of three mechanisms, namely, high-temperature softening, strain hardening and deformation rate hardening. At the same deformation rate, the softening effect is enhanced with the increase of the deformation temperature. At the same deformation temperature, with the increase of the deformation rate, the rheological stress gradually increases, and the 2219 aluminum alloy is a positive strain rate sensitive material.
  • The Arrhenius-type constitutive model of 2219 aluminum alloy was established. Through a comparison with the experimental data, the correlation coefficient between the predicted results of the Arrhenius-type constitutive model and the experimental results is R = 0.995, and the average relative error AARE = 3.542%.
  • The exponential constitutive model considering the influence of temperature and strain rate was established. The correlation coefficient between the predicted results and the test results is R = 0.996 and the average relative error AARE = 3.789%.
  • According to the dynamic material model proposed by Prasad, the processing map of 2219 aluminum alloy was established. During thermal deformation, the two peak zones of energy dissipation of 2219 aluminum alloy coincide with the plastic instability zone. Under the condition of high temperature plastic deformation, the area of the plastic instability zone decreases gradually with the increase of strain. Under the same deformation temperature, the lower the strain rate, the less possibility of plastic instability. The optimal thermal deformation conditions of 2219 aluminum alloy are as follows: deformation temperature range is 420 °C to 460 °C, strain rate is not greater than 0.3 s−1.

Author Contributions

Methodology, investigation, review and editing, supervision. X.-D.J.; original draft preparation, visualization, Y.-N.W.; visualization, Y.Z.; review M.-Y.C. All authors have read and agreed to the published version of the manuscript.

Funding

This research was funded by the National Natural Science Foundation of China (51775480), Natural Science Foundation of Jiangsu Higher Education Institutions of China (18KJB460020); High-level (Higher Education) Science Foundation of Nanjing Forestry University (GXL2018020); Youth Science and Technology Innovation Foundation of Nanjing Forestry University (CX2018027).

Acknowledgments

The experiment was supported by the key Laboratory of Advanced Forging & Stamping Technology and Science (Yanshan University), Ministry of Education of China, Qinhuangdao.

Conflicts of Interest

The authors declare no conflict of interest.

References

  1. An, L.-H.; Cai, Y.; Liu, W.; Yuan, S.-J.; Zhu, S.-Q.; Meng, F.-C. Effect of pre-deformation on microstructure and mechanical properties of 2219 aluminum alloy sheet by thermomechanical treatment. Trans. Nonferrous Met. Soc. China 2012, 22, s370–s375. [Google Scholar] [CrossRef]
  2. Liu, H.J.; Zhang, H.J.; Huang, Y.X.; Yu, L. Mechanical properties of underwater friction stir welded 2219 aluminum alloy. Trans. Nonferrous Met. Soc. China 2010, 20, 1387–1391. [Google Scholar] [CrossRef]
  3. Wu, Q.; Wu, J.; Zhang, Y.-D.; Gao, H.-J.; Hui, D. Analysis and homogenization of residual stress in aerospace ring rolling process of 2219 aluminum alloy using thermal stress relief method. Int. J. Mech. Sci. 2019, 111–118. [Google Scholar] [CrossRef]
  4. Qu, W.Q.; Song, M.Y.; Yao, J.S.; Zhao, H.Y. Effect of Temperature and Heat Treatment Status on the Ductile Fracture Toughness of 2219 Aluminum Alloy. Mater. Sci. Forum 2011, 689, 302–307. [Google Scholar] [CrossRef]
  5. Chen, S.; Li, F.; Liu, Q.; Chen, K.; Huang, L. Effect of Post-aging Heat Treatment on Strength and Local Corrosion Behavior of Ultrafine-Grained 2219 Al Alloy. J. Mater. Eng. Perform. 2020, 29, 3420–3431. [Google Scholar] [CrossRef]
  6. Zhang, J.; Chen, B.; Baoxiang, Z. Effect of initial microstructure on the hot compression deformation behavior of a 2219 aluminum alloy. Mater. Des. 2012, 34, 15–21. [Google Scholar] [CrossRef]
  7. Liu, L.; Wu, Y.-X.; Gong, H.; Wang, K. Modification of constitutive model and evolution of activation energy on 2219 aluminum alloy during warm deformation process. Trans. Nonferrous Met. Soc. China 2019, 29, 448–459. [Google Scholar] [CrossRef]
  8. Ghosh, R.; Venugopal, A.; Rao, G.S.; Narayanan, P.R.; Pant, B.; Cherian, R.M. Effect of Temper Condition on the Corrosion and Fatigue Performance of AA2219 Aluminum Alloy. J. Mater. Eng. Perform. 2018, 27, 423–433. [Google Scholar] [CrossRef]
  9. Olasumboye, A.; Owolabi, G.; Odeshi, A.; Zeytinci, A.; Yilmaz, N. Dynamic Response and Microstructure Evolution of AA2219-T4 and AA2219-T6 Aluminum Alloys. J. Dyn. Behav. Mater. 2018, 4, 162–178. [Google Scholar] [CrossRef]
  10. Fang, J.; Yi, Y.P.; Huang, S.Q.; He, H.L.; Guo, W.F. Influence of Pre-tensile Deformation on the Microstructure and Mechanical Properties of 2219 Aluminum Alloy Forgings. Mater. Rep. 2019, 33, 3062–3066. [Google Scholar] [CrossRef]
  11. Lu, Y.; Wang, J.; Li, X.; Li, W.; Li, R.; Zhou, D. Effects of pre-deformation on the microstructures and corrosion behavior of 2219 aluminum alloys. Mater. Sci. Eng. A 2018, 723, 204–211. [Google Scholar] [CrossRef]
  12. Zhang, Y.; Jiang, R.; Yang, Y.; Li, R.; Chen, P.; Li, X.; Zhang, L. Hot Deformation Behavior and Microstructure Mechanisms of As-Cast 2219 Al Alloy. JOM 2020, 72, 1638–1646. [Google Scholar] [CrossRef]
  13. Raj, R. Development of a possessing map for use in warm forming and hot forming processes. Metall. Mater. Trans. A 1981, 12, 1089–1097. [Google Scholar] [CrossRef]
  14. Liu, J.; Wang, K.; Lu, S.; Gao, X.Y.; Zhou, F. Hot deformation behavior and processing map of Zr-4 alloy. J. Nucl. Mater. 2020, 531, 151993. [Google Scholar] [CrossRef]
  15. Wang, Y.J.; Wnag, K.L.; Lu, S.Q.; Xu, Q.X. Hot Deformation Behavior and Forging Process Optimization of MoLa Alloy Based on Polar Reciprocity Model. Rare Met. Mater. Eng. 2018, 47, 279–285. [Google Scholar]
  16. Prasad, Y.V.R.K.; Gegel, H.L.; Doraivelu, S.M.; Malas, J.C.; Morgan, J.T.; Lark, K.A.; Barker, D.R. Modeling of dynamic material behavior in hot deformation: Forging of Ti-6242. Met. Mater. Trans. A 1984, 15, 1883–1892. [Google Scholar] [CrossRef]
  17. Murty, S.; Rao, B. On the development of instability criteria during hotworking with reference to IN 718. Mater. Sci. Eng. A 1998, 254, 76–82. [Google Scholar] [CrossRef]
  18. Liu, Q.; Hui, S.; Tong, K.; Yu, Y.; Ye, W.; Song, S.-Y. Investigation of high temperature behavior and processing map of Ti-6Al-4V-0.11Ru titanium alloy. J. Alloys Compd. 2019, 787, 527–536. [Google Scholar] [CrossRef]
  19. Yuan, C.-H.; Liu, B.; Liu, Y.-X.; Liu, Y. Processing map and hot deformation behavior of Ta-particle reinforced TiAl composite. Trans. Nonferrous Met. Soc. China 2020, 30, 657–667. [Google Scholar] [CrossRef]
  20. Narayana, P.L.; Li, C.-L.; Hong, J.-K.; Choi, S.-W.; Park, C.H.; Kim, S.-W.; Kim, S.E.; Reddy, N.S.; Yeom, J.-T. Characterization of Hot Deformation Behavior and Processing Maps of Ti–19Al–22Mo Alloy. Met. Mater. Int. 2019, 25, 1063–1071. [Google Scholar] [CrossRef]
  21. Chen, X.; Liao, Q.; Niu, Y.; Jia, Y.; Le, Q.; Ning, S.; Hu, C.; Hu, K.; Yu, F. Comparison study of hot deformation behavior and processing map of AZ80 magnesium alloy casted with and without ultrasonic vibration. J. Alloys Compd. 2019, 803, 585–596. [Google Scholar] [CrossRef]
  22. Yang, L.; Guan, Y.P.; Duan, Y.C.; Qu, X.Y. Hot Tensile Deformation Behavior and Processing Map of Rolled ME20M Magnesium Alloy. Rare Met. Mater. Eng. 2020, 49, 1715–1721. [Google Scholar]
  23. Qunying, Y.; Wenyi, L.; Zhiqing, Z.; Guangjie, H.; Xiaoyong, L. Hot Deformation Behavior and Processing Maps of AA7085 Aluminum Alloy. Rare Met. Mater. Eng. 2018, 47, 409–415. [Google Scholar] [CrossRef]
  24. Chen, L.; Zhao, G.; Gong, J.; Chen, X.; Chen, M. Hot Deformation Behaviors and Processing Maps of 2024 Aluminum Alloy in As-cast and Homogenized States. J. Mater. Eng. Perform. 2015, 24, 5002–5012. [Google Scholar] [CrossRef]
  25. Ke, B.; Ye, L.; Tang, J.; Zhang, Y.; Liu, S.; Lin, H.; Dong, Y.; Liu, X. Hot deformation behavior and 3D processing maps of AA7020 aluminum alloy. J. Alloys Compd. 2020, 845, 156113. [Google Scholar] [CrossRef]
  26. Sokolovsky, V.; Stepanov, N.; Zherebtsov, S.; Nochovnaya, N.; Panin, P.; Zhilyakova, M.; Popov, A.; Salishchev, G. Hot deformation behavior and processing maps of B and Gd containing β-solidified TiAl based alloy. Intermetallics 2018, 94, 138–151. [Google Scholar] [CrossRef]
  27. Zherebtsov, S.; Ozerov, M.; Klimova, M.; Moskovskikh, D.; Stepanov, N.; Salishchev, G. Mechanical Behavior and Microstructure Evolution of a Ti-15Mo/TiB Titanium–Matrix Composite during Hot Deformation. Metals 2019, 9, 1175. [Google Scholar] [CrossRef] [Green Version]
  28. Jing, W.; Qiang, L.; Ping, L. Hot Deformation Behavior and Microstructure Evolution of 2219/TiB2 Al-matrix Composite. Mater. Res. 2020, 23, 1–11. [Google Scholar] [CrossRef]
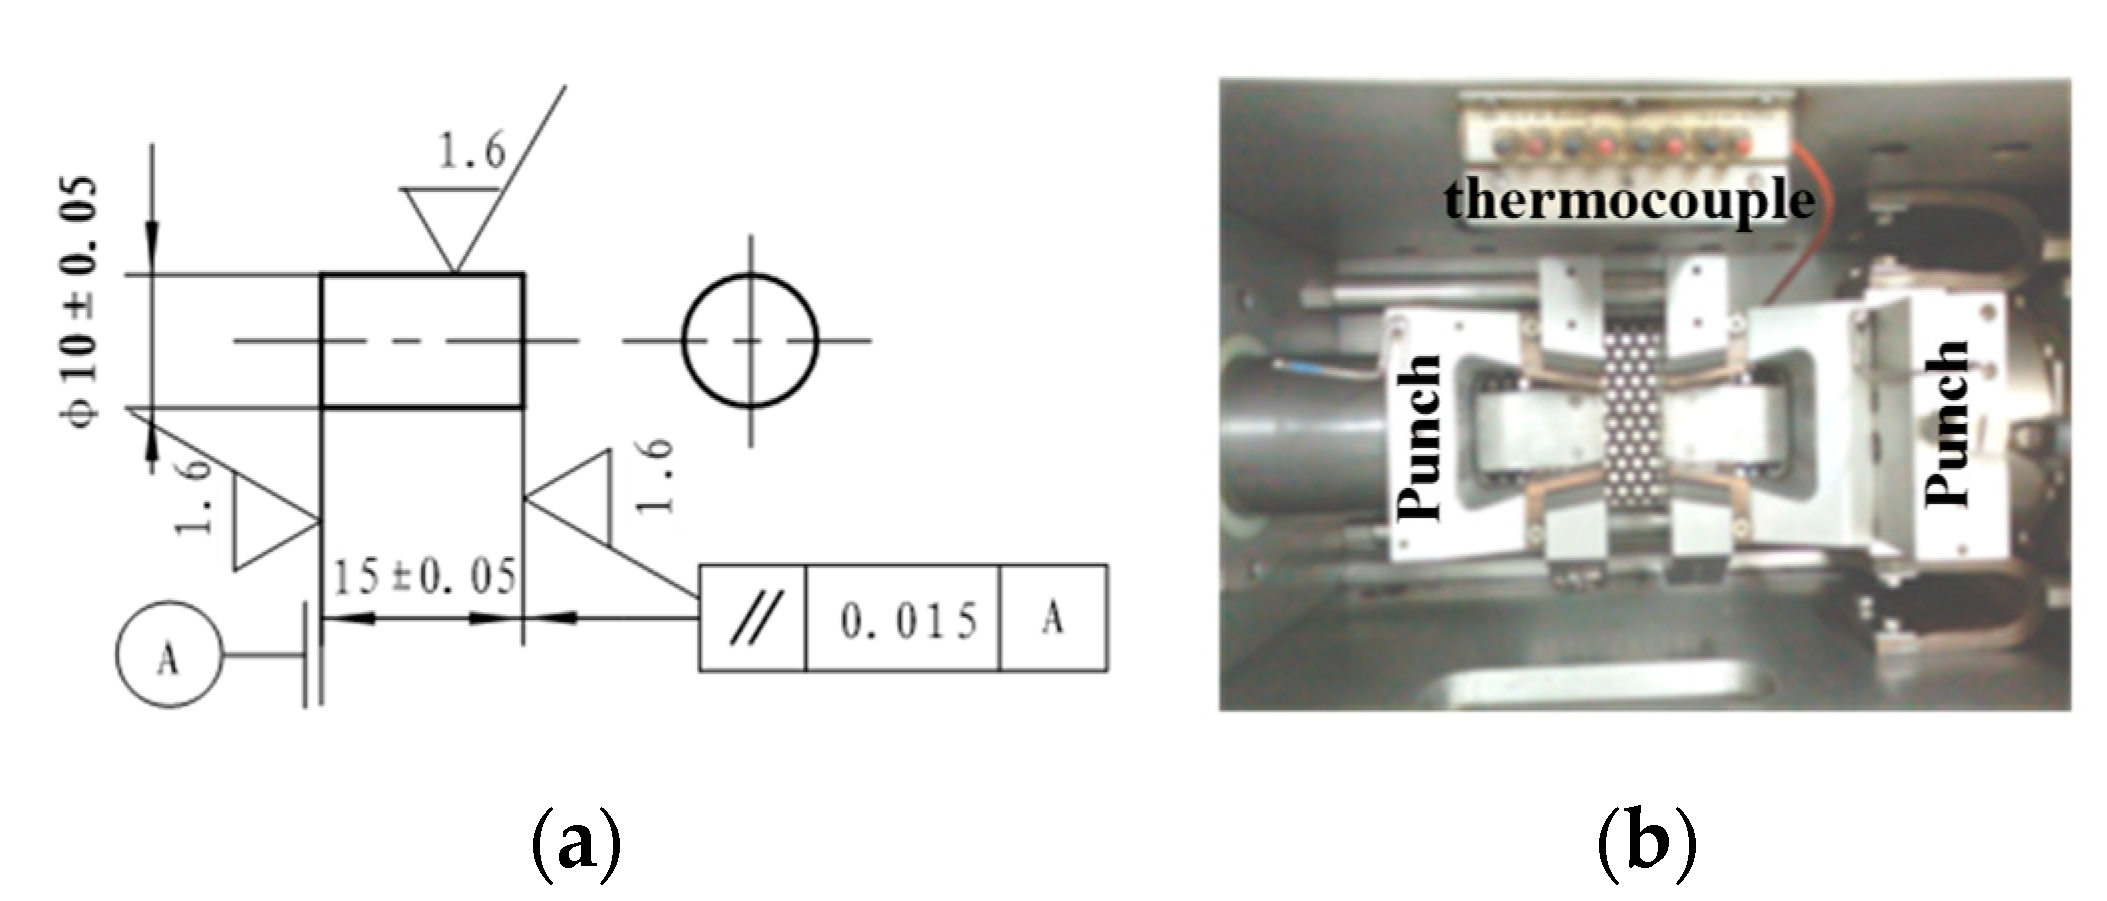
Figure 1. Specimens and test equipment: (a) size of test specimens (unit: mm); (b) loading equipment.
Metals 11 00077 g001
Figure 2. Thermal simulation process curve.
Metals 11 00077 g002
Figure 3. True stress–strain curves of 2219 aluminum alloy under different deformation conditions: (a) ε ˙ = 0.1 s−1; (b) ε ˙ = 1 s−1; (c) ε ˙ = 3 s−1; (d) ε ˙ = 5 s−1; (e) ε ˙ = 8 s−1; (f) ε ˙ = 10 s−1.
Metals 11 00077 g003
Figure 4. The influence of deformation temperature on steady flow stress.
Metals 11 00077 g004
Figure 5. The influence of the strain rate on steady flow stress.
Metals 11 00077 g005
Figure 6. The fitting curves for σ l n ε ˙ .
Metals 11 00077 g006
Figure 7. The fitting curves for l n σ l n ε ˙ .
Metals 11 00077 g007
Figure 8. The relation curve of l n s i n h ( α σ ) l n ε ˙ .
Metals 11 00077 g008
Figure 9. Relation curve of l n [ s i n h ( α σ ) ] 1 / T .
Metals 11 00077 g009
Figure 10. The fitting relationship curve between strain and material paraments: (a) Qε; (b) nε; (c) lnAε; (d) αε.
Metals 11 00077 g010
Figure 11. The prediction results for true stress-strain: (a) 0.1 s−1; (b) 1 s−1; (c) 5 s−1; (d) 10 s−1.
Metals 11 00077 g011
Figure 12. The value of the parameter m under different deformation temperatures.
Metals 11 00077 g012
Figure 13. The value of the parameter K under different deformation condition.
Metals 11 00077 g013
Figure 14. The perdition results based on the exponential constitutive model: (a) 0.1 s−1; (b) 1 s−1; (c) 5 s−1; (d) 10 s−1.
Metals 11 00077 g014
Figure 15. The processing map under different strain conditions: (a) ε = 0.15; (b) ε = 0.25; (c) ε = 0.35; (d) ε = 0.45; (e) ε = 0.55.
Metals 11 00077 g015
Table 1. Hot compression test scheme.
Heating TemperatureHeating RateDeformation TemperatureCooling RateHold TimeStrain Rate
500 °C10 °C/s300 °C5 °C/s5 min0.1 s−1
0.5 s−1
1 s−1
3 s−1
5 s−1
8 s−1
10 s−1
350 °C
400 °C
450 °C
480 °C
500 °C
Table 2. The values of n1, β and α under different deformation conditions.
Parameters300 °C350 °C400 °C450 °C480 °C500 °C
n112.0479.6038.8907.3617.60517.222
β0.085820.098320.124230.130810.155100.15271
α0.0071270.010240.013970.017770.020390.02115
Table 3. The values of n and lnA under different deformation conditions.
Parameters300 °C350 °C400 °C450 °C480 °C500 °C
n6.4916.6187.0986.3486.7776.484
lnA32.45330.90229.30729.38230.74630.825
Table 4. The values of Q under different deformation rates.
Parameter0.1 s−10.5 s−11 s−13 s−15 s−18 s−110 s−1
Q184,768.621175,816.573166,608.899167,040.577174,916.781175,370.157189,337.170
Table 5. The model parameter values under different strain conditions.
StrainQnLnAα
0.05144,588.9705.93824.8150.01333
0.1149,660.5926.01026.5880.01152
015154,130.1356.07827.4190.01135
0.2157,414.7236.11827.9920.01135
0.25162,739.4846.31029.1180.01116
0.3164,977.3586.35229.4130.01138
0.35167,103.4956.36329.6610.01167
0.4170,307.3426.43930.1380.01191
0.45171,912.1086.48630.3290.01216
0.5176,265.5406.63630.9800.01242
0.55180,006.2886.74331.4020.01284
Table 6. The value of parameter m at different temperatures.
Parameter300 °C350 °C400 °C450 °C480 °C500 °C
m0.08630.10950.12060.13550.14090.1382
Table 7. The value of material parameter K under different deformation conditions.
K300 °C350 °C400 °C450 °C480 °C500 °C
0.05127.077695.924872.116756.189252.872949.4418
0.1135.9259100.542874.335357.580153.232449.7229
015138.9989101.558175.178858.109353.236349.8727
0.2140.1107102.209875.182158.390452.935449.4976
0.25140.0622101.964774.744657.825952.355349.0345
0.3139.3609101.236474.303157.426652.018348.6364
0.35138.5305100.375273.643556.704051.559048.0543
0.4137.424699.442172.985056.086151.128447.4691
0.45136.190098.589172.076055.474350.714247.3152
0.5134.808397.799171.663955.098550.230647.0829
0.55133.656497.046471.179754.766150.095647.0190
Publisher’s Note: MDPI stays neutral with regard to jurisdictional claims in published maps and institutional affiliations.