Article

Holding Time Influence on the Hot Ductility Behavior of a Continuously Cast Low Alloy Steel

1
K1-MET GmbH, 4020 Linz, Austria
2
Graz University of Technology, Institute of Materials Science, Joining and Forming, Campus Neue Technik, 8010 Graz, Austria
3
voestalpine Stahl GmbH, 4020 Linz, Austria
*
Author to whom correspondence should be addressed.
Metals 2021, 11(1), 64; https://doi.org/10.3390/met11010064
Submission received: 17 November 2020 / Revised: 22 December 2020 / Accepted: 25 December 2020 / Published: 30 December 2020

Abstract

:
Cracking during the continuous casting process is undesirable and continuous work is being carried out to find further improvements and understand the mechanisms that lead to failure. Investigations on the hot ductility behavior of a continuously cast low alloyed steel using different holding times before straining were done in the present work. Samples were heated to melting temperature in a vacuum atmosphere and then cooled to one of the three test temperatures chosen: 750, 850, and 900 °C. When the desired temperature was reached, the sample was isothermally held for either 10, 90, 300, or 3600 s before the tensile test started, with a strain rate of 10−3 s−1. The reduction of area was measured, SEM images of the fractured surfaces were taken plus LOM images for the analysis of the microstructure. The results show that there was no significant change in the ductility at any of the temperatures until 300 s, with a change in behavior at 3600 s. This was further confirmed with the images and precipitation kinetics simulations. The results are described and compared.

1. Introduction

During the continuous casting of steels, surface and internal cracks can be originated by the different thermal and mechanical stresses present [1,2,3,4]. The physical simulation of the most widely used process in steel production is important for product quality and savings, once it can help the improvement of the hot ductility, consequently reducing the incidence of cracks [5,6]. Many process parameters can influence the hot ductility of the steel, one of them being the time between the cooling and the deformation phases, referred to as the holding time. The aim of this work is to investigate the influence of the holding time on the ductility behavior of a low alloyed steel, bringing a new approach to the analysis of this parameter by evaluating the results from physical experiments alongside the computer simulations of precipitation kinetics.
The hot ductility of low alloyed steels usually presents its minimum in the temperature range of 700 °C to 1000 °C, which is also the usual range of the bending and straightening operation in the continuous casting process and the most critical for the formation of cracks [2,5,7,8]. This lower ductility is known to be caused by two main factors, the austenite–ferrite transformation, and the nucleation of precipitates, depending strongly on the alloying elements present [6,9,10,11]. Due to the lower strength of ferrite in comparison to austenite, the strain that concentrates in the ferrite films formed in the austenite grain boundaries initiate cracks as a result [8,10,12]. In the context of the nucleation of precipitates, local hardening occurs, provoking stress concentration and promoting the initiation of cracks [4,12].
The procedure chosen in this work to physically simulate the industrial process is the hot tensile test, which is commonly used to determine the hot ductility curve for the material [3,5,6,9,12]. The evaluation of this parameter has been done for many years by the determination of the reduction of area (RA) of the samples tested [1,2,4,5,11].
The thermal cycle used to represent the process usually consists of heating the steel well above the austenitization temperature to dissolve the alloying elements and obtain a microstructure that is most similar to the material when it is being cast. This aims to represent the beginning of the casting process, with the molten steel. However, many of the works found in the literature do not reach the melting point during the experiment, and only approximate to the real process [3,5,8,10,13,14,15]. The in-situ melting of the samples during the investigation of the hot ductility is one of the important contributions offered by this work. After being heated to the higher temperature, samples are cooled at a selected cooling rate until the desired testing temperature is reached. On reaching this test temperature, the sample can go through an isothermal path for a determined time, the afore mentioned holding time, before the start of the tensile test.
The influence of the holding time on the hot ductility behavior of low alloyed steels has not been extensively explored, in contrast to other aspects of the processes such as cooling rate, strain rate, surface quality, and alloying elements. Moreover, the existing studies present diverse findings obtained by physical experiments, with no parallel simulations for comparison or confirmation.
Suzuki et al. [16], observed that for a plain carbon steel, the increase in the holding time prior the hot tensile test between 1200 °C and 800 °C leads to an increase in the RA, which represents an improvement of the hot ductility.
Kang et al. [14] also tested the hot ductility of low alloyed steels with different holding times, with the test temperatures selected as 900 °C and 1000 °C. The results showed that the sample with no special alloying element (Nb-free) was not influenced by the holding time, the one with Nb and Mn was slightly improved, and the other two with Nb contents of 0.031 and 0.062 wt% had their ductility significantly increased with the increase in the holding time.
Crowther and Mintz [15] performed experiments with steels with higher (0.068 wt%) and lower (0.017 wt%) Al content and reported that when there was more Al, RA reduced at higher holding times. This change in the RA was not seen for the lower Al steel. The work also showed that the different holding times did not affect the grain size or peak stresses. Lastly, at higher and lower temperatures, the ductility curves converged for both no holding time and long holding times.
Ouchi and Matsumoto [13] reported that the changes in holding time before the tensile test at temperatures lower than 1000 °C did not significantly influence the hot ductility, and that above this temperature, the changes were caused by more time for the coarsening and dissolution of the NbCN precipitates.
Zheng et al. [17] carried out different analyses for the hot ductility of C-Mn steels, also testing various holding times at the tensile test temperature of 950 °C and strain rate of 22 s−1. The reduction of area measured for each condition showed that there was no significant difference for low holding times (lower than 500 s). Only by holding for longer time periods could an improvement in the hot ductility of the steel be seen.
Balbi et al. [18] tested samples with only one final quenching after annealing and samples with intermediate and final quenching. The tensile tests were done at room temperature and for both groups, the different holding times at the annealing temperature before the tests did not reflect in the different tensile properties.
Due to the contrasting results found in literature, with different test methods, results and no parallel thermokinetic simulations, gathering more information on the influence of this parameter on the hot ductility behavior of a low alloyed steel is deemed necessary. Hot tensile tests on in-situ melted samples and simulations to predict the behavior of precipitation were done at three different temperatures, with four different holding times, analyzing the macro and microscopic results to give a more complete understanding of the behavior observed.

2. Materials and Methods

2.1. Experiments

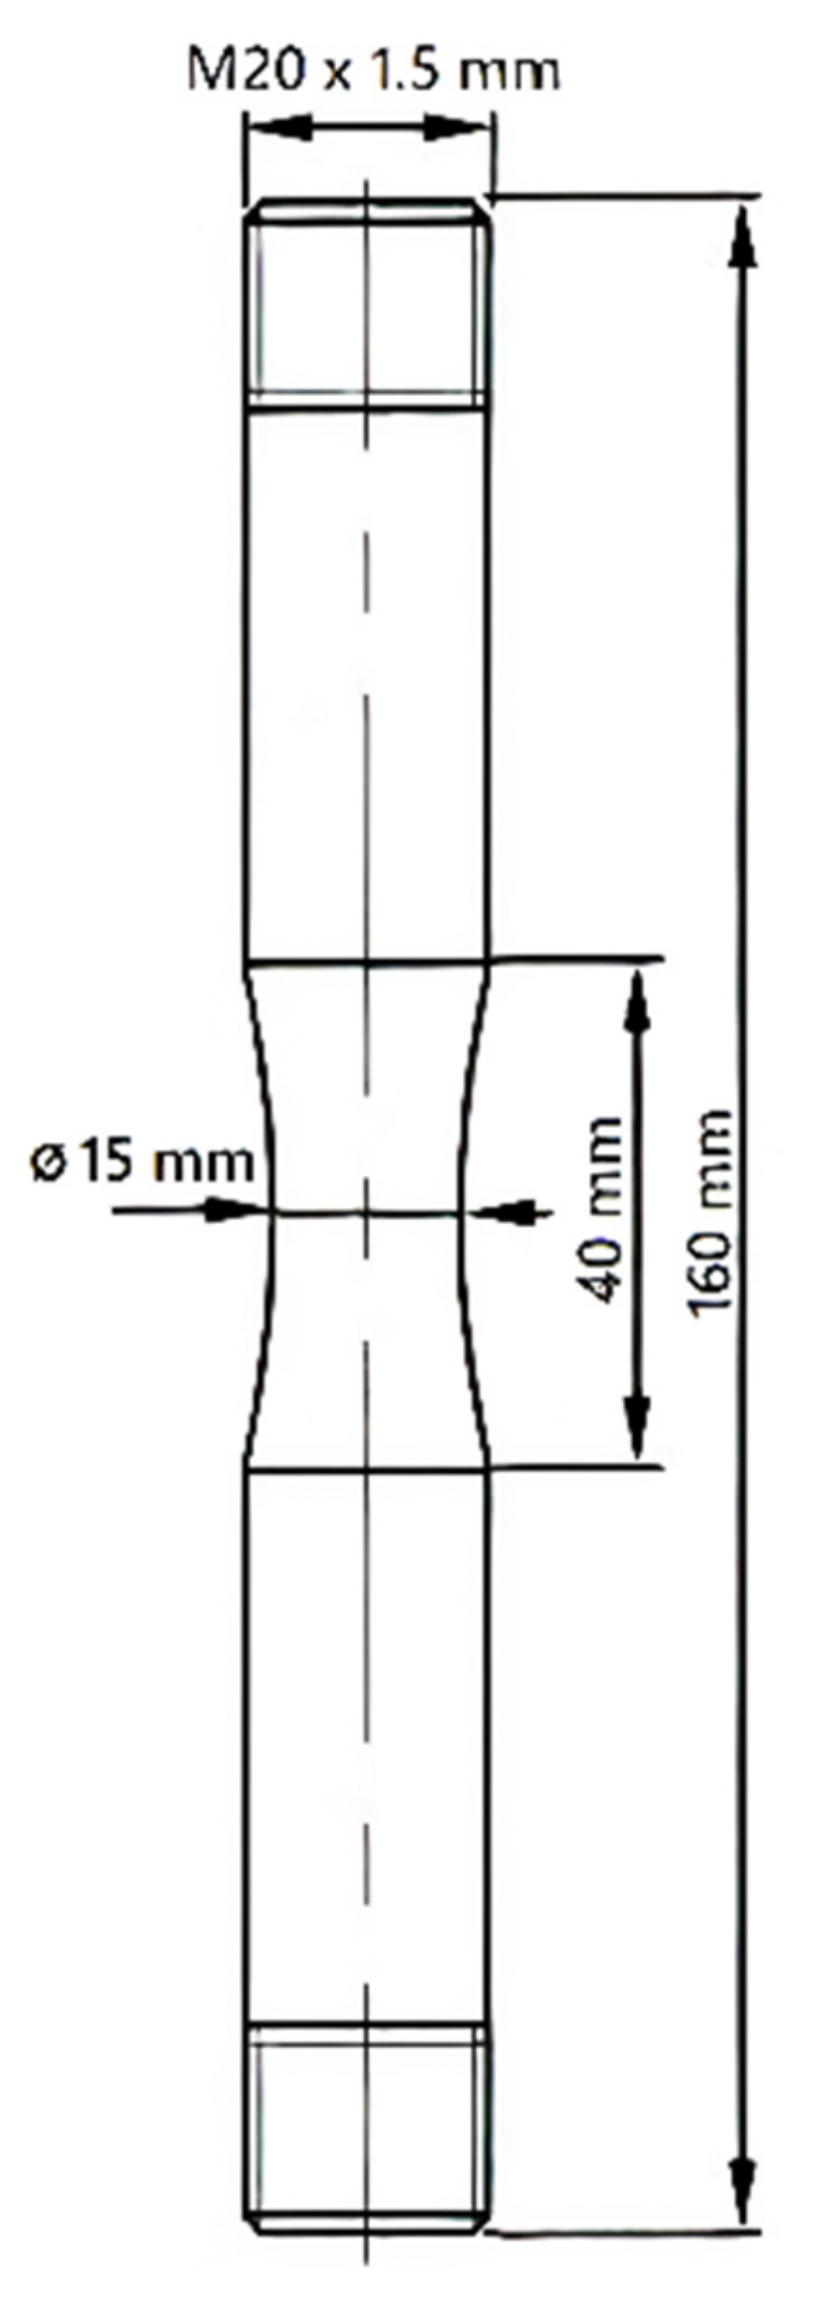
The low alloyed steel used for the experiments has the composition as described in Table 1. It was machined into cylindrical dog-bone shaped samples taken from the slab out of the continuous casting process, with the axis parallel to the rolling direction. The geometry of the samples is represented in Figure 1.
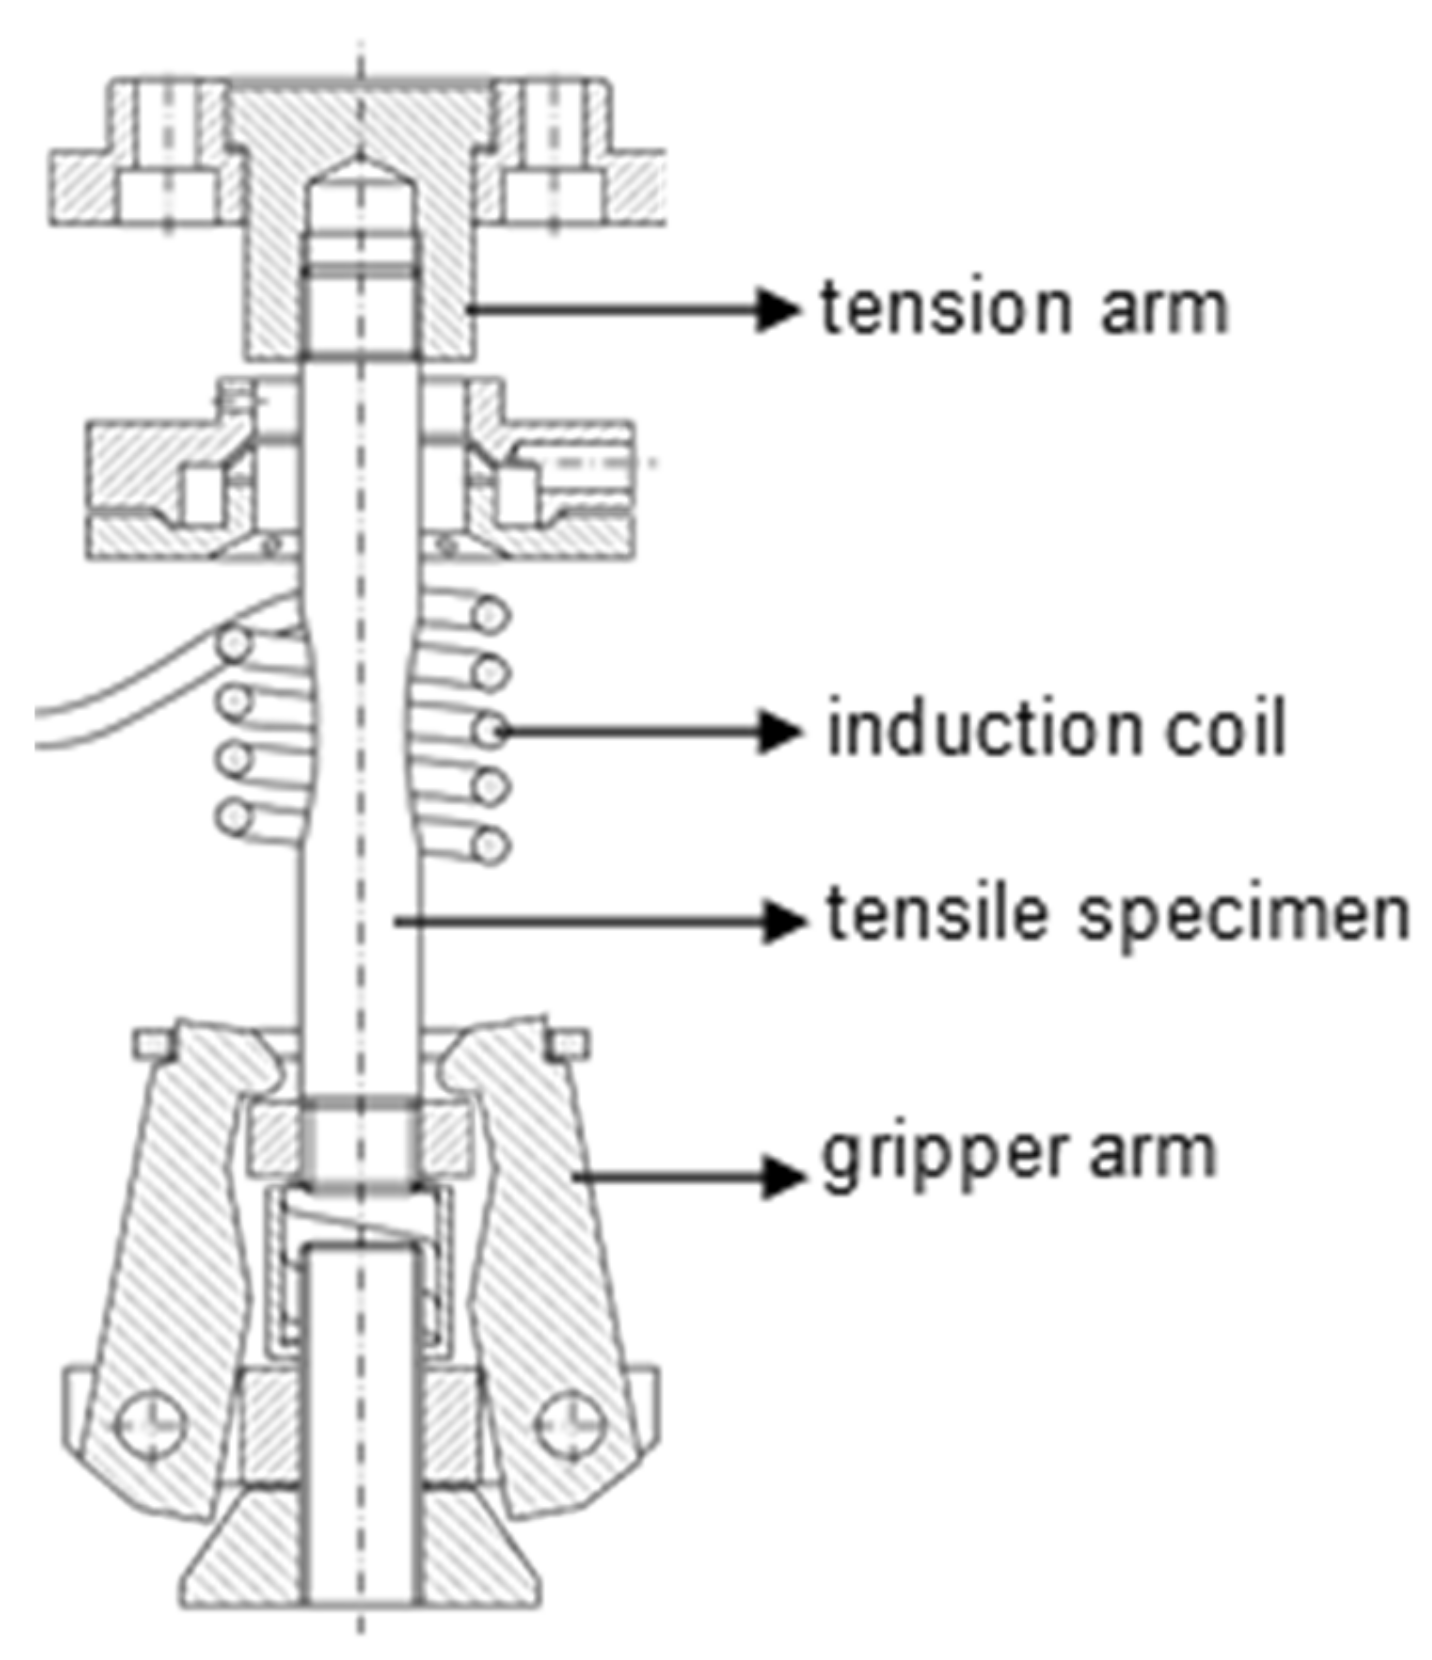
An in-house thermomechanical simulator with a vacuum atmosphere was used for the performance of the hot tensile tests. The simulator is a BETA 250-5, with tensile test unit delivered by Messphysik, Fürstenfeld, Austria, which was rebuilt from MTS (Mechanical Testing Systems), Eden Prairie, United States. Further improvements were done at Graz University of Technology. It is schematically represented in Figure 2.
The upper part of the sample is held by the tension arm of the machine, which is responsible for the displacement in the vertical direction. The lower part remains fixed and is supported by a spring and three gripper arms that compensate for the thermal expansion and give support during the melting cycle.
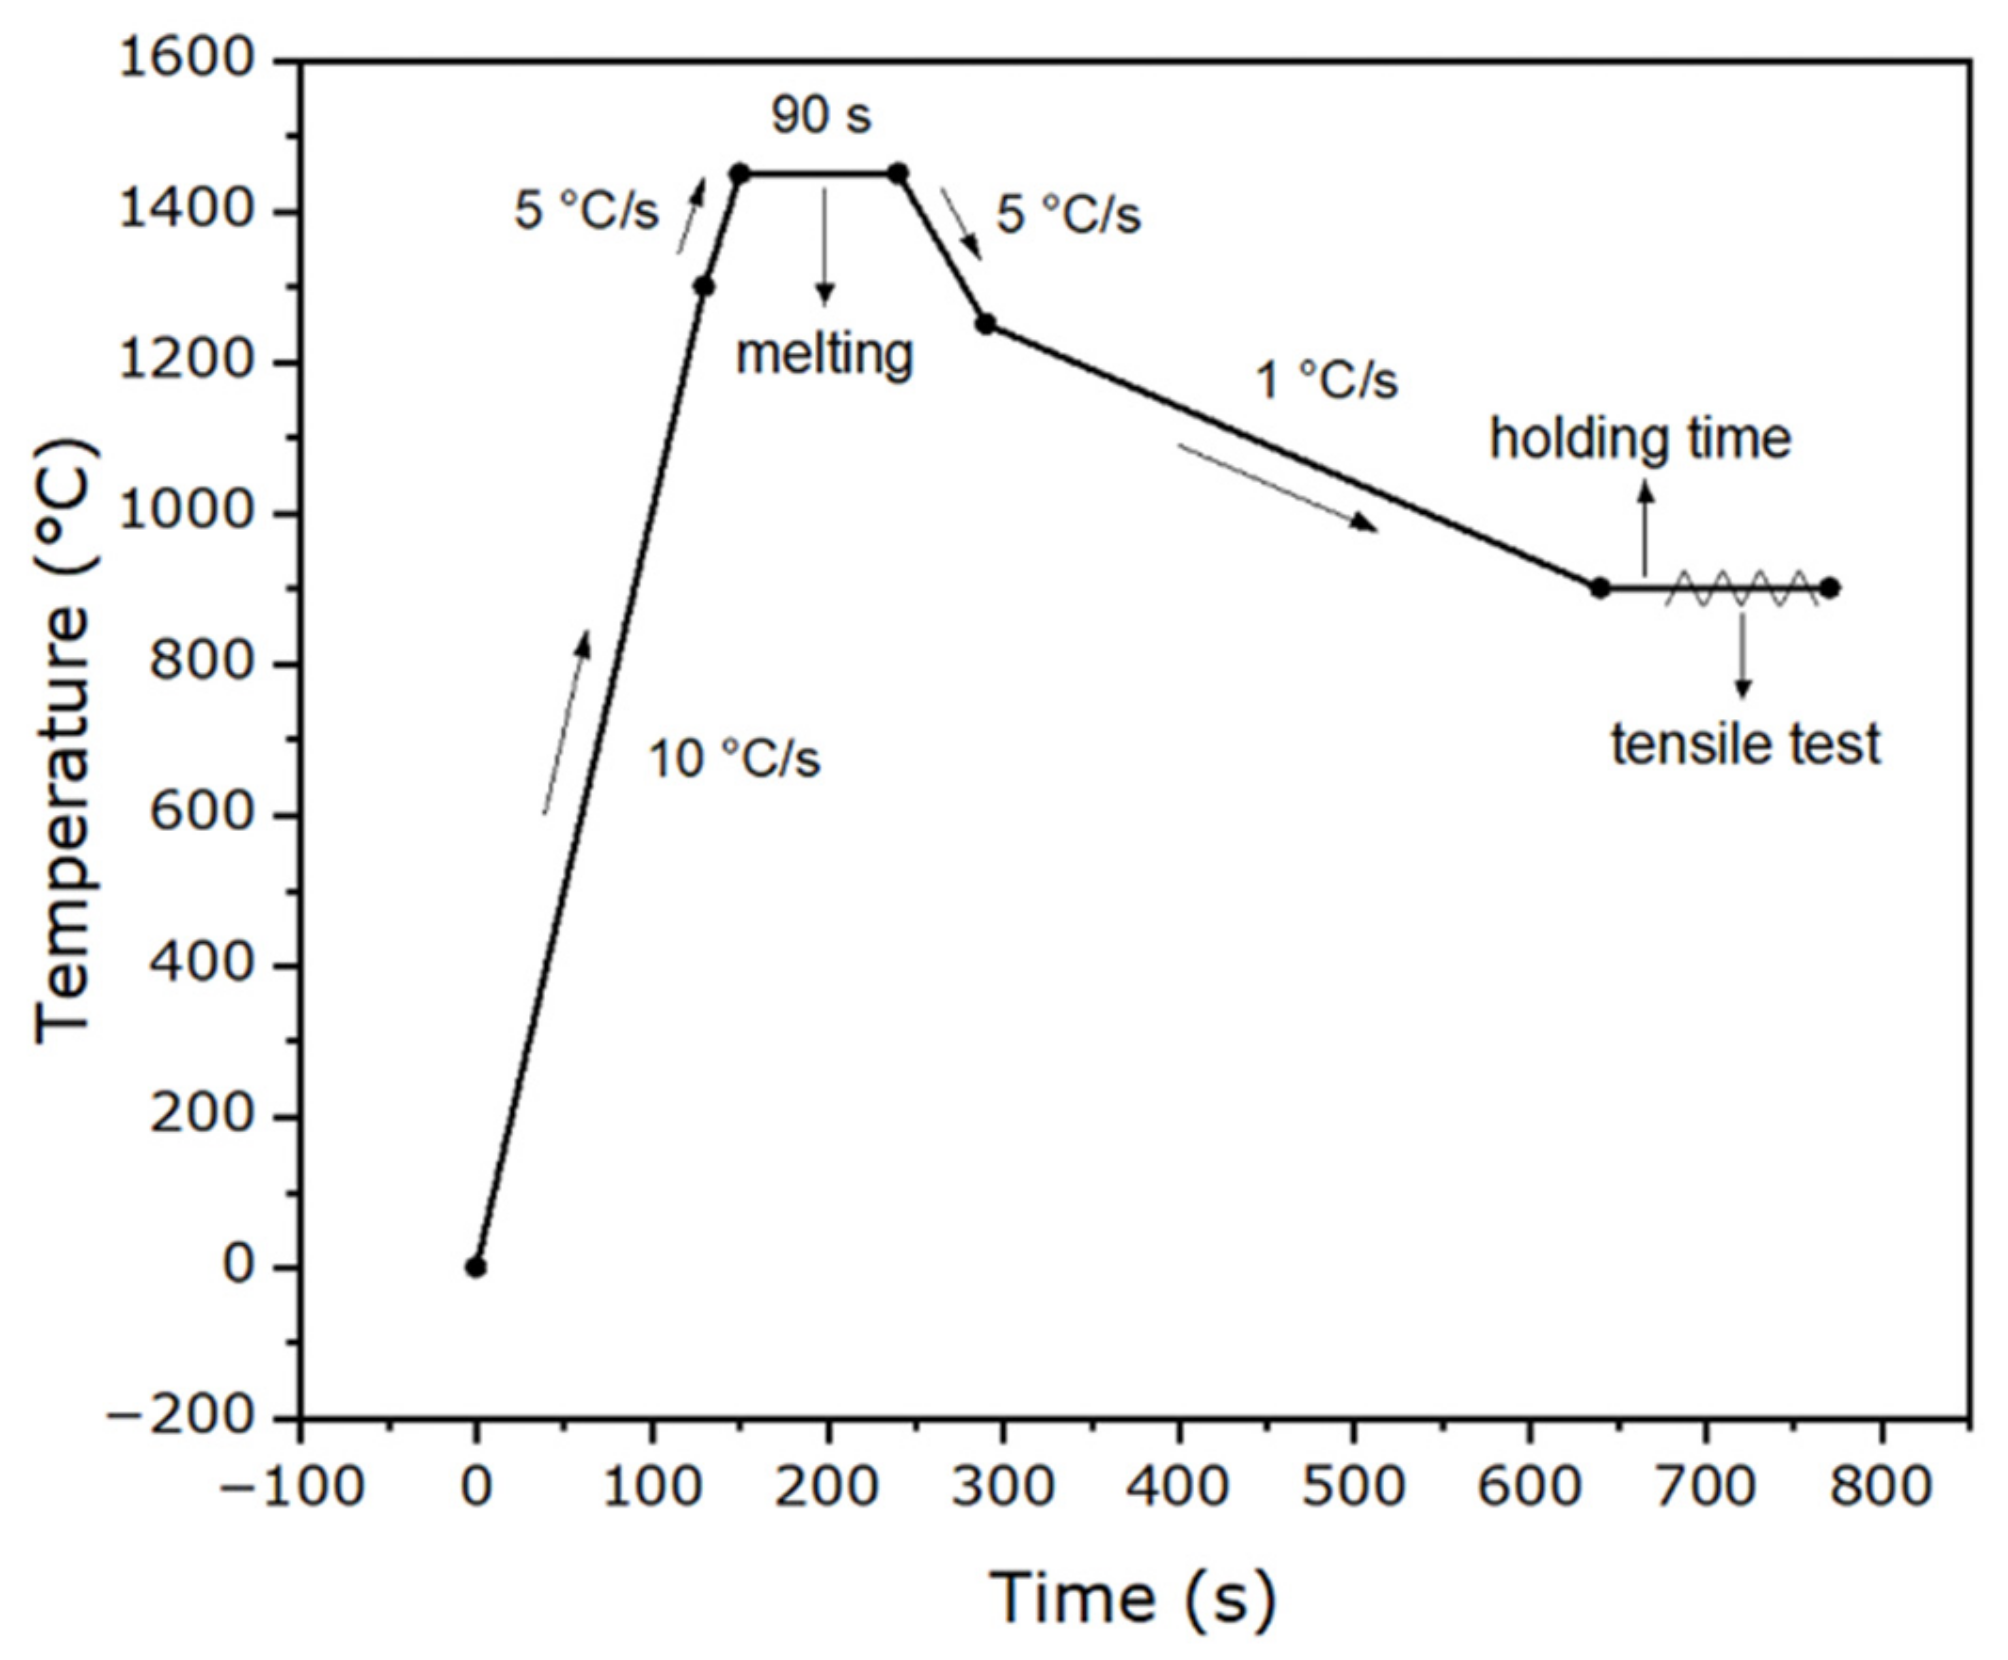
A Pt/Pt-Rh thermocouple was spot welded in the center of the sample for the measurement of the surface temperature. The samples were heated until melting temperature (the inside of the sample is melted when the measured surface temperature is around 1450 °C) with an induction coil. The possibility of melting the specimens in-situ is a unique feature of the machine used. By controlling the heat input and maintaining the pressure inside the vacuum chamber at 0.3 mbar, a thin and stable oxide layer is formed to prevent the molten steel from erupting.
The induction coil was linked to the upper part of the machine, moving upwards at half speed during the tensile test to keep the heating concentrated in the center of the specimen. The highest temperature was kept for 90 s before the beginning of the cooling path. By reaching the desired testing temperature (750 °C, 850 °C, or 900 °C), it was held for 10, 90, 300, or 3600 s before the start of the hot tensile test, which was performed with a strain rate of 10−3 s−1 until the rupture. The complete thermal cycle is represented in Figure 3.
After the rupture of the sample, the area of the fractured surface was optically measured with a Zeiss stereo microscope, model Discovery.V20 (Oberkochen, Germany). With this value, the reduction of area could be determined with the following equation:
% R A = A 0 A f A 0 × 100 ,
where RA is the reduction of area, A0 is the initial cross section area and Af is the measured fracture surface area.
The fracture surfaces were observed with a TESCAN Mira3 Field Emission scanning electron microscope (Dortmund, Germany) for the identification and comparison of the failure mechanism. Using an Axio Observer Inverted light optical microscope (LOM) from Zeiss (Oberkochen, Germany), the microstructure of the samples was further analyzed. The samples were polished and then etched with 3% Nital for this purpose.

2.2. Simulations

The software used for the simulations was the MatCalc (version 6.02), developed by MatCalc Engineering GmbH in Vienna, Austria [19]. Thermokinetic simulations were performed to have a prediction of the precipitation behavior during the thermal cycle considered. First, equilibrium calculations were done for the determination of the phase diagram. A Scheil–Gulliver solidification simulation was also performed to obtain information on the formation of primary precipitates.
Then, simulations of the precipitation kinetics of AlN and MnS at different temperatures and holding times were realized. The initial austenite grain diameter considered for that was 600 µm, the initial dislocation density was of 1011 m−2 and a volumetric misfit of 27% for AlN precipitates and 5% for MnS precipitates with the austenite matrix was considered [20].
Mean radius and number density simulations were performed at only two of the experimentally used testing temperatures, 900 °C and 850 °C. Lower temperatures were not simulated because of the higher amount of ferrite present simultaneously with austenite, a two-phase region that is not precisely modelled in the simulations. At these chosen temperatures, the holding times were also changed to evaluate the effect on the nucleation and evolution of precipitates. The durations chosen for the simulations were the same as those in the experiments; 10 s, 90 s, 300 s, and 3600 s. Furthermore, the duration of the straining during the simulations was defined based on the experiments being 230 s for the simulations at 850 °C, corresponding to a resulting strain of 23%, and 400 s for the ones at 900 °C, with a resulting strain of 40%.
MnS precipitates were considered to be formed only at dislocations (d) and AlN at grain boundaries (gb), at MnS precipitates and dislocations [20,21]. However, the amount of AlN seen in the simulations to be formed at dislocations was too small and thus not considered in the results.

3. Results

3.1. Experiments

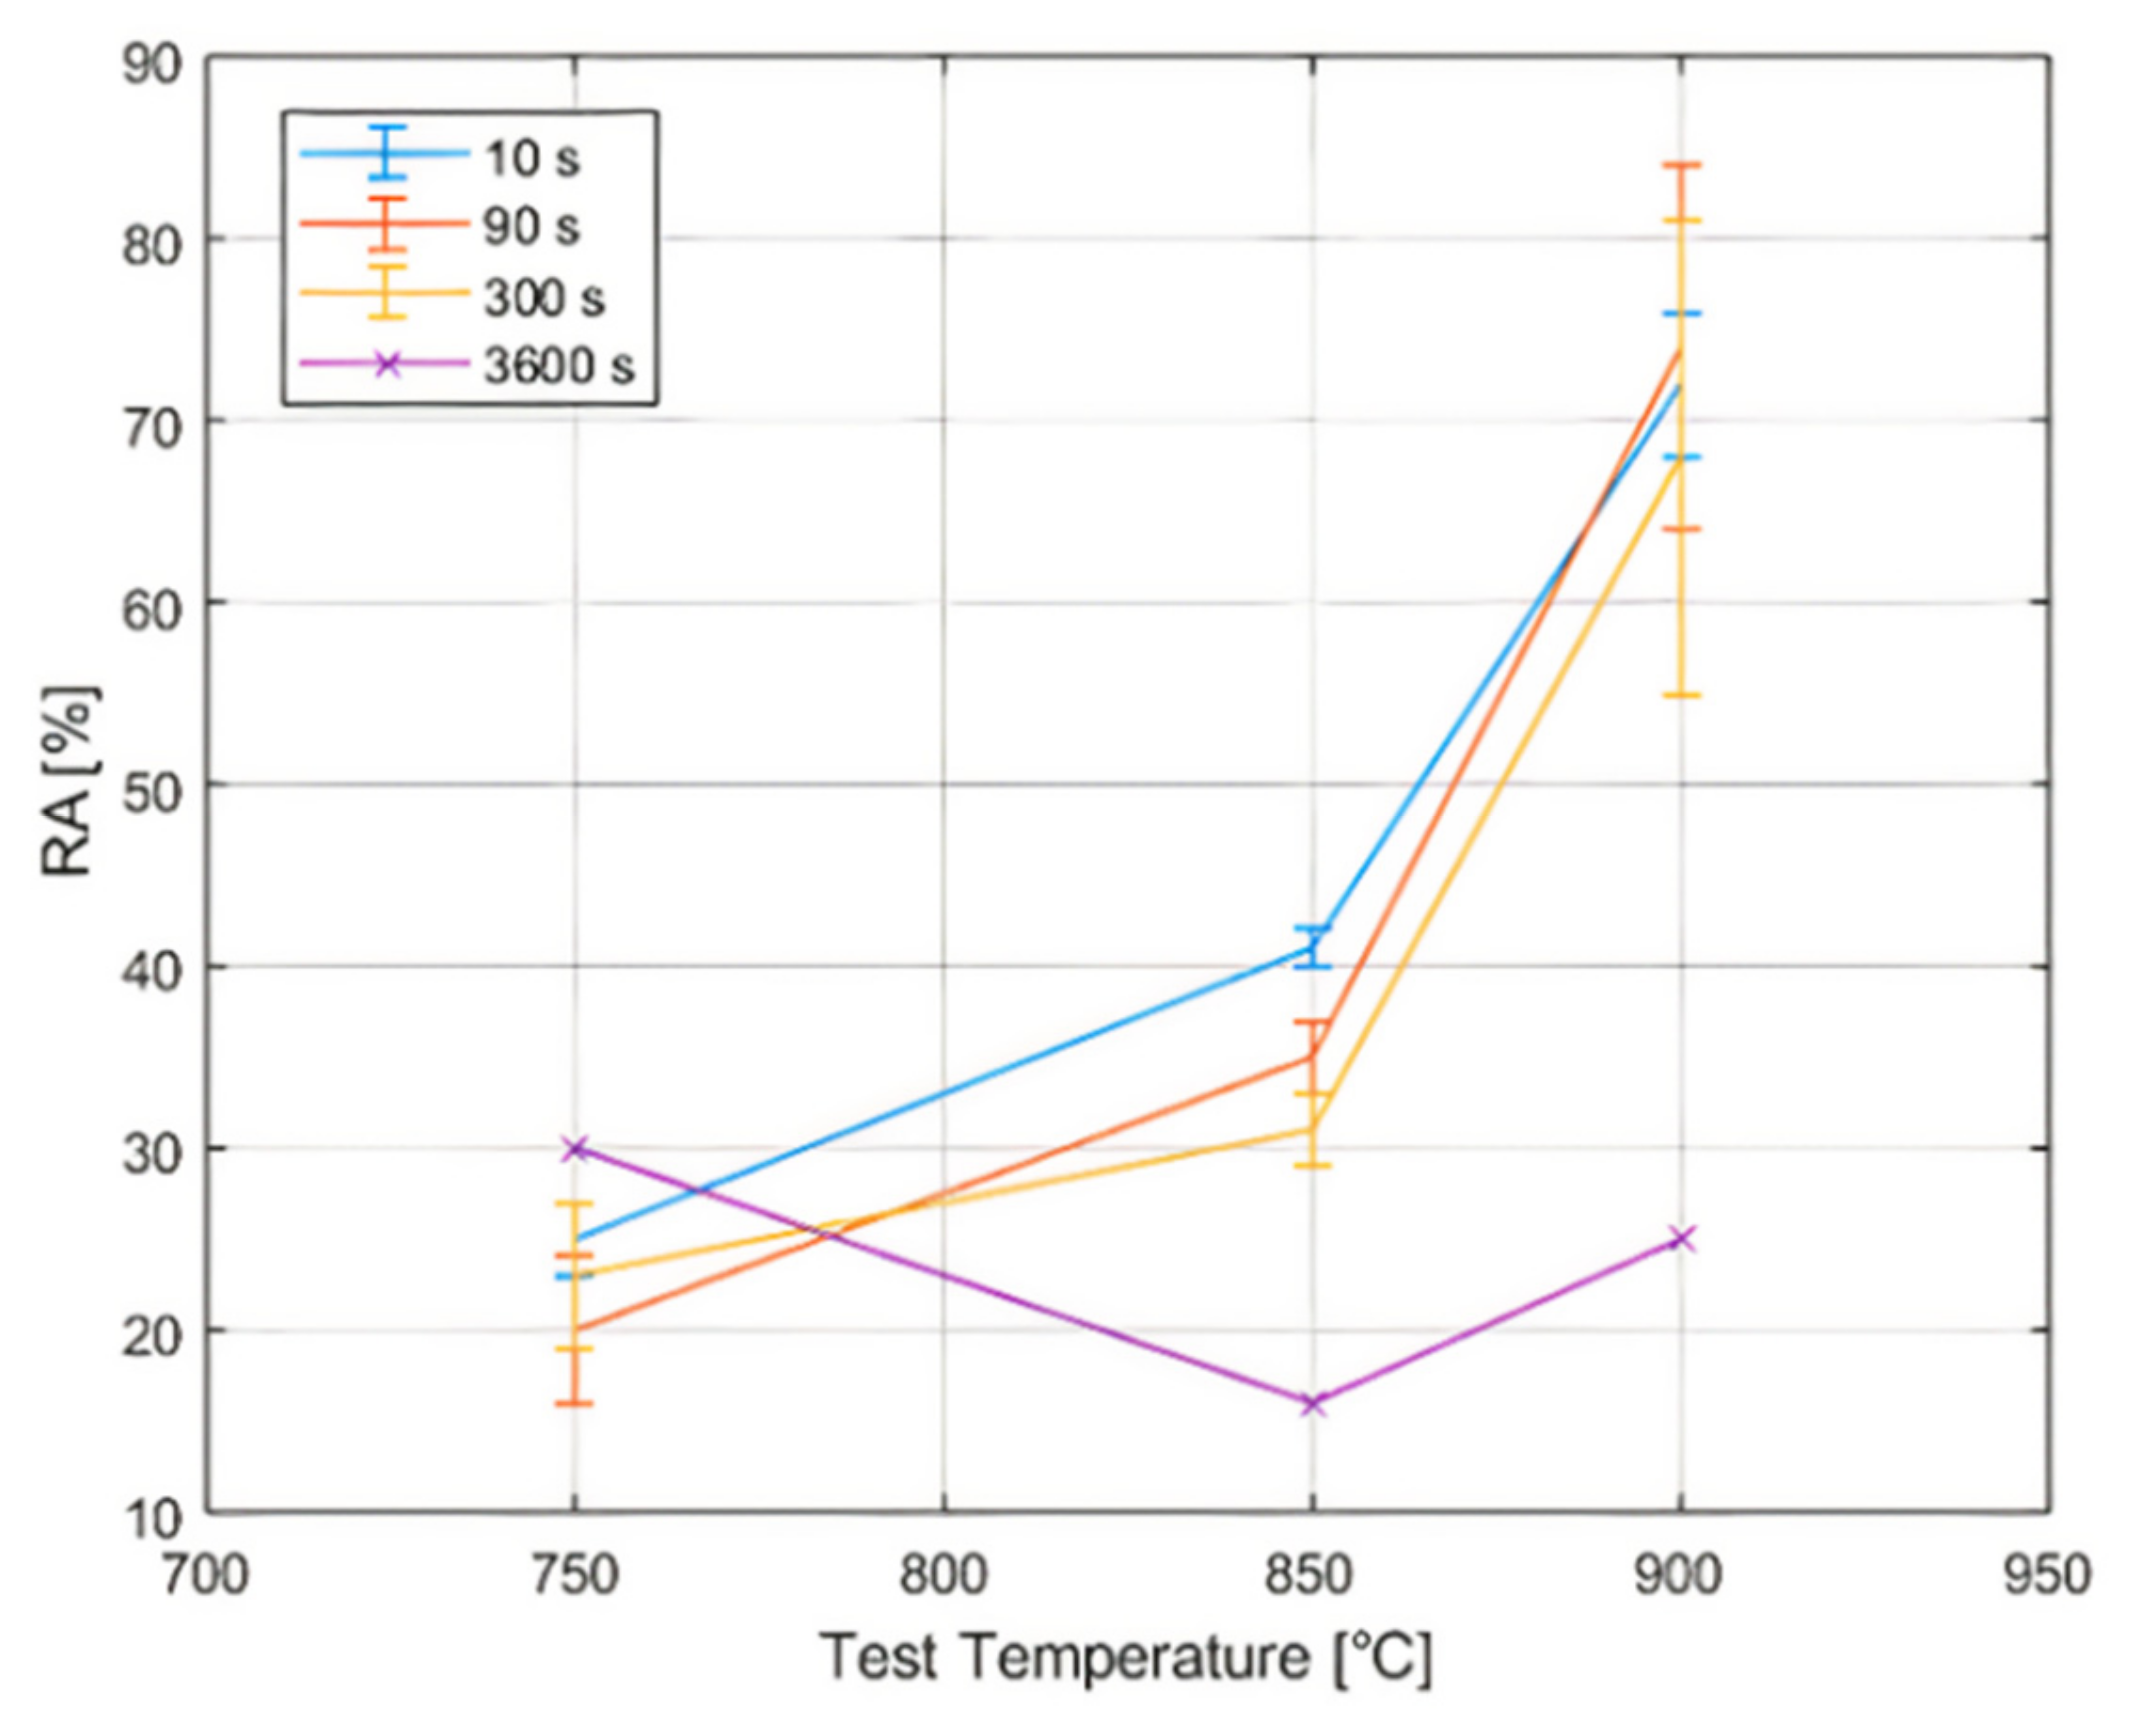
The reduction of area of each sample as a percentage was determined after the area measurements of the fracture. With the results, the hot ductility curve of the alloy studied in the critical temperature range was plotted for different holding times. The common holding time used is 10 s, and in the present study, 90 s, 300 s, and 3600 s of isothermal path before the tensile test were additionally applied to evaluate if this parameter has an impact on the hot ductility. Figure 4 shows the hot ductility curves obtained for each different condition of temperature and holding time. Considering the errors related to each point until 300 s, which ranged between 1 and 10% depending on the test parameters, no great difference was seen in the RA regarding the different holding times. By increasing the holding time significantly to 3600 s, an influence on the results could be clearly seen. There was a significant reduction at 850 and 900 °C and an increase at 750 °C.
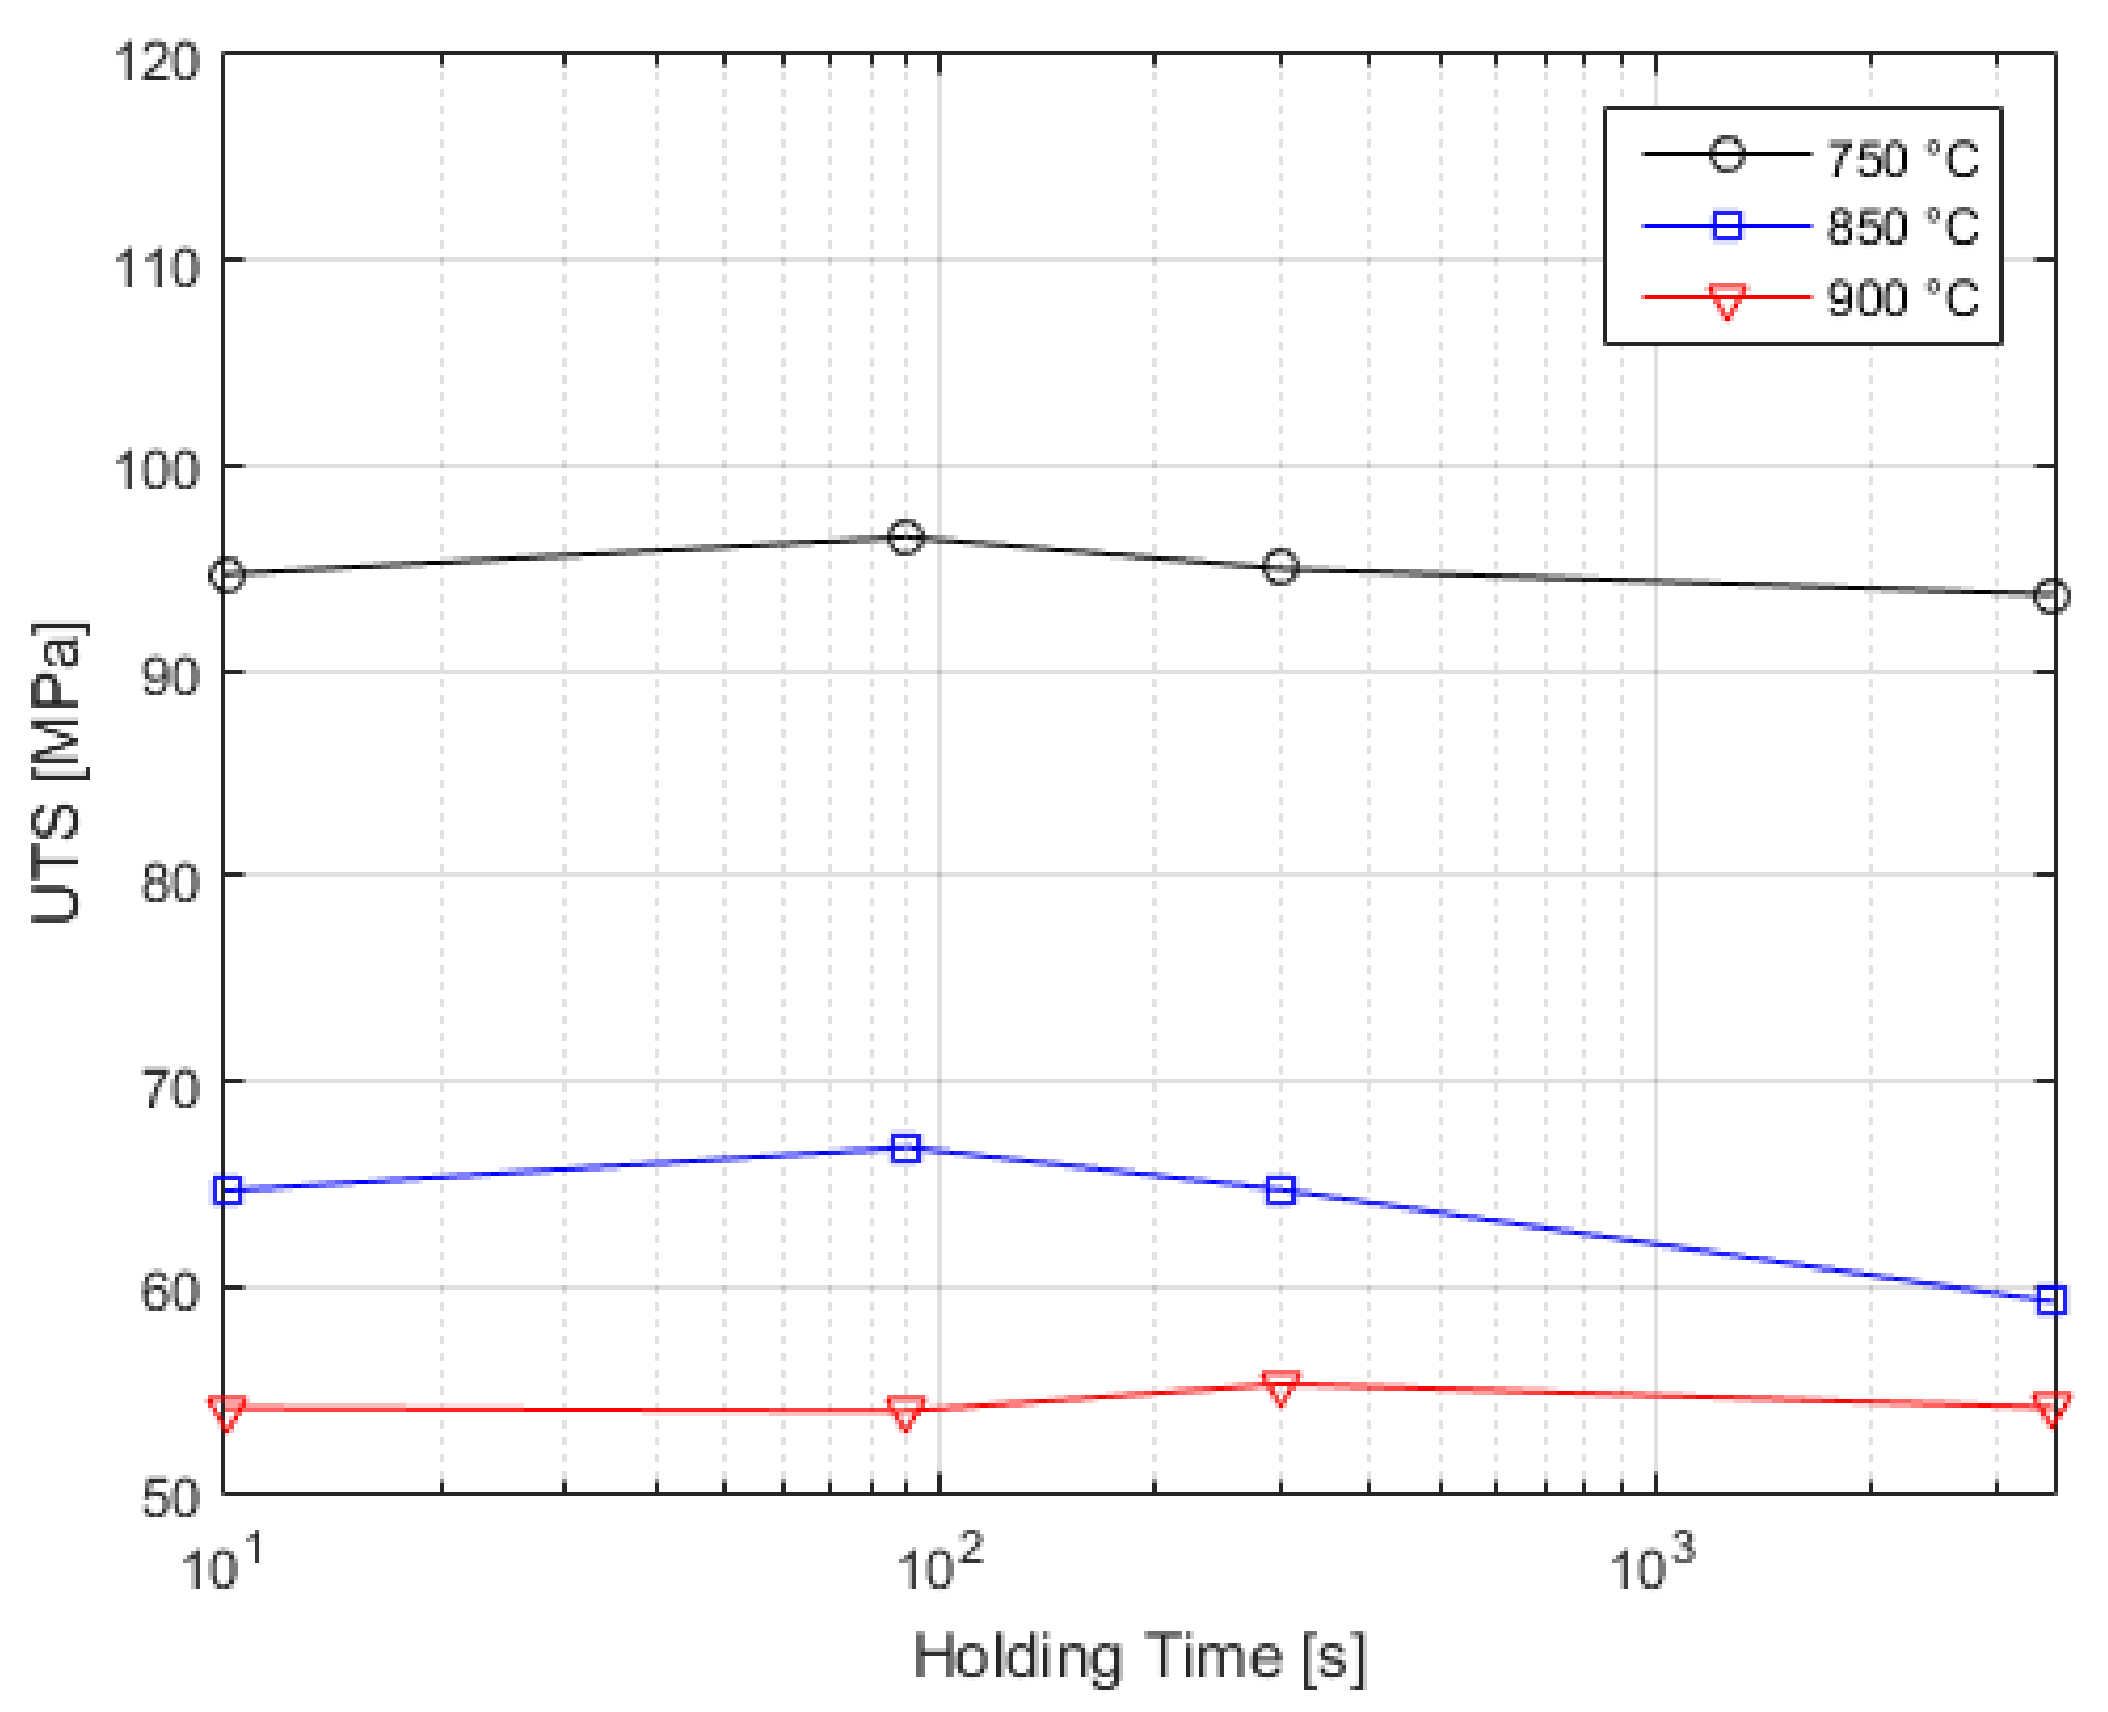
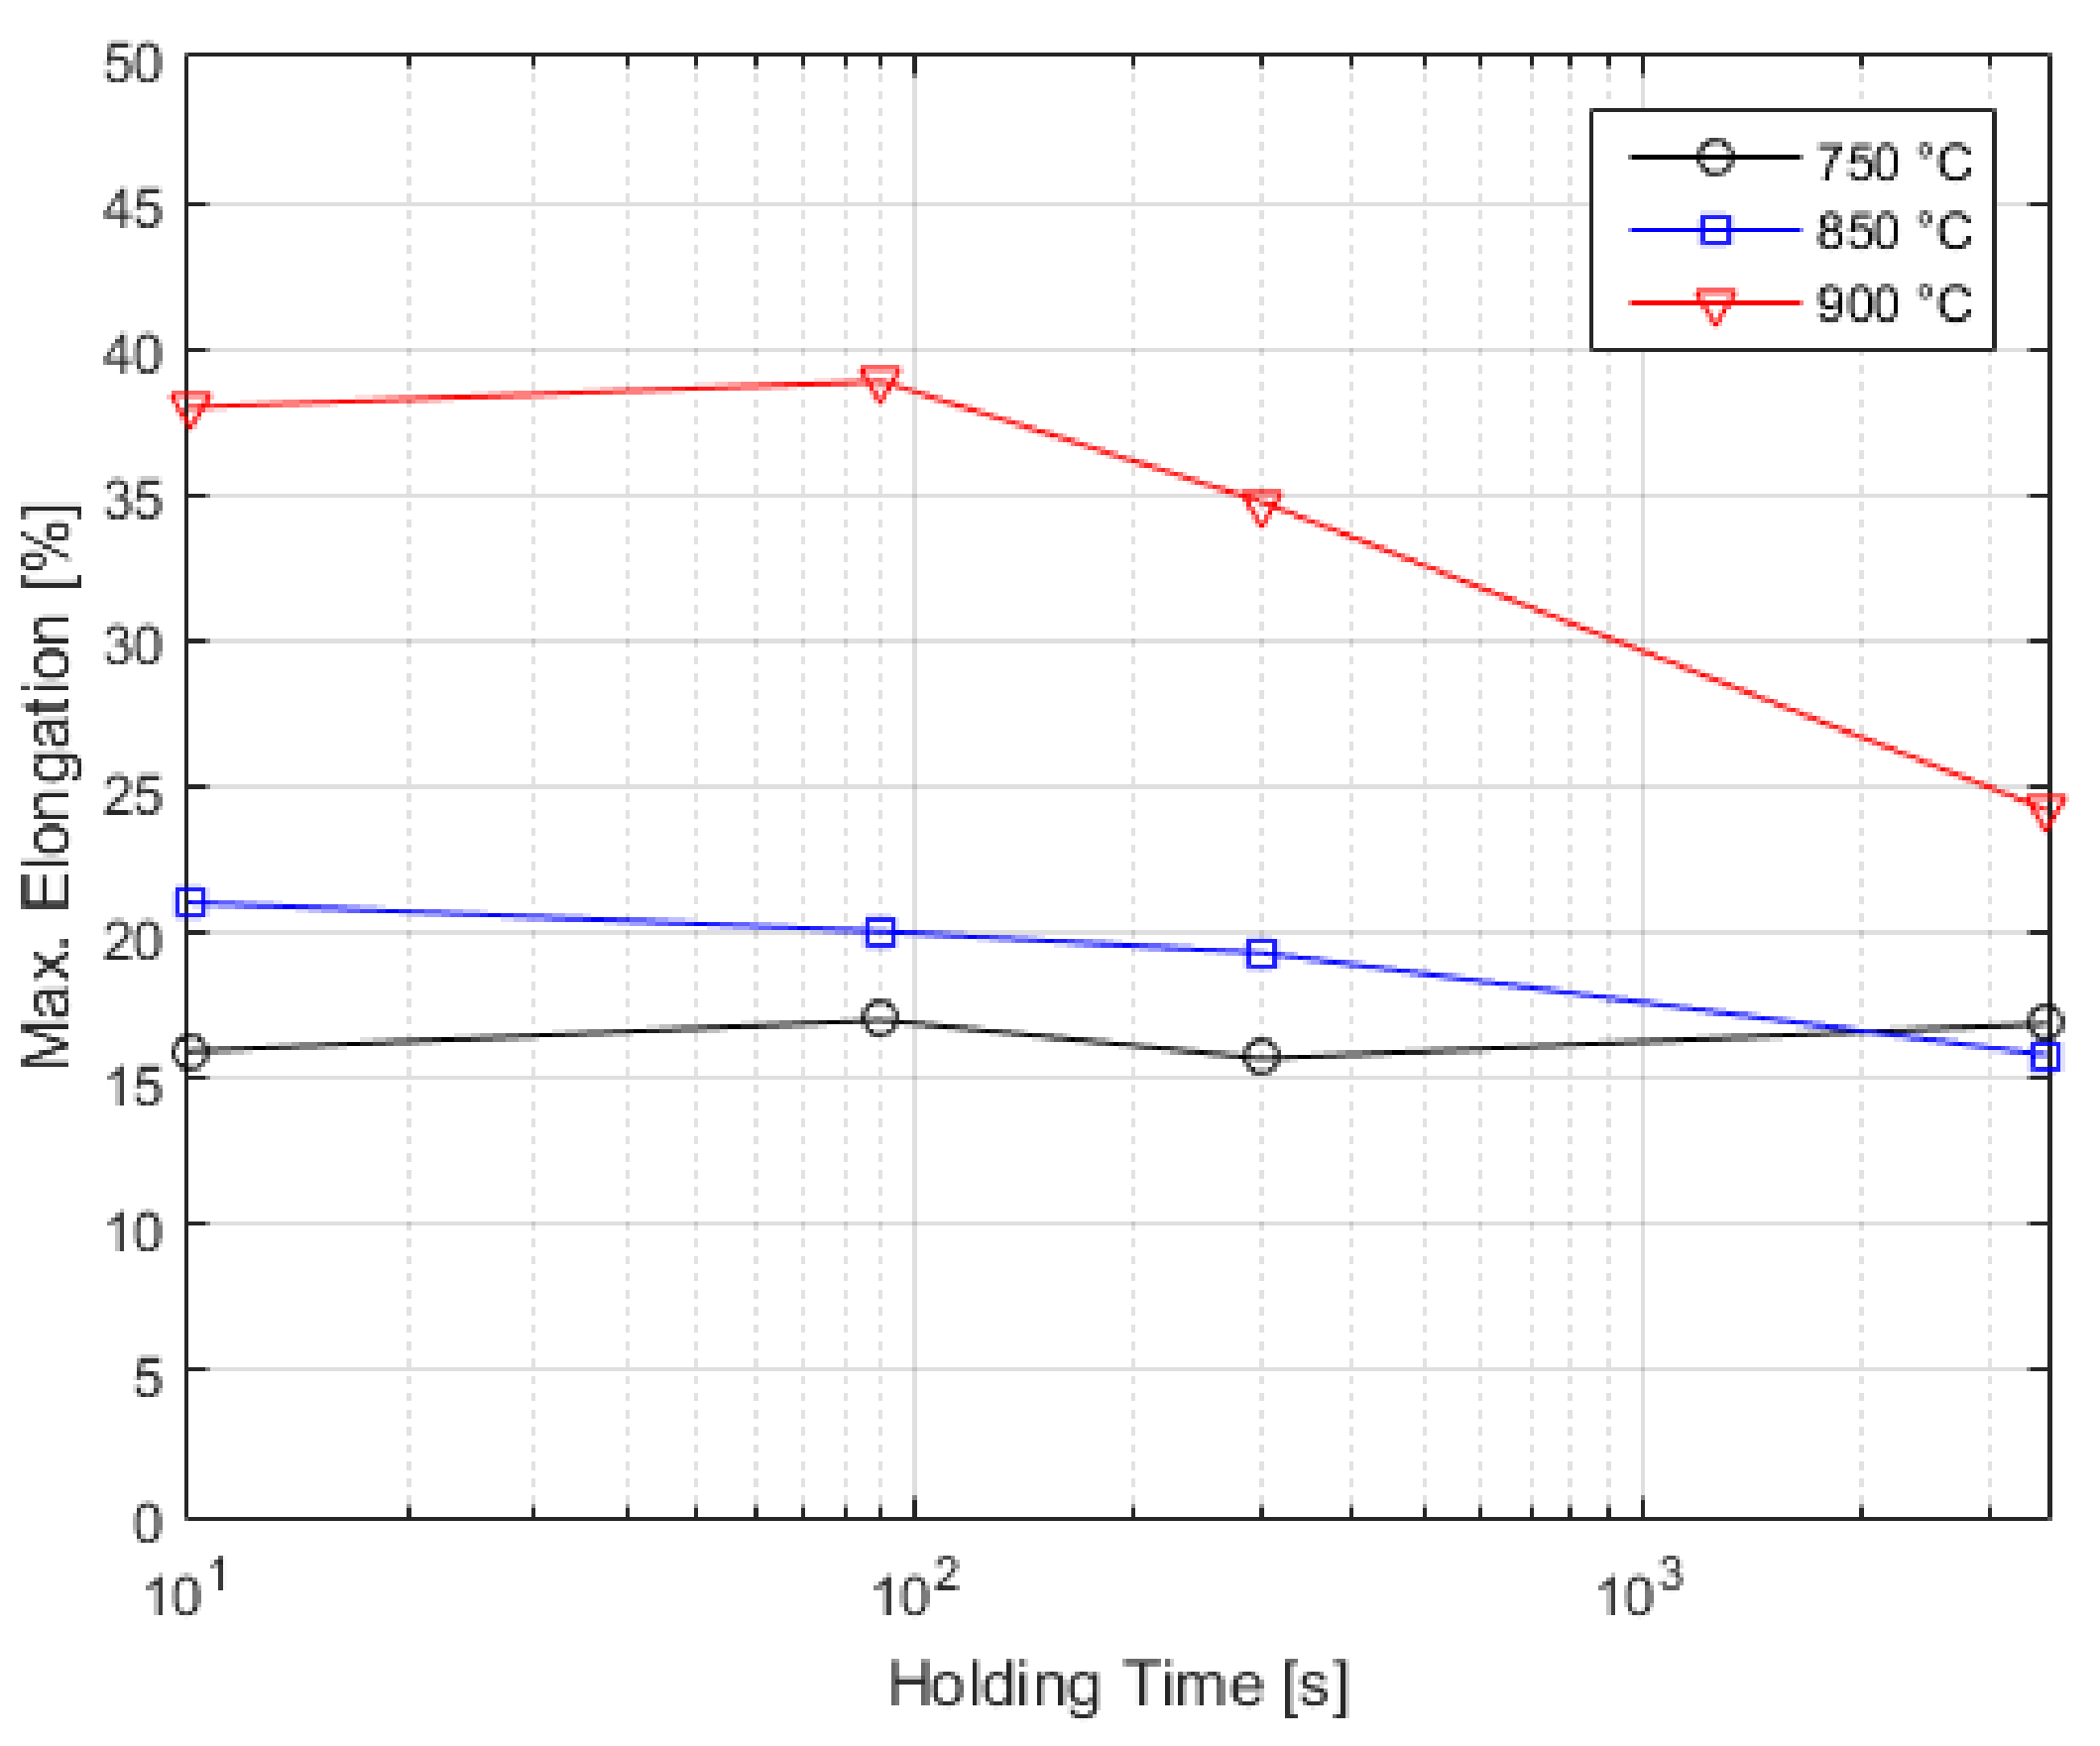
The engineering stress-strain curves for the alloy were also plotted from the experimental data. In Figure 5 and Figure 6 the ultimate tensile strength (UTS) and maximal elongation reached for each specimen are presented, respectively, regarding the different testing temperatures and holding times. Generally higher values of UTS were seen for lower temperatures and the opposite for the maximal elongation, where higher temperatures showed higher values. For both parameters observed, there was no considerable difference between the results obtained at the same temperature until 300 s of holding time. Above this point (at 3600 s), some changes were seen. The UTS showed a small reduction at 850 °C and remained with no significant change for the other two testing temperatures. The maximal elongation reached was also reduced with the longer holding time at 850 and 900 °C (more significant at the latter).
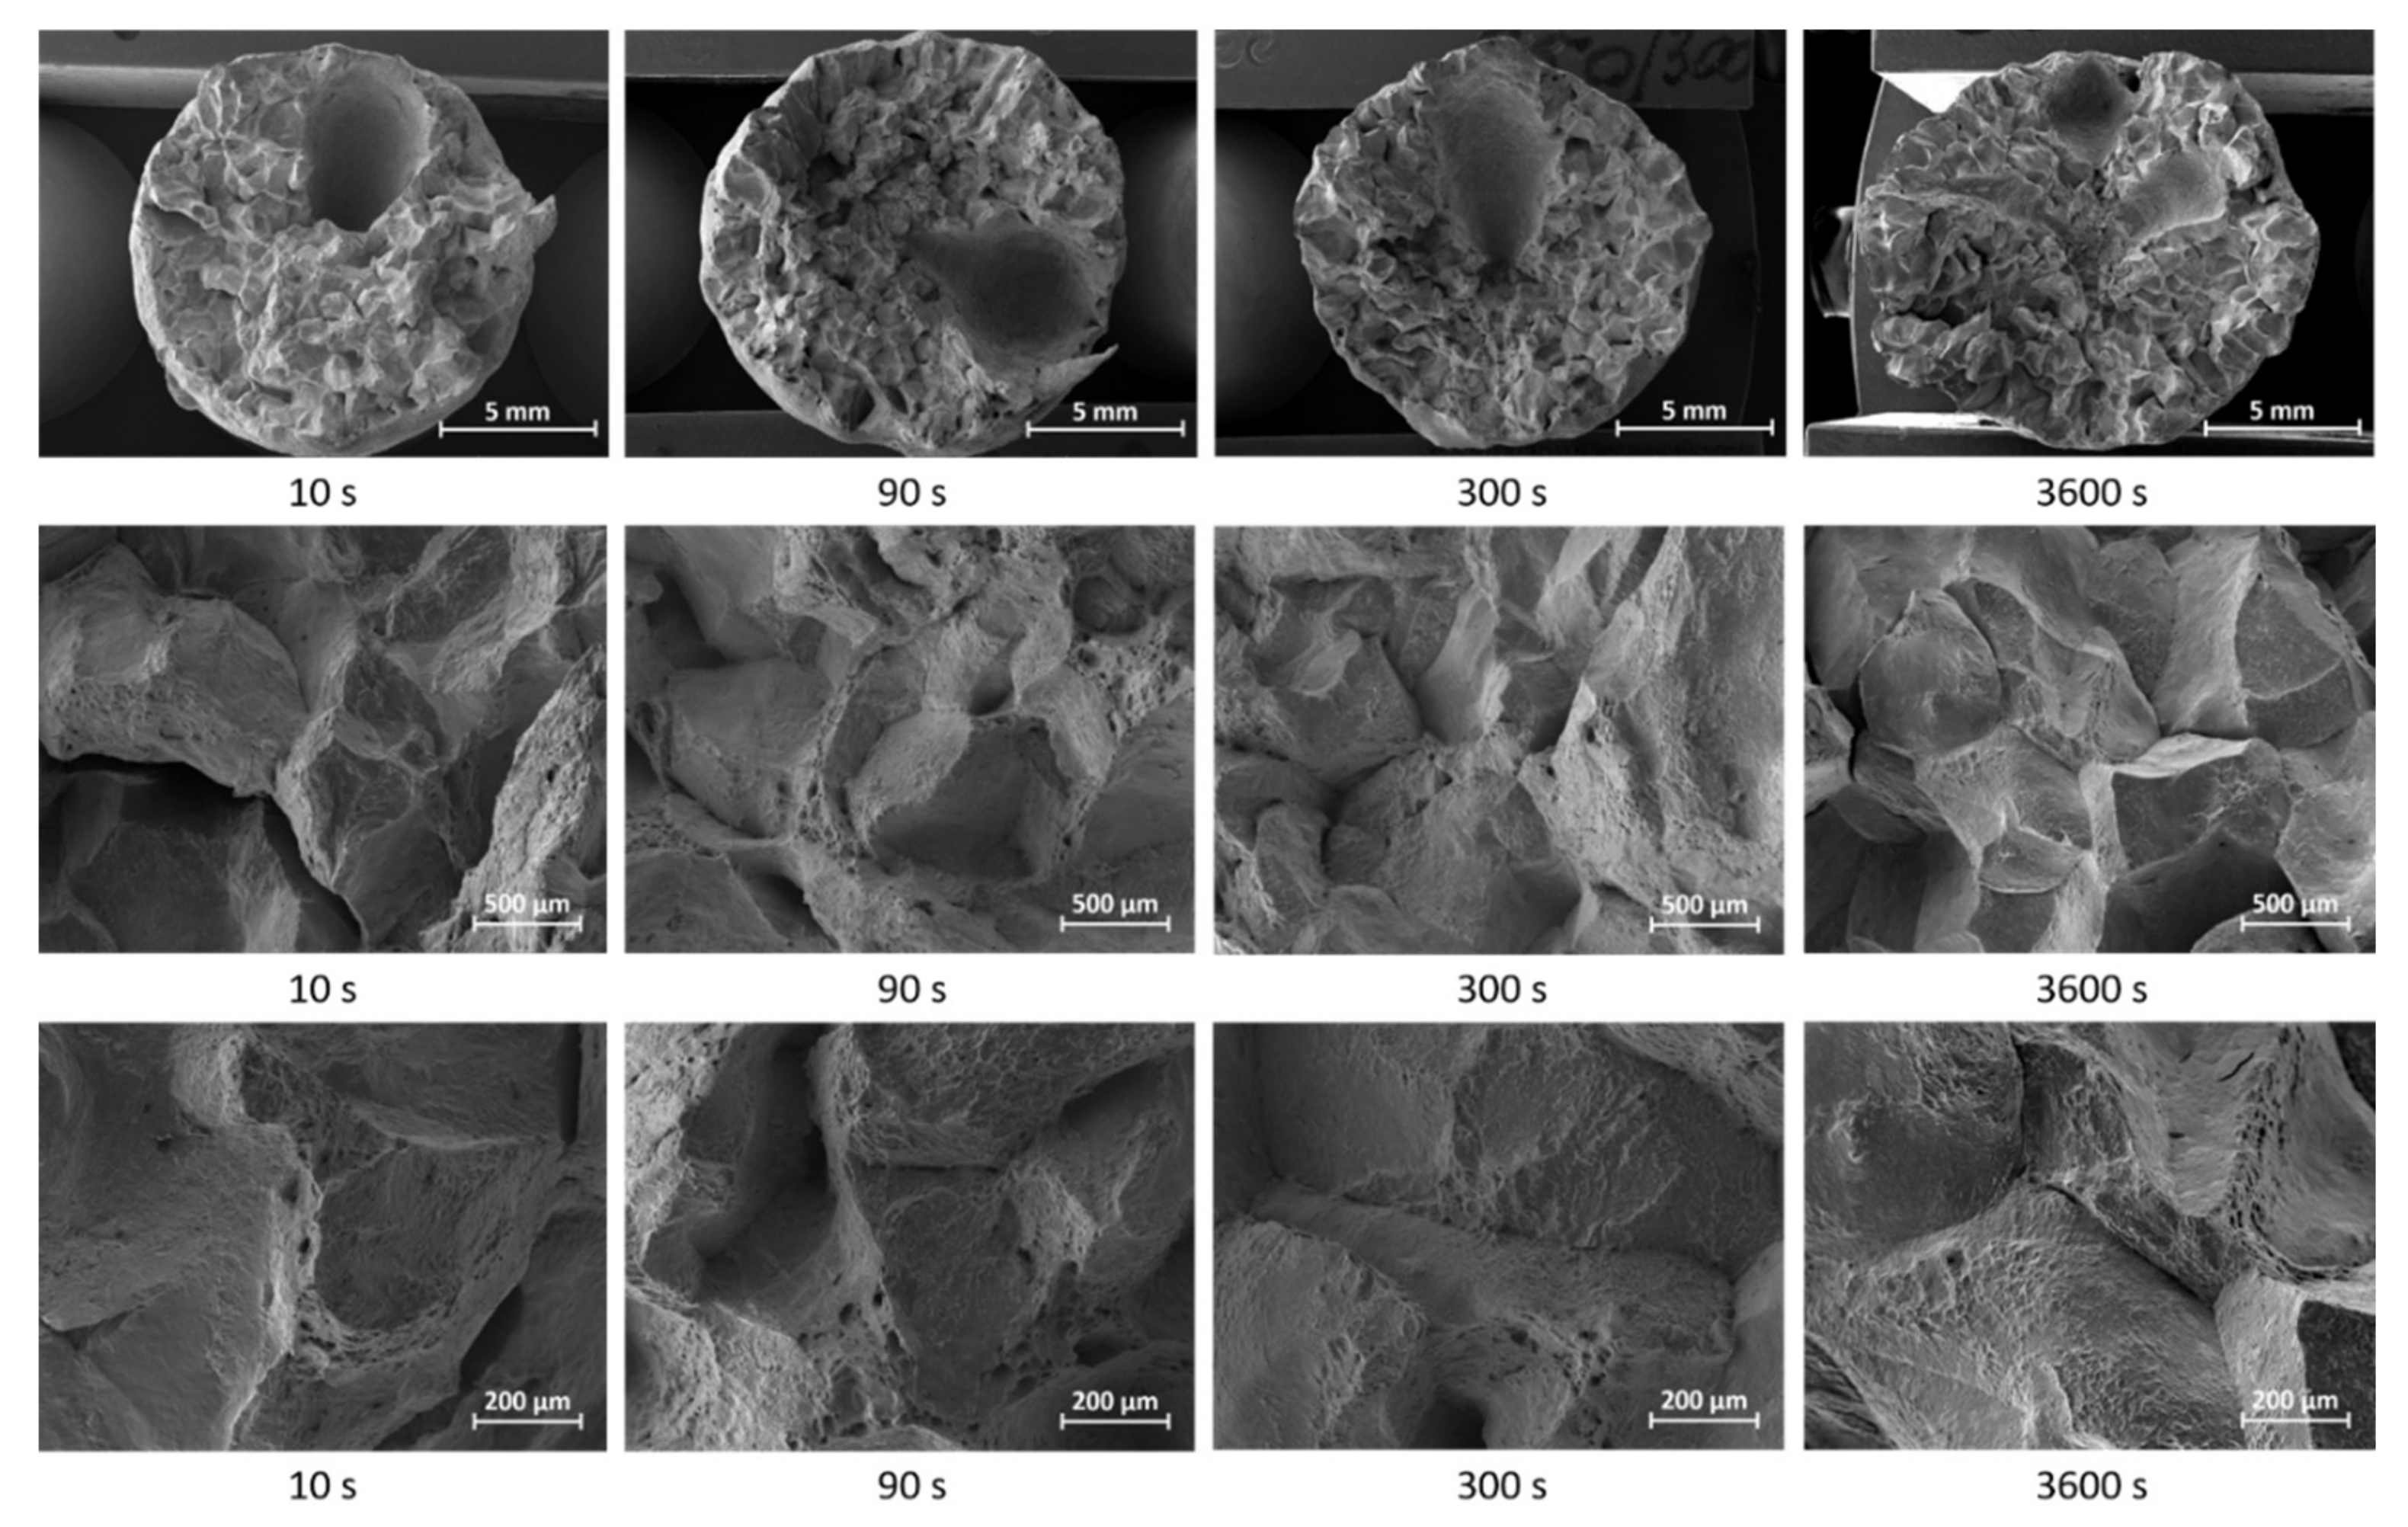
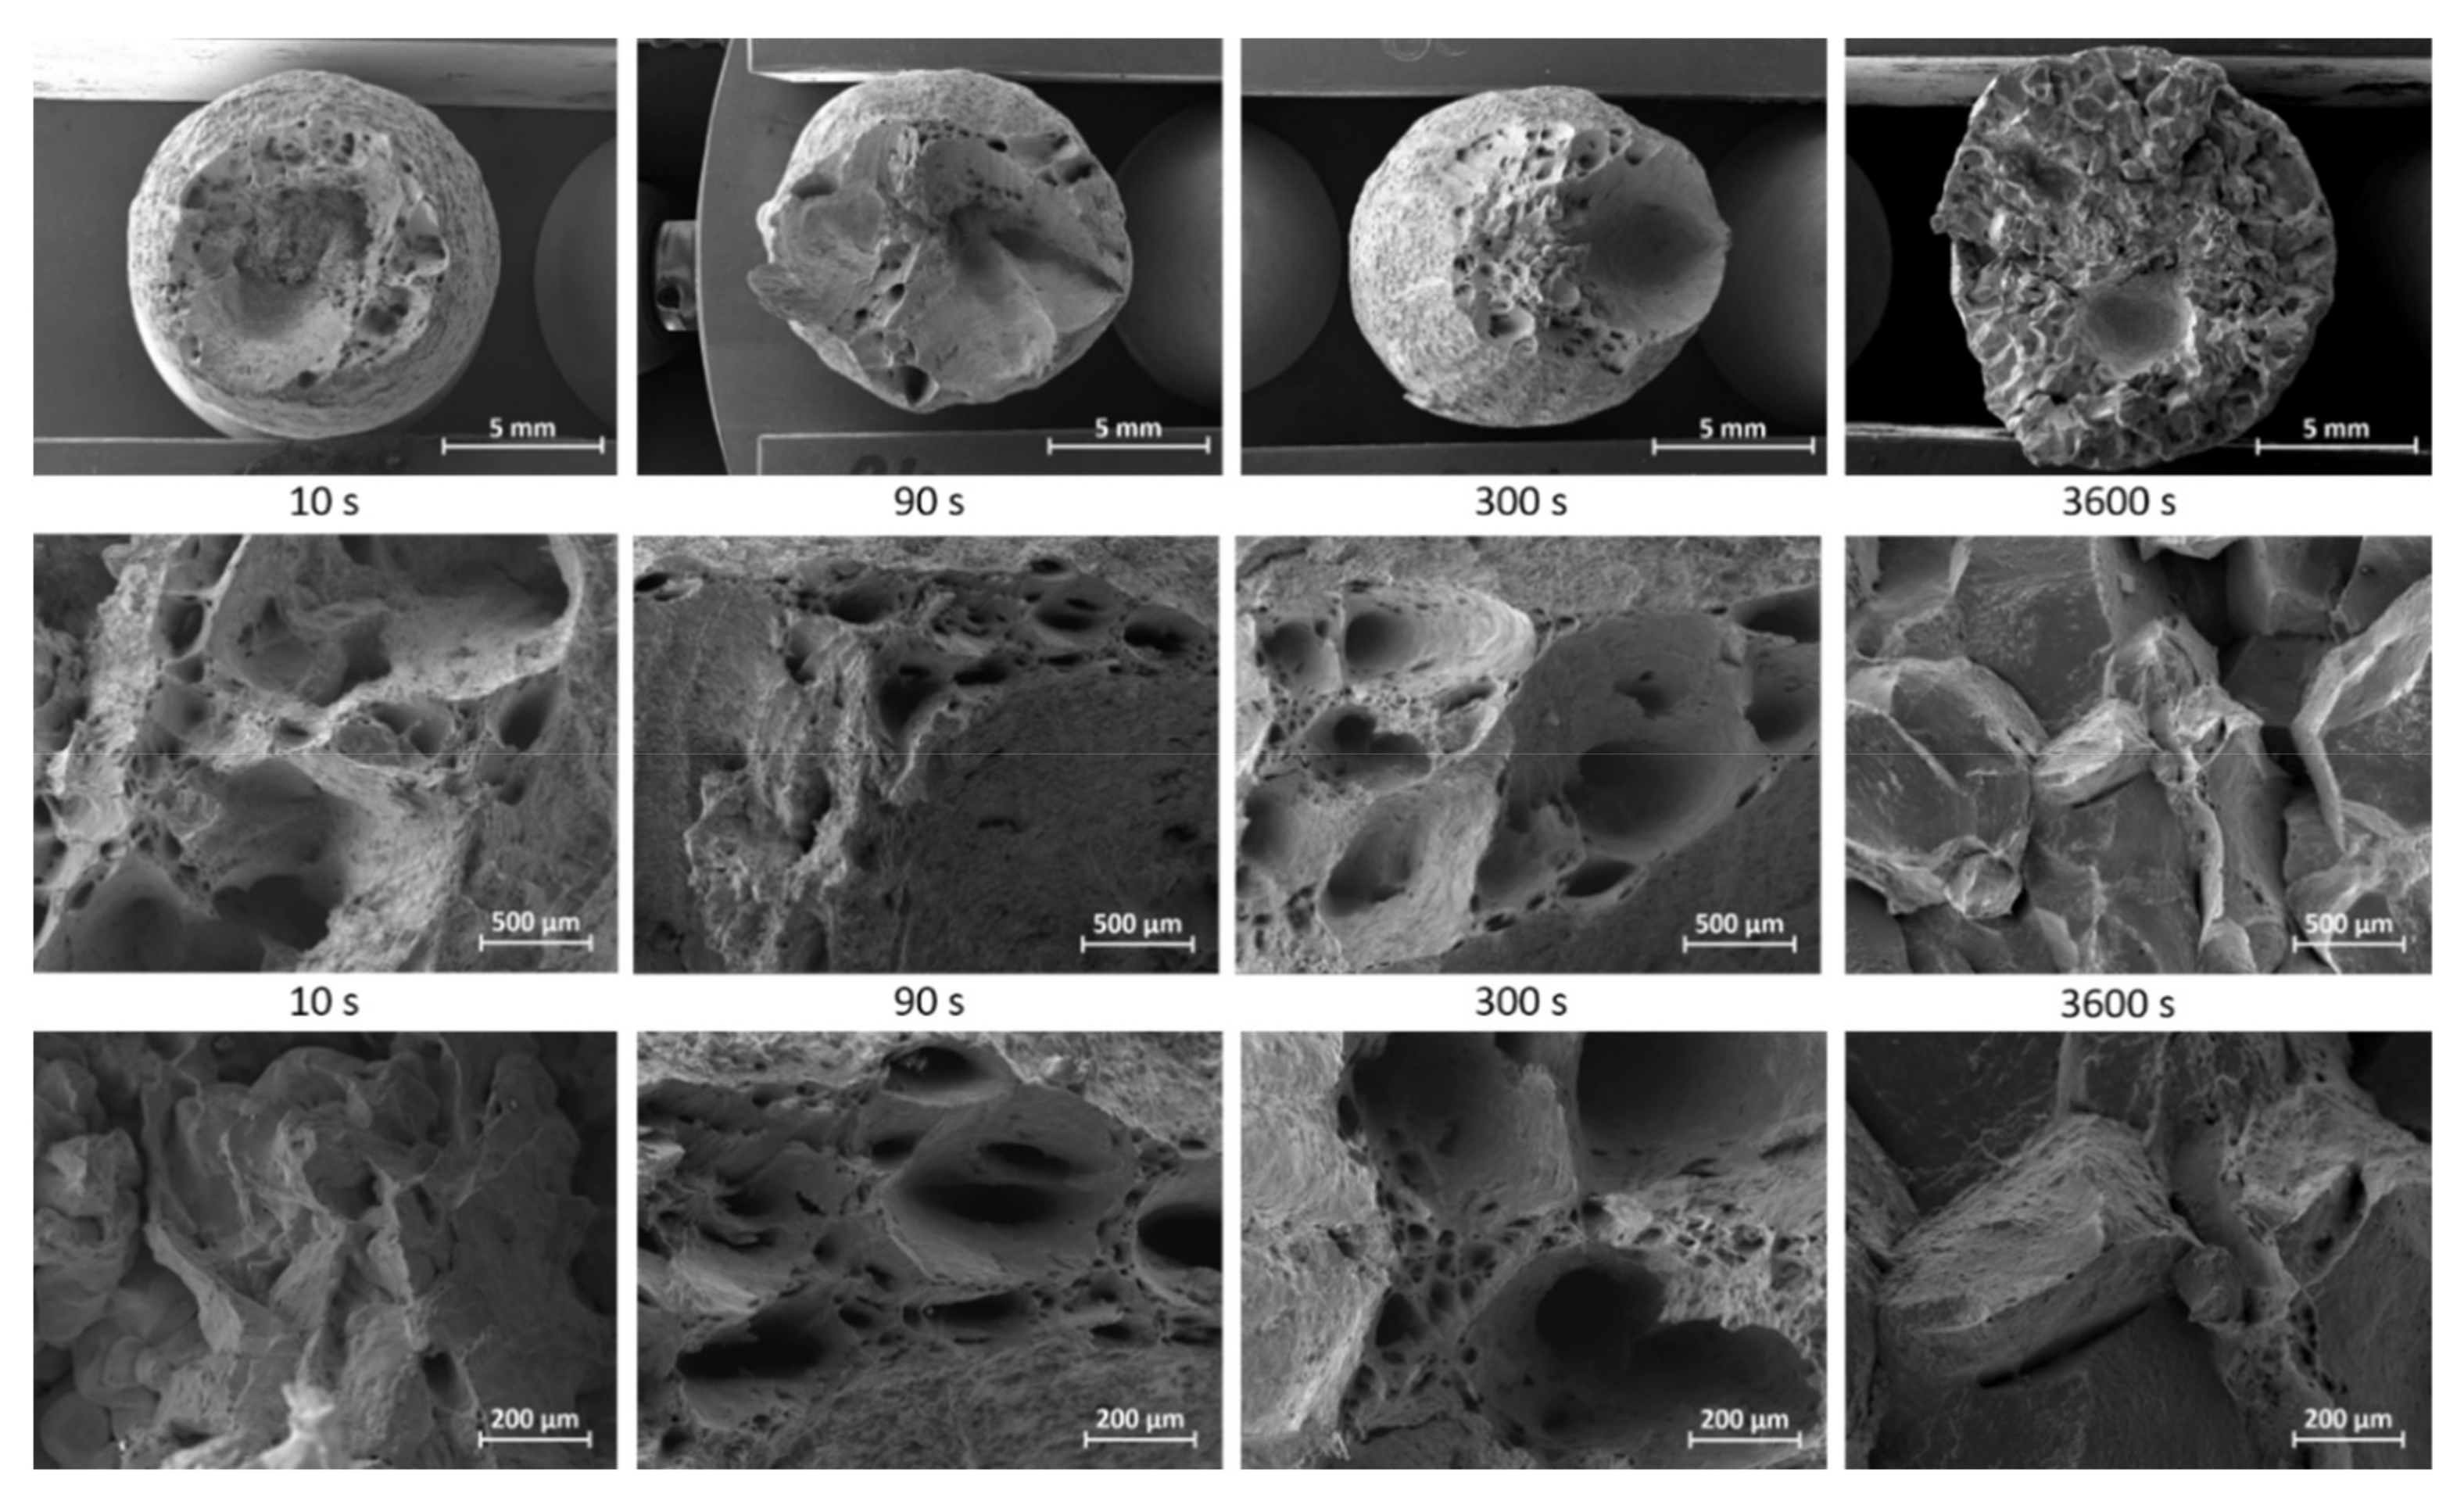
After the experiments, the ruptured samples were observed by means of scanning electron microscope (SEM) for the identification of the failure mechanism and to compare the fracture surfaces of the samples under different temperatures and holding times. The resulting images can be seen in Figure 7, Figure 8 and Figure 9.
At 750 °C (Figure 7), the fracture seen is intergranular and similar for all samples, showing a brittle behavior. Dimples were identified on the surface of the grains seen, indicating the presence of the ferrite films. Comparing the images of the sample with 10 s of holding time to that with 90 s, the grains seem to have slightly increased. Observing the images with 250x magnification, for 3600 s at 750 °C, the dimples were present in higher amount and were more distinguishable. At 850 °C (Figure 8), no difference was seen between the samples with different holding times until 300 s. For these, the surface showed mixed aspects of ductile and brittle fracture. For 3600 s of holding time at 850 °C, there was much less indication of ductile fracture, with it being mostly brittle. Lastly, at 900 °C (Figure 9), once again there was no clear difference between 10, 90, and 300 s, where all samples showed a ductile fracture, marked by voids and dimples. In the case of 3600 s, however, a mixed fracture was present with distinguishable grain surfaces and only some dimples.
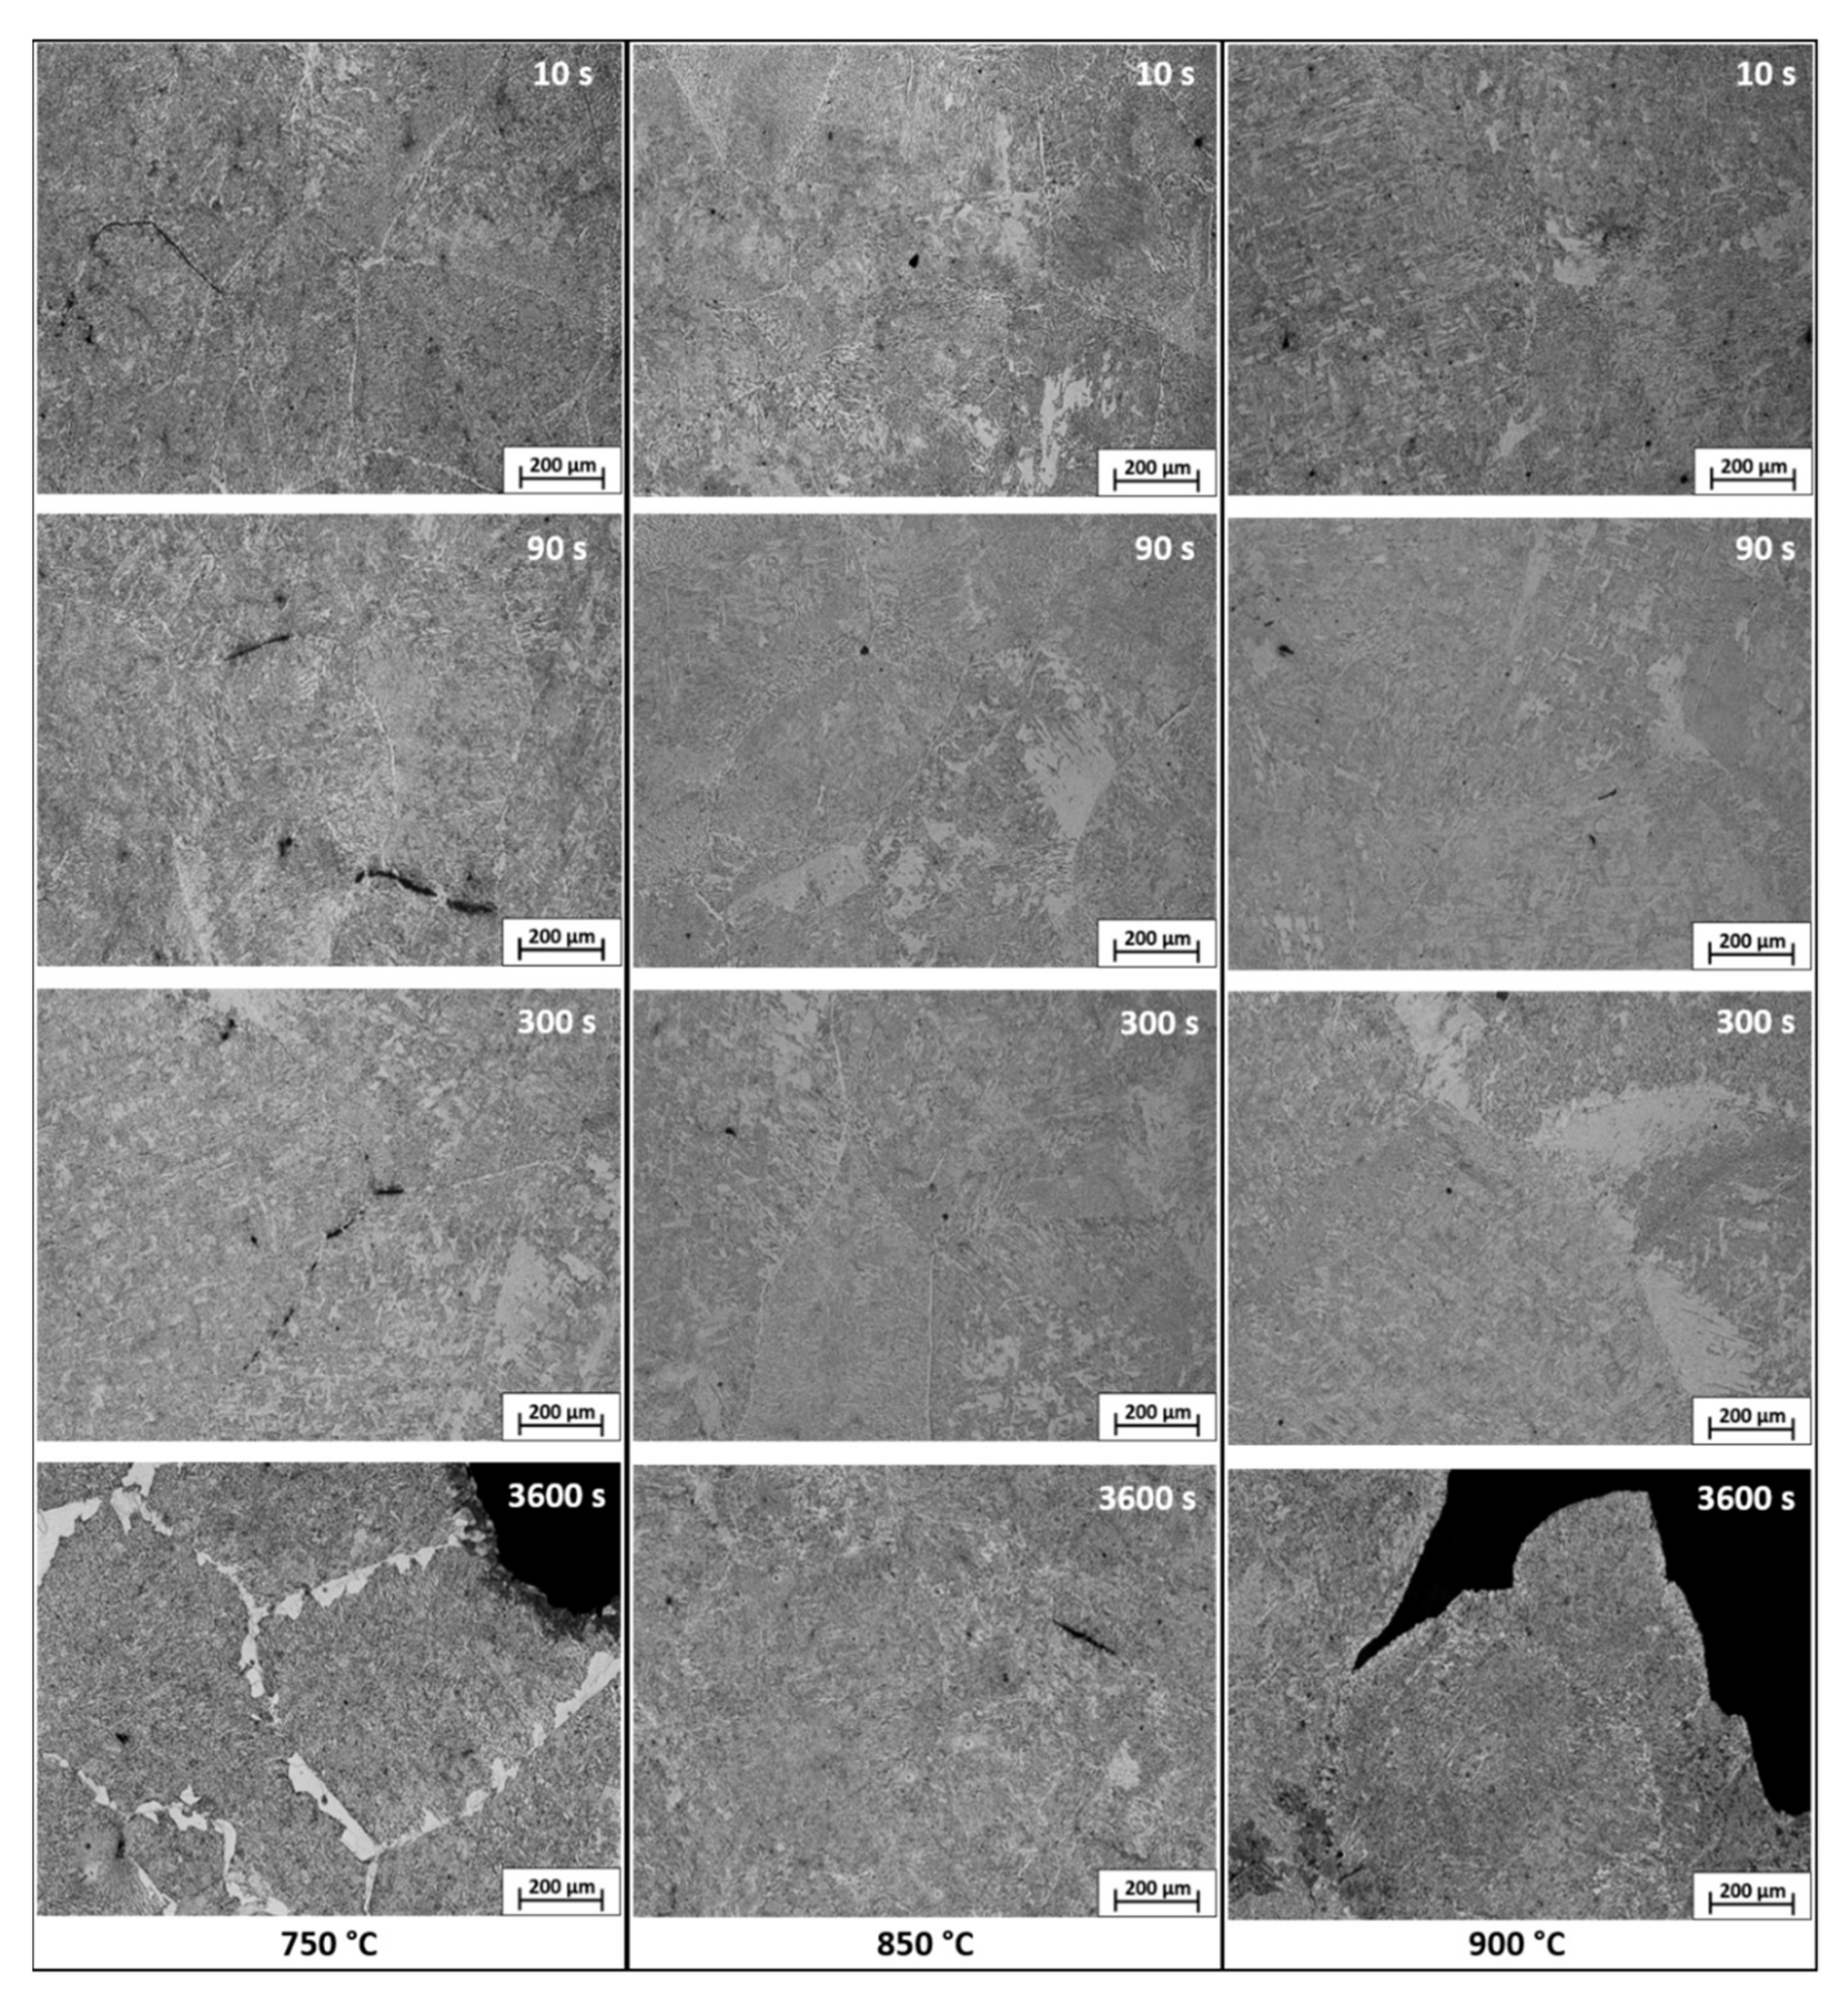
After cutting longitudinally, polishing and etching, the samples were observed with the LOM, resulting in the images shown in Figure 10. For all of the temperatures, until 300 s of holding time, the differences between the samples were only slight. At 750 °C, until 300 s, the ferrite films at the grain boundaries can be easily identified. These films are thin, however, and the cracks that initiate at these points can also be seen. For 3600 s, a clear increase in the ferrite amount at the grain boundaries is observed. With careful and qualitative observation, a small increase in the grain size might be present with longer holding times, but this result will need further investigation to be confirmed. At 850 °C, the ferrite films are also present at some boundaries, but not in the same amount as at 750 °C. Even with a much higher holding time, no clear difference was seen between the samples observed. At 900 °C, recognizing the grain boundaries is more difficult and ferrite films are absent. For this case, again no clear difference between the holding times was seen.

3.2. Simulations

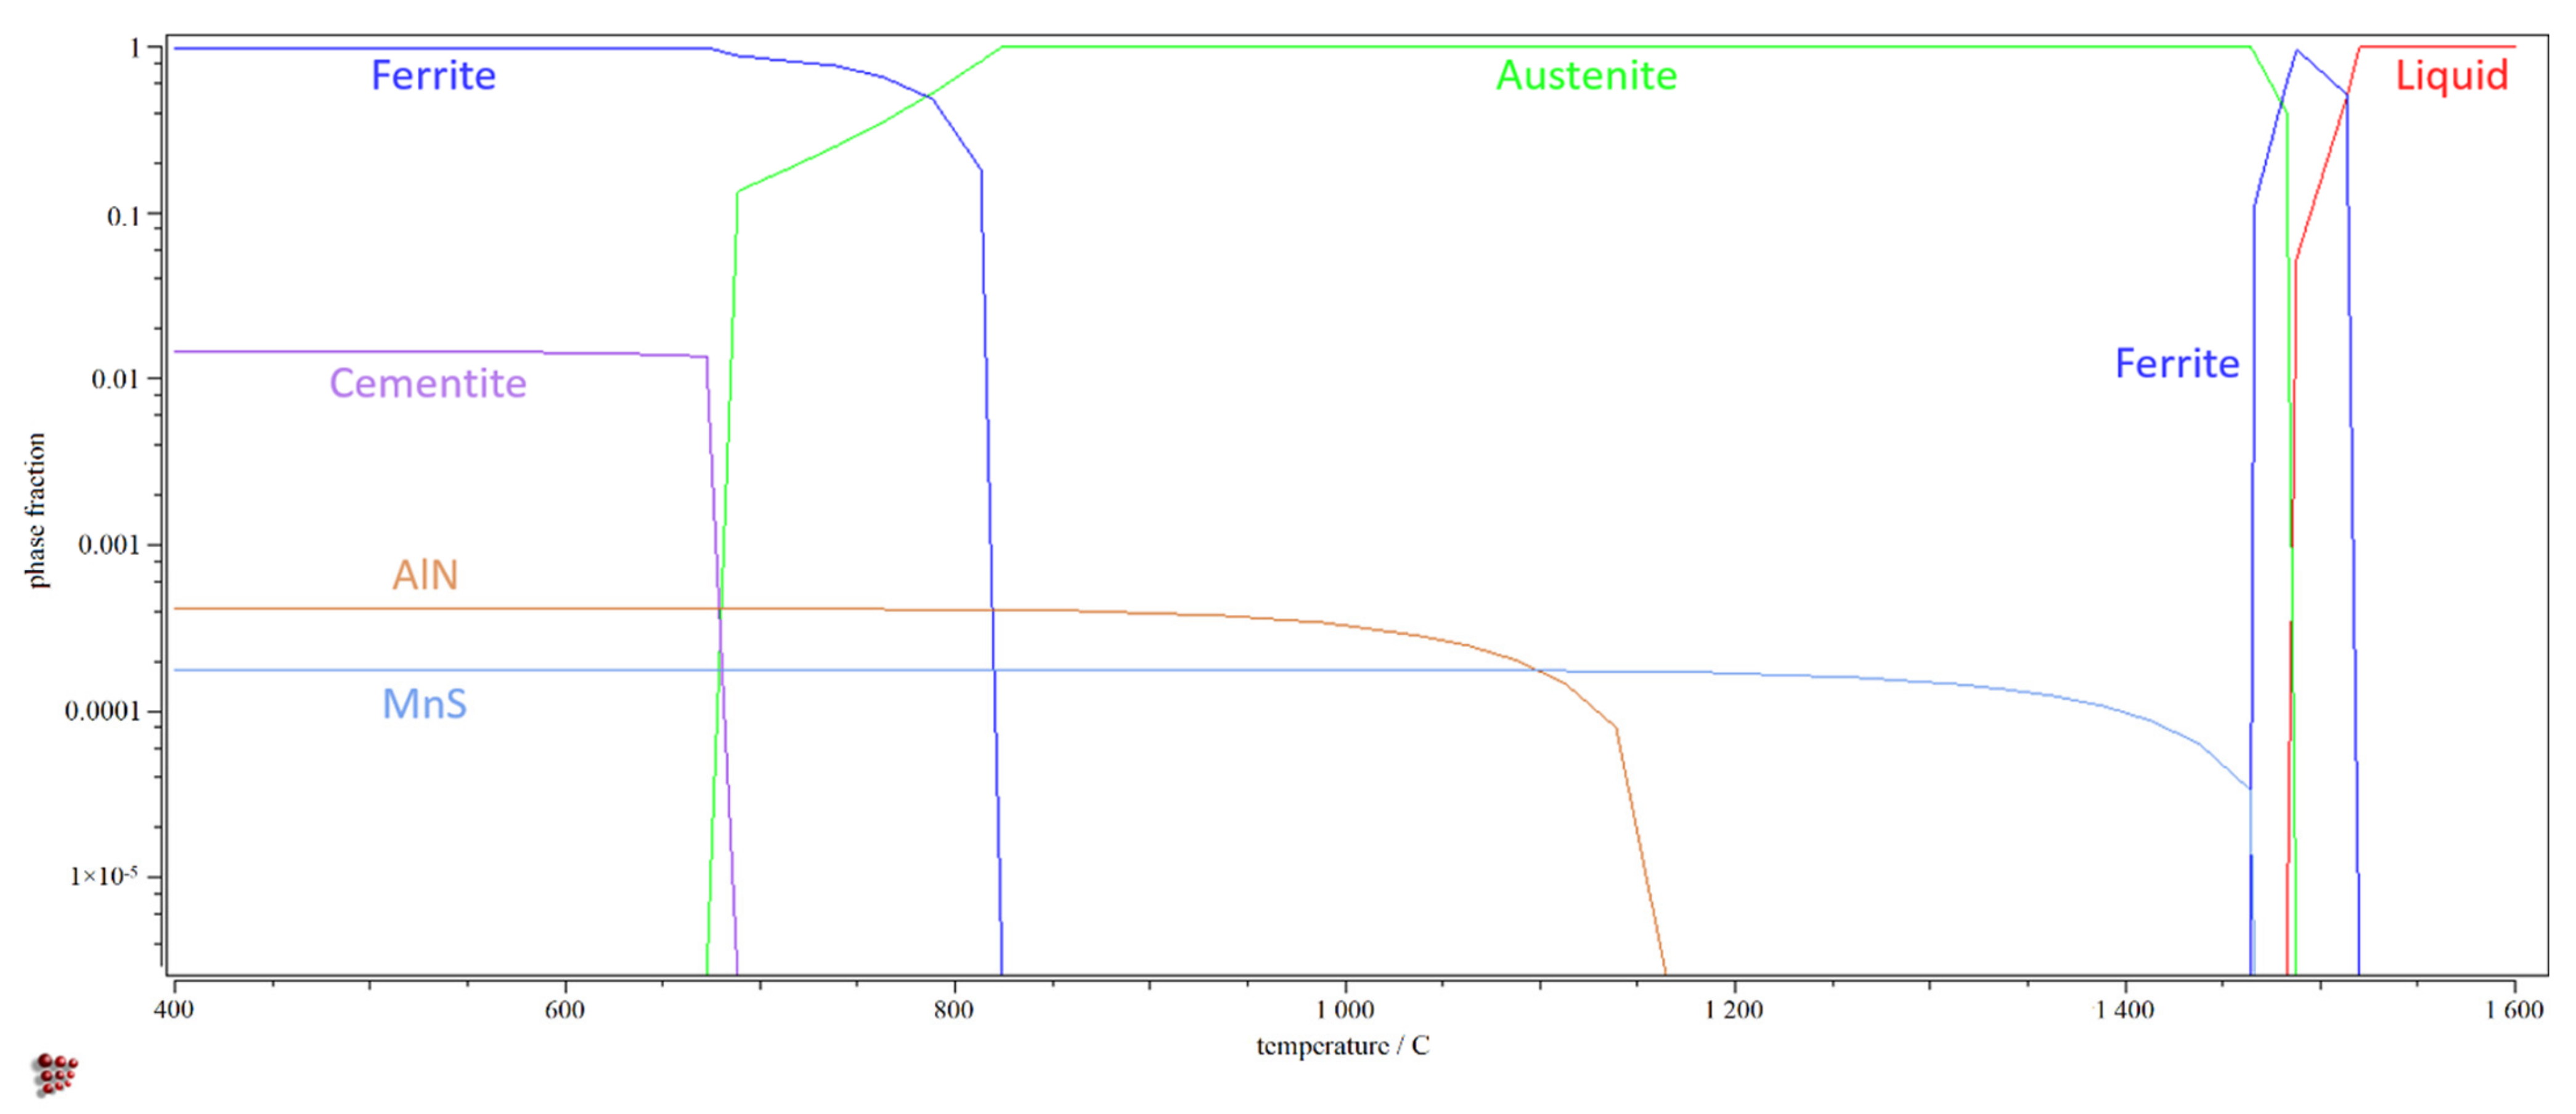
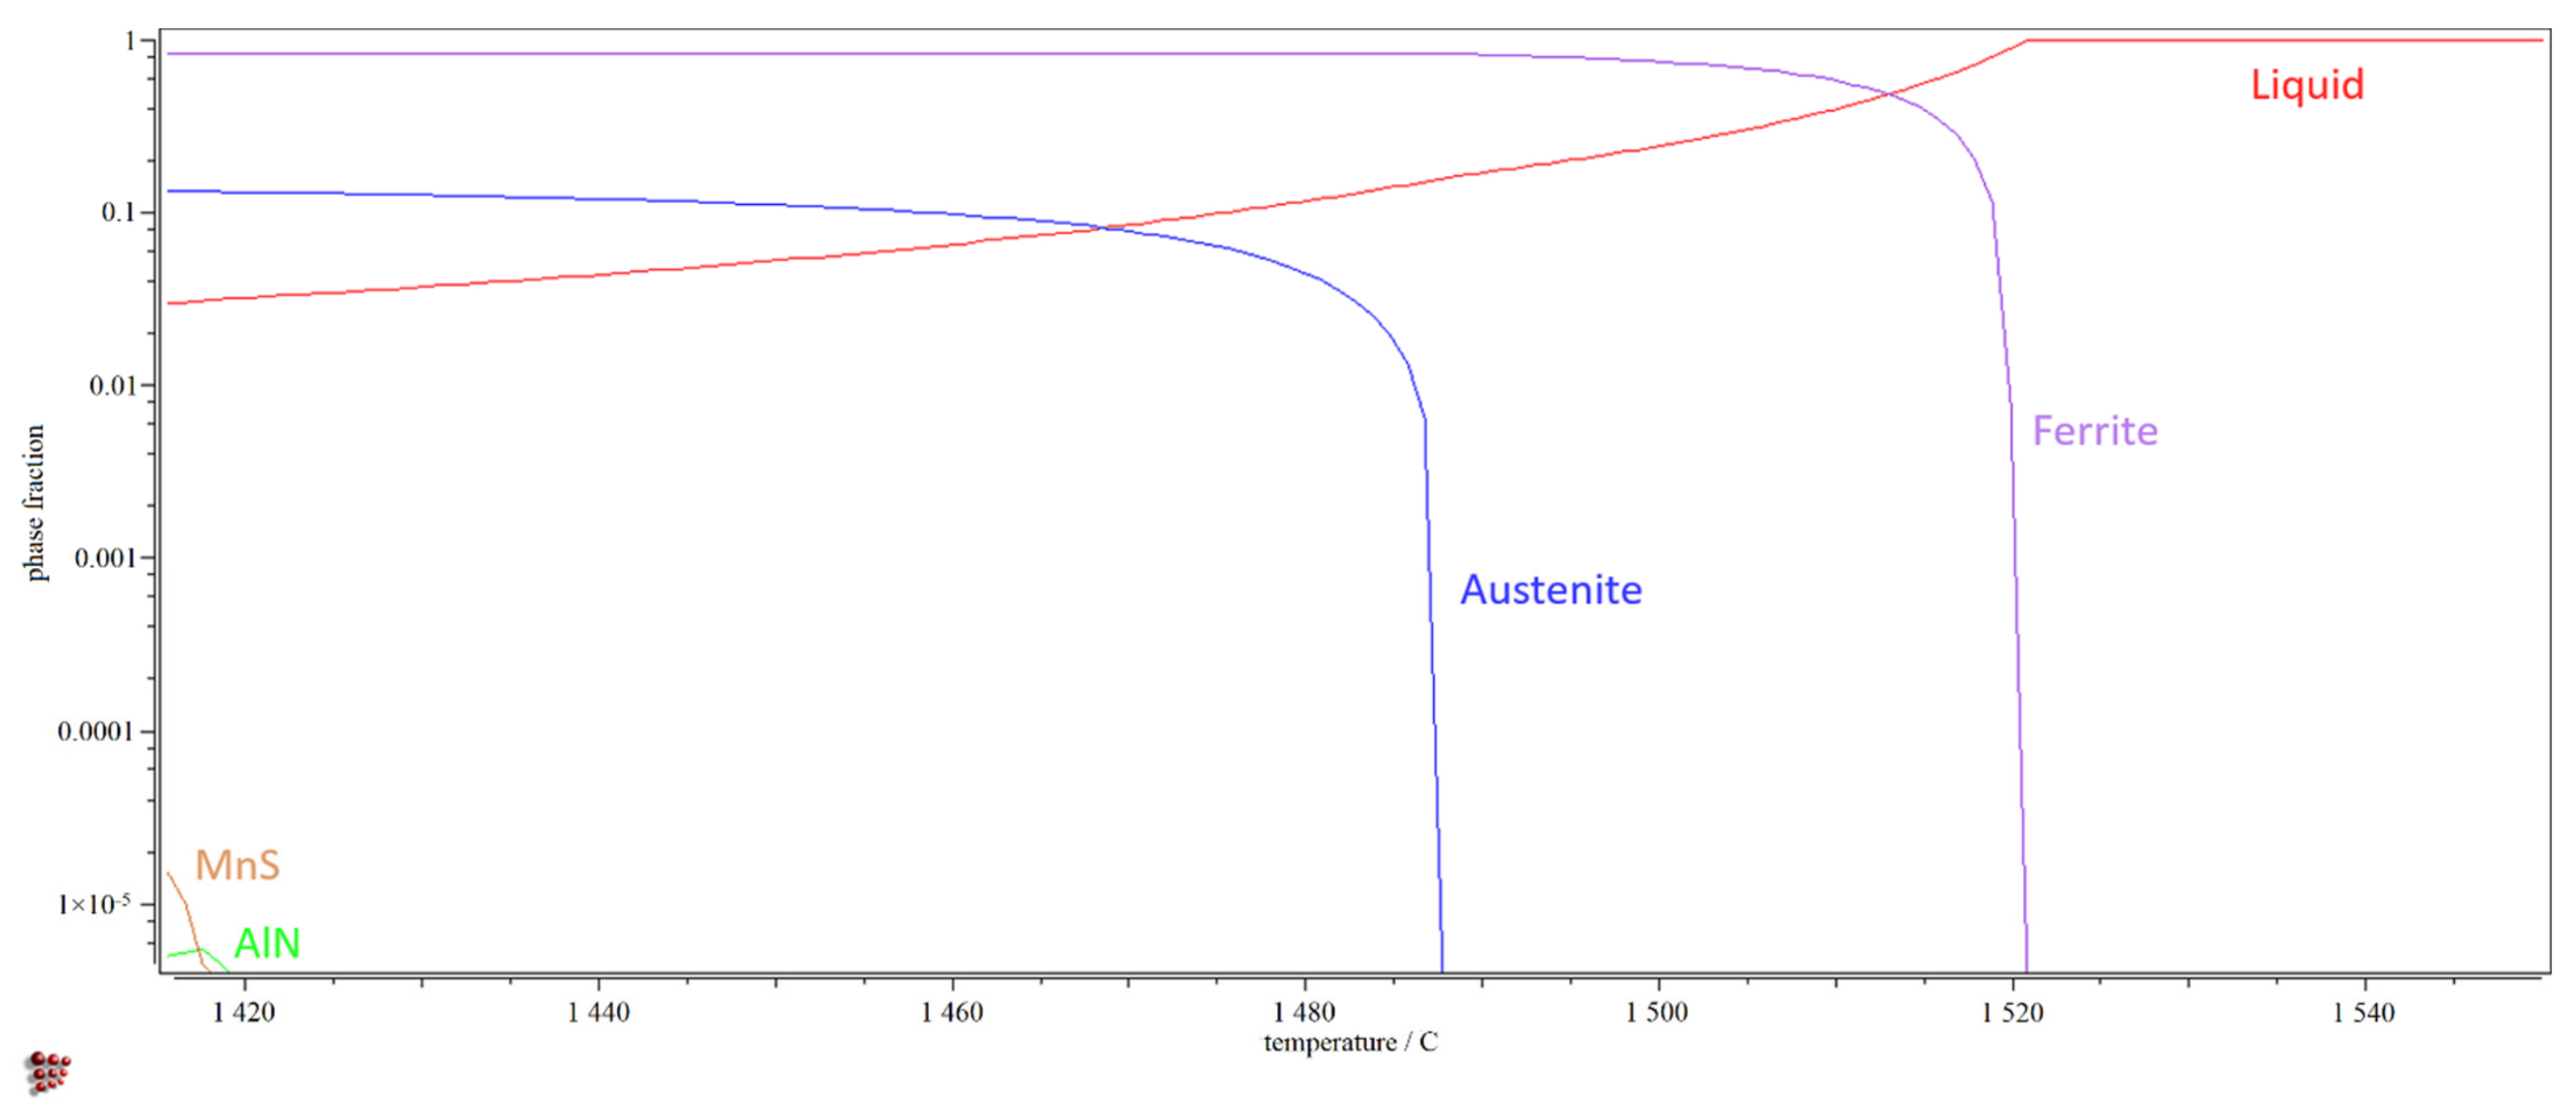
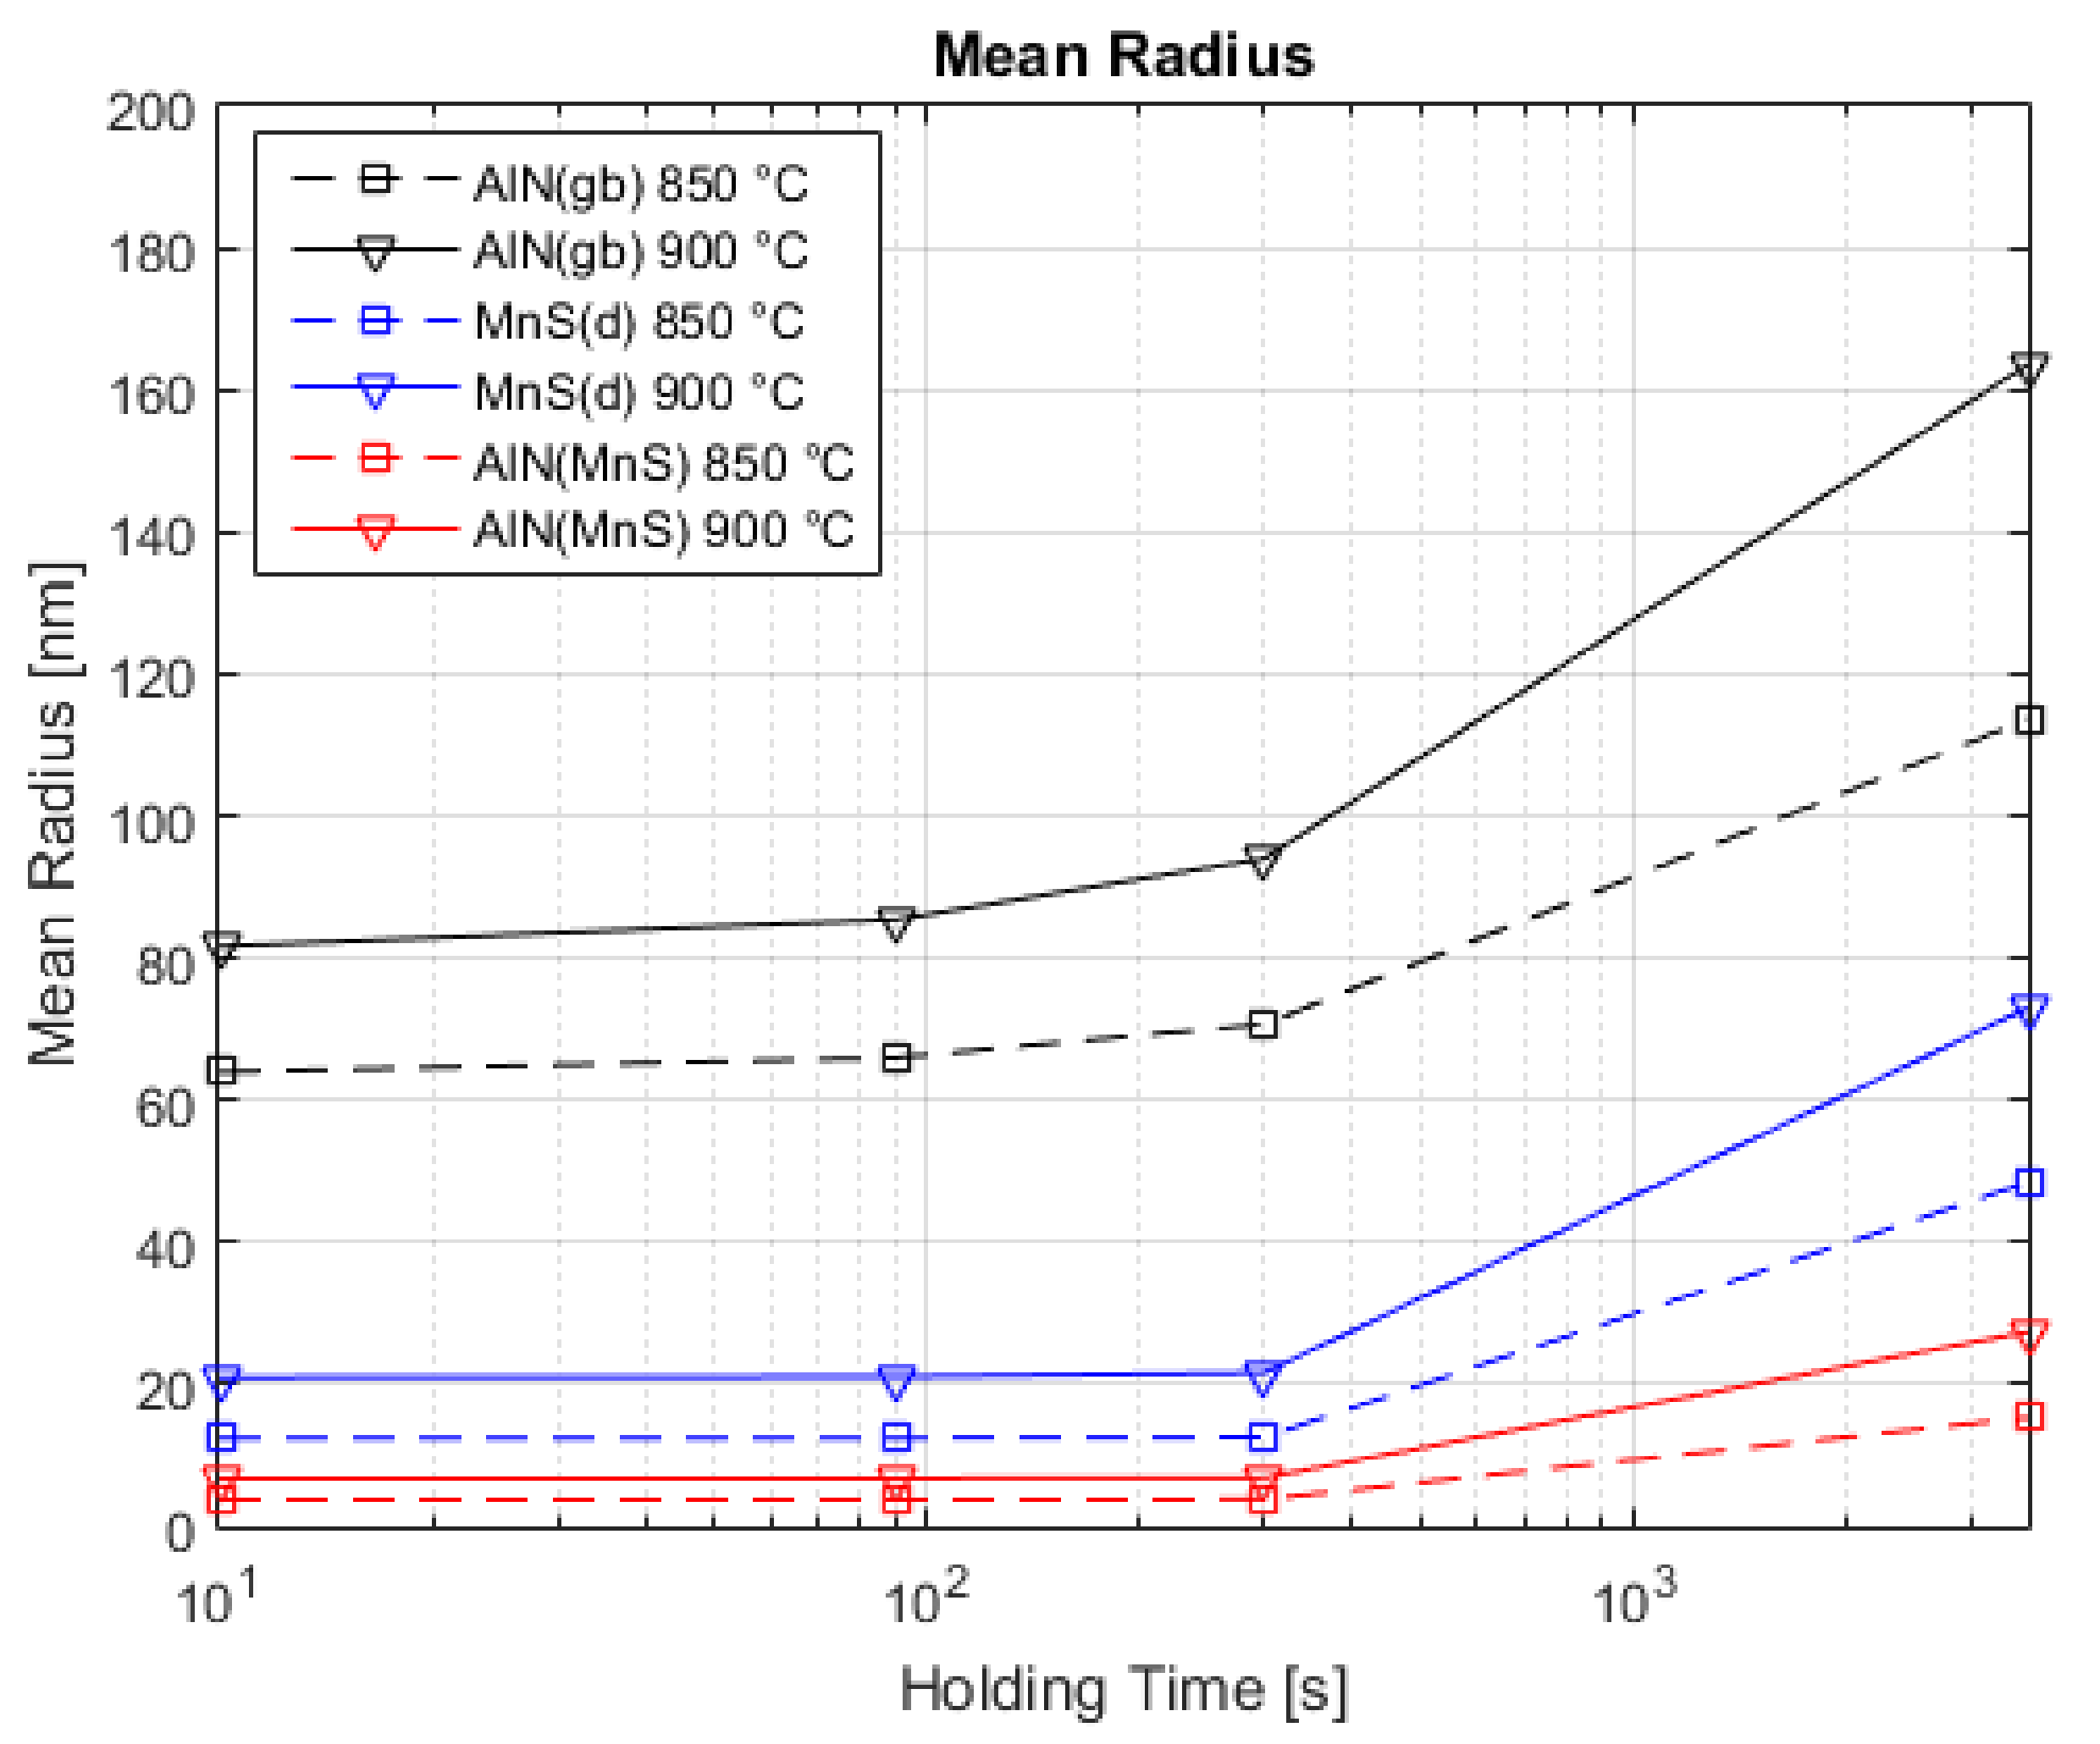
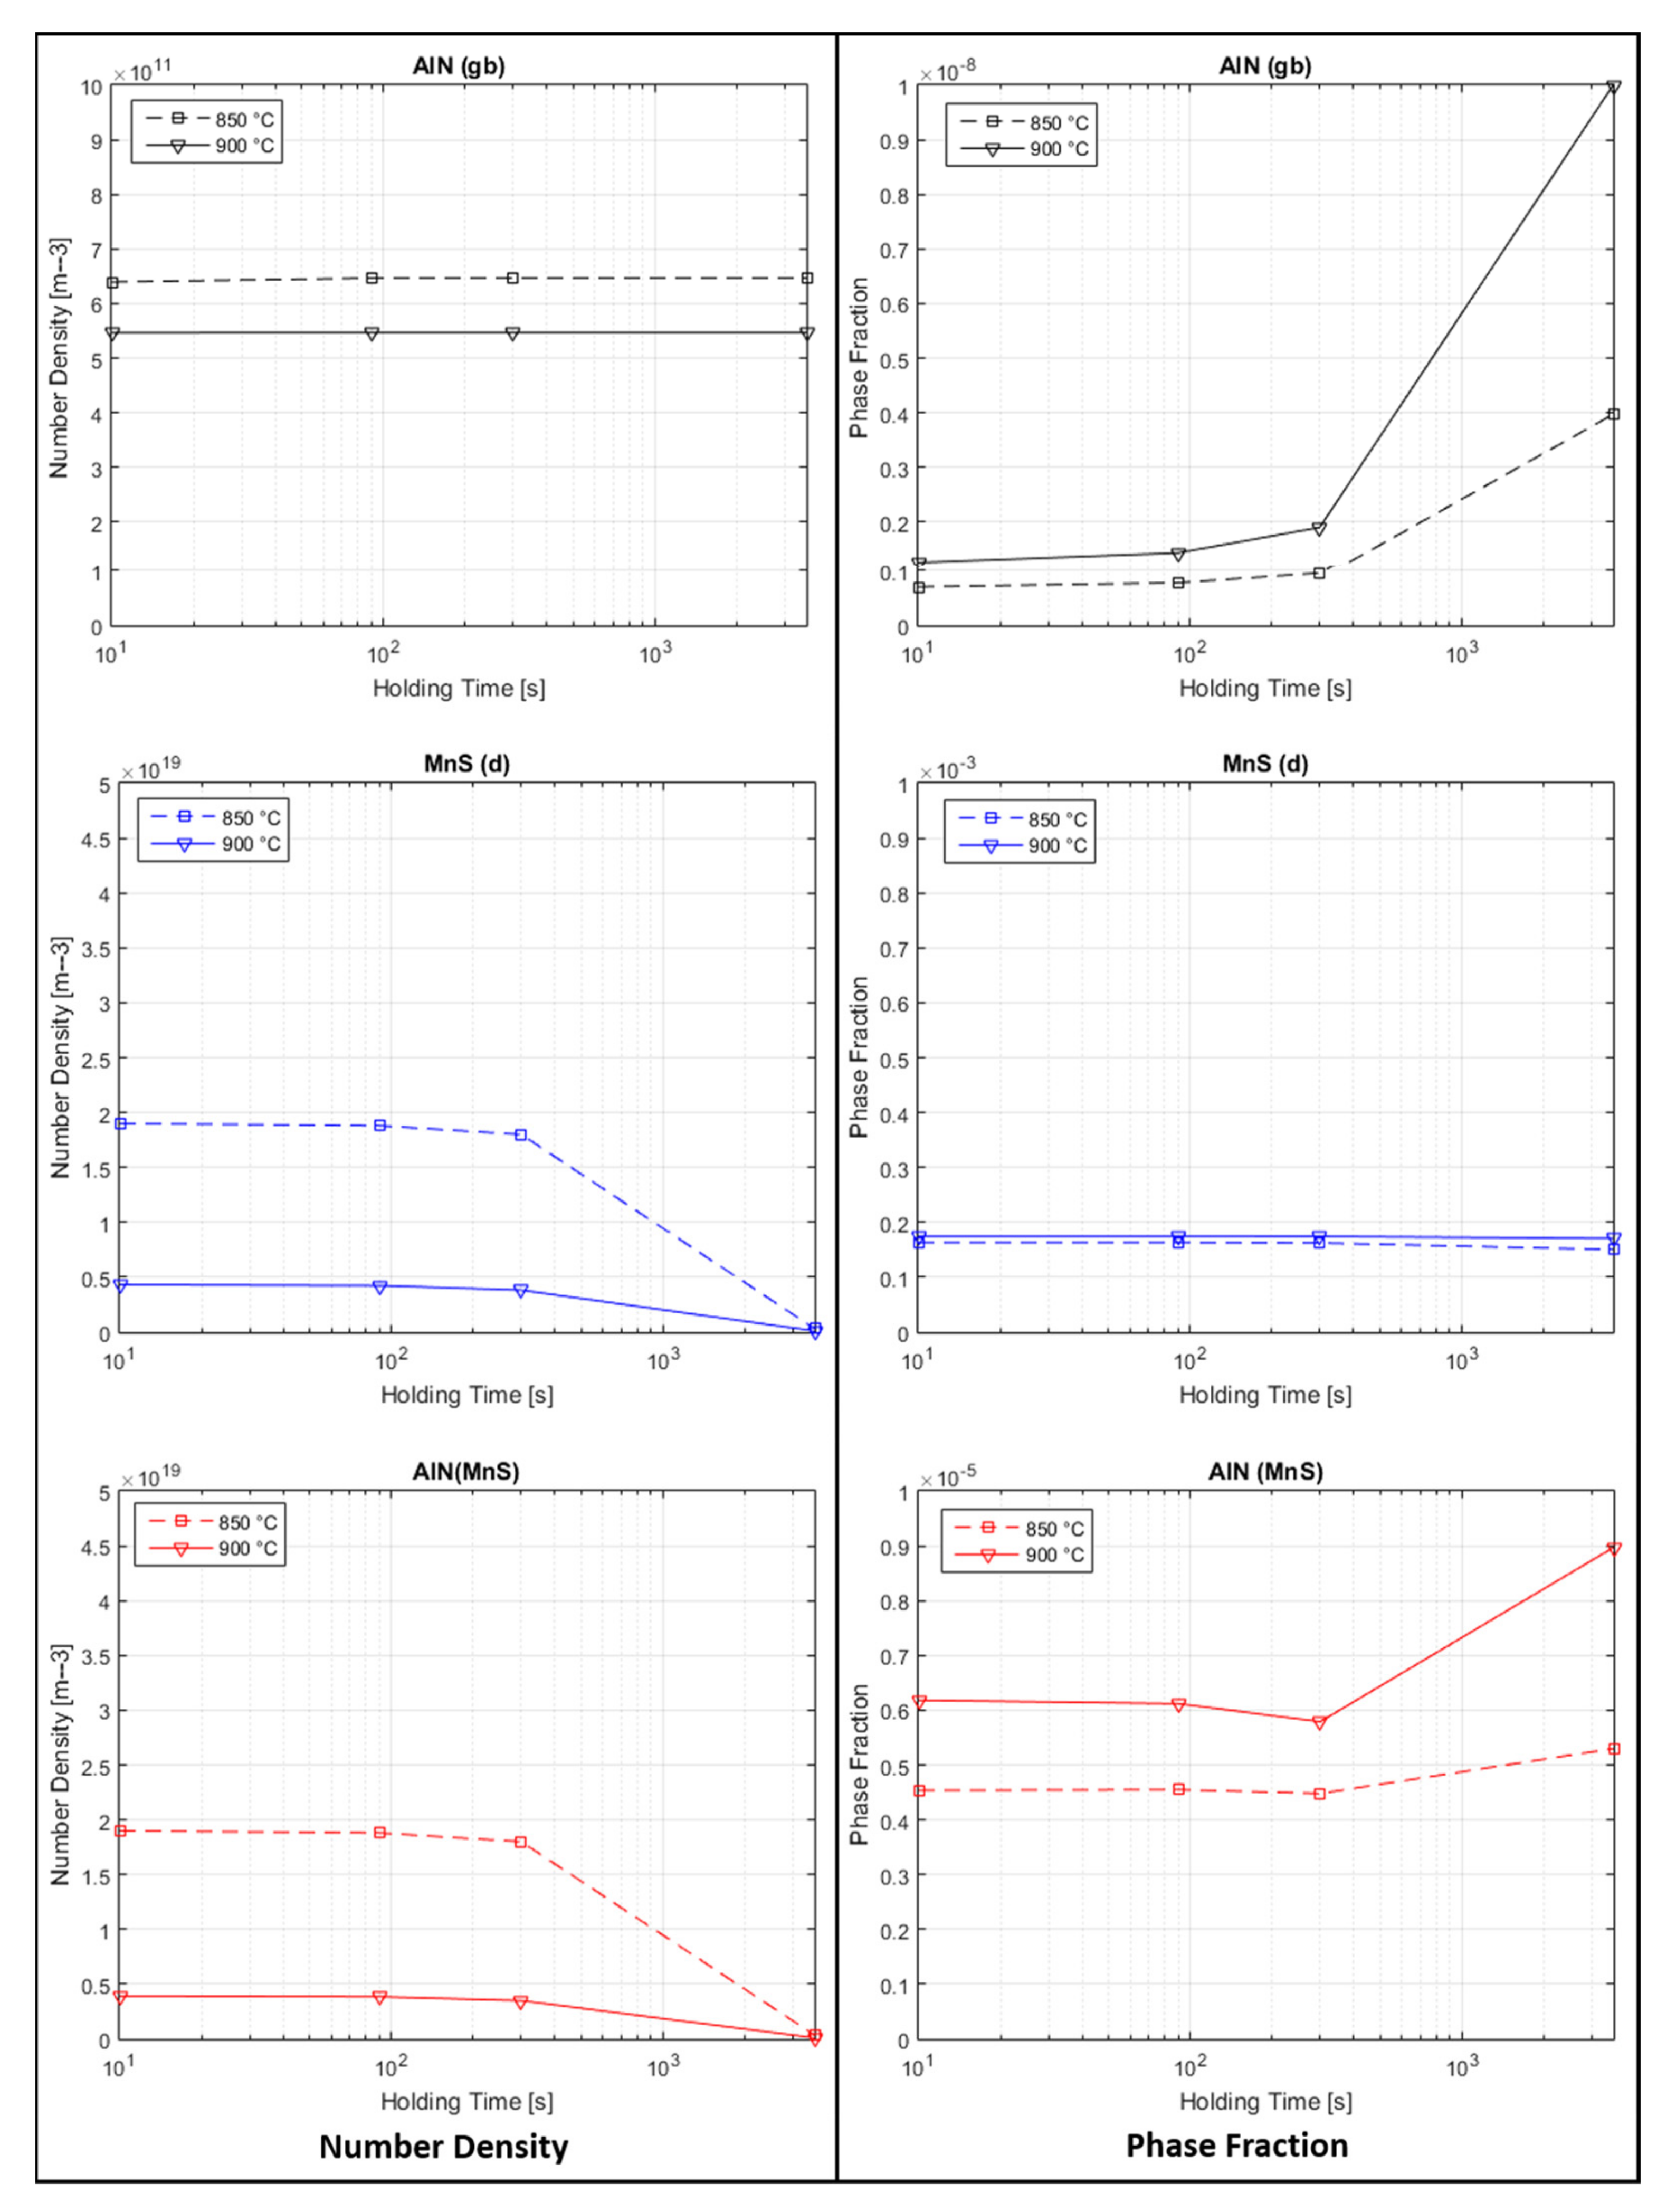
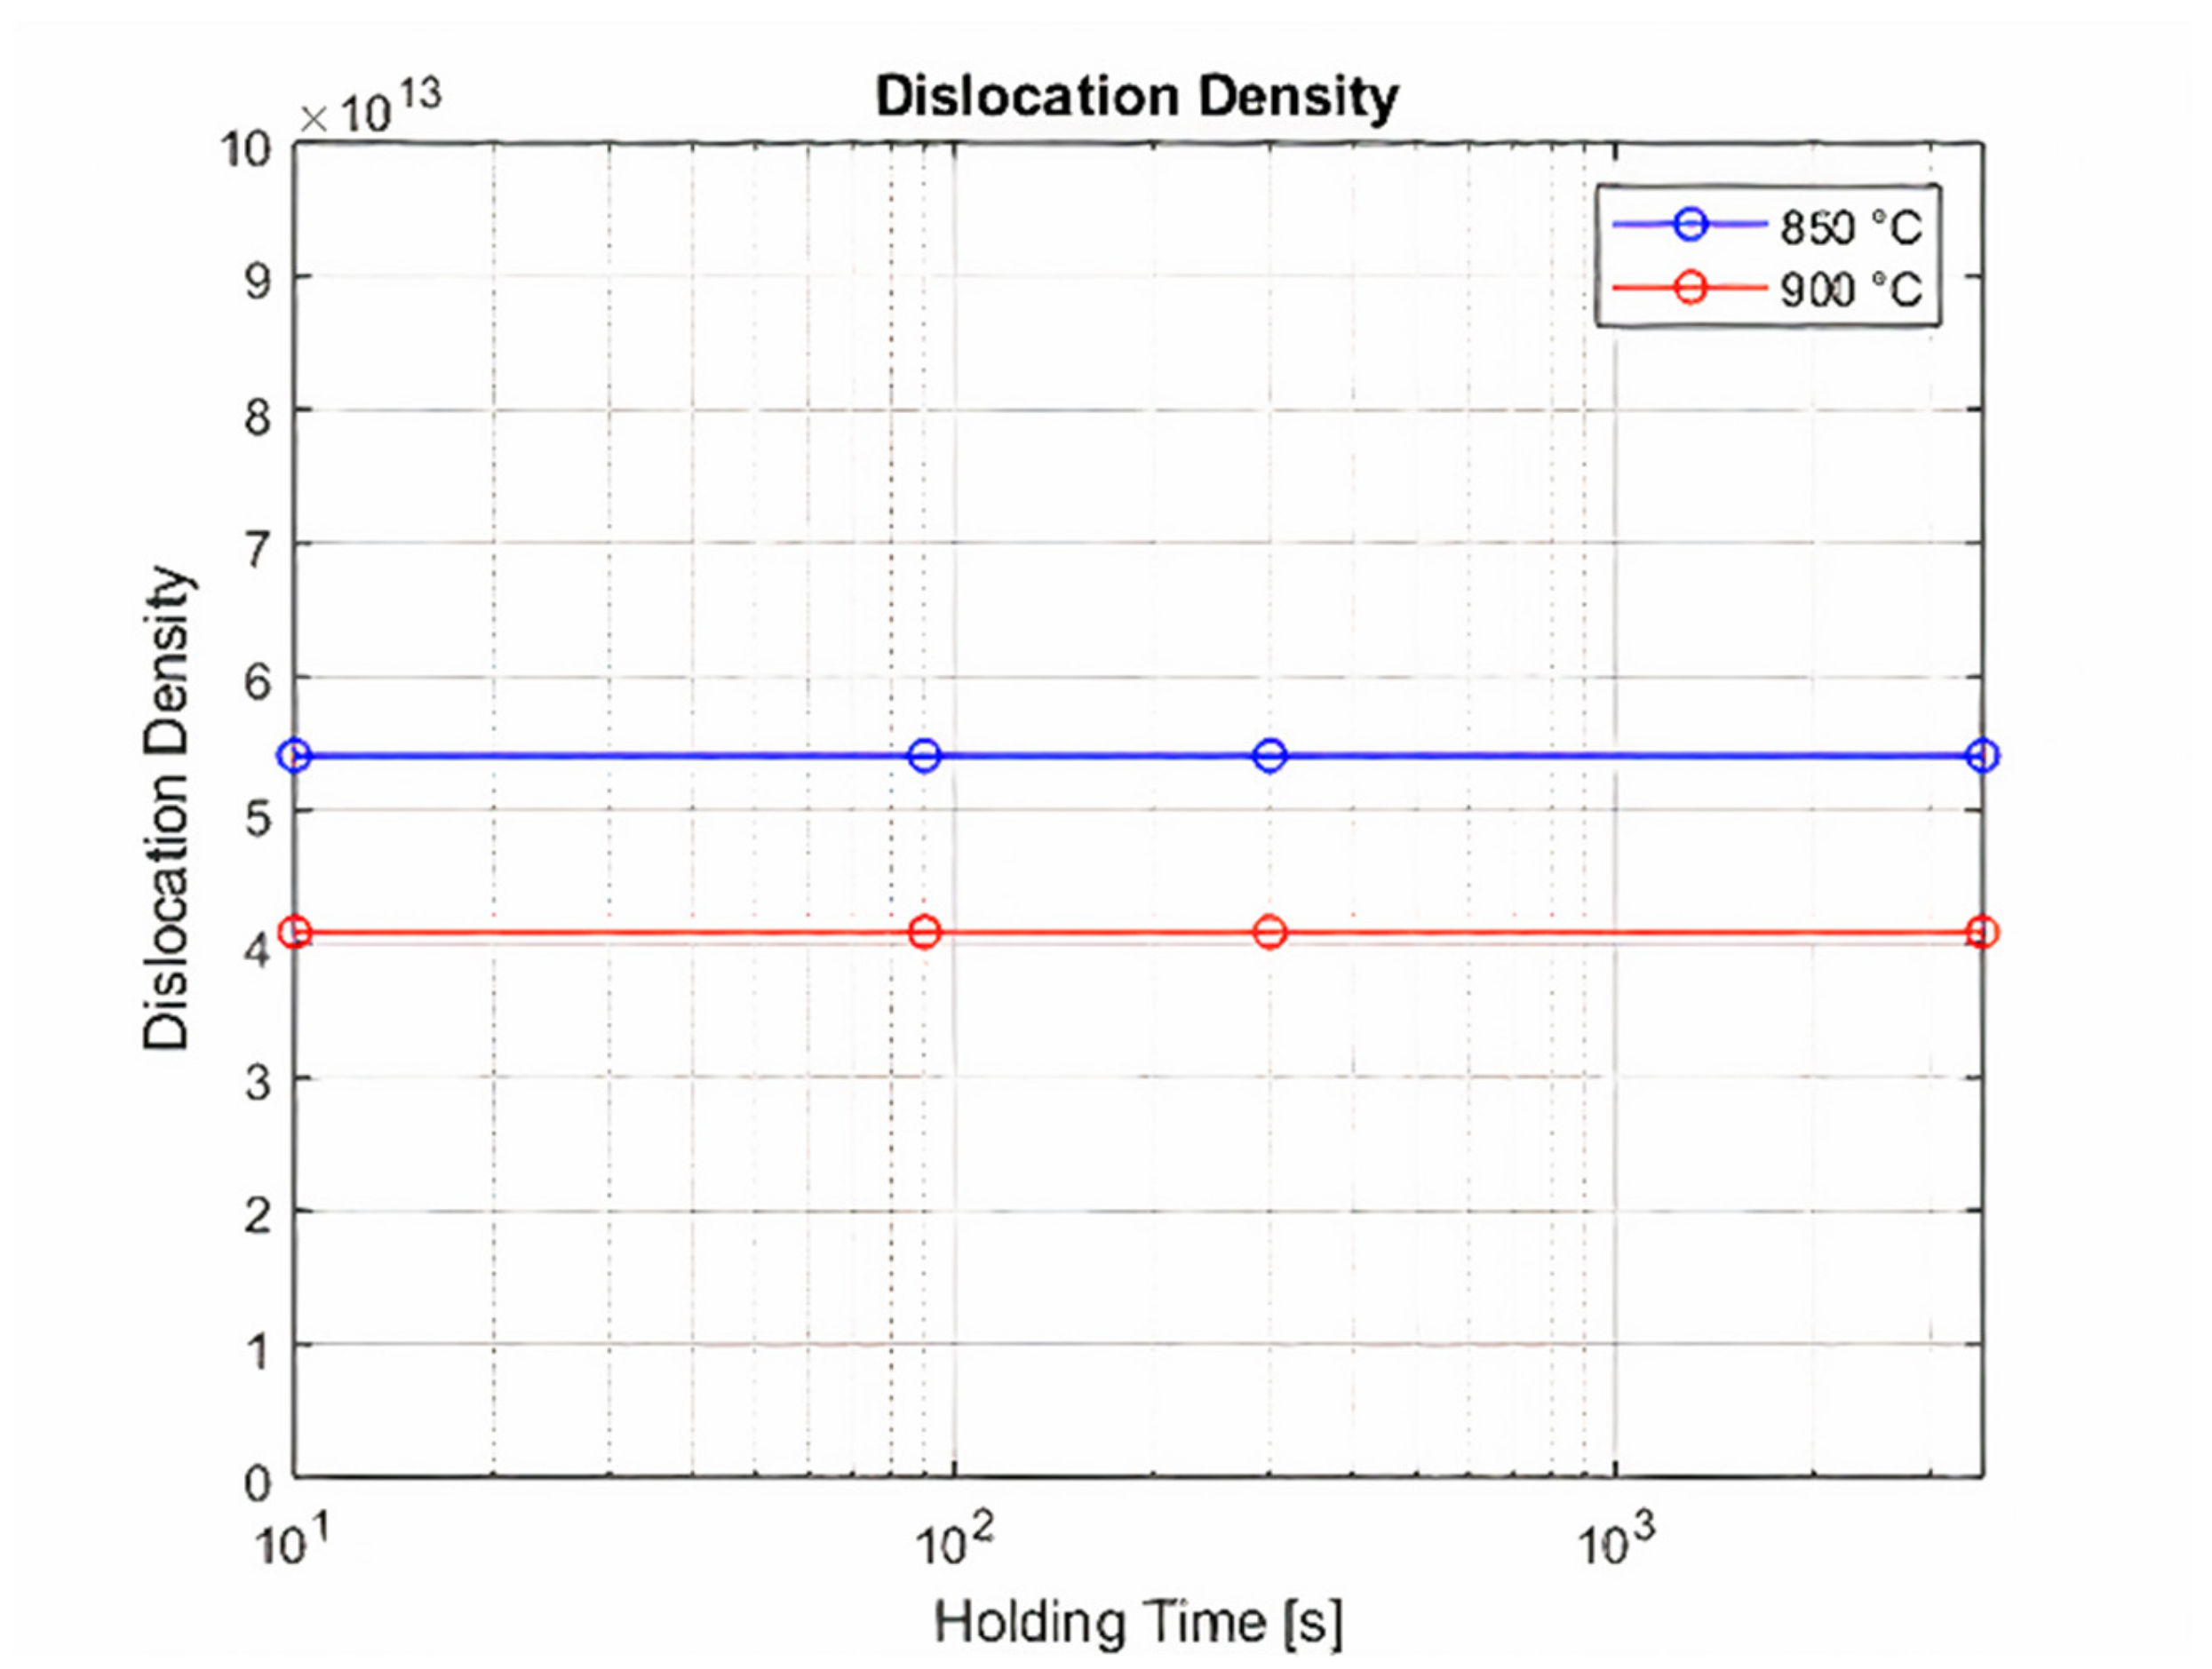
The equilibrium phase diagram and Scheil–Gulliver solidification simulations are shown in Figure 11 and Figure 12. Precipitation kinetics simulations were done at 900 °C and 850 °C, as explained in the previous section, using different holding times (10 s, 30 s, 90 s, and 3600 s) and straining durations (230 s and 400 s). The results of mean radius, number density and phase fraction are shown in Figure 13 and Figure 14, respectively. Dislocation density was also simulated, and the results can be seen in Figure 15.
Simulating the size of the precipitates, represented by the mean radius values, resulted in bigger precipitates at the higher temperature and almost no difference to be seen between the different holding times until 300 s. However, for 3600 s of holding time, there was an increase for all precipitates and temperatures.
The number density did not show remarkable changes for the AlN(gb) precipitates between the different holding times and for the other two precipitates, a reduction between 300 and 3600 s was seen, clearer at 850 °C. For all of them, the number density values were lower at higher temperatures.
Phase fraction brought virtually no change for the MnS(d) precipitates, but for all of the others, an increase was seen, initially slight at 300 s of holding time, and then more accentuated at 3600 s. Comparing the evolution of the results for AlN formed at MnS and the ones formed at grain boundaries, the changes were less pronounced for those formed at the other precipitate.
Dislocation density simulations showed higher values for lower temperatures with no change between different holding times.

4. Discussion

4.1. Experiments

Increasing the holding time at a determined temperature prior to the tensile test has resulted previously in different conclusions [13,14,15,16,17,18]. In Figure 4, it was seen that until 300 s of holding time there was no significant change in the ductility curve of the material tested. When the holding time was increased to 3600 s, a clear difference was seen at each of the three temperatures.
One of the reasons for the changes seen in previous studies with different holding times was the presence of a greater amount of certain alloying elements, such as Nb, V or Ti, that form other precipitates detrimental to ductility [13,15,17,22].
Another explanation for the changes in the results for the RA was given by Kang et al. [14] and Zheng et al. [17], which correlate it to the segregation of S at austenite grain boundaries. The more sulfur, the worse the ductility will be. Kang et al. [14] referred to S as an important agent on the ductility when longer holding times are used in steels containing Mn. This is because of the formation of more MnS, decreasing the concentration of S at grain boundaries. Zheng et al. [17] concluded that if the holding time is longer than the critical time of maximum grain boundary segregation, the hot ductility can be improved. The critical time depends on the temperature, but for temperatures lower than 950 °C, it was observed to be longer than 300 s for C-Mn steels, and little change was reported for holding times lower than 300 s.
The references mentioned indicate changes in the RA that were different from those seen in the present work. The explanation lies in the different content of alloying elements (and consequently the precipitates formed), testing temperatures and holding times chosen. When comparing the results at holding times of 300 s or less, it is seen that the discrete differences present are in accordance with the previous publications, which did not report considerable changes in this time range. Holding times higher than 300 s showed improved ductility at 750 °C, but reduced ductility at 850 and at 900 °C. This is close to the results reported by Crowther and Mintz [15] for the alloy identified as “high Al content,” which has a composition closer to that of the present alloy studied. The reason for this is the static precipitation of AlN at the austenite grain boundaries, which are the precipitates formed before the deformation process and believed to be the main cause of the worsening of the hot ductility.
The results of ultimate tensile strength and maximal elongation also did not show great variation with the distinct holding times until 300 s, but there was a discrete reduction at some of the temperatures when the holding time was longer. This can also be correlated to the results presented by Crowther and Mintz [15], where the samples with no Nb or V, only Al, showed no great change in the peak stress and only a small reduction in maximal elongation. The UTS results were higher for the lower temperatures and the opposite was registered for the maximal elongation; higher for higher temperatures. This result was as expected [15,23,24,25].
SEM images produced for the samples at each time and temperature follow the results of the RA curves. Considering the curves for 10, 90, and 300 s, where the ductility was at the minimum (750 °C), the fracture seen is intergranular with dimples on the surface, indicating the presence of the ferrite films. At 850 °C, a temperature of intermediate ductility, signs of brittle and ductile fracture are seen mixed (clear intergranular decohesion and microvoid coalescence). Finally, at 900 °C, a temperature at which the RA values are higher, and consequently the ductility is better, the fracture confirms this conclusion with the ductile fracture type clearly seen, with the presence of dimples and voids, and no clear grain surface observed. These results can be compared to those reported before for other low alloyed steels [1,16,25]. With the great increase in the holding time to 3600 s, the sample showed more dimples on the surface (more ferrite) at 750 °C; the sample at 850 °C had less indication of ductile fracture and more of intergranular and finally, the sample at 900 °C showed grains and dimples, signifying the change to a mixed fracture.
None of the images showed clear changes until 300 s of holding time at all of the tested and analyzed temperatures. Once again, this can be attributed to the fact that the times imposed were not long enough to promote changes. When the holding time was increased to 3600 s, the fracture surfaces were seen to be in complete accordance with the hot ductility curve, in which the ductility worsened at 850 and 900 °C, associated with the observation of a greater number of grain surfaces and improved at 750 °C. This could be related to the higher amount of ferrite at the boundaries. Ouchi and Matsumoto [16] observed the difference in the fracture surface due to the ferrite thickness increase with the rise in holding time. This increase was shown to be significant above 5 min of holding time.
With the LOM images, the presence of the ferrite films at grain boundaries could be further confirmed at 750 °C for all holding times, with an easily noticeable rise at 3600 s, as well as the crack initiation at this location, mainly at the shorter holding times, owing to the fact that ferrite is the softer phase, accumulating strain [1,4,8,10,12,15]. This ferrite is not only influenced by the temperature, but also by the deformation, enhancing the loss in ductility when present in a critical amount. If the ferrite content is increased, the ductility is then improved [7,8,25]. This is seen in the results from the RA curve presented in Figure 3. At 850 and 900 °C, no clear change could be seen in the LOM images with the different holding times, because at these temperatures the precipitates are the strongest influencing factor on the ductility.

4.2. Simulations

From the equilibrium simulations, it was observed that only MnS, AlN, and cementite were expected to be formed. This is due to the low quantities of other alloying elements in this steel. The results found regarding the formation of AlN and MnS were in accordance with published works for similar steel compositions [26,27].
Furthermore, these calculations provided information on the formation of the primary and secondary precipitates, being the primary in a very low fraction and formed while still in the liquid phase, and the secondary in a more considerable quantity. Despite the fact that the primary precipitates are in a lower fraction, they are larger and can be the cause for the initiation of cracks and further failures. Additionally, the simulations indicate the initiation of austenite–ferrite transformation at around 830 °C, implicitly indicating that ferrite should not be present in the samples tested at 850 °C. This is not what was seen in the images from Figure 8 and Figure 10 because of the formation of ferrite induced by the deformation.
The mean radius calculations resulted in smaller precipitates at the lower temperature, which is caused by less diffusion happening at this point, leading to a lower growth rate. This reinforces the result seen experimentally of less ductility at 850 °C, since finer precipitates are worse for the ductility [1,2,10]. The AlN precipitates at grain boundaries were seen to have the biggest values and AlN(MnS) the smallest. With the different holding times, the mean radius of all precipitates did not show clear changes until 300 s, but increased when the holding time was 3600 s. The increase is justified by more time for the precipitates to grow before the beginning of the tensile test.
The number density simulation results were as expected regarding the temperature: Lower for higher temperatures as a result of greater coarsening, which is also the reason for more accentuated changes at 850 °C. This result can also be related to the mean radius results and the reduced ductility at the lower temperature. Once again, changes were only seen when the holding time was increased to 3600 s, and this time only for the MnS(d) and the AlN(MnS), which were reduced. This indicates that precipitates at the grain boundaries are expected to grow, but not to coarsen when the material is held for a longer time at the same temperature.
The phase fraction information can be obtained by combining the results from the mean radius and the number density. With that, the impact of precipitates in the material can be better evaluated. In the present case, the highest values were for MnS(d), followed by AlN(MnS) and AlN(gb). For all of these, the phase fraction values were higher for higher temperatures, due to the stronger influence of the size of the precipitates (mean radius) on this parameter. Also following the mean radius results and reinforcing the stronger influence it has, when the holding time was increased to 3600 s, the phase fraction showed an increase for AlN precipitates. The MnS(d) precipitates did not show a clear change with the holding time, which may well be a result of a balance between the increase in the mean radius and the decrease in number density.
All in all, the simulations showed that the longer holding time leads to growth of AlN at grain boundaries, a coarsening of MnS at dislocations and a coarsening and growth of AlN at MnS.
The changes in the precipitates’ parameters seen when the holding time was changed can be linked to the experimental results. Precipitation kinetics simulations did not show changes for the holding times of 10, 90, and 300 s, which was also seen in the RA results. However, when the holding time was increased to 3600 s, changes were observed in both the simulation and the ductility curve. As the mean radius and phase fraction of the precipitates increased at 850 and 900 °C, the ductility also worsened. This indicates accordance between the simulation results and the experimental ones, since the increased fraction of precipitates seen at grain boundaries can lead to cracks and consequently, the lower RA values. Furthermore, it can be inferred from the simulation results associated with what was seen experimentally that the static precipitated AlN at the grain boundaries are the ones responsible for worsening the ductility, as previously established by Crowther and Mintz [15].
The dislocation density simulations also showed agreement with what was expected from theory, since these resulted in lower values for higher temperatures. The occurrence of increased annihilation at the higher temperature is the reason for this expected result. Likewise, there was no difference seen with the increase in holding time, which was as expected because the increase in the number of dislocations is attributed to the straining during the tensile test. The higher values at the lower temperature can also be compared to the experimental results, given that with more dislocations, there are more sites for precipitation nucleation, which are detrimental to ductility.

5. Conclusions

For the plain low alloyed steel studied, where only AlN, MnS, and Fe3C are expected to be formed, changing the holding time before the tensile test in the range of 10 and 300 s did not have a significant impact on the RA measurements, but the increase in this holding time to 3600 s brought changes, showing that this parameter can influence the hot ductility behavior of the steel.
The significant increase in the holding time improved the ductility at 750 °C and reduced it at 850 and 900 °C. With the analysis of the images made with SEM and LOM, the experimental results were confirmed with no notable difference between the holding times at the same temperature until 300 s, but with 3600 s, more ferrite was present at 750 °C and clear signs of intergranular fracture were seen at 850 and 900 °C.
This result was reinforced by the precipitation kinetics simulations, which also did not show great changes in this time range (10 to 300 s), but the opposite for a higher holding time (3600 s). The simulations indicate that the precipitates, mainly AlN at grain boundaries, are the reason for the lower ductility seen at these points (3600 s, 850 and 900 °C).

Author Contributions

Conceptualization, M.G., C.H. and C.S.; methodology, M.G. and C.H.; validation, M.G. and C.H.; formal analysis M.G.; investigation, M.G.; resources, S.I. and J.S.; data curation, M.G and C.H.; writing—original draft preparation, M.G.; writing—review and editing, M.G, C.H., S.I., J.S. and C.S.; visualization, M.G. and C.H.; supervision, C.S.; project administration, M.G., C.H., S.I, J.S. and C.S.; funding acquisition, S.I, J.S. and C.S.; All authors have read and agreed to the published version of the manuscript.

Funding

This research was funded by the Austrian Research Promotion Agency, grant number 869295. The APC was funded by the quota granted to Christof Sommitsch, voucher number bc1c32e04035b455.

Institutional Review Board Statement

Not applicable.

Informed Consent Statement

Not applicable.

Data Availability Statement

The data presented in this study are openly available in FigShare at 10.6084/m9.figshare.13502061.

Acknowledgments

The authors gratefully acknowledge the funding support of K1-MET GmbH. The research program of the K1-MET competence center is supported by COMET (Competence Centre for Excellent Technologies), the Austrian program for competence centers. COMET is funded by the Federal Ministry for Climate Action, Environment, Energy, Mobility, Innovation and Technology, the Federal Ministry for Digital and Economic Affairs, the provinces of Upper Austria, Tyrol and Styria and by the Styrian Business Promotion Agency (SFG). Furthermore, we thank Upper Austrian Research for the continuous support. In addition, this research project is partially financed by the industrial partners Primetals Technologies Austria and voestalpine Stahl and the scientific partners Graz University of Technology and TU Wien.

Conflicts of Interest

The authors declare no conflict of interest.

References

  1. Arikan, M.M. Hot ductility behavior of a peritectic steel during continuous casting. Metals 2015, 5, 986–999. [Google Scholar] [CrossRef] [Green Version]
  2. Caliskanoglu, O. Hot Ductility Investigations of Continuously Cast Steels. Ph.D. Thesis, Graz University of Technology, Graz, Austria, 2015. [Google Scholar]
  3. Schöbel, M.; Großeiber, S.; Jonke, J.; Wimpory, R.; Ilie, S.; Requena, G. Residual stress in continuously cast steel slabs. BHM 2013, 158, 475–476. [Google Scholar] [CrossRef]
  4. Mintz, B.; Yue, S.; Jonas, J.J. Hot ductility of steels and its relationship to the problem of transverse cracking during continuous casting. Int. Mater. Rev. 1991, 36, 187–220. [Google Scholar] [CrossRef]
  5. Huitron, R.M.P.; Lopez, P.E.R.; Vourinen, E.; Jentner, R.; Kärkkäinen, M.E. Converging criteria to characterize crack susceptibility in a micro-alloyed steel during continuous casting. Mater. Sci. Eng. A 2020, 772, 138691. [Google Scholar] [CrossRef]
  6. Louhenkilpi, S. Treatise on Process Metallurgy; Elsevier: Amsterdam, The Netherlands, 2014; Volume 3, pp. 373–434. [Google Scholar]
  7. Mintz, B.; Crowther, D.N. Hot ductility of steels and its relationship to the problem of transverse cracking in continuous casting. Int. Mater. Rev. 2010, 55, 168–196. [Google Scholar] [CrossRef]
  8. Lewis, J.; Jonas, J.J.; Mintz, B. The deformation induced ferrite during mechanical testing. ISIJ Int. 1998, 38, 300–309. [Google Scholar] [CrossRef]
  9. Hoflehner, C.; Ilie, S.; Six, J.; Beal, C.; Sommitsch, C. Influence of thermal history on the hot ductility of a continuously cast low alloy Cr-Mo steel. J. Mater. Eng. Perform. 2018, 26, 5124–5129. [Google Scholar] [CrossRef] [Green Version]
  10. Banks, K.M.; Tuling, A.; Mintz, B. Influence of thermal history on the hot ductility of steel and its relationship to the problem of cracking in continuous casting. Mater. Sci. Technol. 2012, 28, 536–542. [Google Scholar] [CrossRef]
  11. Bernhard, C.; Reiter, J.; Presslinger, H. A model for predicting the austenite grain size at the surface of continuously-cast slabs. Metall. Trans. B 2008, 39B, 885–895. [Google Scholar] [CrossRef]
  12. Beal, C.; Caliskanoglu, O.; Sommitsch, C.; Ilie, S.; Six, J.; Domankova, M. Influence of thermal history on the hot ductility of Ti-Nb microalloyed steels. Mater. Sci. Forum. 2016, 879, 199–204. [Google Scholar] [CrossRef]
  13. Ouchi, C.; Matsumoto, K. Hot ductility in Nb-bearing high-strength low-alloy steels. Trans. ISIJ 1982, 22, 181–189. [Google Scholar] [CrossRef]
  14. Kang, M.H.; Lee, J.S.; Koo, Y.M.; Kim, S.-J.; Heo, N.H. The mechanism of hot ductility loss and recovery in Nb-bearing low alloy steels. Metall. Trans. A 2014, 45A, 4302–4306. [Google Scholar] [CrossRef] [Green Version]
  15. Crowther, D.N.; Mohamed, Z.; Mintz, B. The relative influence of dynamic and static precipitation on the hot ductility of microalloyed steels. Metall. Trans. A 1987, 18A, 1929–1939. [Google Scholar] [CrossRef]
  16. Suzuki, H.G.; Nishimura, S.; Yamaguchi, S. Characteristics of hot ductility in steels subjected to the melting and solidification. Trans. ISIJ. 1982, 22, 48–56. [Google Scholar] [CrossRef]
  17. Zheng, Z.; Yu, H.; Liu, Z.; Xu, T.; Devesh, R.; Misra, K. Mechanism of hot ductility loss in C-Mn steels based on nonequilibrium grain boundary segregation of impurities. J. Mater. Res. 2015, 30, 1701–1714. [Google Scholar] [CrossRef]
  18. Balbi, M.; Alvarez-Armas, I.; Armas, A. Effect of holding time at an intercritical temperature on the microstructure and tensile properties of a ferrite-martensite dual phase steel. Mater. Sci. Eng. A 2018, 733, 1–8. [Google Scholar] [CrossRef]
  19. Kozeschnik, E. MatCalc Version 6.02 (Database mc_fe_v2.060). Available online: http://matcalc.tuwien.ac.at/ (accessed on 14 September 2020).
  20. Lückl, M.; Wojcik, T.; Povoden-Karadeniz, E.; Zamberger, S.; Kozeschnik, E. Co-precipitation behavior of MnS and AlN in a low-carbon steel. Steel Res. Int. 2017, 89, 1700342. [Google Scholar] [CrossRef]
  21. Sun, W.P.; Militzer, M.; Jonas, J.J. Strain-induced nucleation of MnS in electrical steels. Metall. Trans. A 1992, 23A, 821–830. [Google Scholar] [CrossRef]
  22. Maehara, Y.; Nakai, K.; Yasumoto, K.; Mishima, T. Hot cracking of low alloy steels in simulated continuous casting direct rolling process. Trans. ISIJ 1988, 28, 1021–1027. [Google Scholar] [CrossRef]
  23. Carpenter, K.R.; Killmore, C.R.; Dippenaar, R. Influence of isothermal treatment on MnS and hot ductility in low carbon, low Mn steels. Metall. Trans. B 2013, 45, 372–380. [Google Scholar] [CrossRef] [Green Version]
  24. Lanjewar, H.A.; Tripathi, P.; Singhai, M.; Patra, P. Hot ductility and deformation behavior of C-Mn/Nb-microalloyed steel related to cracking during continuous casting. J. Mater. Eng. Perform. 2014, 23, 3600–3609. [Google Scholar] [CrossRef] [Green Version]
  25. Li, J.; Cheng, G. Hot ductility of Cr15Mn7Ni4N austenitic stainless steel slab. J. Mater. Res. Technol. 2020, 9, 52–58. [Google Scholar] [CrossRef]
  26. Radis, R.; Kozeschnik, E. Kinetics of AlN precipitation in microalloyed steel. Modell. Simul. Mater. Sci. Eng. 2010, 18, 055003. [Google Scholar] [CrossRef]
  27. Chen, Y.; Wang, Y.; Zhao, A. Precipitation of AlN and MnS in low carbon aluminium-killed steel. J. Iron Steel Res. Int. 2012, 19, 51–56. [Google Scholar] [CrossRef]
Figure 1. Sample geometry in millimeters.
Metals 11 00064 g001
Figure 2. Schematic thermomechanical simulator.
Metals 11 00064 g002
Figure 3. Experimental thermal cycle.
Metals 11 00064 g003
Figure 4. Reduction of area at 750, 850, and 900 °C for the different holding times (10, 90, 300, and 3600 s).
Metals 11 00064 g004
Figure 5. Ultimate tensile strength for different holding times.
Metals 11 00064 g005
Figure 6. Maximal elongation reached at each different temperature and holding time.
Metals 11 00064 g006
Figure 7. SEM images with 15×, 100×, and 250× magnification for the samples tested at 750 °C and different holding times.
Metals 11 00064 g007
Figure 8. SEM images with 15×, 100×, and 250× magnification for the samples tested at 850 °C and different holding times.
Metals 11 00064 g008
Figure 9. SEM images with 15×, 100×, and 250× magnification for the samples tested at 900 °C and different holding times.
Metals 11 00064 g009
Figure 10. LOM images with 100× magnification of samples etched with 3% Nital, tested at 750, 850, and 900 °C and with 10, 90, and 300 s of holding times.
Metals 11 00064 g010
Figure 11. Phase diagram at equilibrium.
Metals 11 00064 g011
Figure 12. Scheil–Gulliver equilibrium solidification simulation.
Metals 11 00064 g012
Figure 13. Results of mean radius simulations for AlN at grain boundaries, MnS at dislocations, and AlN at MnS for different temperatures and holding times.
Metals 11 00064 g013
Figure 14. Results of number density and phase fraction simulations for AlN at grain boundaries, MnS at dislocations, and AlN at MnS for different temperatures and holding times.
Metals 11 00064 g014
Figure 15. Results of dislocation density simulations for different temperatures and holding times.
Metals 11 00064 g015
Table 1. Chemical composition in wt%.
CCrMnAlNbNNiPSTiFe
0.0790.2801.6700.0510.0030.00520.0280.0130.00510.0014balance
Publisher’s Note: MDPI stays neutral with regard to jurisdictional claims in published maps and institutional affiliations.