Characterisation of a Real-World Søderberg Electrode

 , ,
, ,
Abstract
1. Introduction
2. Materials and Methods
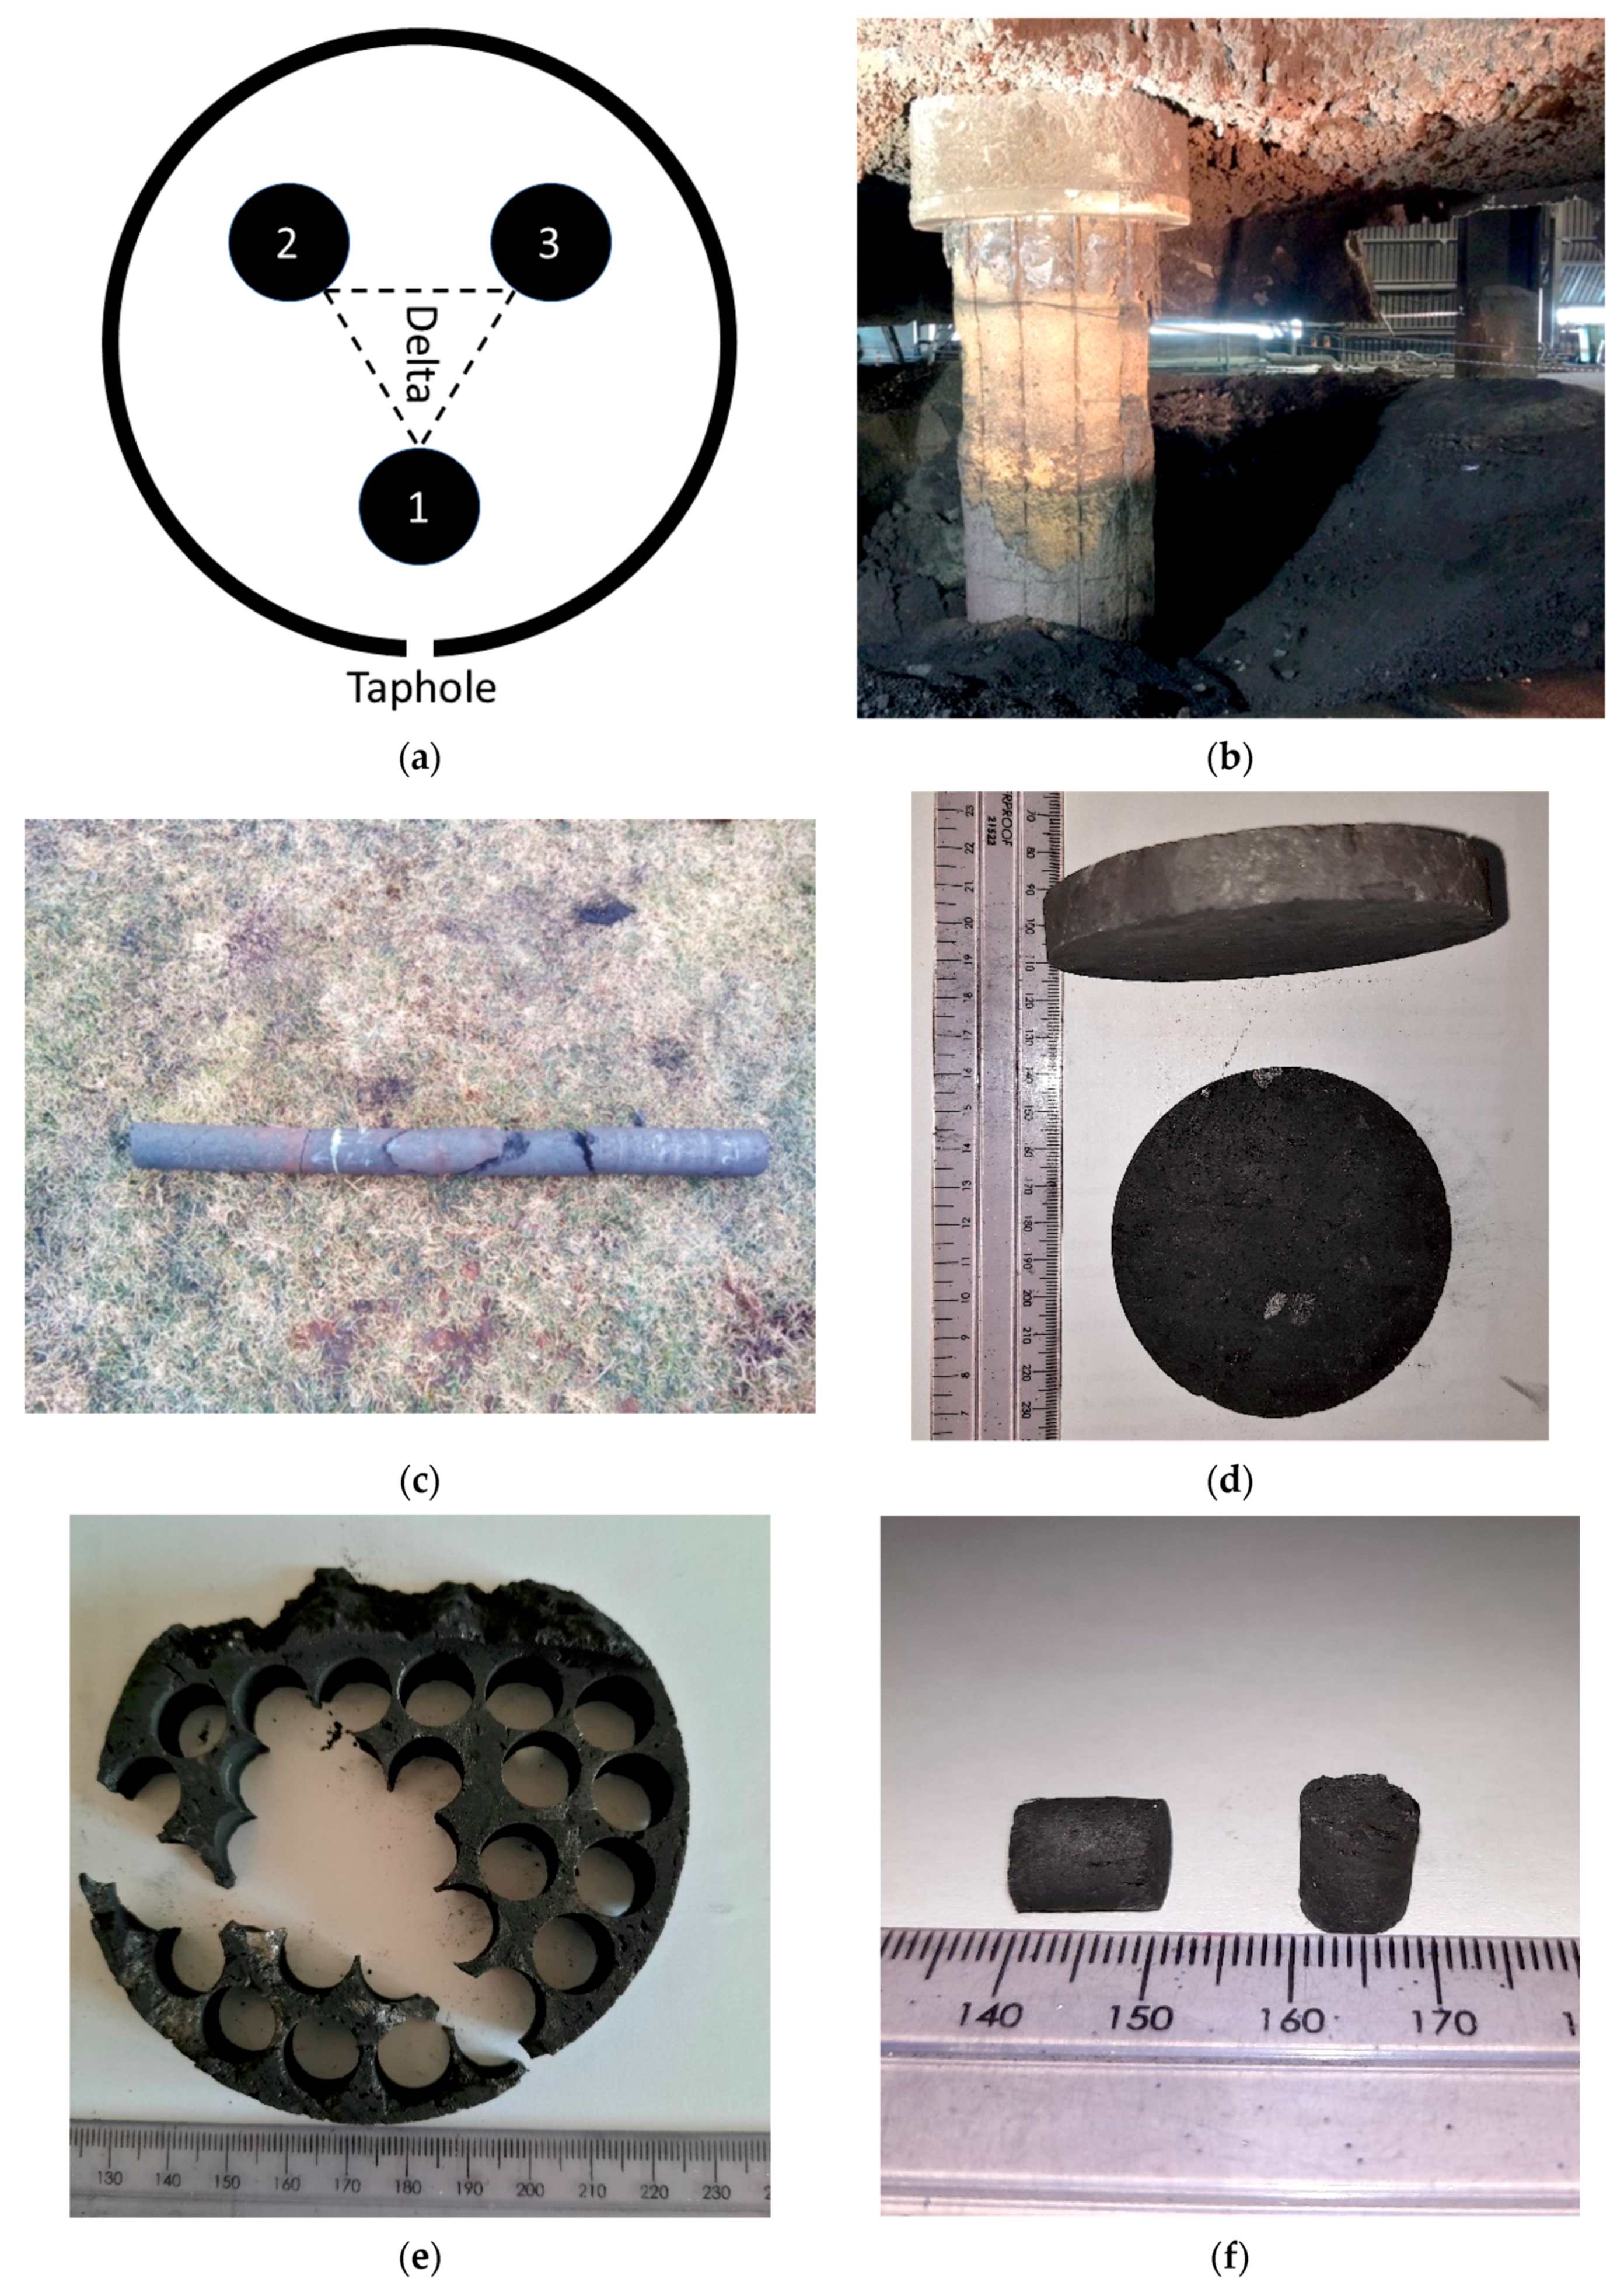
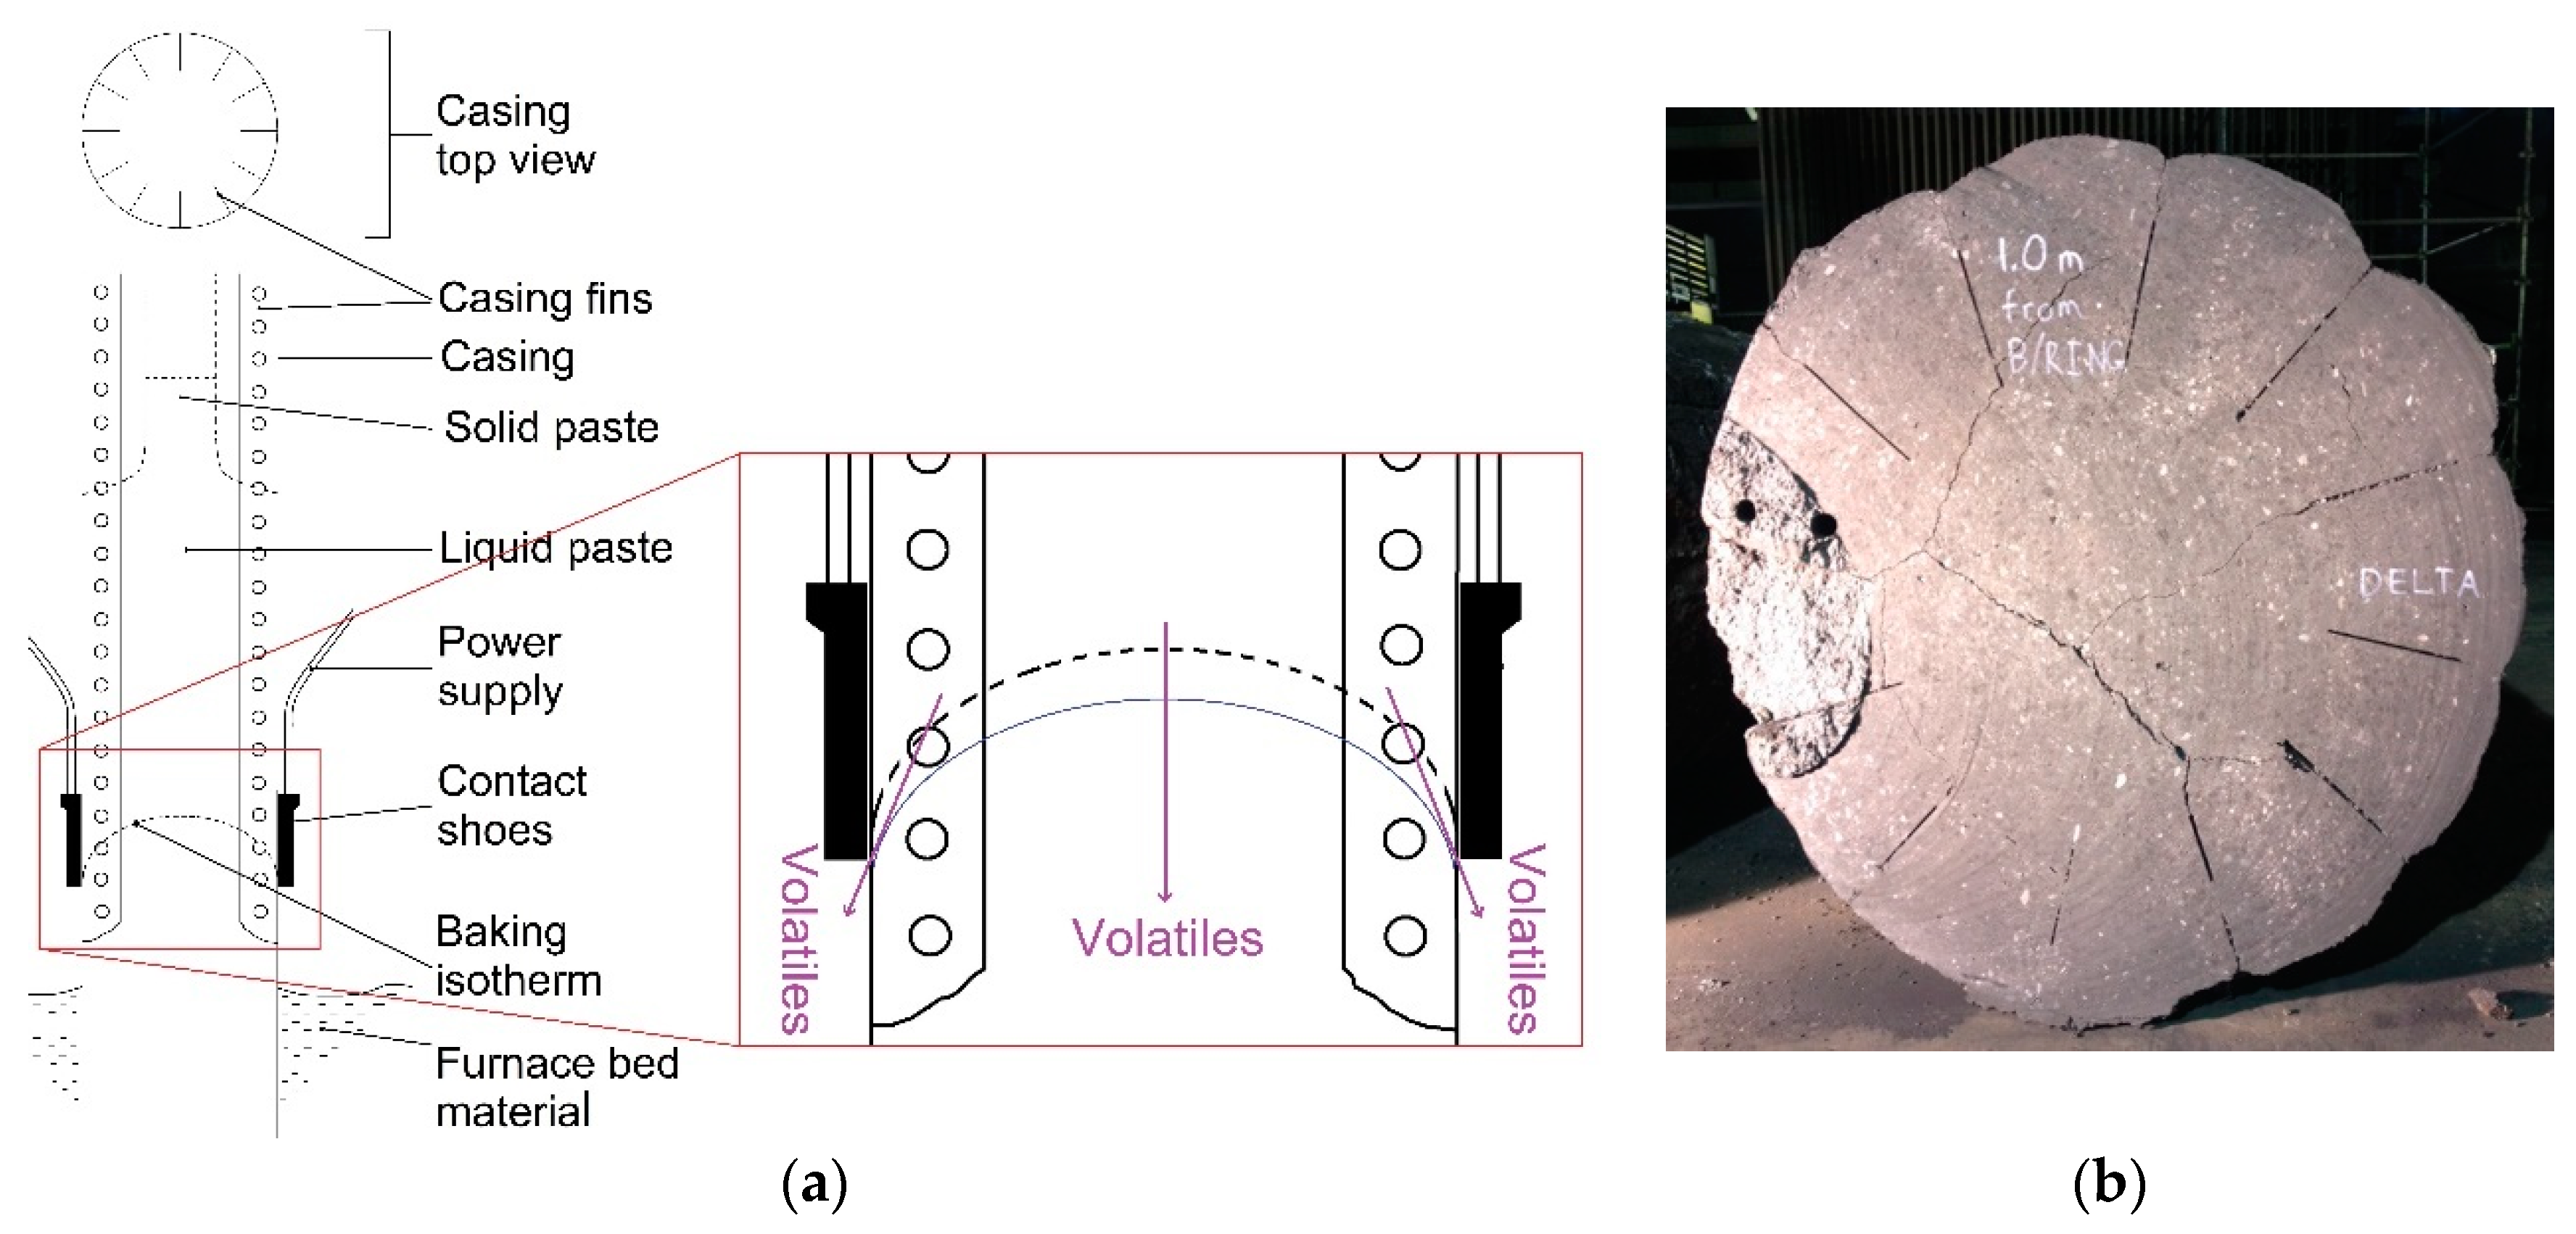
2.1. Søderberg Electrode Sampling
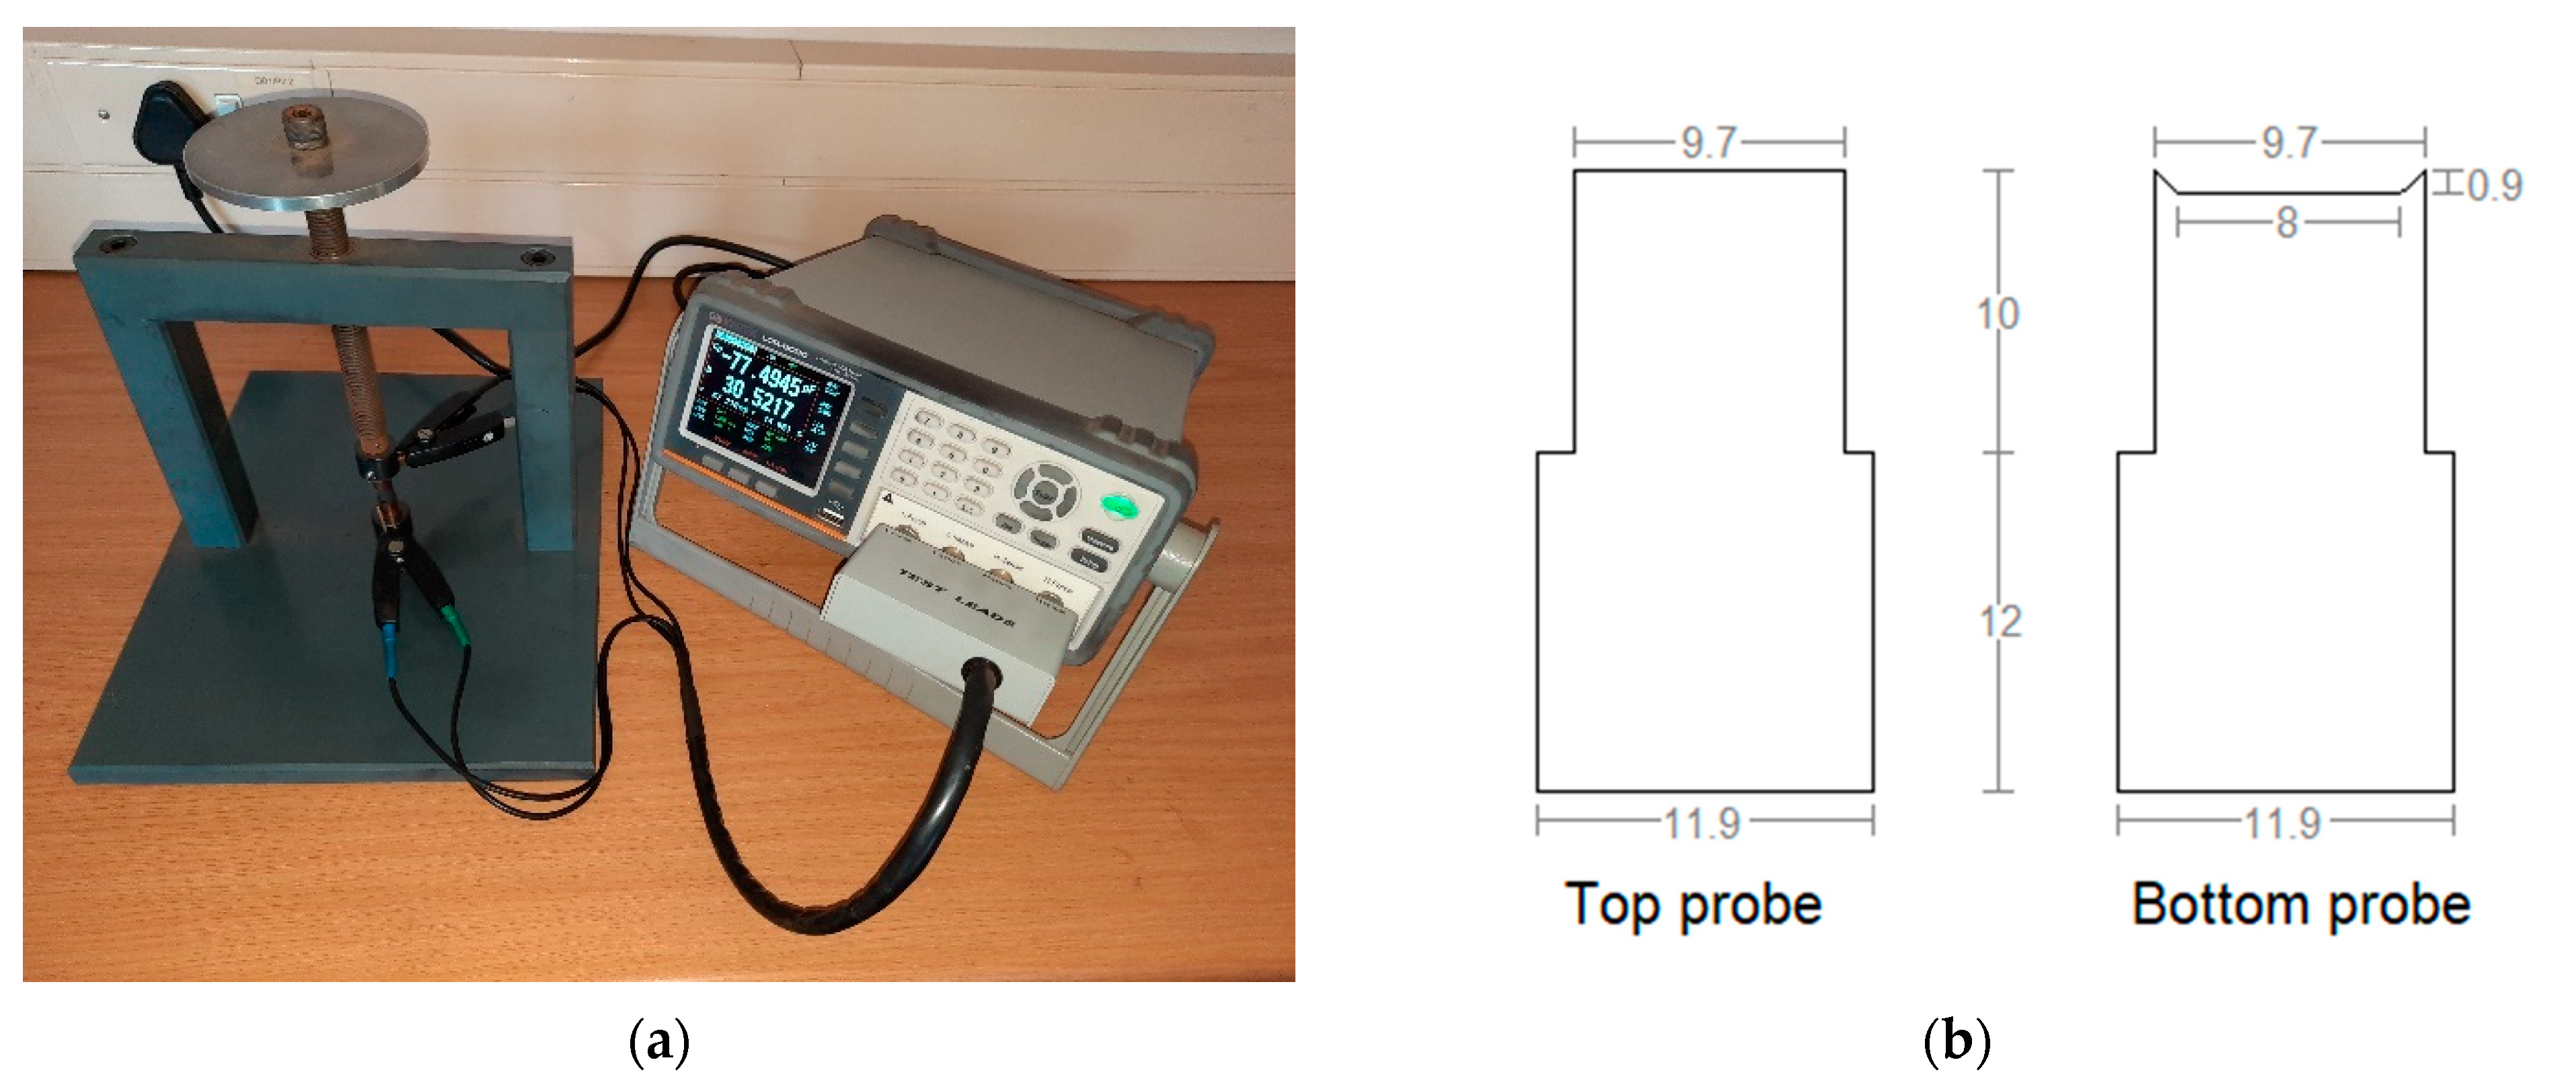
2.2. Electrical Resistivity Measurements
2.3. Degree of Graphitisation Determinations
2.4. Bulk Density Measurements
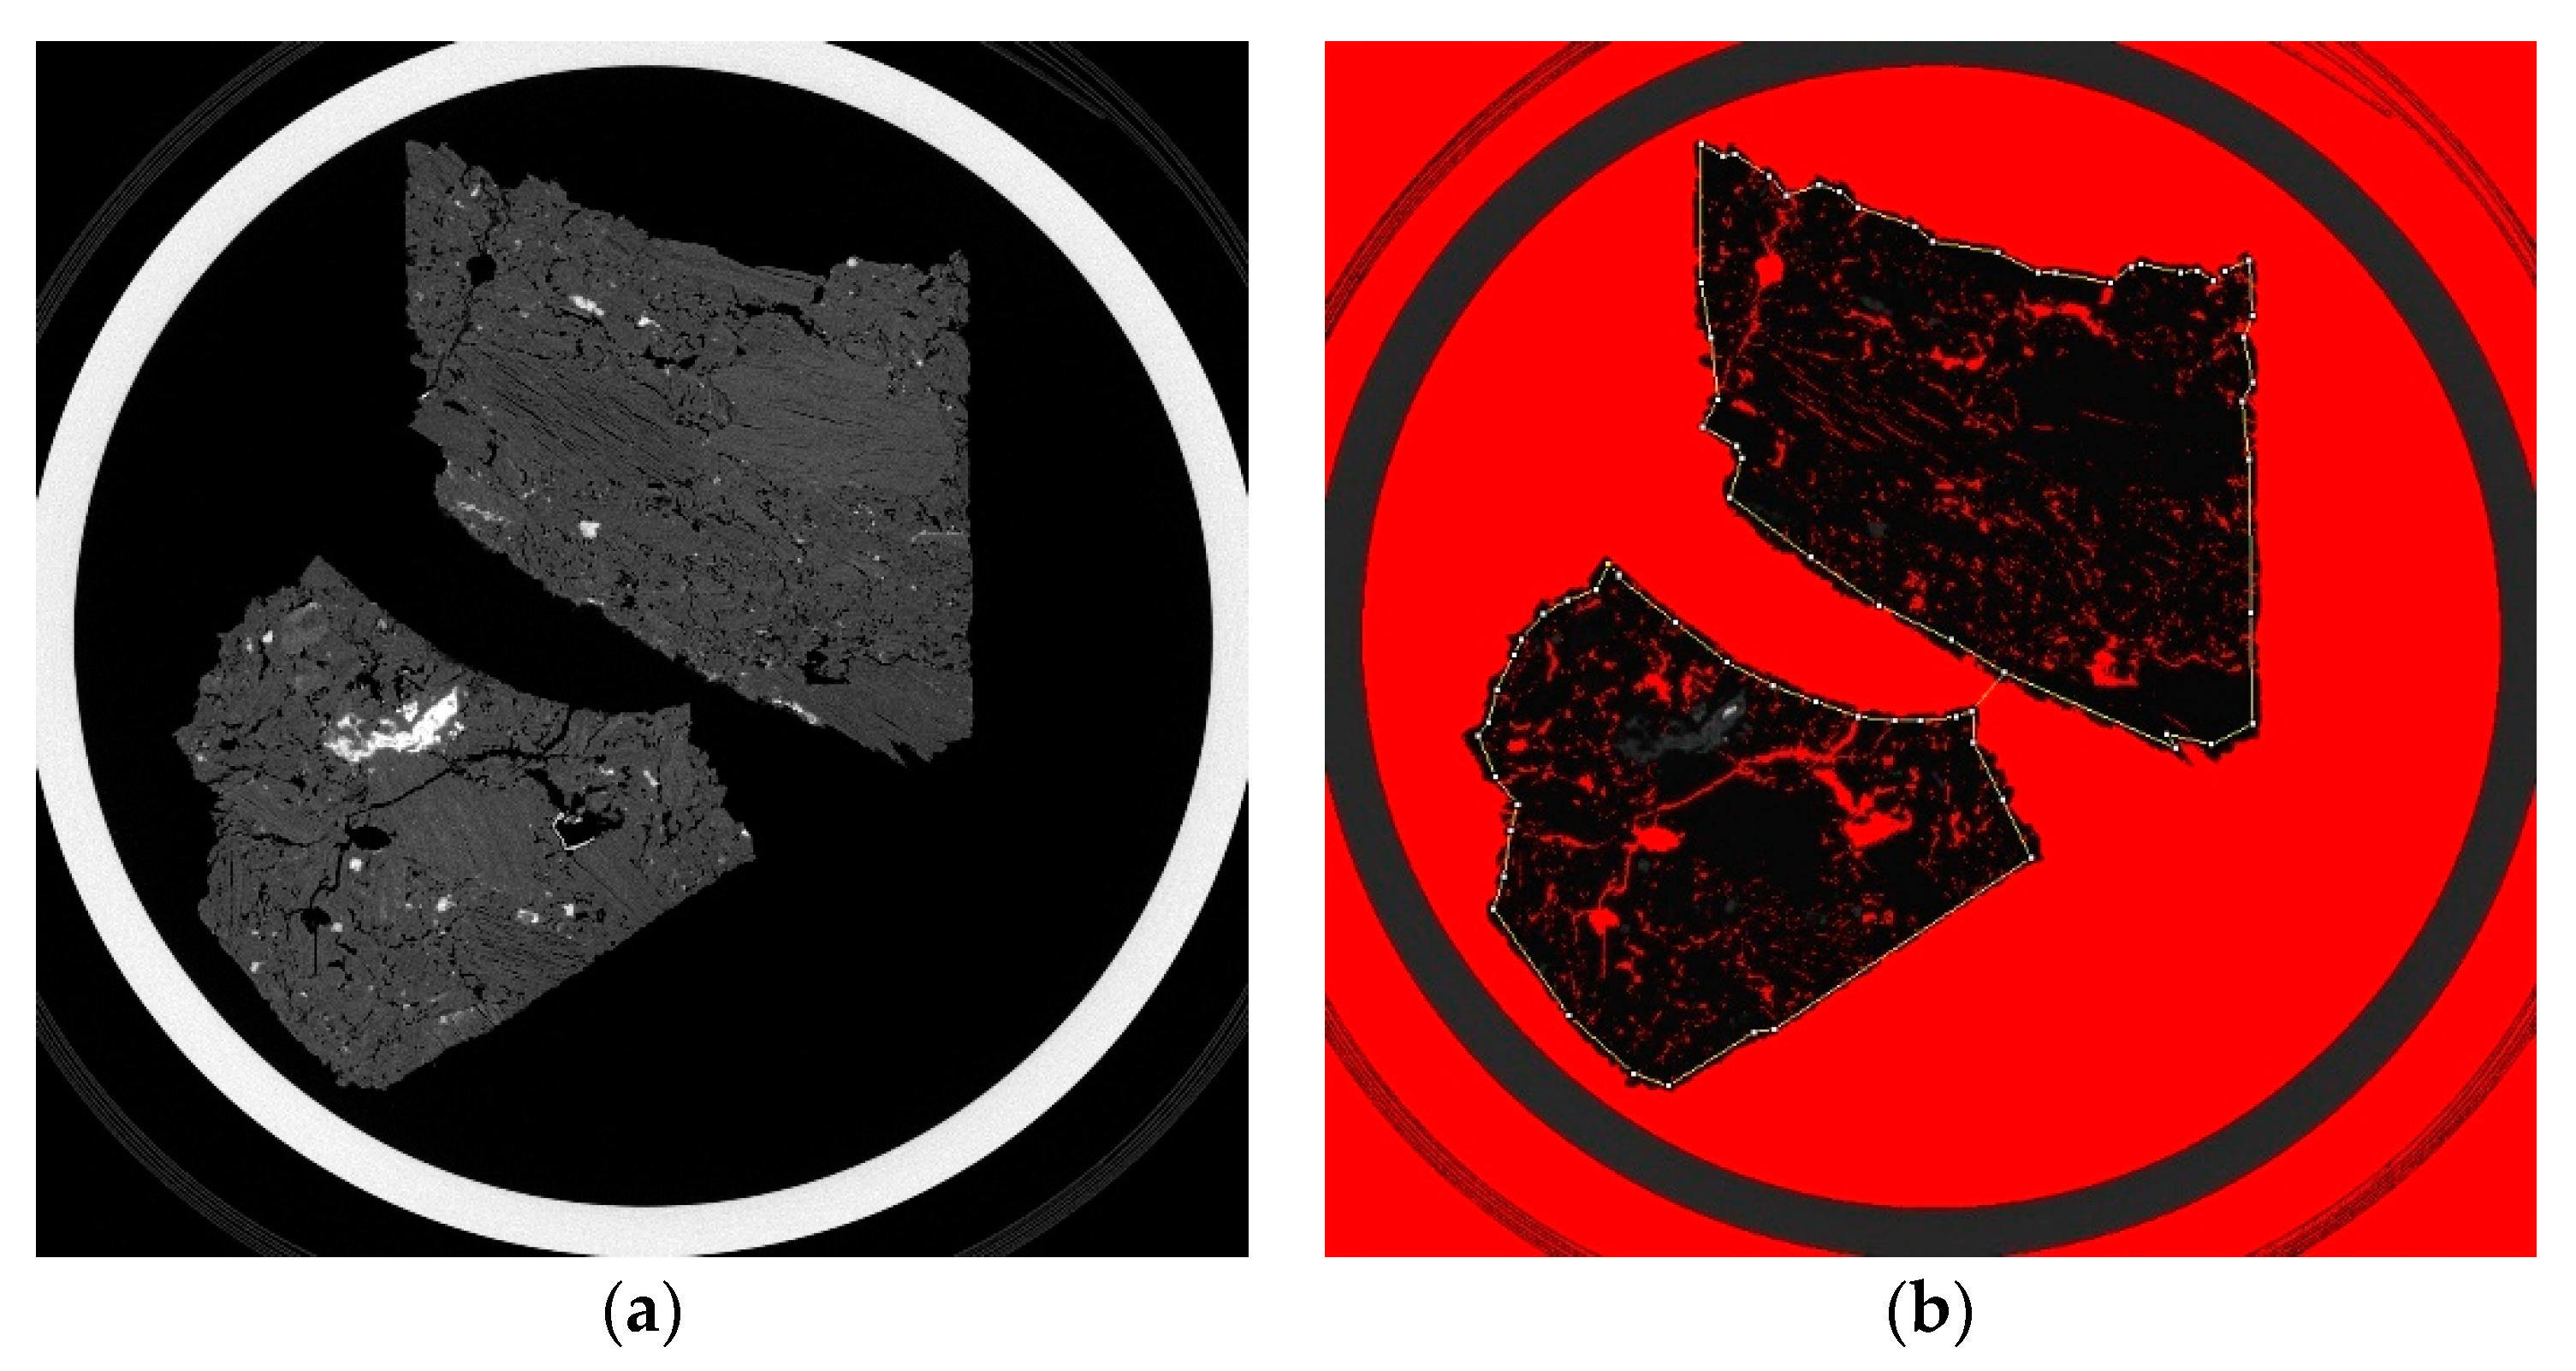
2.5. Porosity Determinations
2.6. Compressive Breaking Strength Measurements
2.7. Statistical Handling of Data
3. Results and Discussion
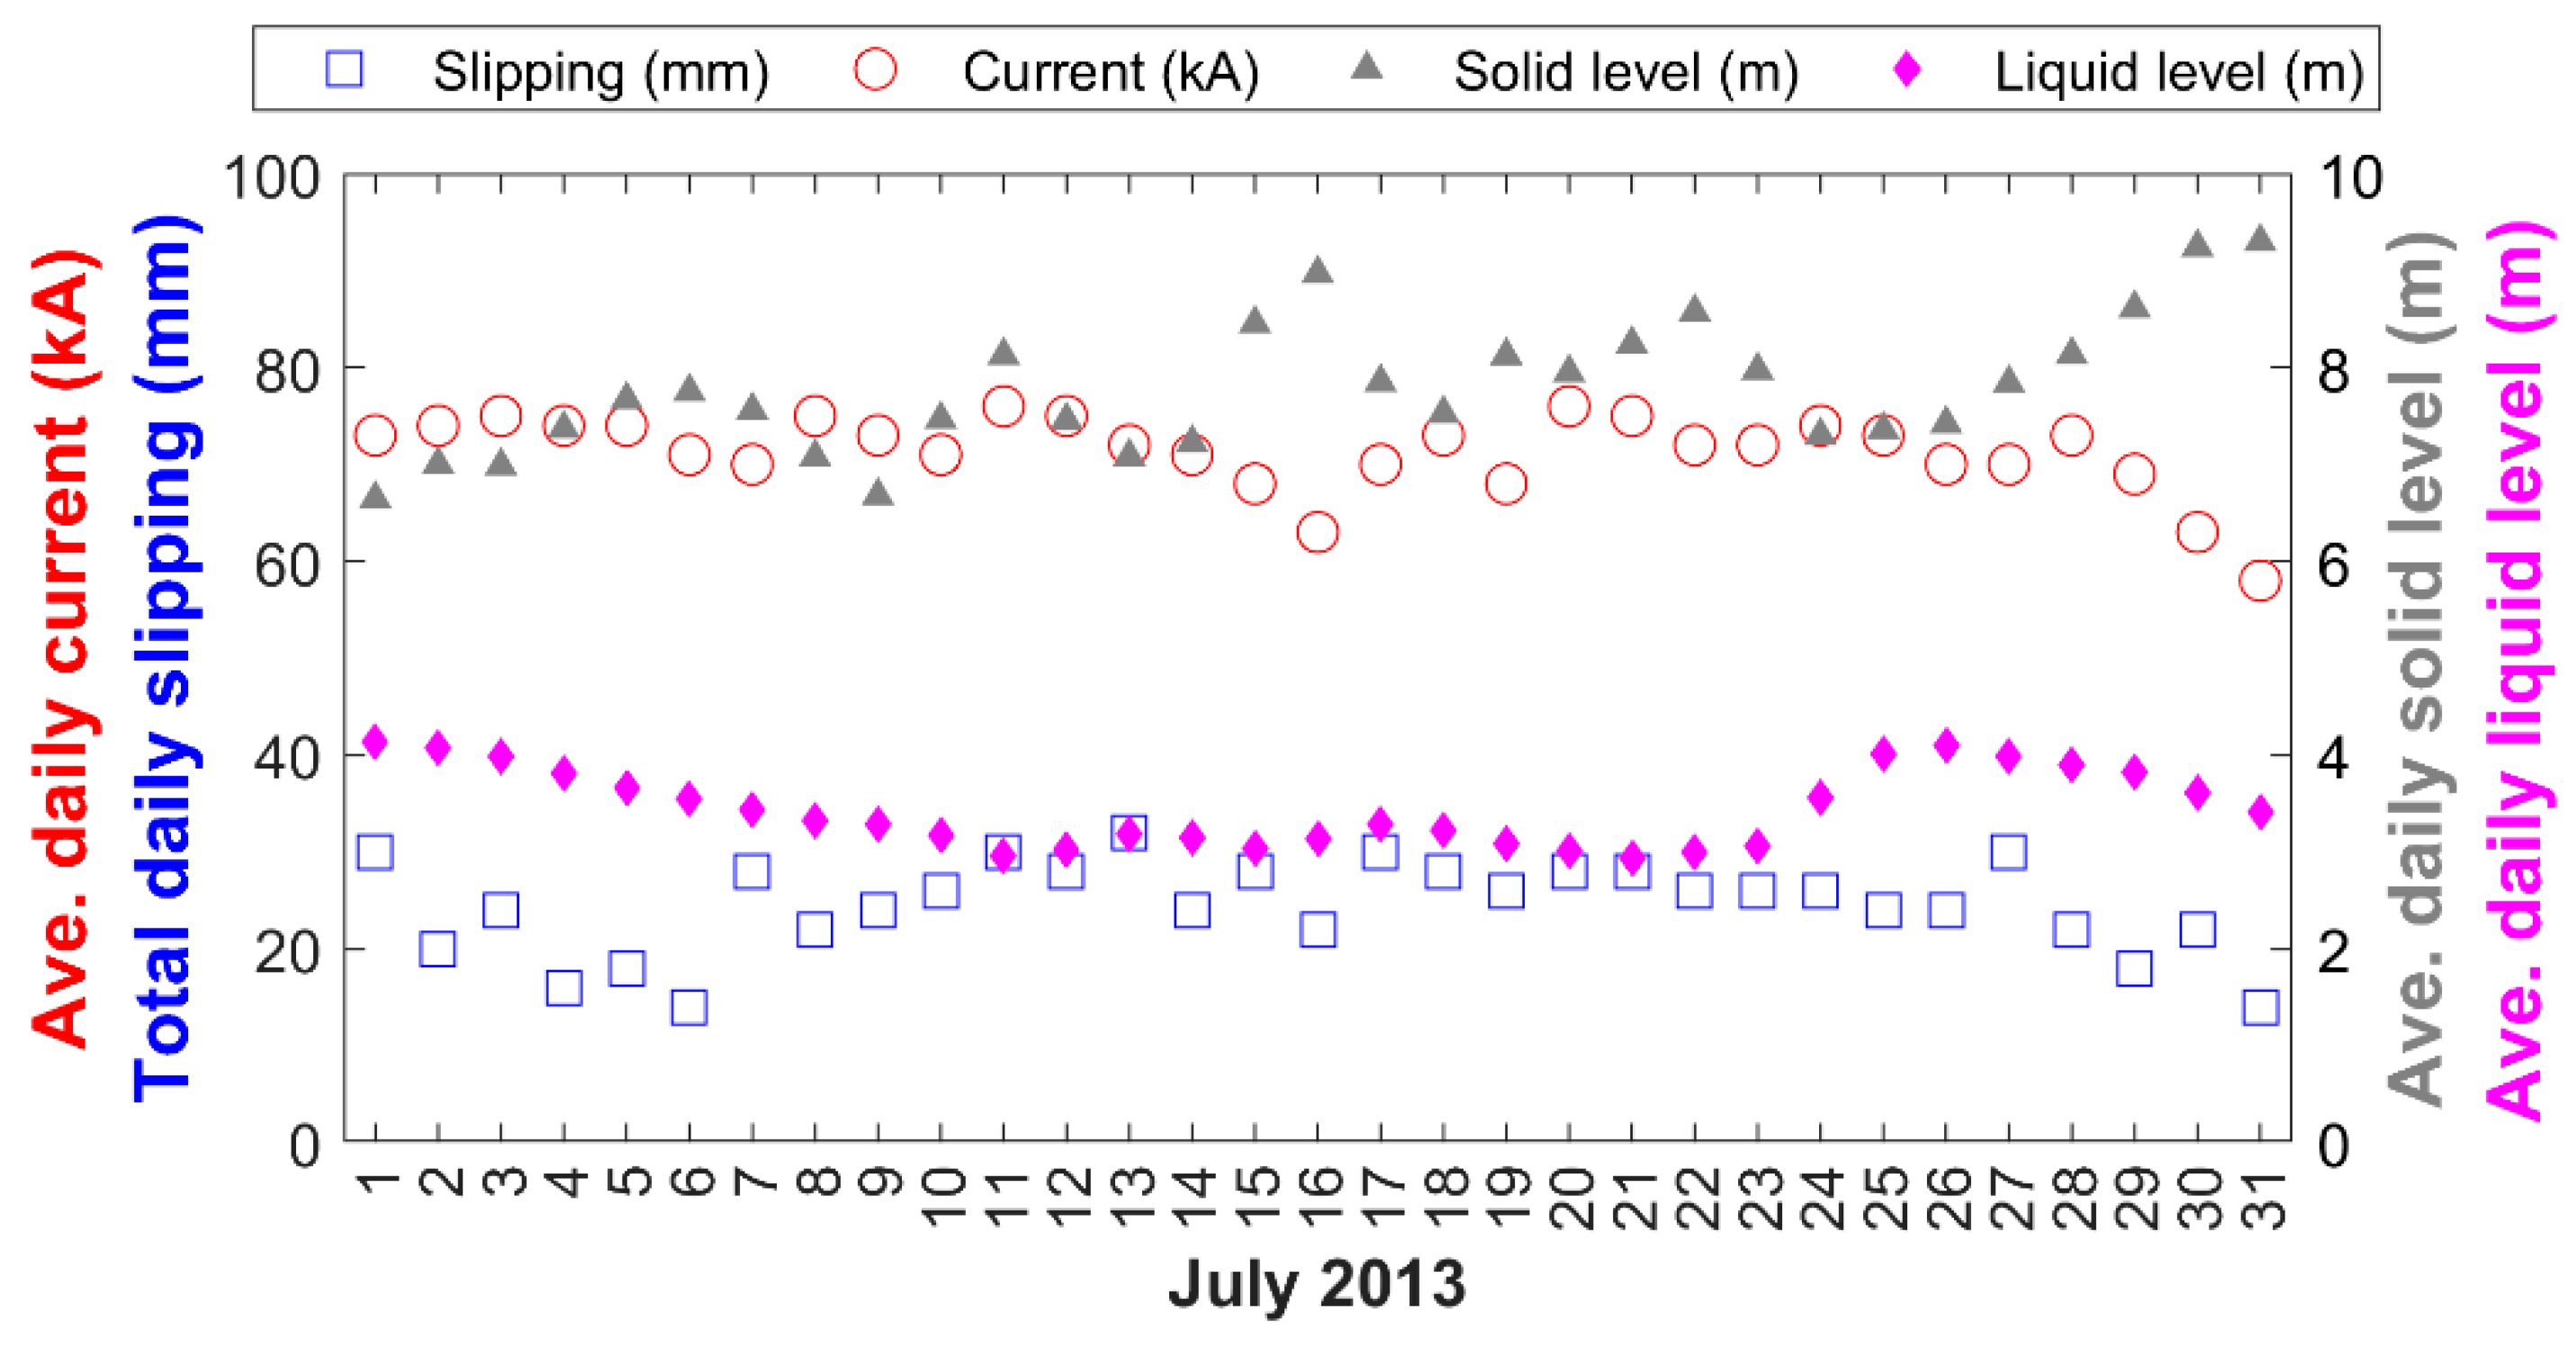
3.1. Operational History
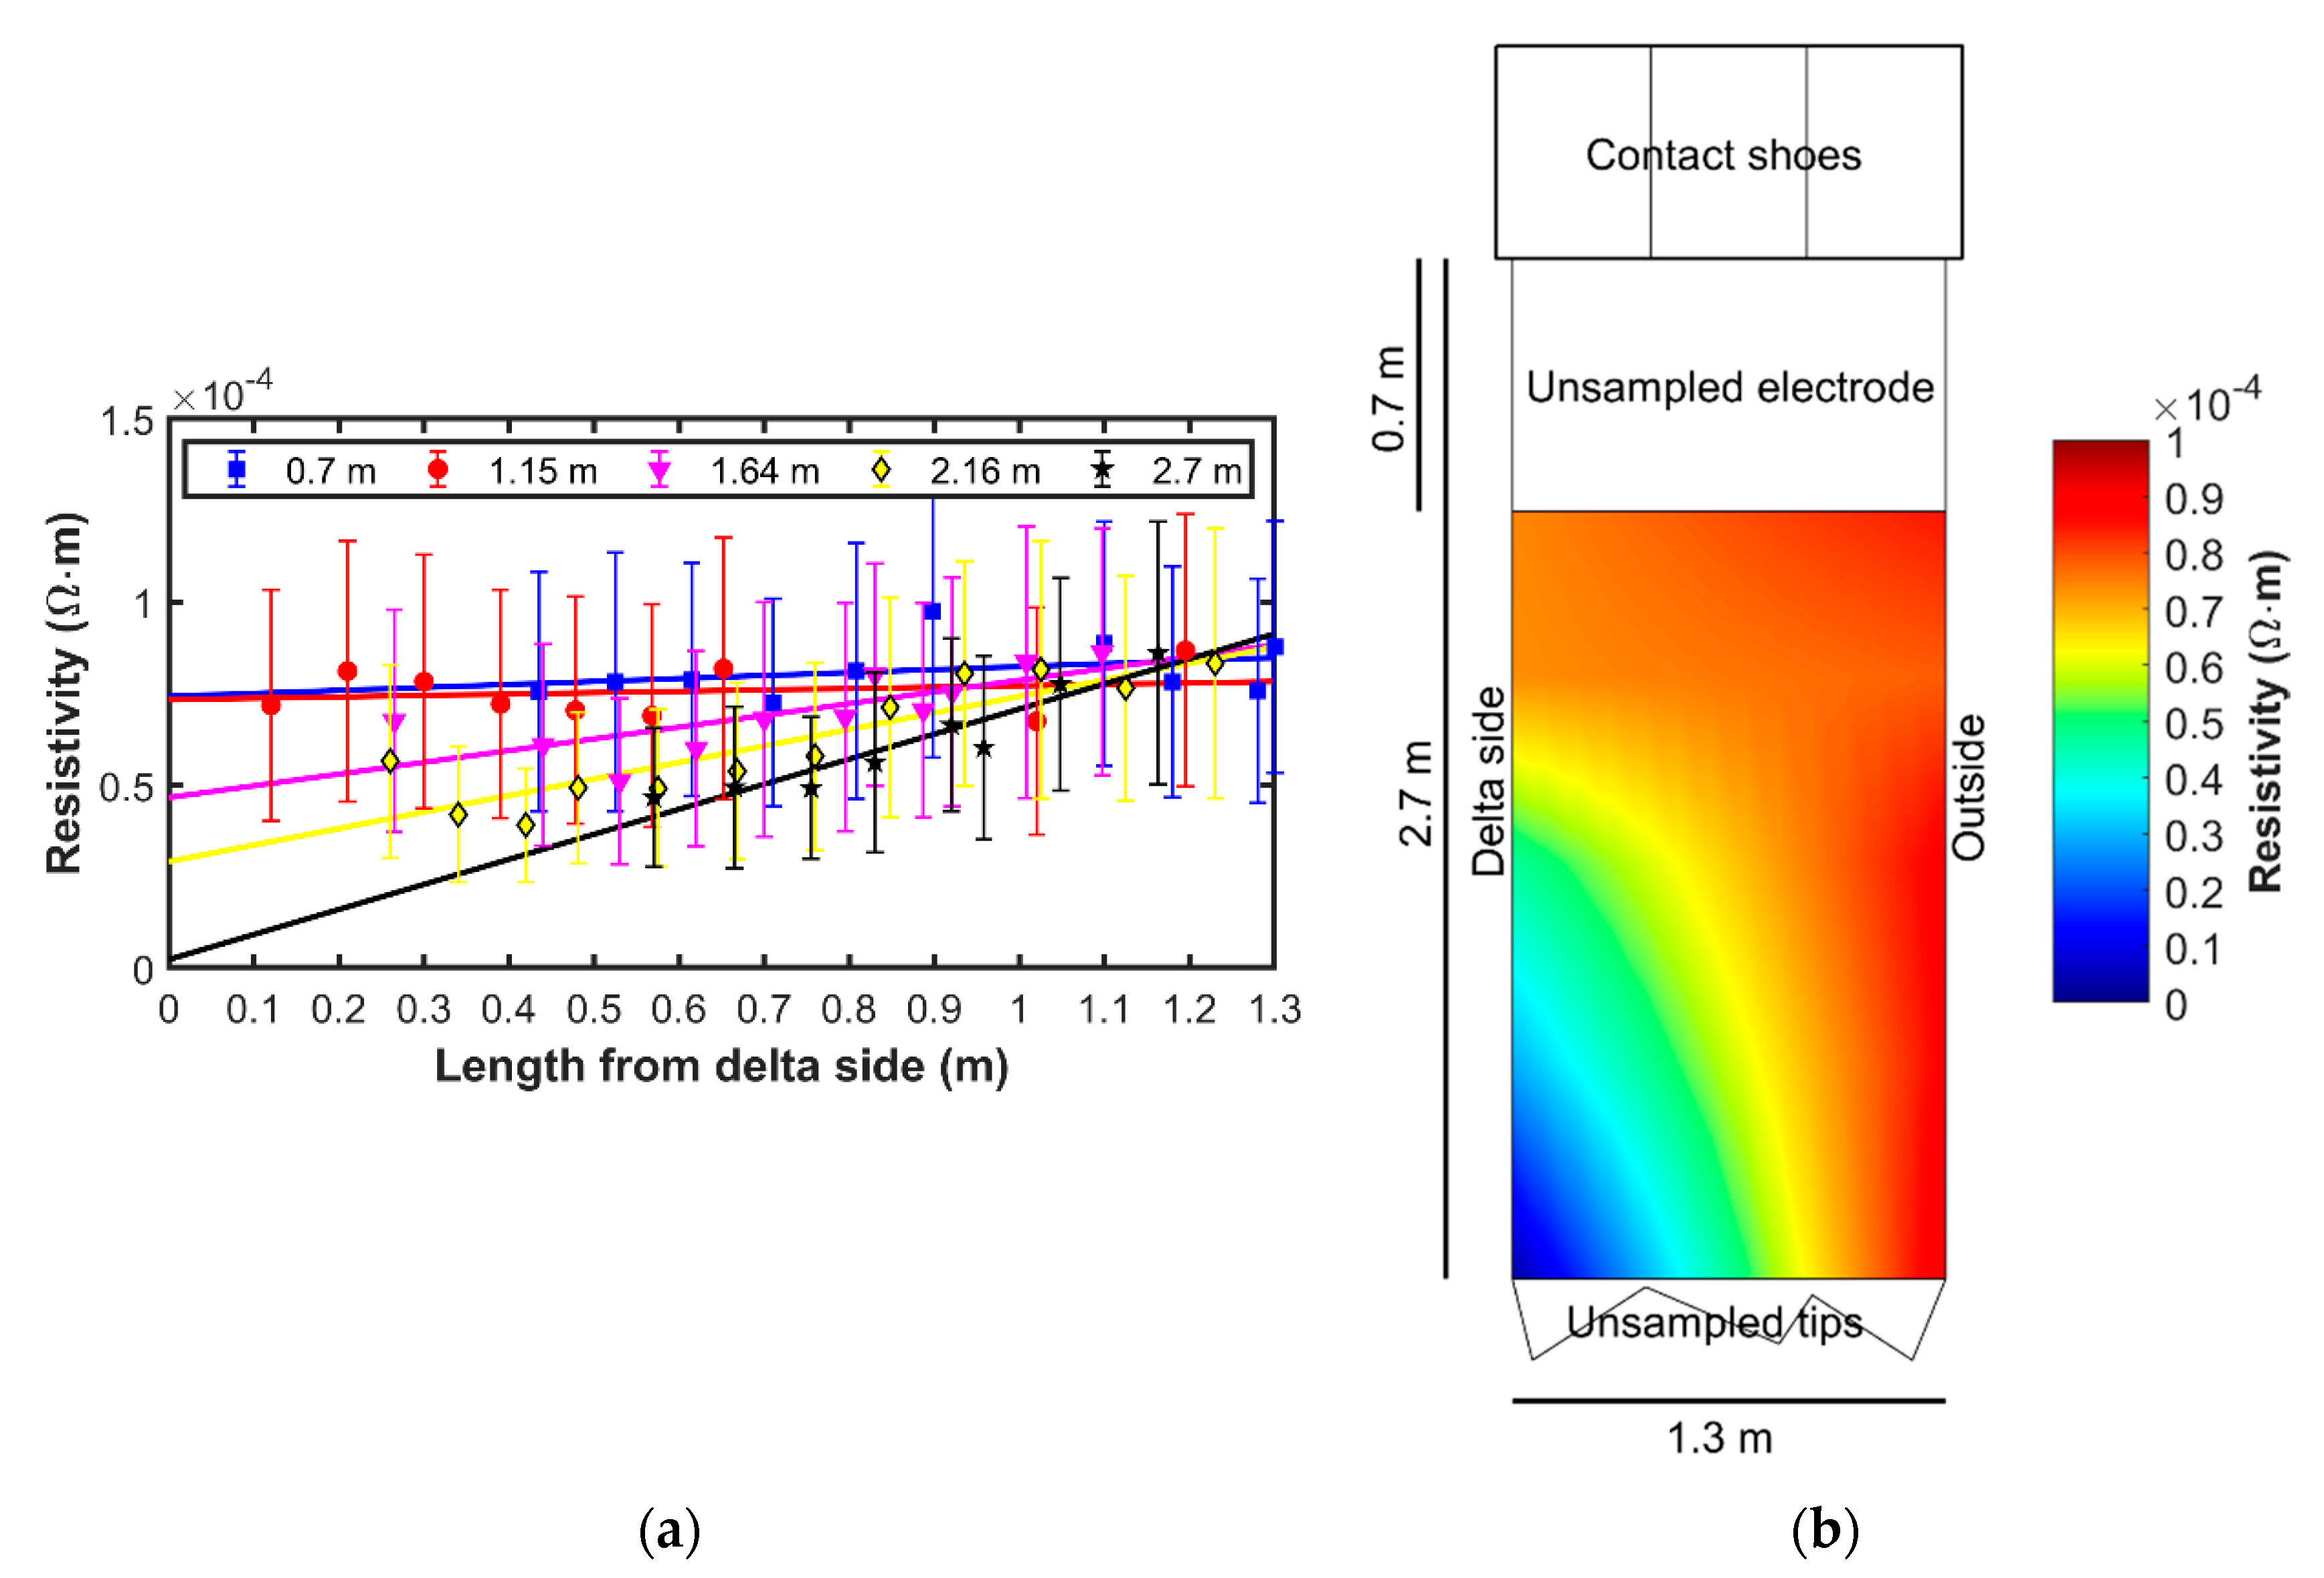
3.2. Electrical Resisitivity
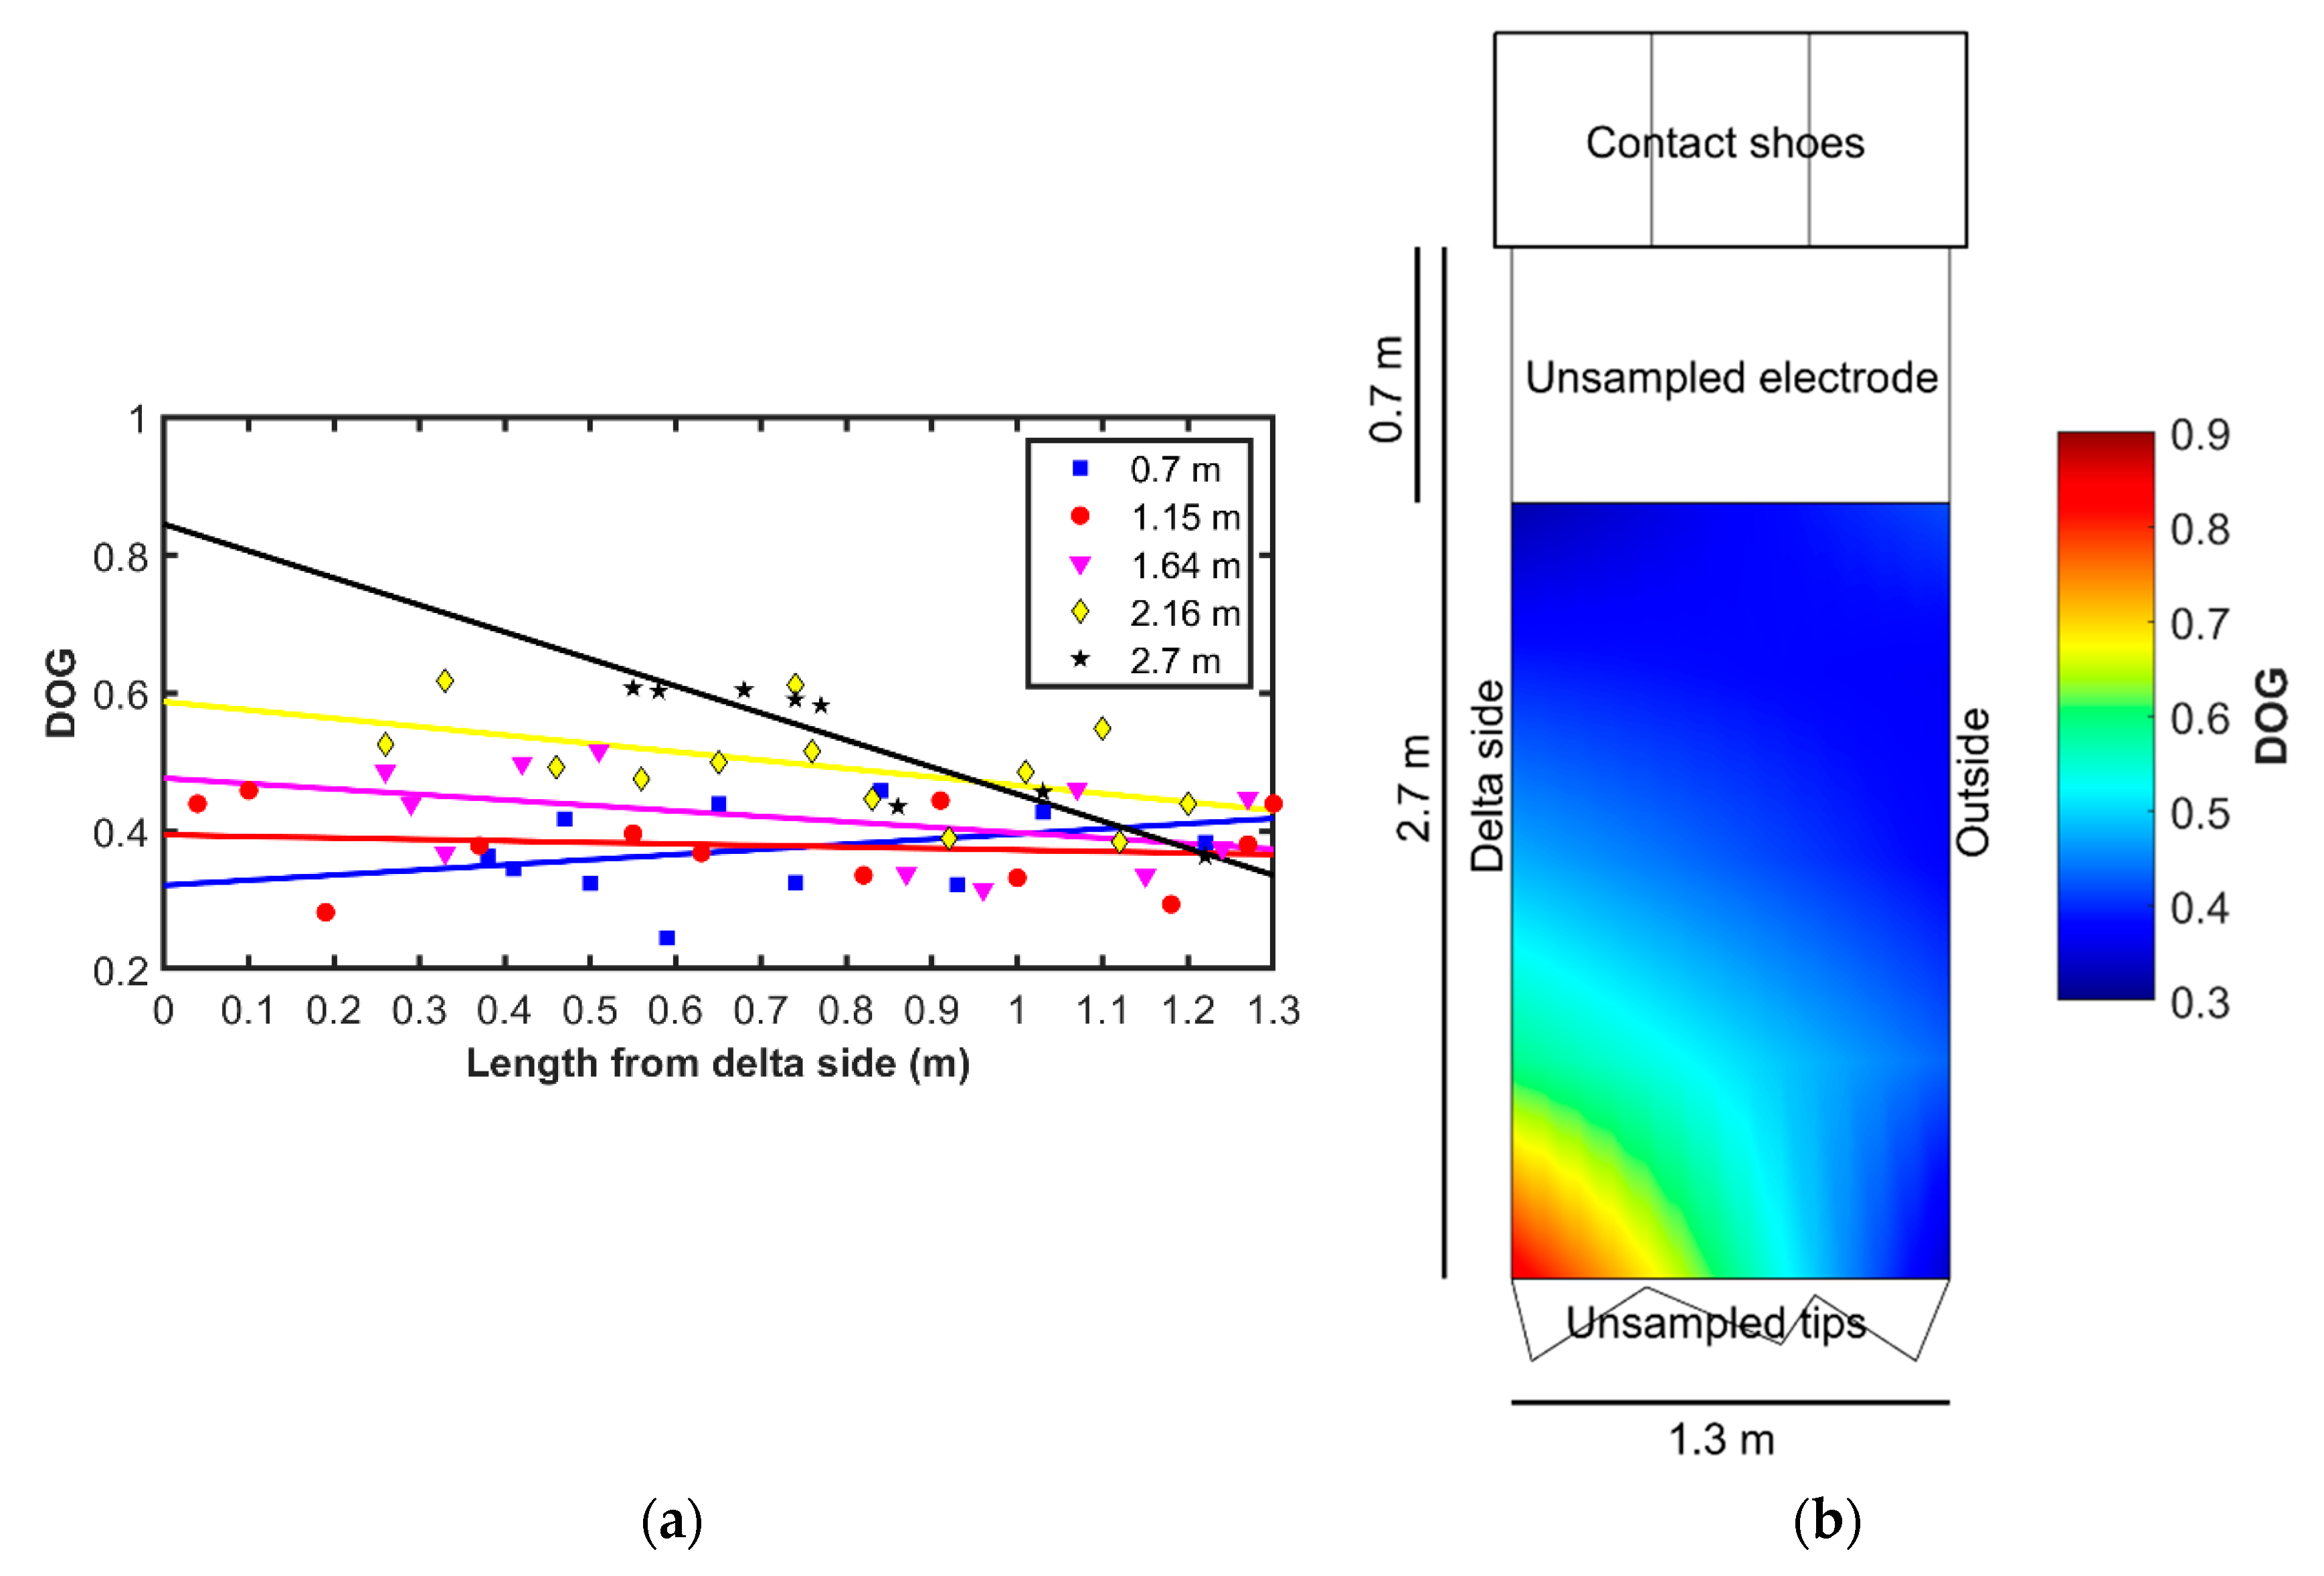
3.3. Degree of Graphitisation (DOG)
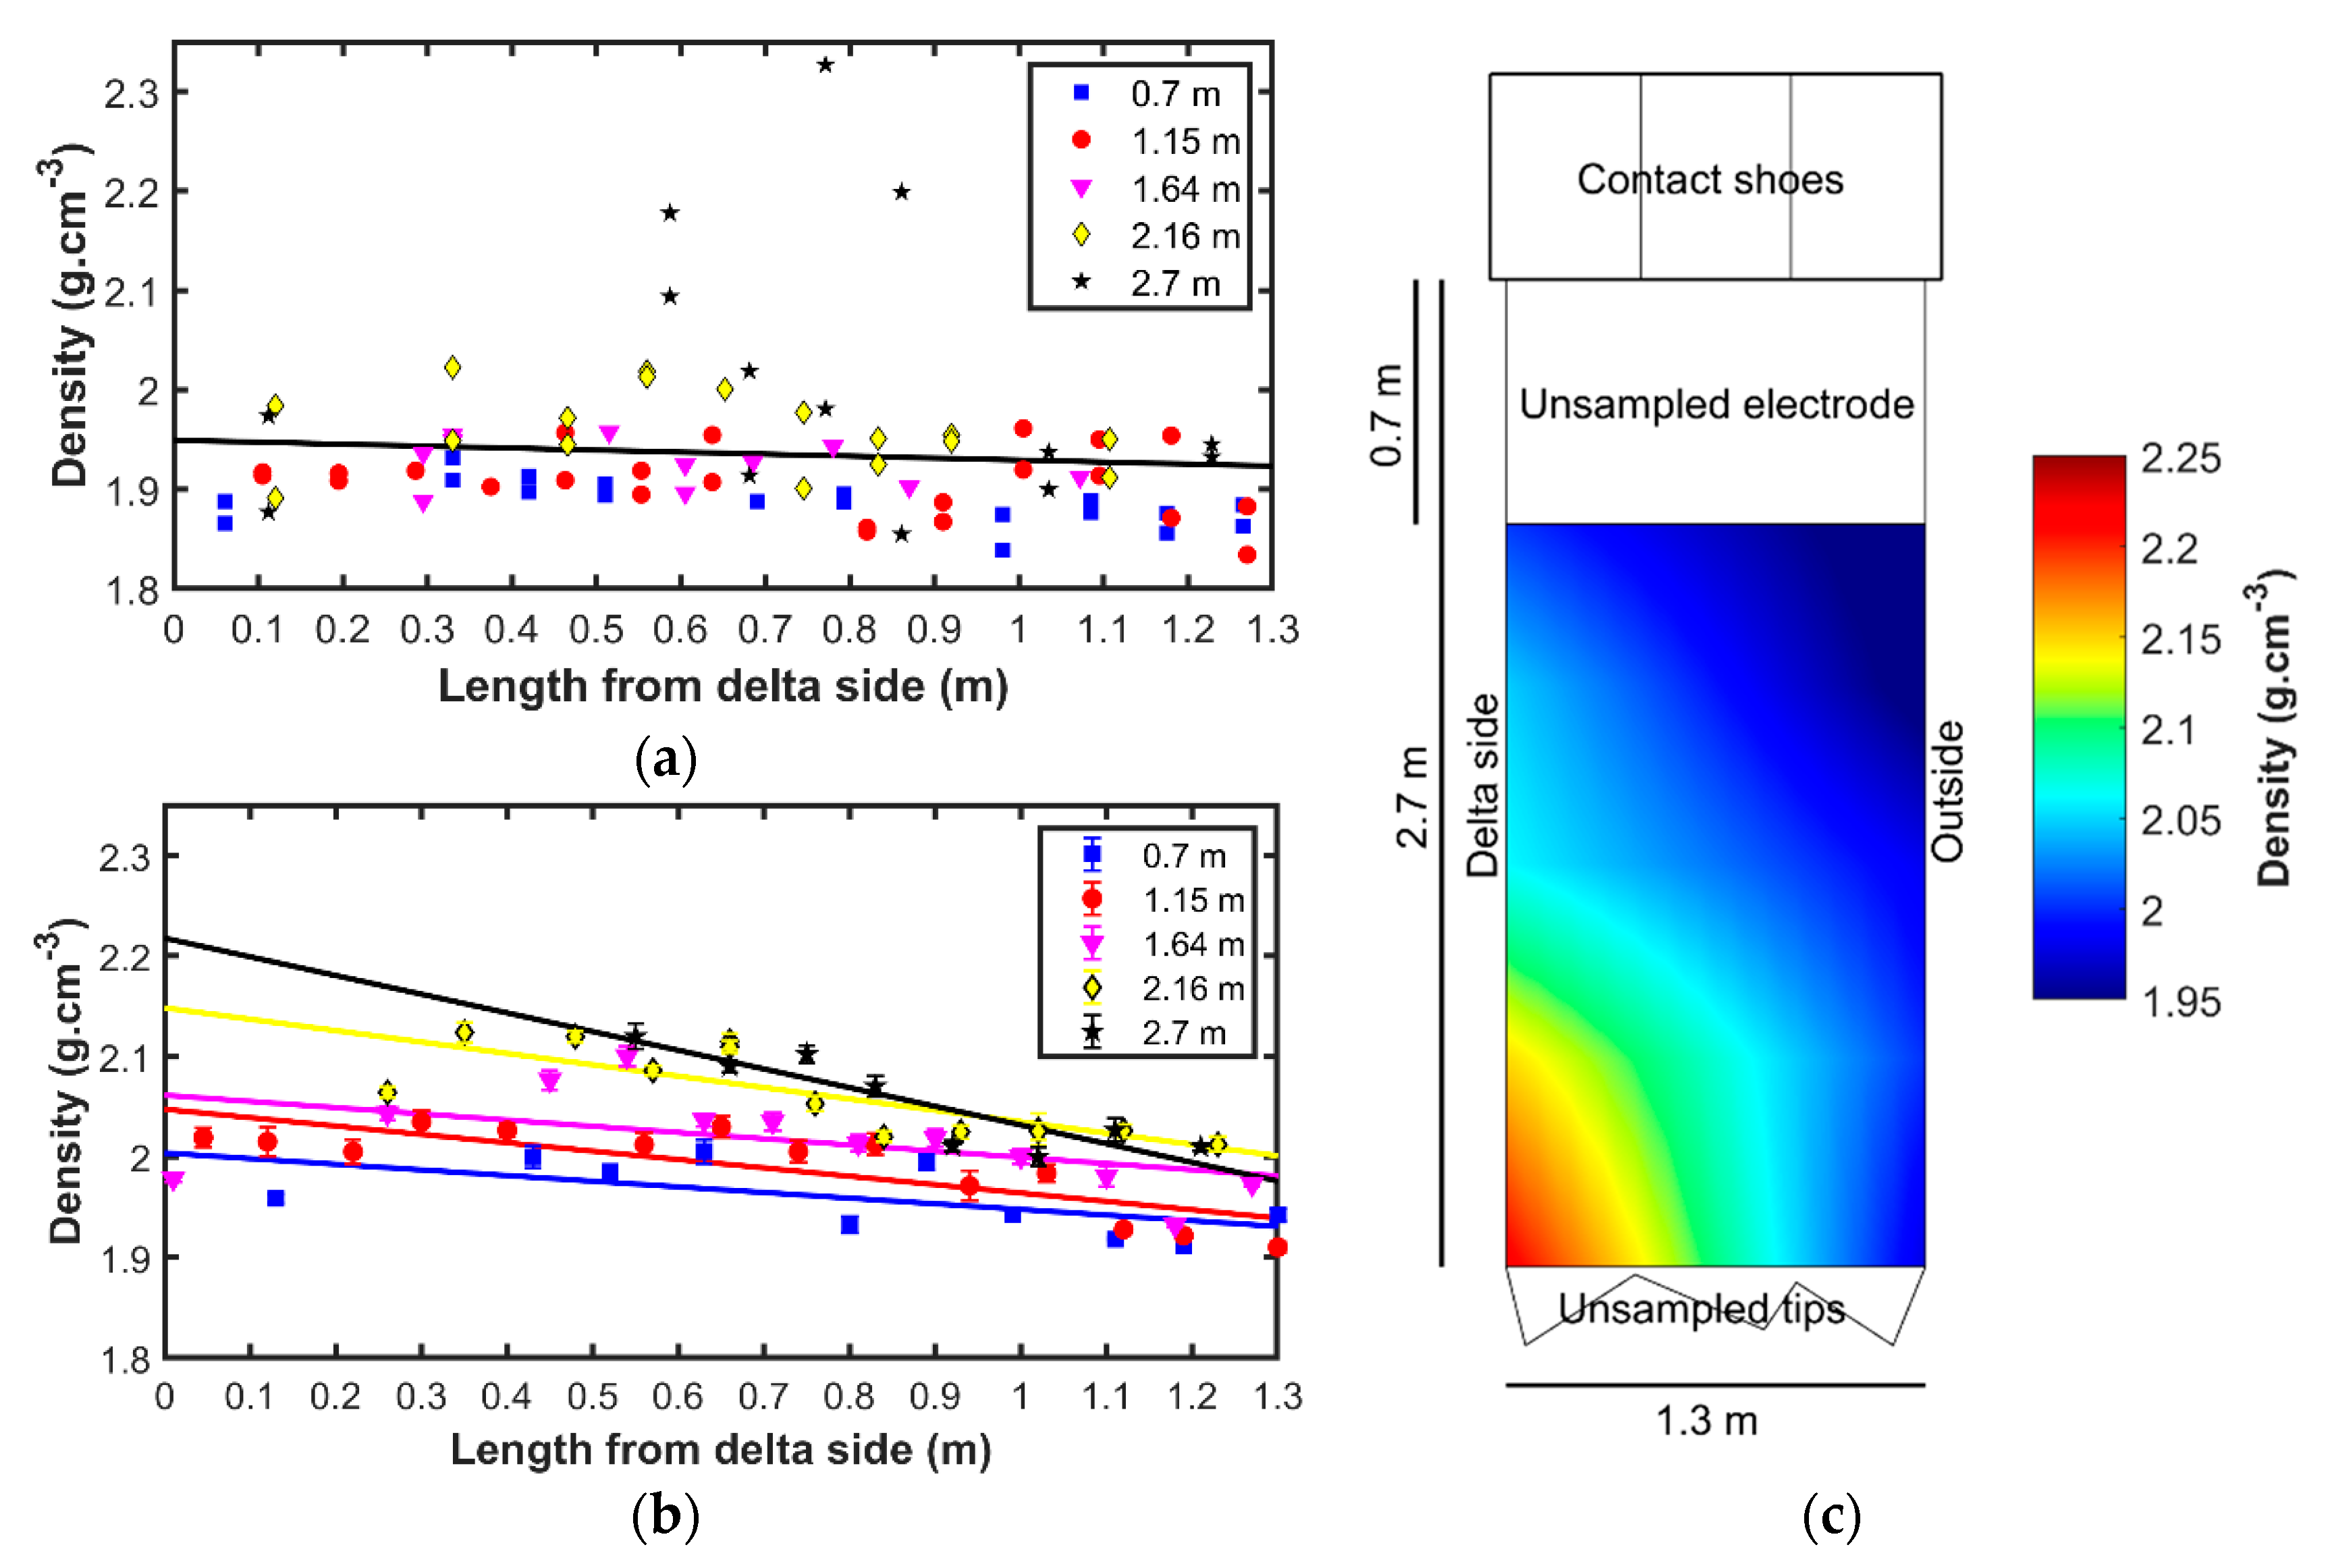
3.4. Bulk Density
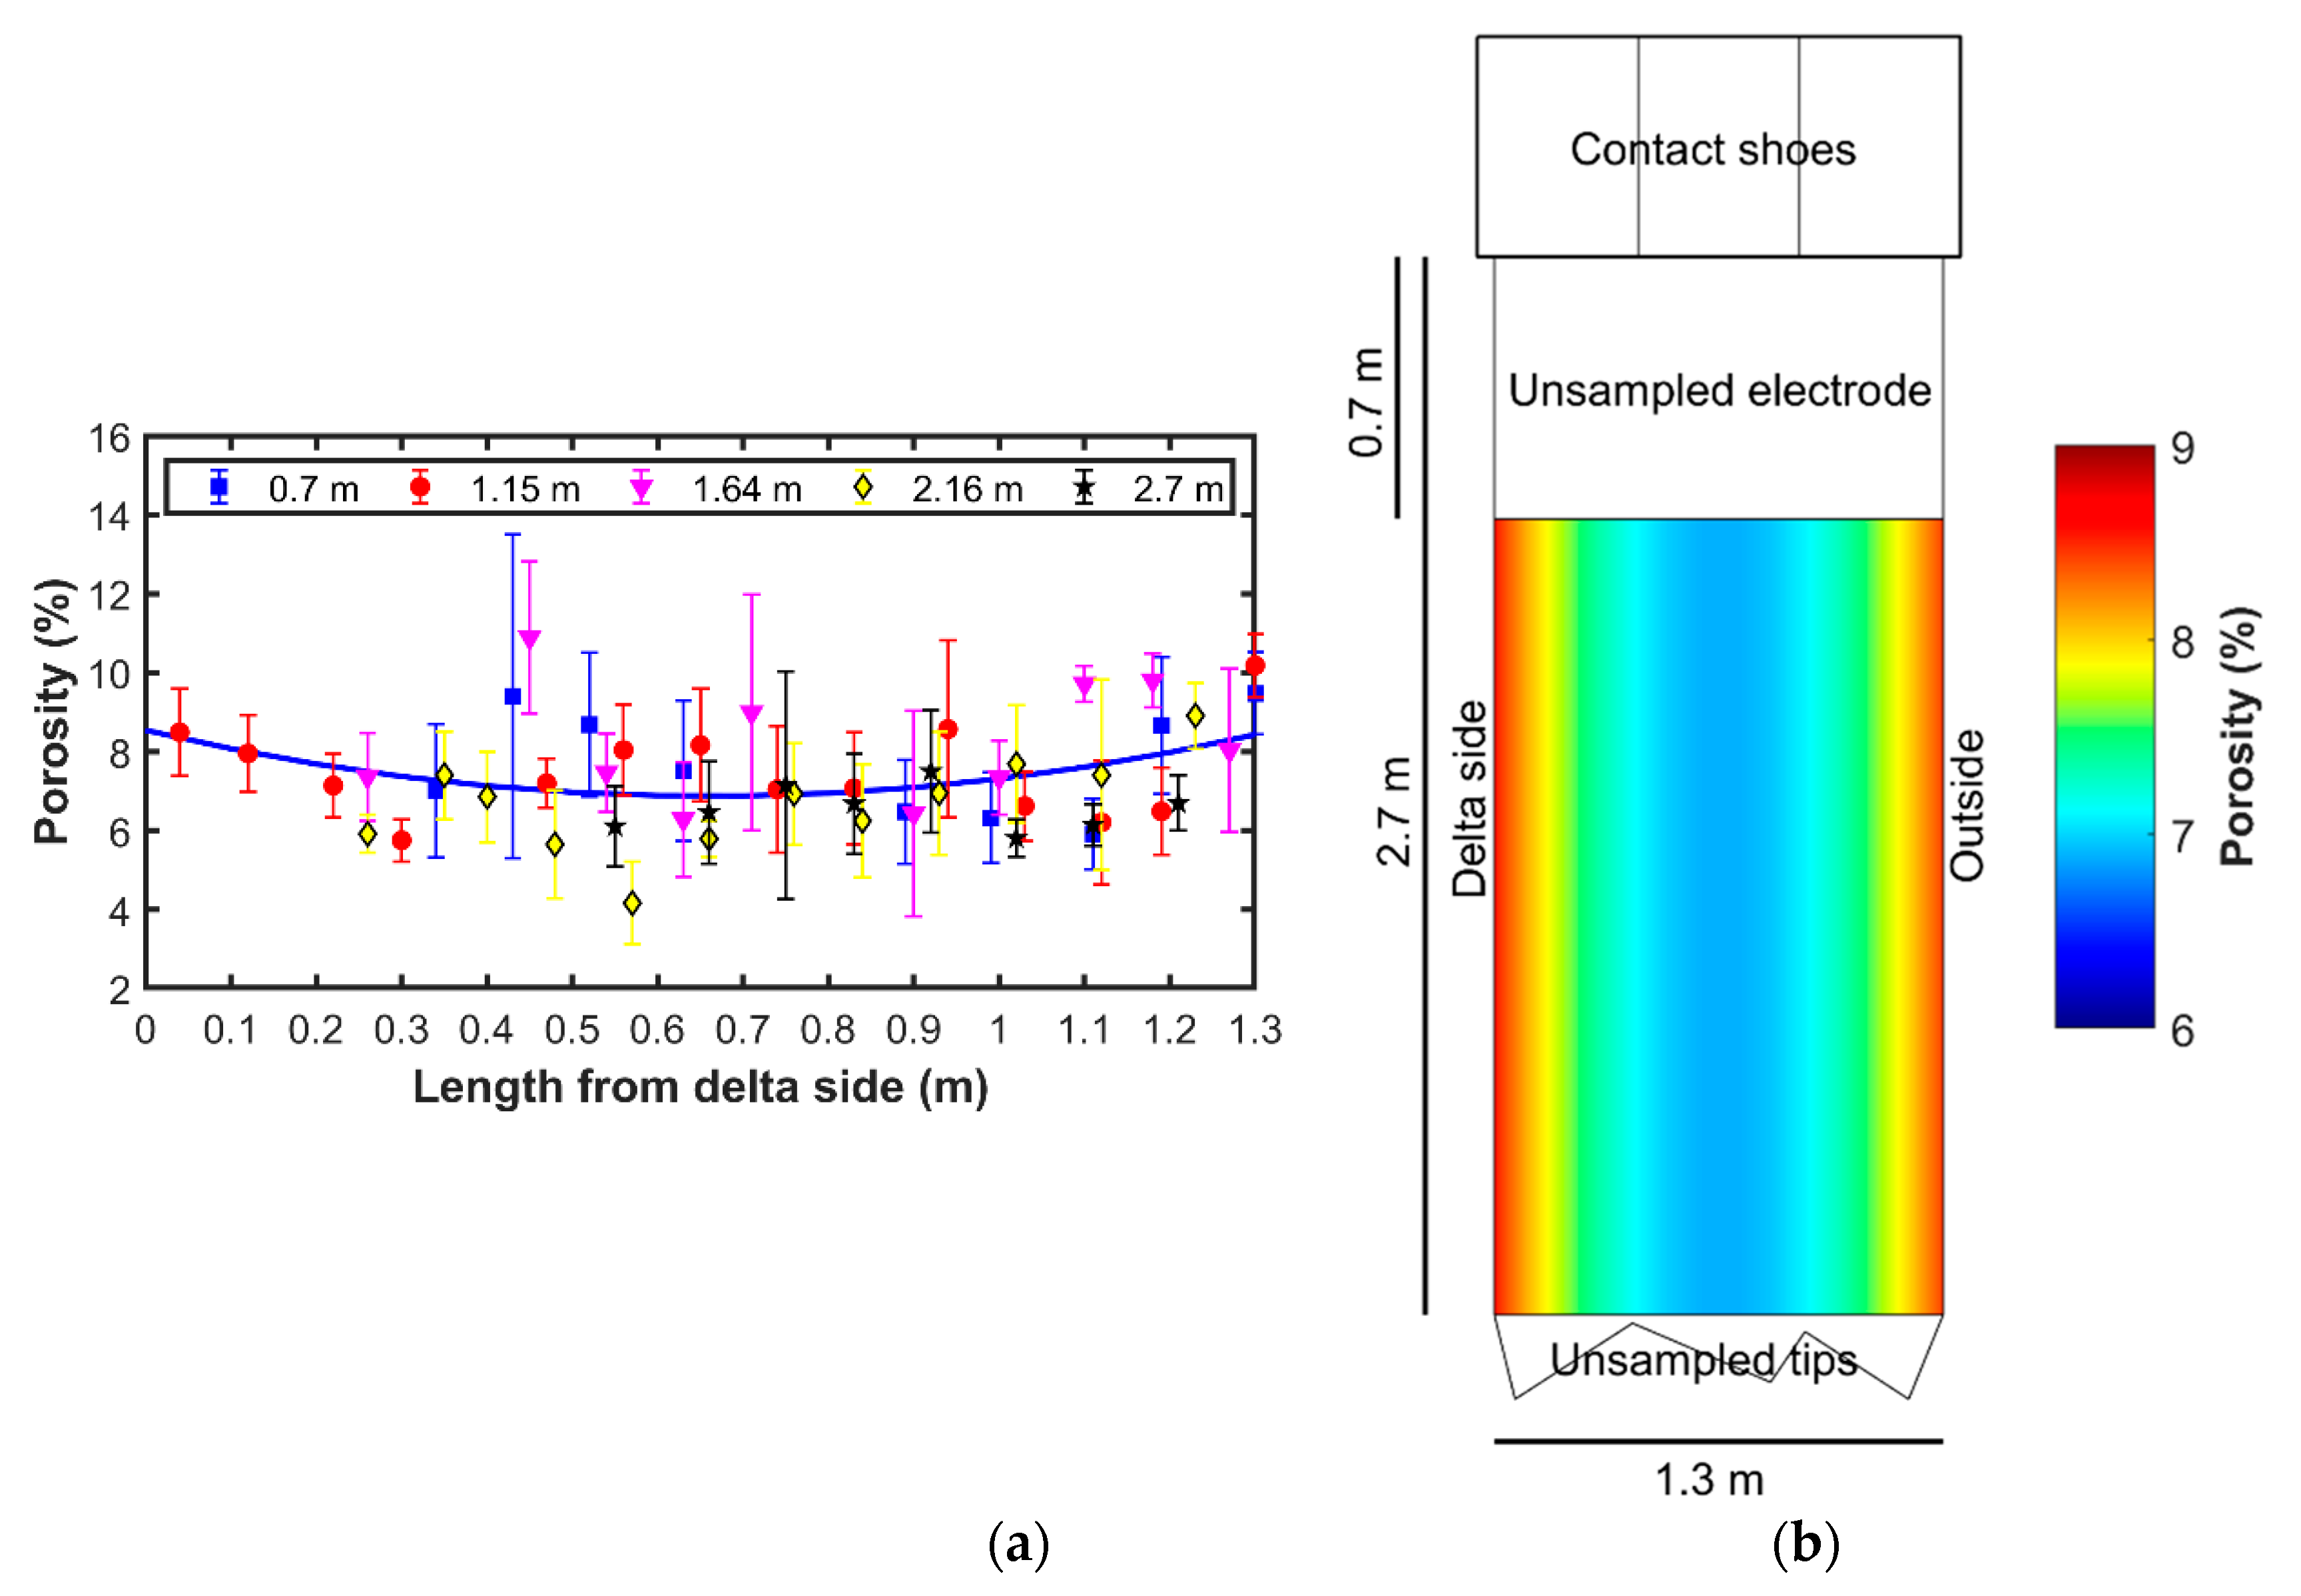
3.5. Porosity
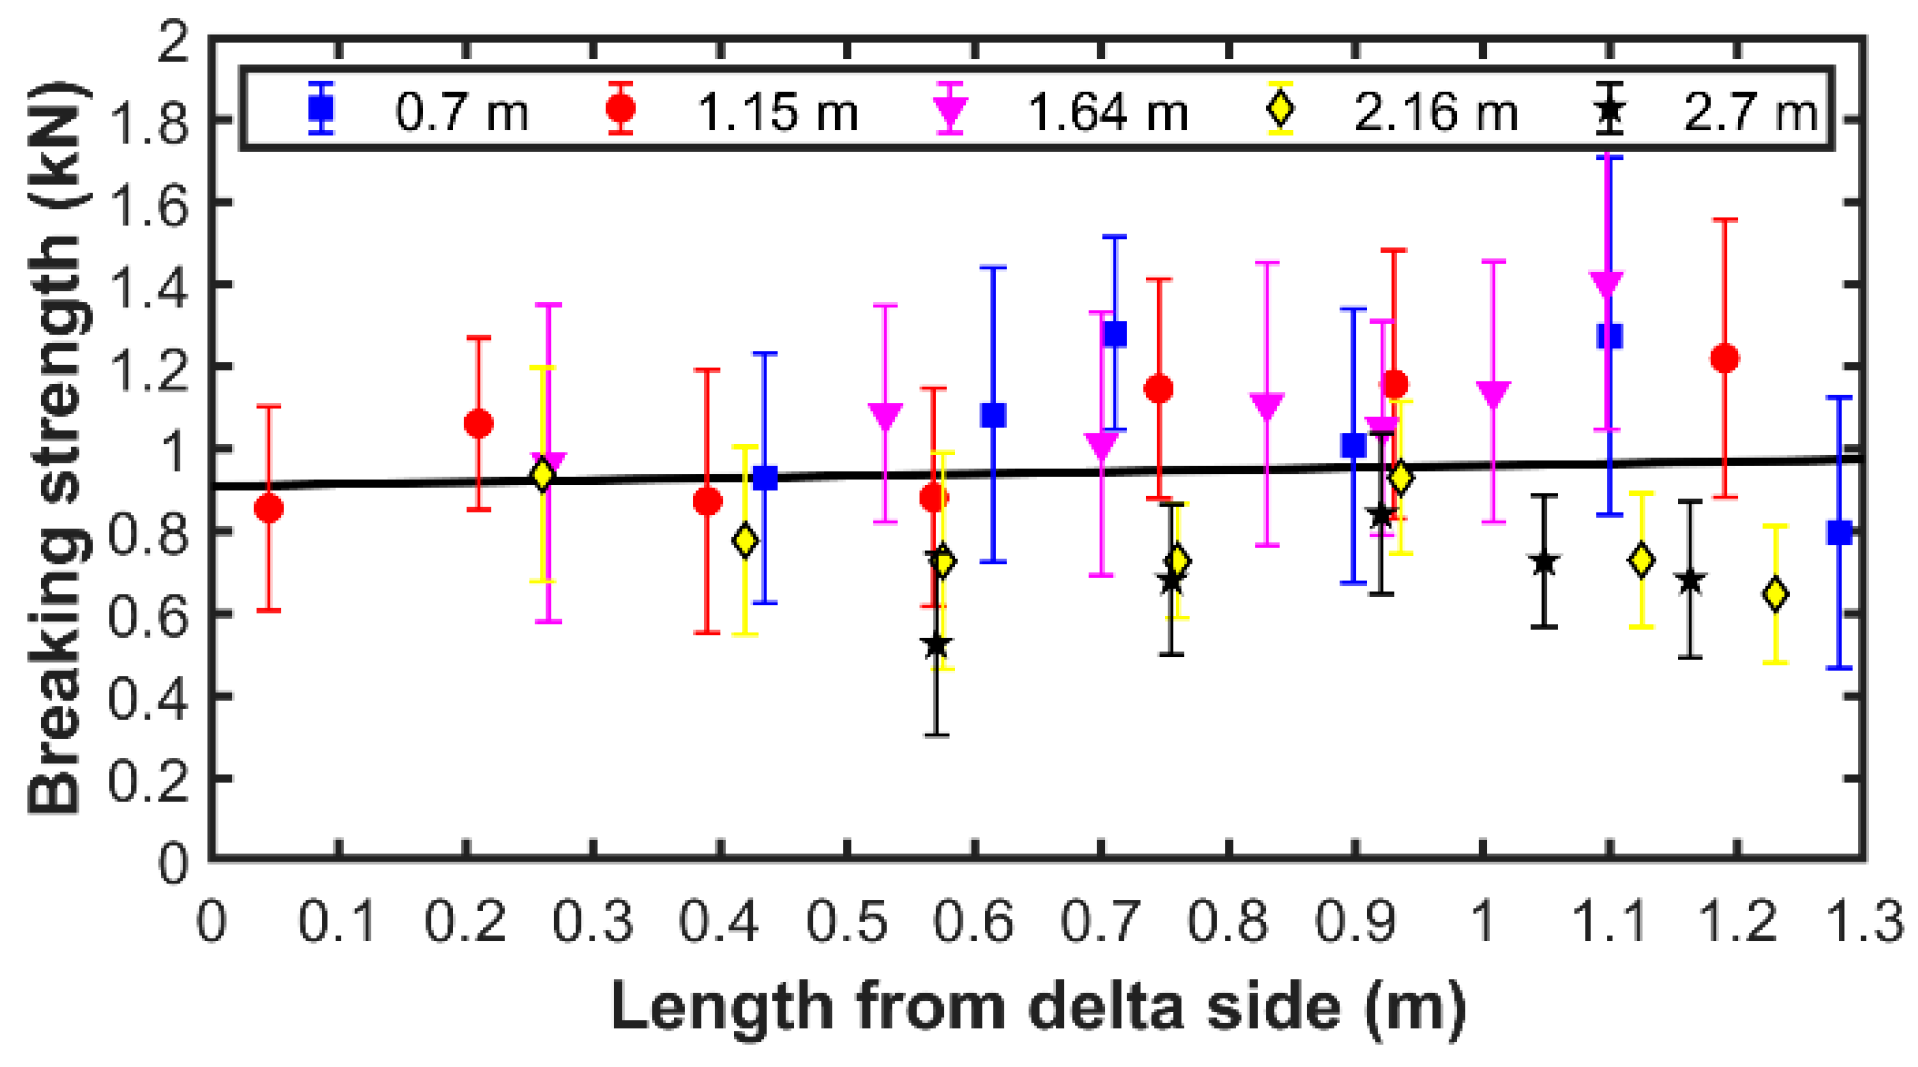
3.6. Compressive Breaking Strength
4. Conclusions
Author Contributions
Funding
Acknowledgments
Conflicts of Interest
Appendix A

| Distance from Delta Side (m) | Distance below the Contact Shoes (m) | ||||
|---|---|---|---|---|---|
| 0.70 | 1.15 | 1.64 | 2.16 | 2.70 | |
| Resistivity (Ω∙m) | |||||
| 0 | 7.42 × 10⁻⁵ | 7.34 × 10⁻⁵ | 4.66 × 10⁻⁵ | 2.92 × 10⁻⁵ | 2.41 × 10⁻⁶ |
| 0.1 | 7.51 × 10⁻⁵ | 7.37 × 10⁻⁵ | 4.98 × 10⁻⁵ | 3.37 × 10⁻⁵ | 9.25 × 10⁻⁶ |
| 0.2 | 7.59 × 10⁻⁵ | 7.41 × 10⁻⁵ | 5.30 × 10⁻⁵ | 3.82 × 10⁻⁵ | 1.61 × 10⁻⁵ |
| 0.3 | 7.67 × 10⁻⁵ | 7.45 × 10⁻⁵ | 5.62 × 10⁻⁵ | 4.27 × 10⁻⁵ | 2.29 × 10⁻⁵ |
| 0.4 | 7.75 × 10⁻⁵ | 7.49 × 10⁻⁵ | 5.94 × 10⁻⁵ | 4.72 × 10⁻⁵ | 2.98 × 10⁻⁵ |
| 0.5 | 7.83 × 10⁻⁵ | 7.52 × 10⁻⁵ | 6.26 × 10⁻⁵ | 5.17 × 10⁻⁵ | 3.66 × 10⁻⁵ |
| 0.6 | 7.91 × 10⁻⁵ | 7.56 × 10⁻⁵ | 6.58 × 10⁻⁵ | 5.62 × 10⁻⁵ | 4.35 × 10⁻⁵ |
| 0.7 | 7.99 × 10⁻⁵ | 7.60 × 10⁻⁵ | 6.91 × 10⁻⁵ | 6.07 × 10⁻⁵ | 5.03 × 10⁻⁵ |
| 0.8 | 8.07 × 10⁻⁵ | 7.64 × 10⁻⁵ | 7.23 × 10⁻⁵ | 6.52 × 10⁻⁵ | 5.71 × 10⁻⁵ |
| 0.9 | 8.15 × 10⁻⁵ | 7.68 × 10⁻⁵ | 7.55 × 10⁻⁵ | 6.97 × 10⁻⁵ | 6.40 × 10⁻⁵ |
| 1.0 | 8.24 × 10⁻⁵ | 7.71 × 10⁻⁵ | 7.87 × 10⁻⁵ | 7.42 × 10⁻⁵ | 7.08 × 10⁻⁵ |
| 1.1 | 8.32 × 10⁻⁵ | 7.75 × 10⁻⁵ | 8.19 × 10⁻⁵ | 7.88 × 10⁻⁵ | 7.77 × 10⁻⁵ |
| 1.2 | 8.40 × 10⁻⁵ | 7.79 × 10⁻⁵ | 8.51 × 10⁻⁵ | 8.33 × 10⁻⁵ | 8.45 × 10⁻⁵ |
| 1.3 | 8.48 × 10⁻⁵ | 7.83 × 10⁻⁵ | 8.83 × 10⁻⁵ | 8.78 × 10⁻⁵ | 9.13 × 10⁻⁵ |
| DOG | |||||
| 0 | 0.32 | 0.39 | 0.48 | 0.59 | 0.86 |
| 0.1 | 0.33 | 0.39 | 0.47 | 0.58 | 0.81 |
| 0.2 | 0.34 | 0.39 | 0.46 | 0.56 | 0.77 |
| 0.3 | 0.34 | 0.39 | 0.45 | 0.55 | 0.73 |
| 0.4 | 0.35 | 0.39 | 0.45 | 0.54 | 0.69 |
| 0.5 | 0.36 | 0.38 | 0.44 | 0.53 | 0.65 |
| 0.6 | 0.37 | 0.38 | 0.43 | 0.52 | 0.61 |
| 0.7 | 0.37 | 0.38 | 0.42 | 0.50 | 0.57 |
| 0.8 | 0.38 | 0.38 | 0.41 | 0.49 | 0.53 |
| 0.9 | 0.39 | 0.38 | 0.41 | 0.48 | 0.49 |
| 1.0 | 0.40 | 0.37 | 0.40 | 0.47 | 0.45 |
| 1.1 | 0.40 | 0.37 | 0.39 | 0.46 | 0.41 |
| 1.2 | 0.41 | 0.37 | 0.38 | 0.44 | 0.38 |
| 1.3 | 0.42 | 0.37 | 0.37 | 0.43 | 0.34 |
| Bulk density (g∙cm−3) | |||||
| 0 | 2.00 | 2.05 | 2.06 | 2.15 | 2.22 |
| 0.1 | 1.99 | 2.04 | 2.06 | 2.14 | 2.20 |
| 0.2 | 1.99 | 2.03 | 2.05 | 2.13 | 2.18 |
| 0.3 | 1.99 | 2.02 | 2.04 | 2.11 | 2.16 |
| 0.4 | 1.98 | 2.01 | 2.04 | 2.10 | 2.14 |
| 0.5 | 1.98 | 2.01 | 2.03 | 2.10 | 2.12 |
| 0.6 | 1.97 | 2.00 | 2.02 | 2.08 | 2.11 |
| 0.7 | 1.96 | 1.99 | 2.01 | 2.07 | 2.09 |
| 0.8 | 1.96 | 1.98 | 2.01 | 2.06 | 2.07 |
| 0.9 | 1.95 | 1.97 | 2.00 | 2.05 | 2.05 |
| 1.0 | 1.95 | 1.96 | 2.00 | 2.04 | 2.03 |
| 1.1 | 1.94 | 1.96 | 1.99 | 2.02 | 2.01 |
| 1.2 | 1.94 | 1.95 | 1.99 | 2.01 | 2.00 |
| 1.3 | 1.93 | 1.94 | 1.98 | 2.00 | 1.98 |
References
- Richards, J.W. The Söderberg self-Baking continuous electrode. In Proceedings of the Thirty-Seventh General Meeting of the American Electrochemical Society, Boston, MA, USA, 8 April 1920; pp. 169–188. [Google Scholar]
- Larsen, B. Electrode models for Søderberg electrodes. In Proceedings of the Fifth Platinum Conference, Sun City, South Africa, 18 September 2012; pp. 275–286. [Google Scholar]
- Skjeldestad, A.; Tangstad, M.; Lindstad, L.; Larsen, B. Temperature profiles in Søderberg electrodes. In Proceedings of the Fourteenth International Ferroalloys Congress (INFACON), Kiev, Ukraine, 31 May–4 June 2015; pp. 327–337. [Google Scholar]
- Beukes, J.P.; Roos, H.; Shoko, L.; Van Zyl, P.G.; Neomagus, H.W.J.P.; Strydom, C.A.; Dawson, N.F. The use of thermomechanical analysis to characterise Söderberg electrode paste raw materials. Miner. Eng. 2013, 46, 167–176. [Google Scholar] [CrossRef]
- Larsen, B.; Feldborg, H.; Halvorsen, S.A. Minimizing thermal stress during shutdown of Søderberg electrodes. In Proceedings of the Thirteenth International Ferroalloys Congress (INFACON), Almaty, Kazakhstan, 9–13 June 2013; pp. 453–466. [Google Scholar]
- Meyjes, R.P.; Venter, J.; Van Rooyen, U. Advanced modelling and baking of electrodes. In Proceedings of the Twelfth International Ferroalloys Congress (INFACON), Helsinki, Finland, 6–9 June 2010; pp. 779–788. [Google Scholar]
- Ray, C.R.; Sahoo, P.K.; Rao, S.S. Electrode management–investigation into soft breaks at 48MVA FeCr closed furnace. In Proceedings of the Eleventh International Ferroalloys Congress (INFACON), New Delhi, India, 18–21 February 2007; pp. 742–751. [Google Scholar]
- Nelson, L.R.; Prins, F.X. Insights into the influences of paste addition and levels on Söderberg electrode management. In Proceedings of the Tenth International Ferroalloys Congress (INFACON), Cape Town, South Africa, 1–4 February 2004; pp. 418–431. [Google Scholar]
- Mc Dougall, I.; Smith, C.F.R.; Olmstead, B.; Gericke, W.A. Finite element model of a Søderberg electrode with an application in casing design. In Proceedings of the Tenth International Ferroalloys Congress (INFACON), Cape Town, South Africa, 1–4 February 2004; pp. 575–584. [Google Scholar]
- Larsen, B.; Amaro, J.P.M.; Nascimento, S.Z.; Fidje, K.; Gran, H. Melting and densification of electrode paste briquettes in Søderberg electrodes. In Proceedings of the Tenth International Ferroalloys Congress (INFACON), Cape Town, South Africa, 1–4 February 2004; pp. 405–417. [Google Scholar]
- Shoko, L.; Beukes, J.P.; Strydom, C.A. Determining the baking isotherm temperature of Söderberg electrodes and associated structural changes. Miner. Eng. 2013, 49, 33–39. [Google Scholar] [CrossRef]
- White, J.F.; Rigas, K.; Andersson, S.P.; Glaser, B. Thermal properties of Söderberg electrode materials. Metall. Mater. Trans. B 2020, 51, 1928–1932. [Google Scholar] [CrossRef]
- Karalis, K.T.; Karkalos, N.; Cheimarios, N.; Antipas, G.S.E.; Xenidis, A.; Boudouvis, A.G. A CFD analysis of slag properties, electrode shape and immersion depth effects on electric submerged arc furnace heating in ferronickel processing. Appl. Math. Model. 2016, 40, 9052–9066. [Google Scholar] [CrossRef]
- Shoko, L.; Beukes, J.P.; Strydom, C.A.; Larsen, B.; Lindstad, L. Predicting the toluene-And quinoline insoluble contents of coal tar pitches used as binders in Söderberg electrodes. Int. J. Miner. Process. 2015, 144, 46–49. [Google Scholar] [CrossRef]
- Jordan, D.T.; Hockaday, C.J. Development of a camera-Based Söderberg electrode slip measurement device. In Proceedings of the Thirteenth International Ferroalloys Congress (INFACON), Almaty, Kazakhstan, 9–13 June 2013; pp. 417–426. [Google Scholar]
- Heikkilä, A.M.; Pussinen, J.H.; Mattila, O.J.; Fabritius, T.M.J. About electrical properties of chromite pellets –Effect of reduction degree. Steel Res. Int. 2015, 86, 121–128. [Google Scholar] [CrossRef]
- Zou, L.; Huang, B.; Huang, Y.; Huang, Q.; Wang, C. An investigation of heterogeneity of the degree of graphitization in carbon-carbon composites. Mater. Chem. Phys. 2003, 82, 654–662. [Google Scholar] [CrossRef]
- Zhang, Z.; Wang, Q. The new method of XRD measurement of the degree of disorder for anode coke material. Crystals 2017, 7, 1–10. [Google Scholar] [CrossRef]
- C20-00, ASTM. Standard Test Method for Apparent Porosity, Water Absorption, Apparent Specific Gravity, and Bulk Density of Burned Refractory Brick and Shapes by Boiling Water; ASTM International: West Conshohocken, PA, USA, 2010. [Google Scholar]
- Beukes, J.P.; Du Preez, S.P.; Van Zyl, P.G.; Paktunc, D.; Fabritius, T.; Päätalo, M.; Cramer, M. Review of Cr(VI) environmental practices in the chromite mining and smelting industry–Relevance to development of the Ring of Fire, Canada. J. Clean. Prod. 2017, 165, 874–889. [Google Scholar] [CrossRef]
- Surup, G.; Pedersen, T.; Chaldien, A.; Beukes, J.P.; Tangstad, M. Electrical resistivity of carbonaceous bed material at high temperature. Processes 2020, 8, 0933. [Google Scholar] [CrossRef]
- Tangstad, M.; Beukes, J.P.; Steenkamp, J.; Ringdalen, E. Chapter 14. Coal-Based reducing agents in ferroalloys and silicon production. In New Trends in Coal Conversion; Suárez-Ruiz, I., Rubiera, F., Diez, M., Eds.; Elsevier: Duxford, UK, 2019; pp. 405–438. Available online: http://dx.doi.org/10.1016/B978-0-08-102201-6.00014-5 (accessed on 30 October 2020).
- Bermúdez, A.; Bullón, J.; Pena, F. A finite element method for the thermoelectrical modelling of electrodes. Commun. Numer. Methods Eng. 1998, 14, 581–593. [Google Scholar] [CrossRef]
- Ciesińska, W.; Zieliński, J.; Brzozowska, T. Thermal treatment of pitch-polymer blends. J. Therm. Anal. Calorim. 2009, 95, 193–196. [Google Scholar] [CrossRef]
- Sem, M.O. The Söderberg self-baking electrode. J. Electrochem. Soc. 1954, 101, 487–492. [Google Scholar] [CrossRef]
- Wedepohl, A.; Barcza, N.A. The “dig-Out” of a ferrochromium furnace. Spec. Publ. Geol. Soc. S. Afr. 1983, 7, 351–363. [Google Scholar]
- Nell, J.; Joubert, C. Phase chemistry of digout samples from a ferrosilicon furnace. In Proceedings of the Thirteenth International Ferroalloys Congress (INFACON), Almaty, Kazakhstan, 9–13 June 2013; pp. 265–272. [Google Scholar]
- Steenkamp, J.D.; Gous, J.P.; Grote, W.; Cromarty, R.; Gous, H.J. Process zones observed in a 48 MVA submerged arc furnace producing silicomanganese according to the ore-Based process. In Proceedings of the Extraction 2018, The Minerals, Metals & Materials Series, Ottawa, ON, Canada, 26–29 August 2018; Available online: https://doi.org/10.1007/978-3-319-95022-8_50 (accessed on 30 October 2020).


Publisher’s Note: MDPI stays neutral with regard to jurisdictional claims in published maps and institutional affiliations. |
© 2020 by the authors. Licensee MDPI, Basel, Switzerland. This article is an open access article distributed under the terms and conditions of the Creative Commons Attribution (CC BY) license (http://creativecommons.org/licenses/by/4.0/).
Share and Cite
Glastonbury, R.I.; Beukes, J.P.; van Zyl, P.G.; Tangstad, M.; Ringdalen, E.; Dall, D.; Steenkamp, J.D.; Mushwana, M. Characterisation of a Real-World Søderberg Electrode. Metals 2021, 11, 5. https://doi.org/10.3390/met11010005
Glastonbury RI, Beukes JP, van Zyl PG, Tangstad M, Ringdalen E, Dall D, Steenkamp JD, Mushwana M. Characterisation of a Real-World Søderberg Electrode. Metals. 2021; 11(1):5. https://doi.org/10.3390/met11010005
Chicago/Turabian StyleGlastonbury, Ralph Ivor, Johan Paul Beukes, Pieter Gideon van Zyl, Merete Tangstad, Eli Ringdalen, Douglas Dall, Joalet Dalene Steenkamp, and Masana Mushwana. 2021. "Characterisation of a Real-World Søderberg Electrode" Metals 11, no. 1: 5. https://doi.org/10.3390/met11010005
APA StyleGlastonbury, R. I., Beukes, J. P., van Zyl, P. G., Tangstad, M., Ringdalen, E., Dall, D., Steenkamp, J. D., & Mushwana, M. (2021). Characterisation of a Real-World Søderberg Electrode. Metals, 11(1), 5. https://doi.org/10.3390/met11010005