Effect of Periodic Overloads on Short Fatigue Crack Behavior in CuNi2Si Alloy under Rotating Bending Load


Abstract
1. Introduction
2. Materials and Tests
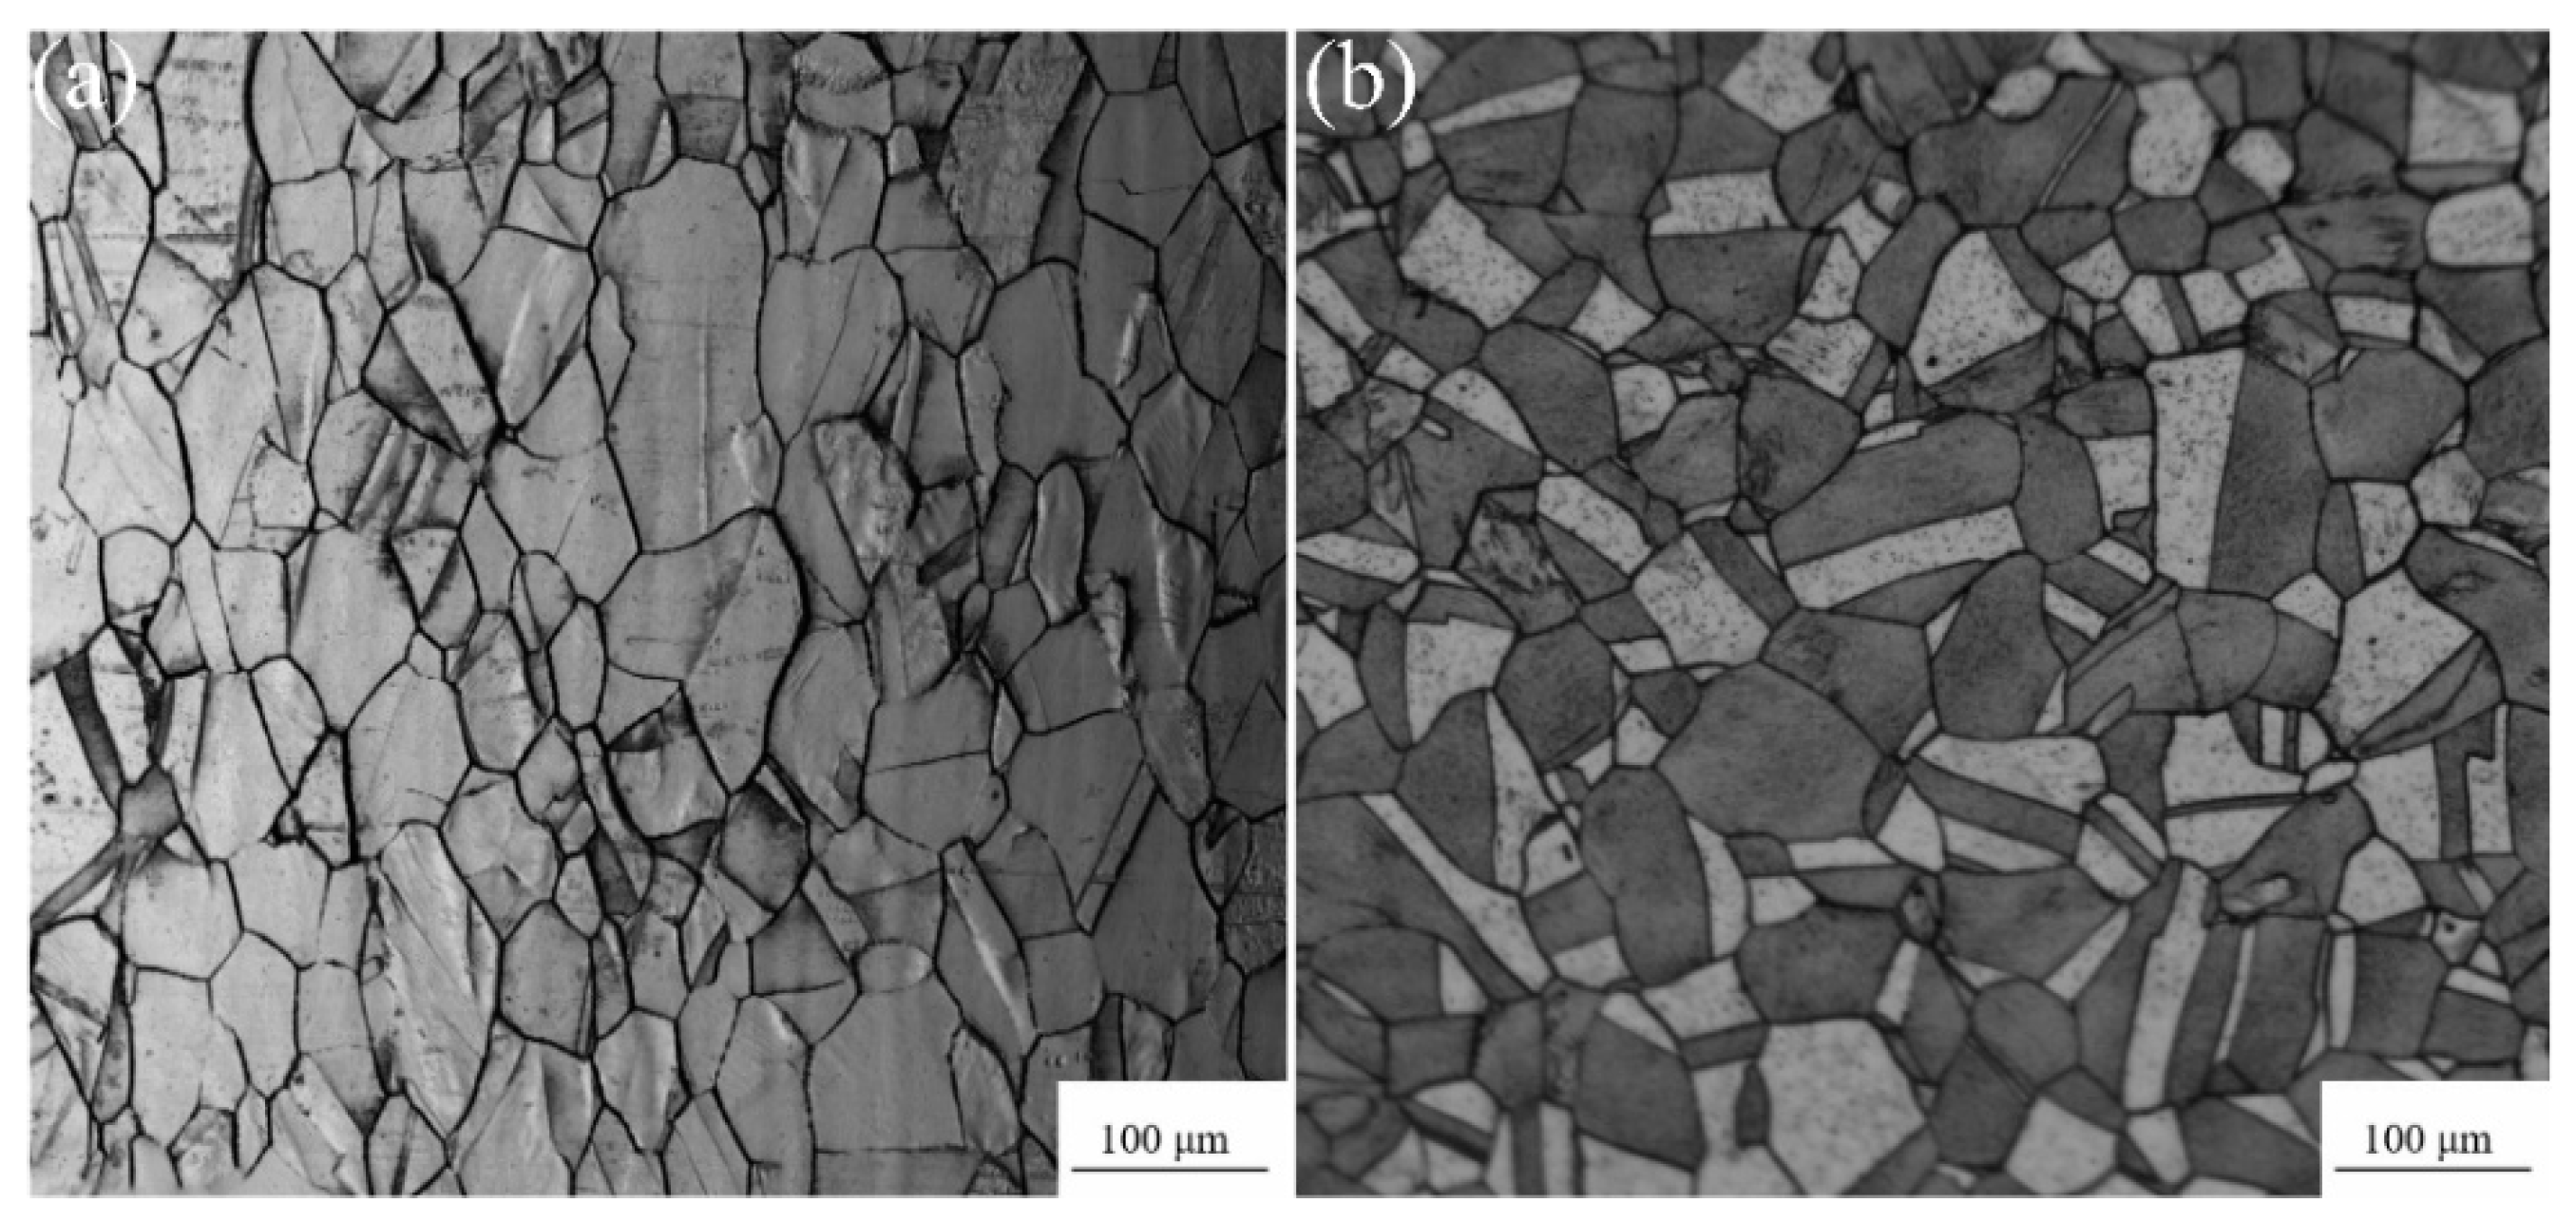
2.1. Materials
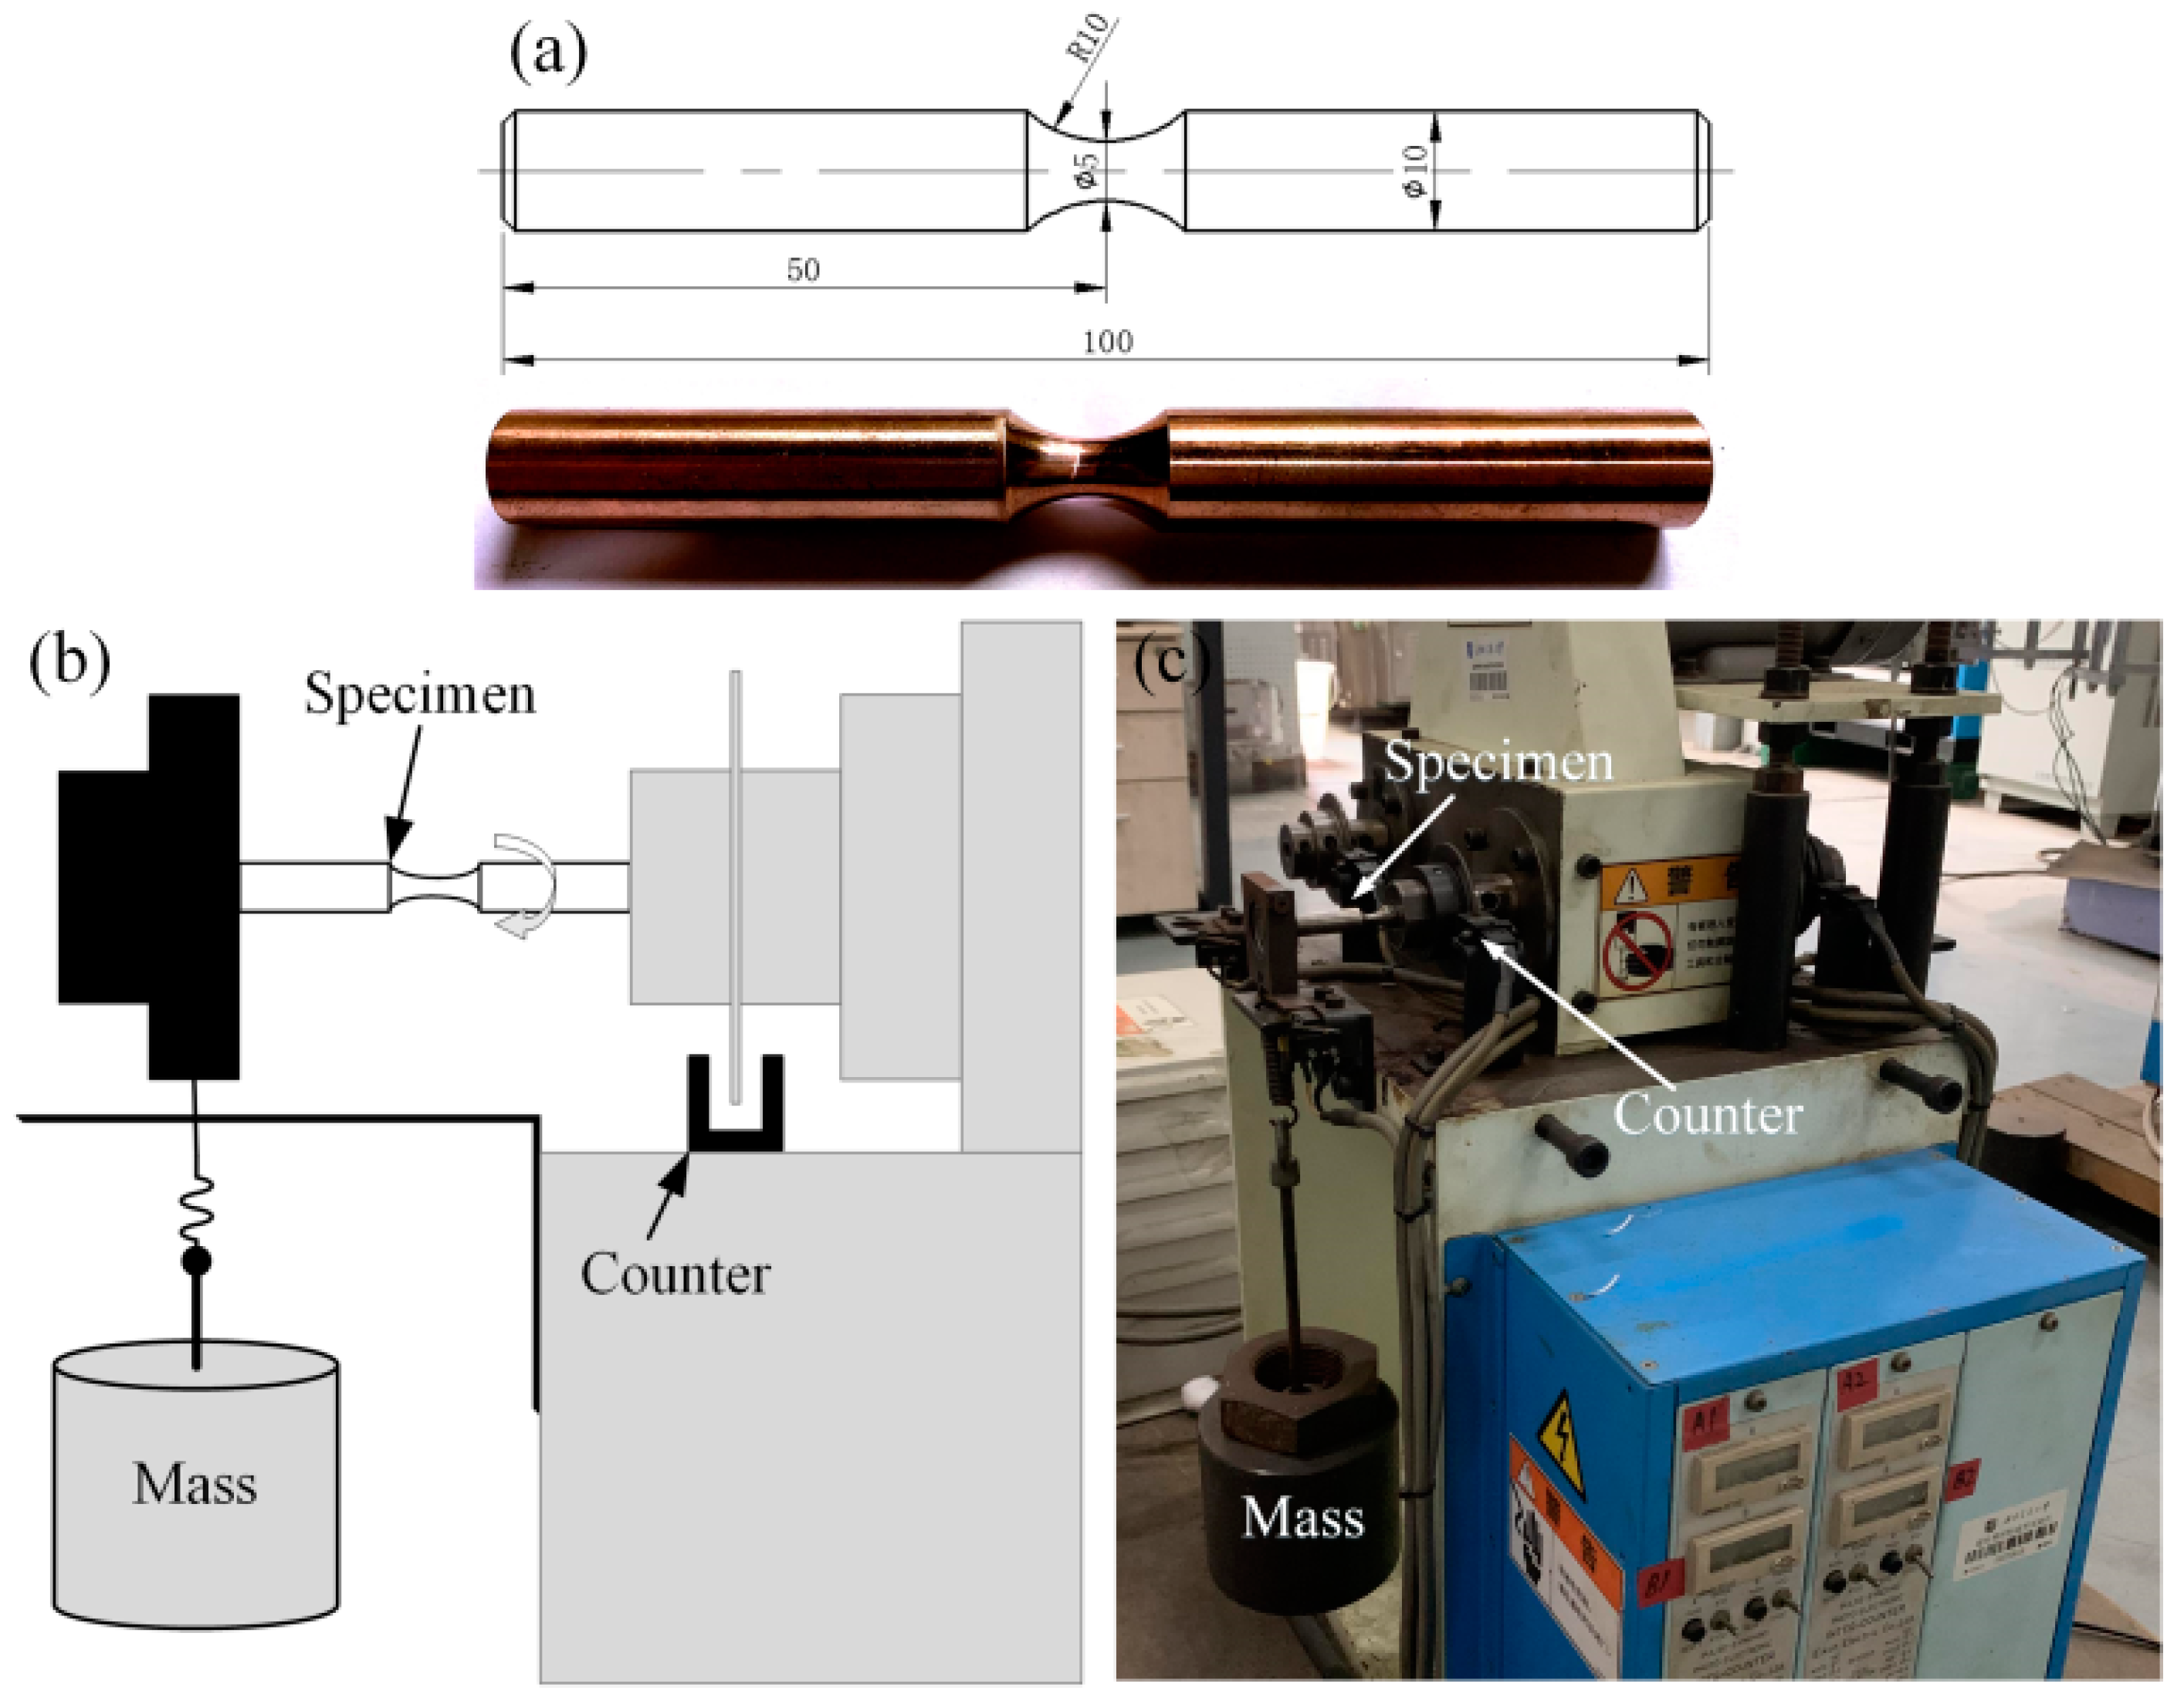
2.2. Fatigue Tests
3. Results and Discussion
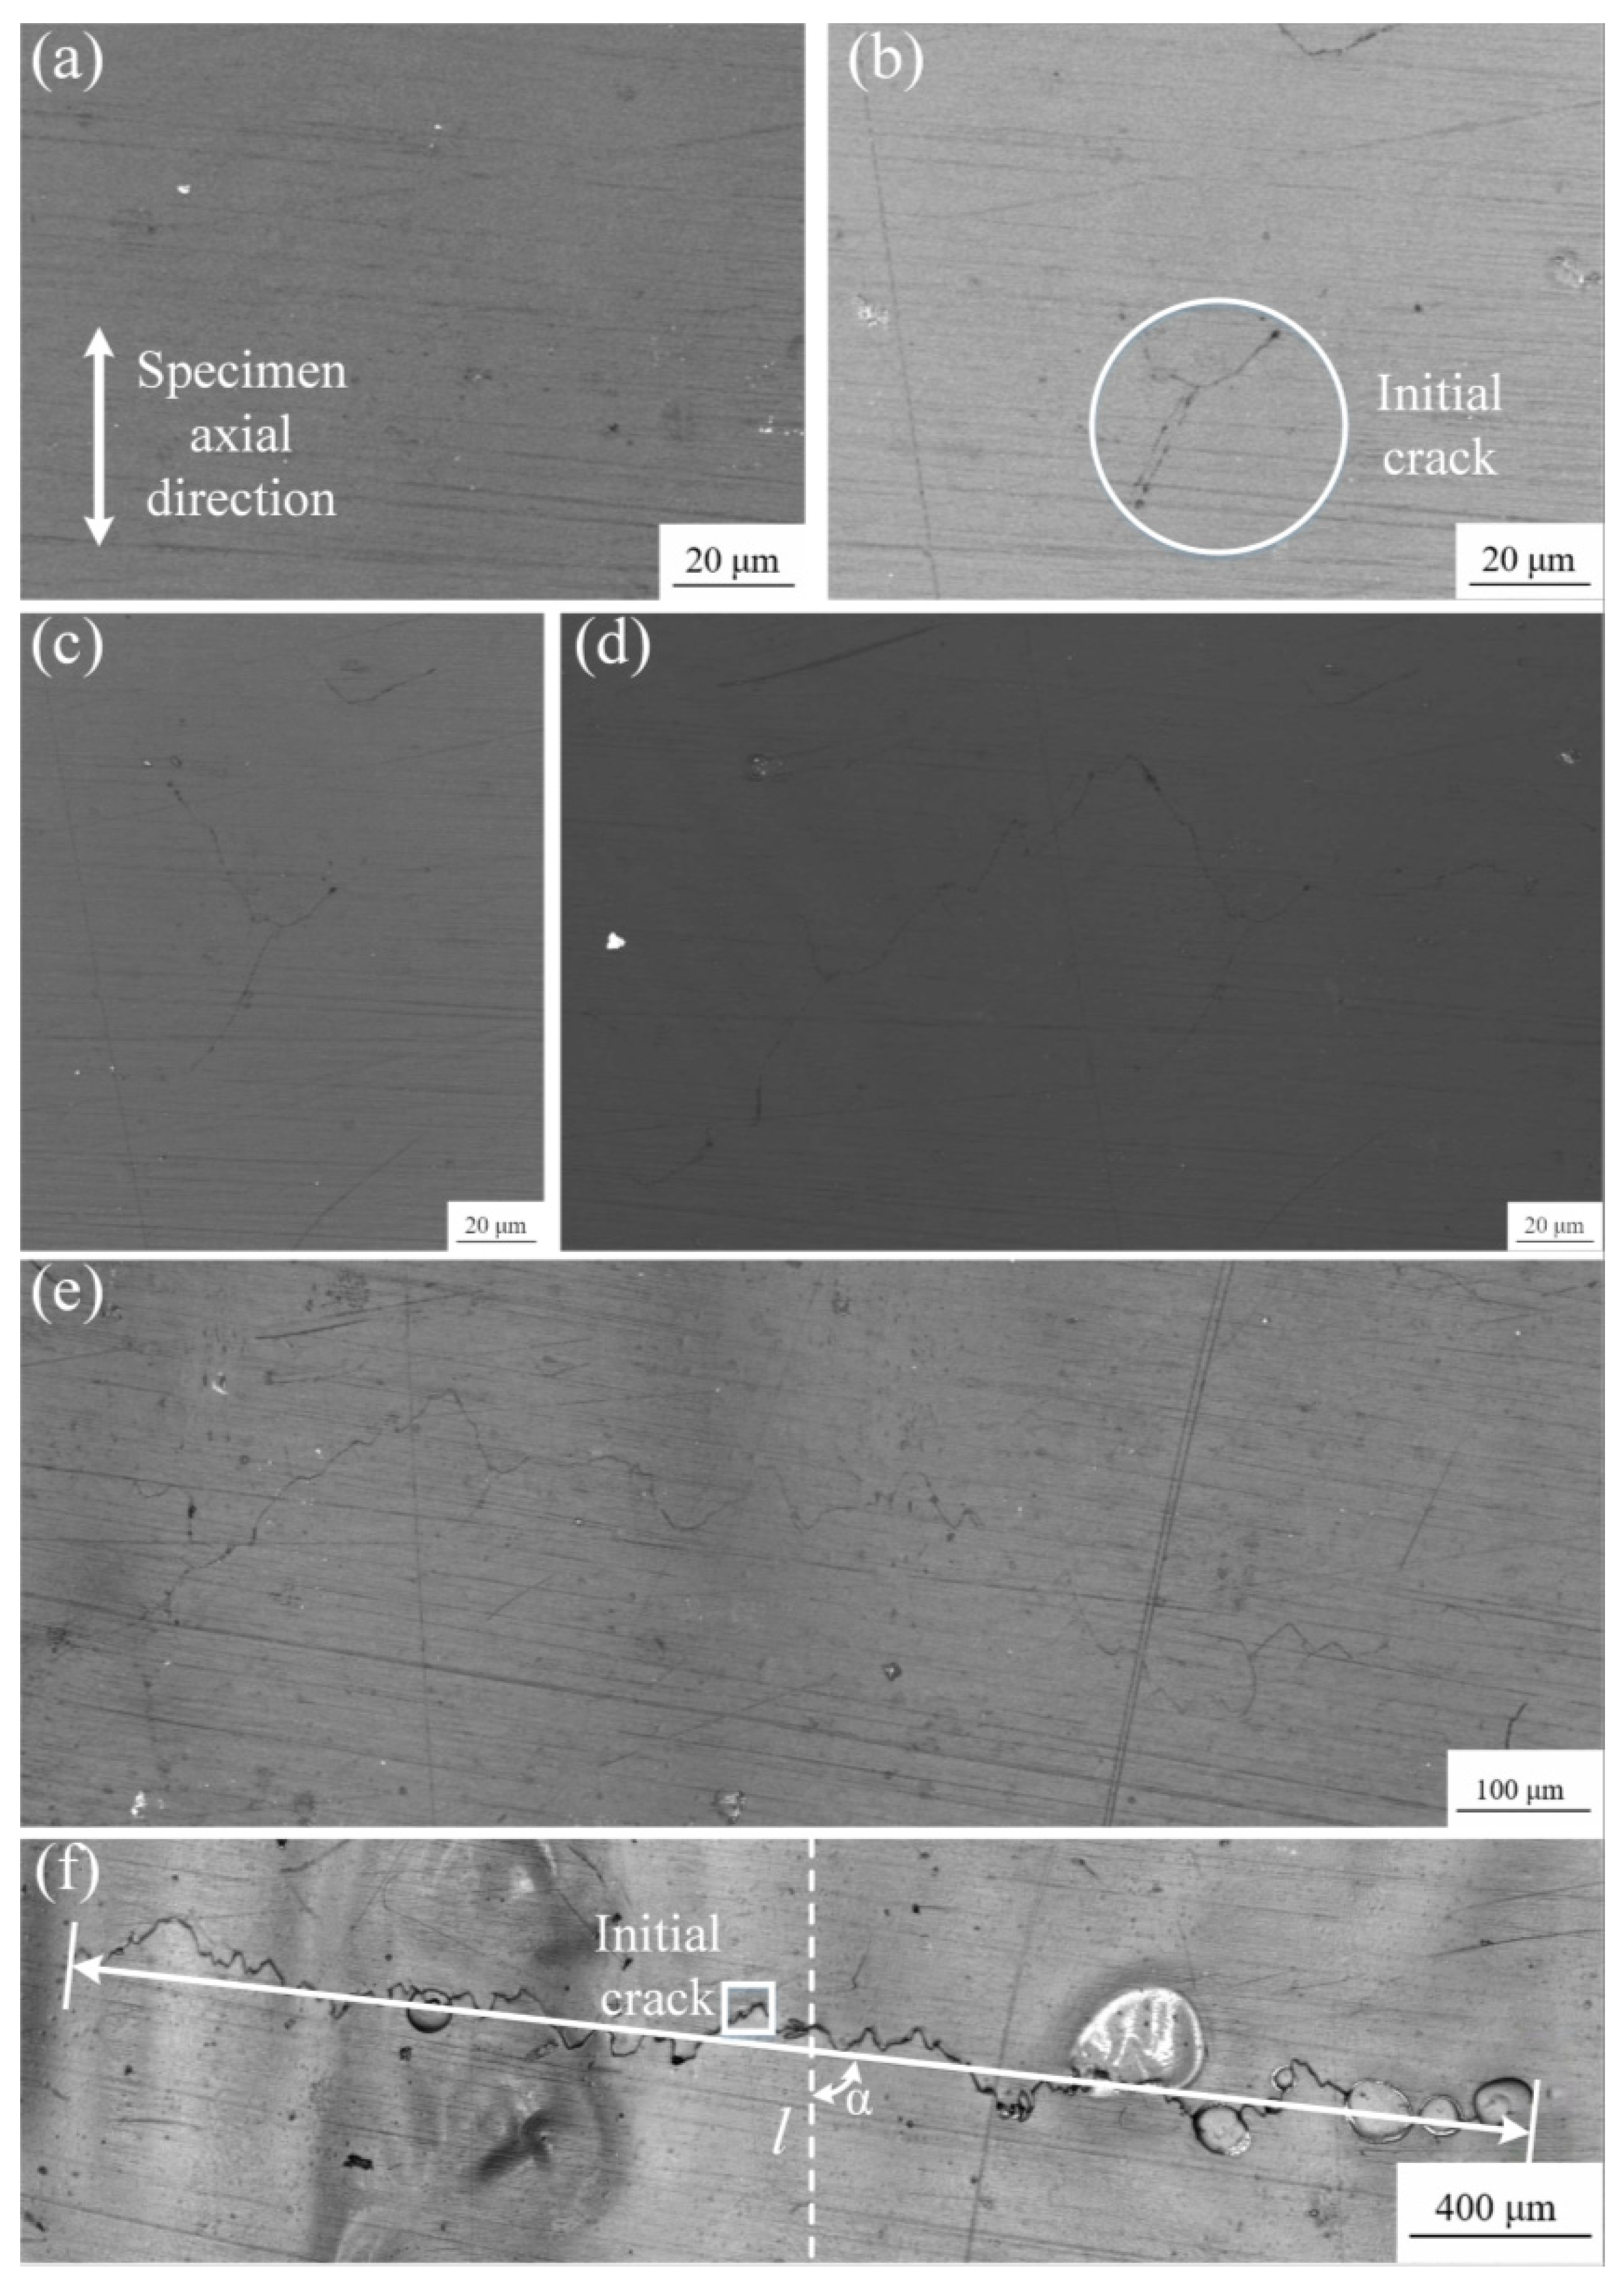
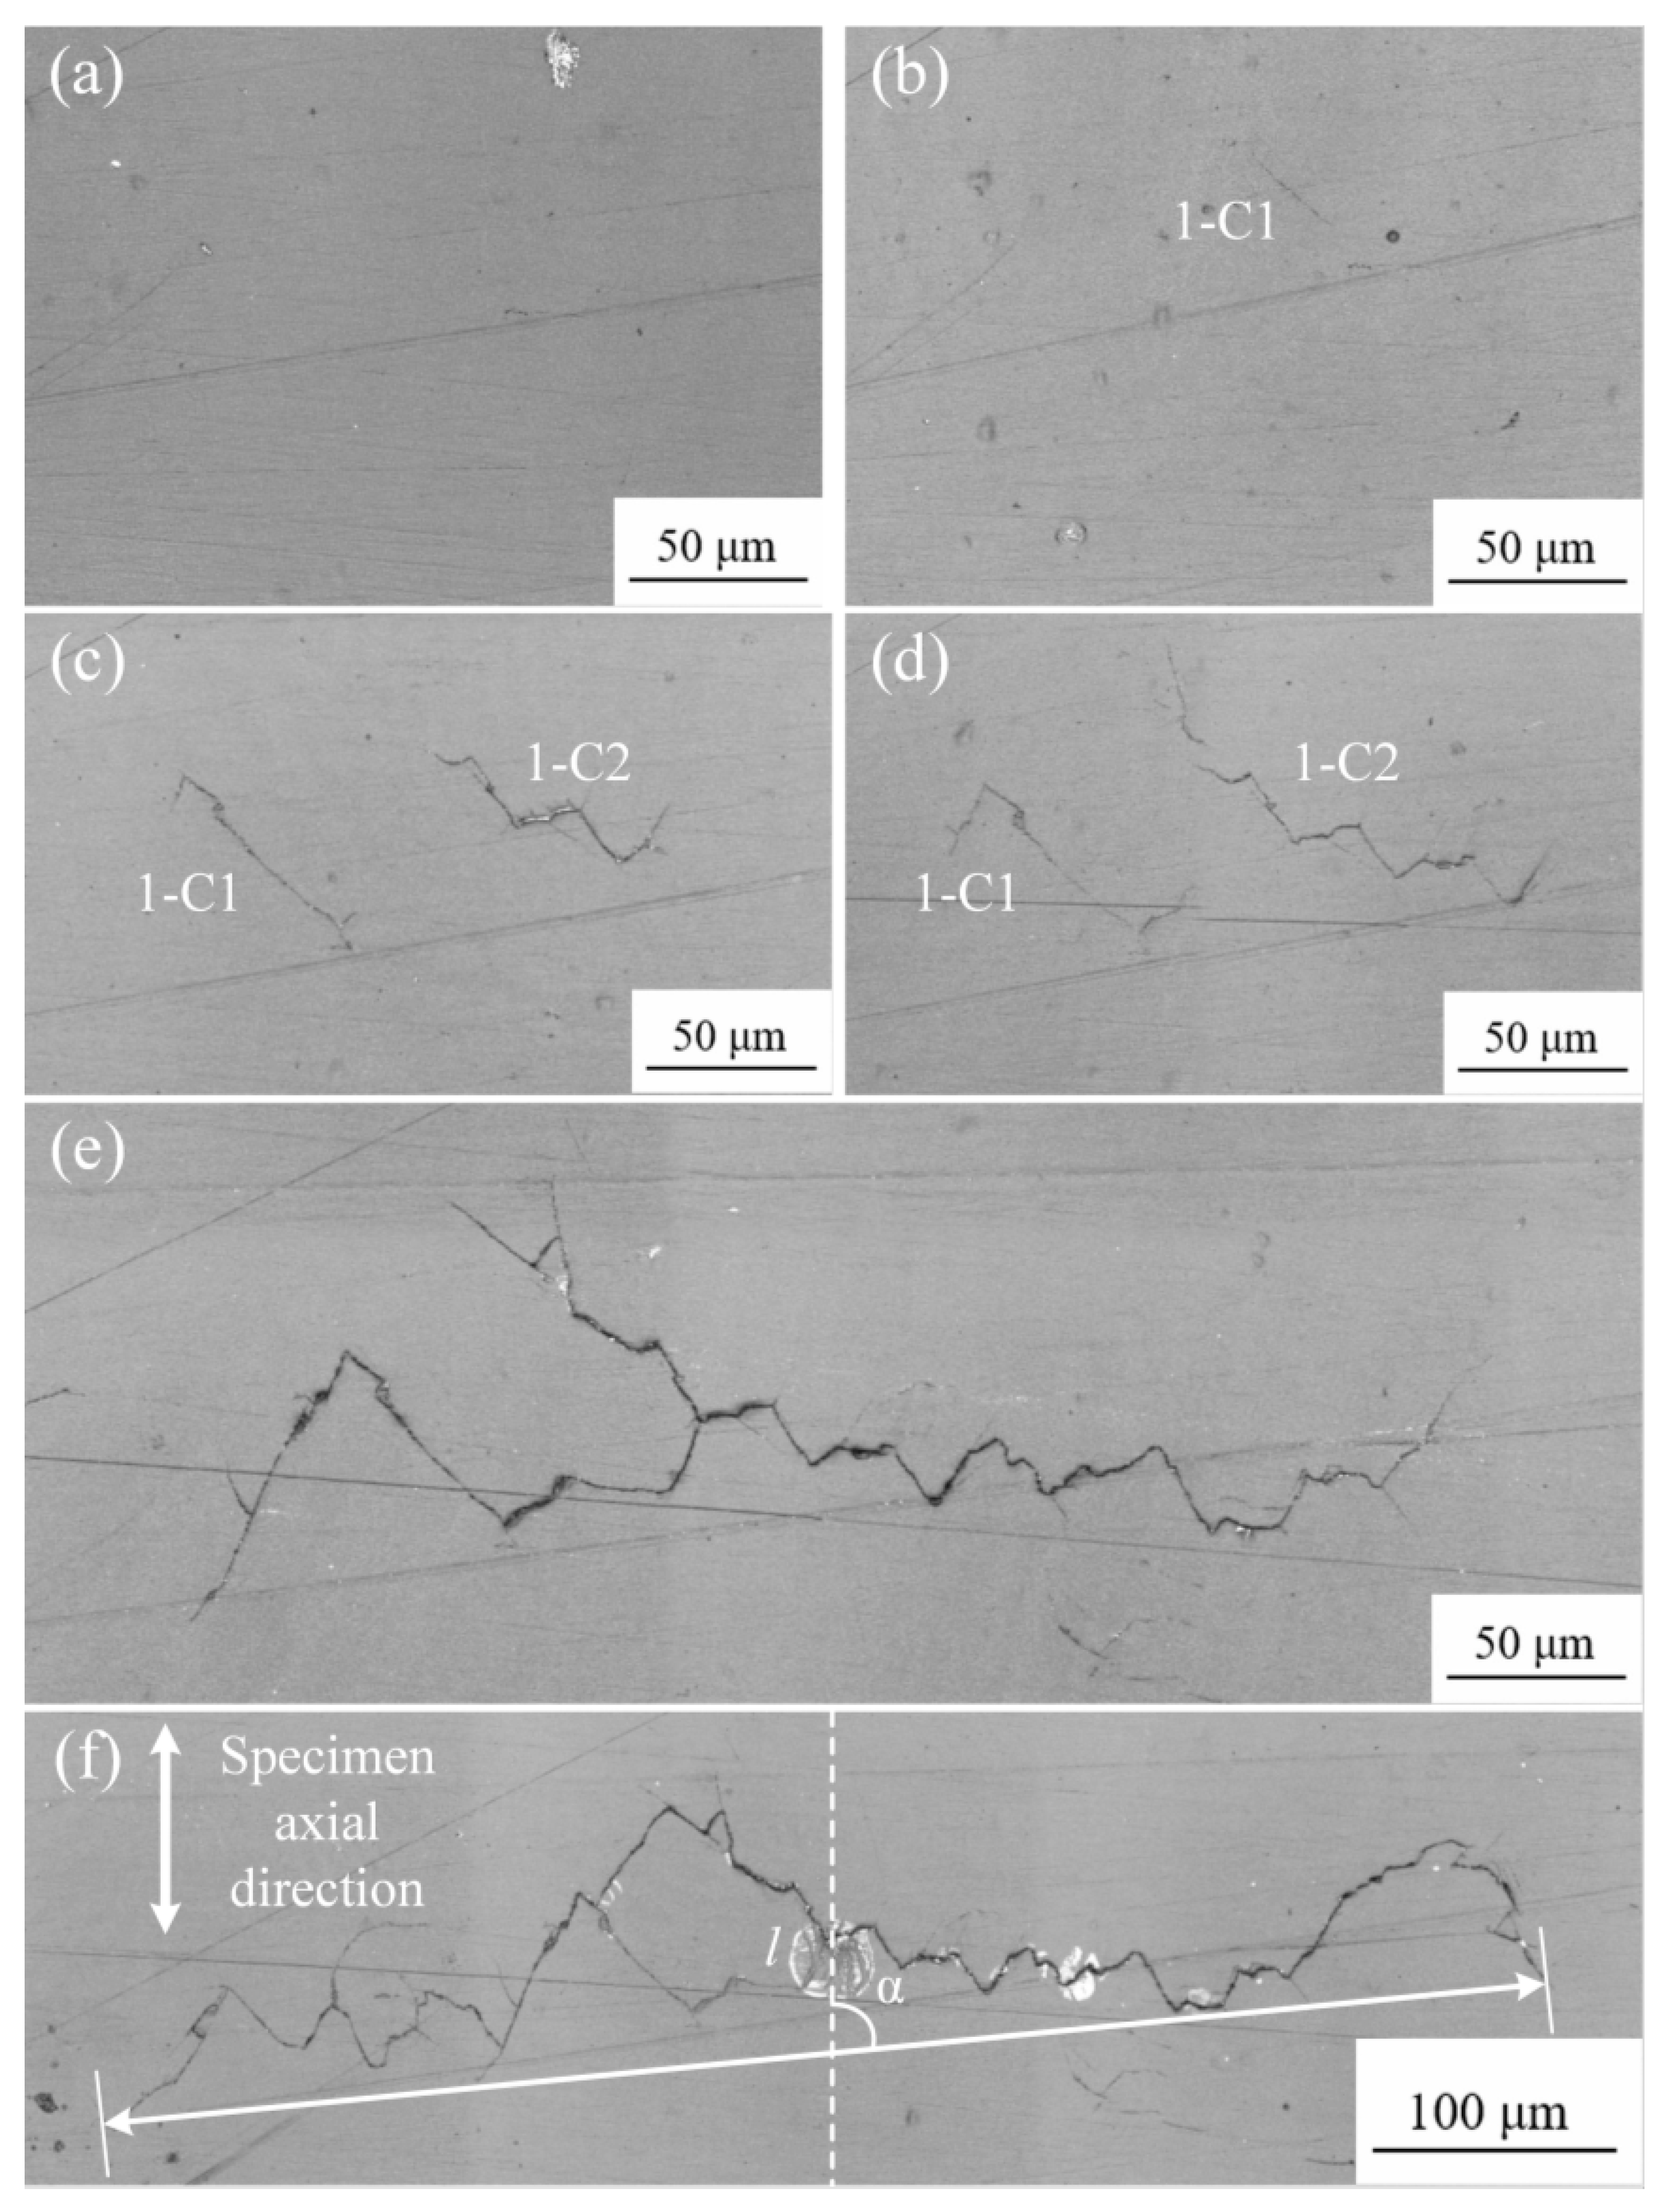
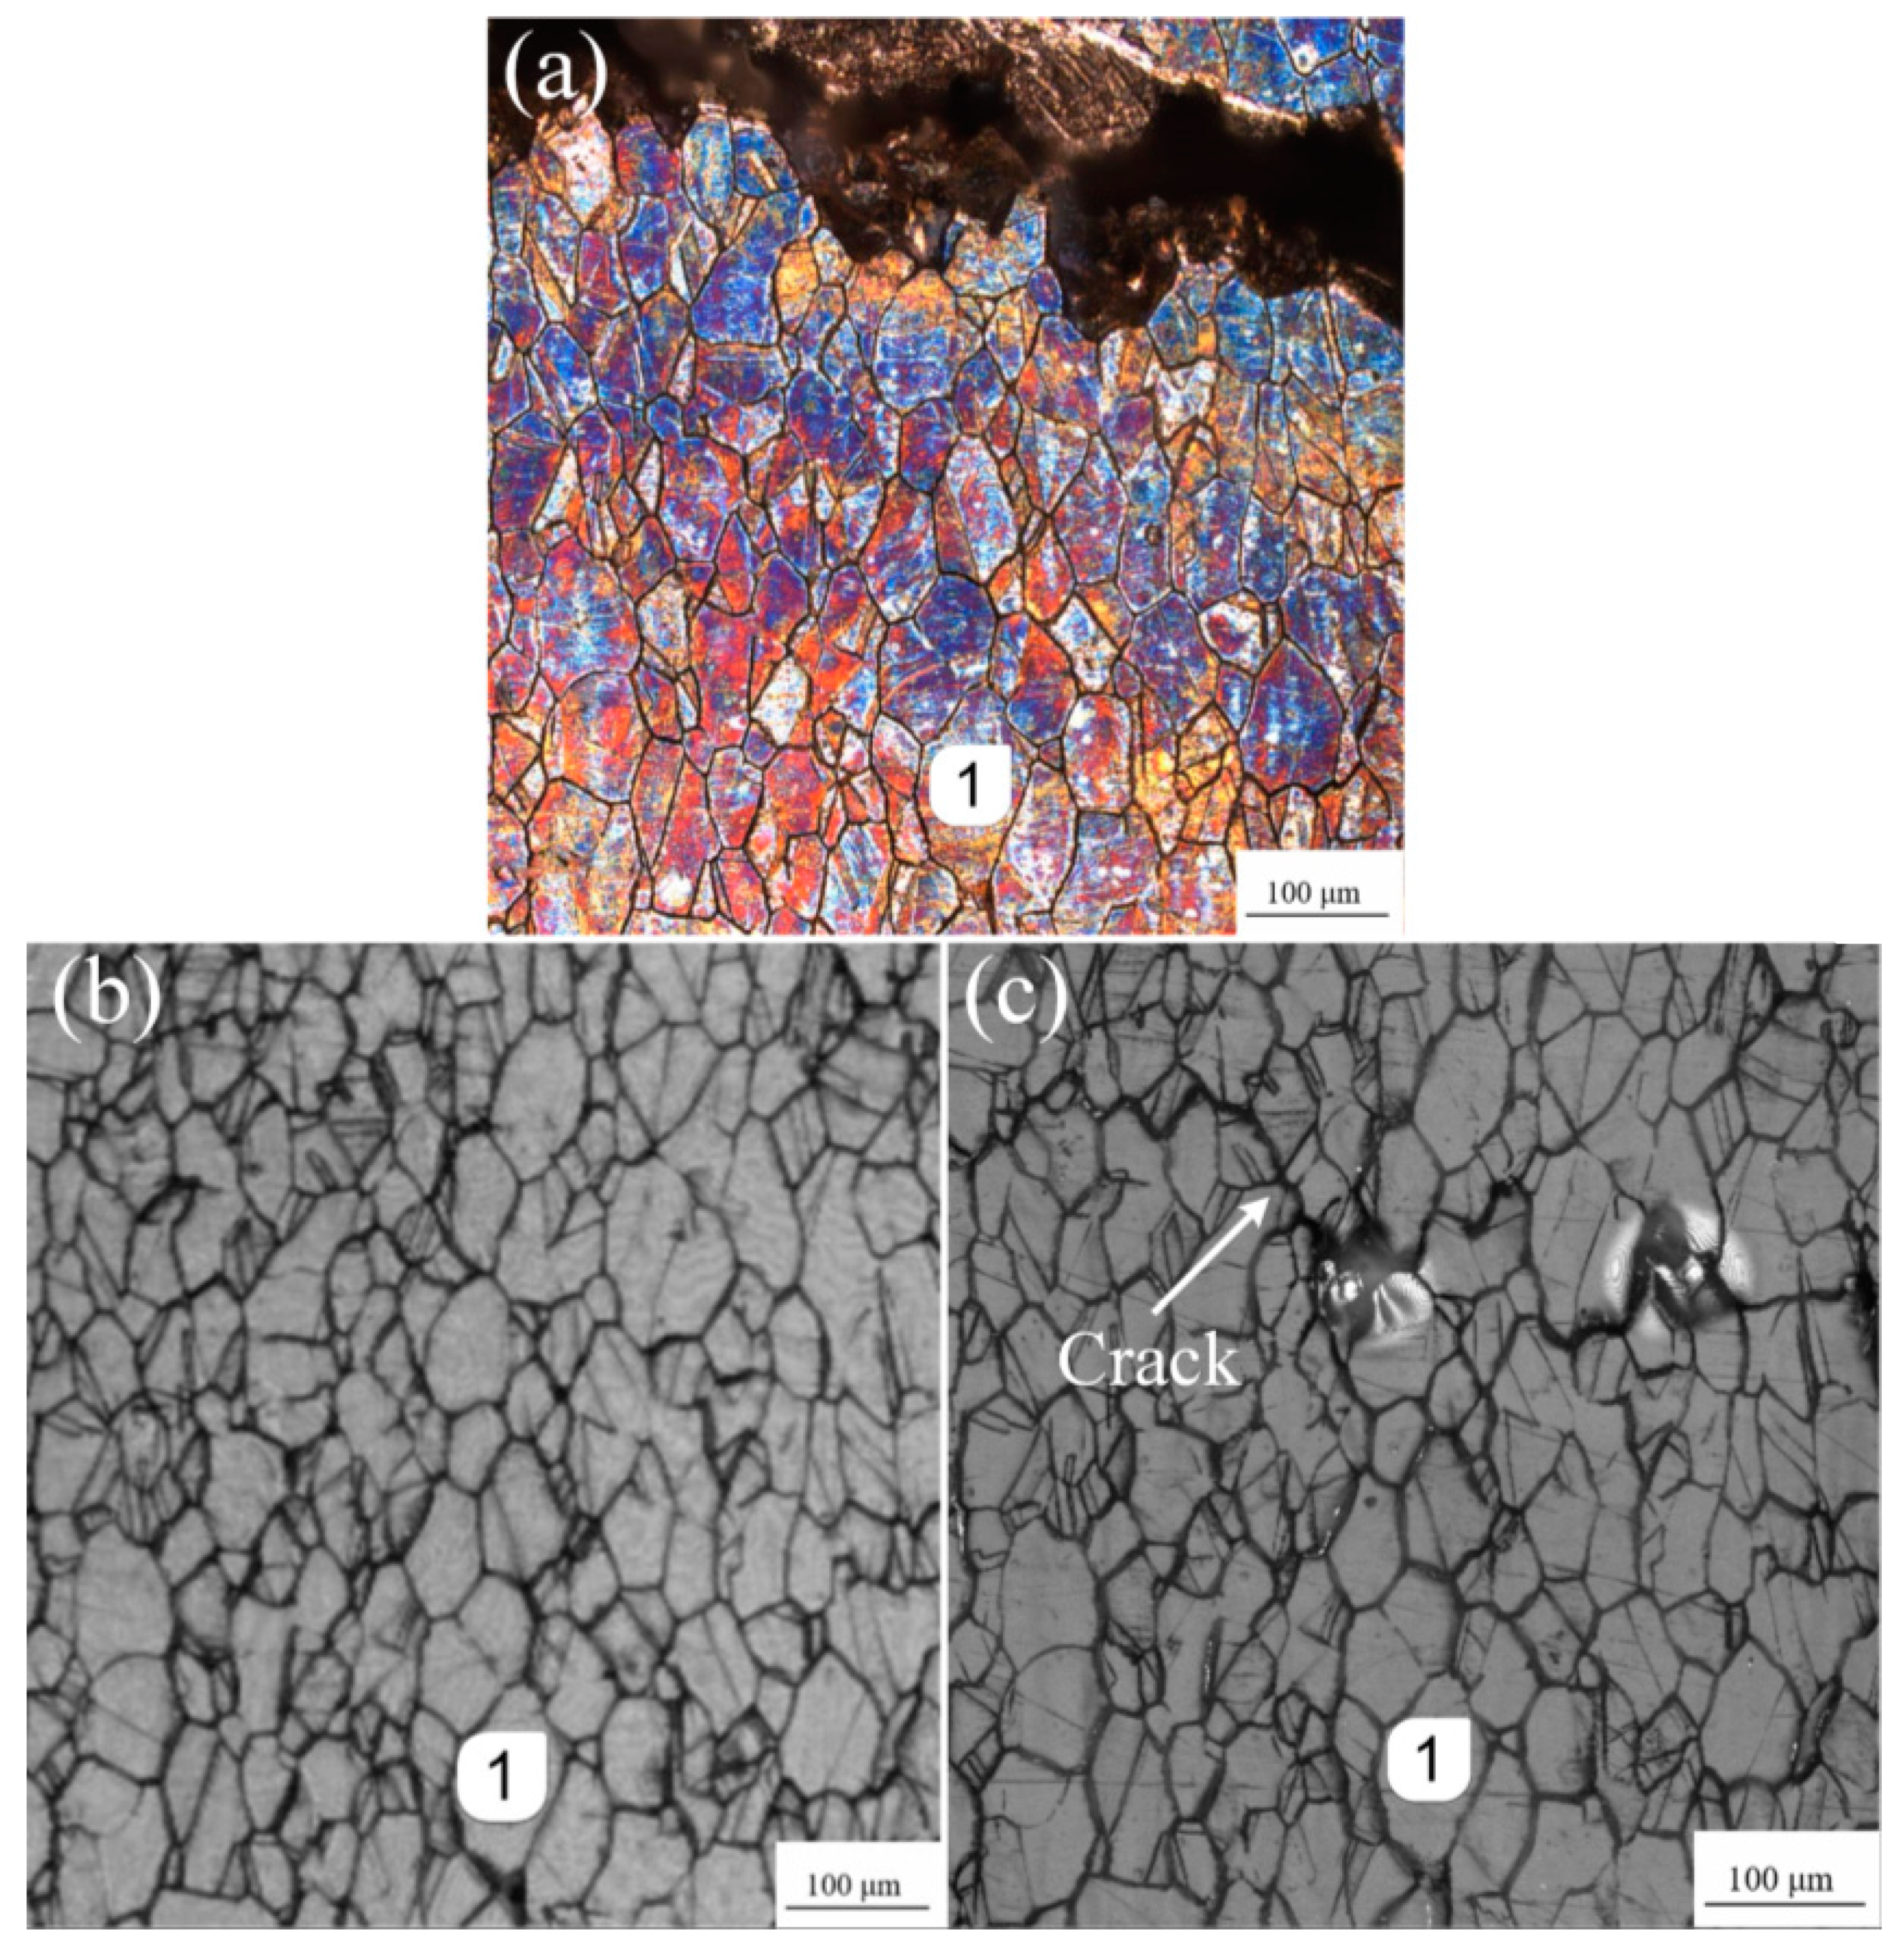
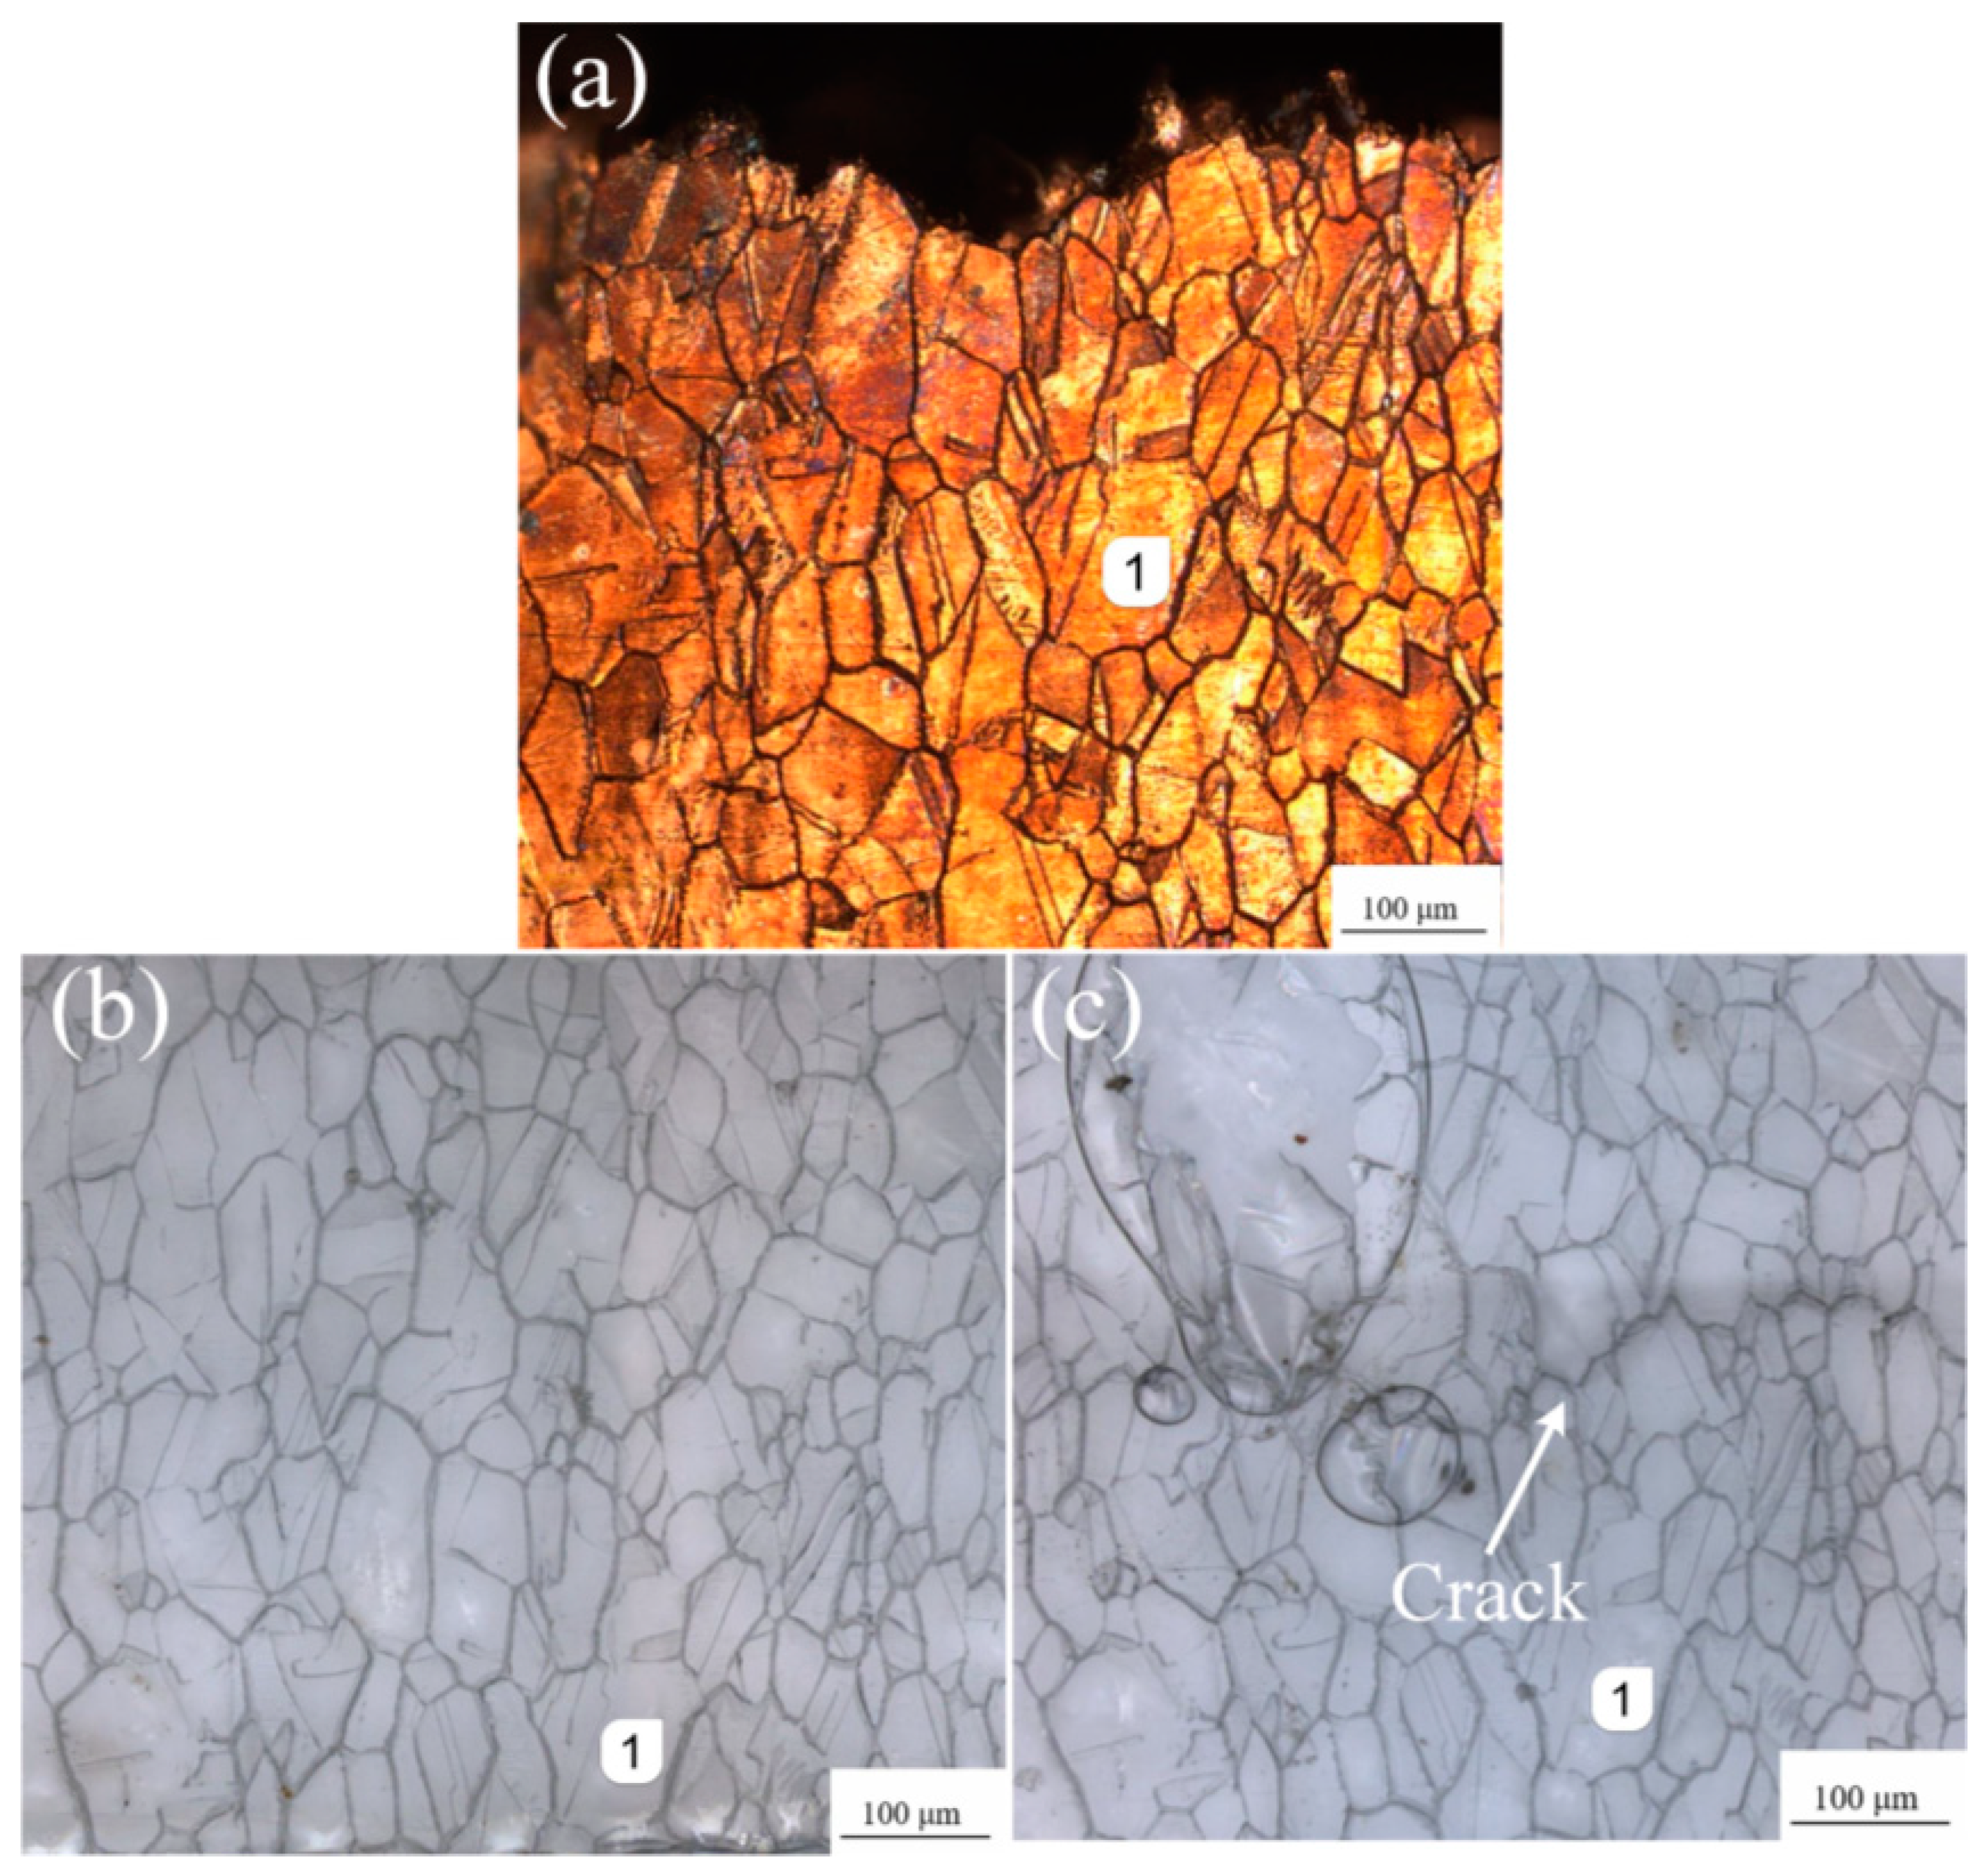
3.1. Observation of Replica Film
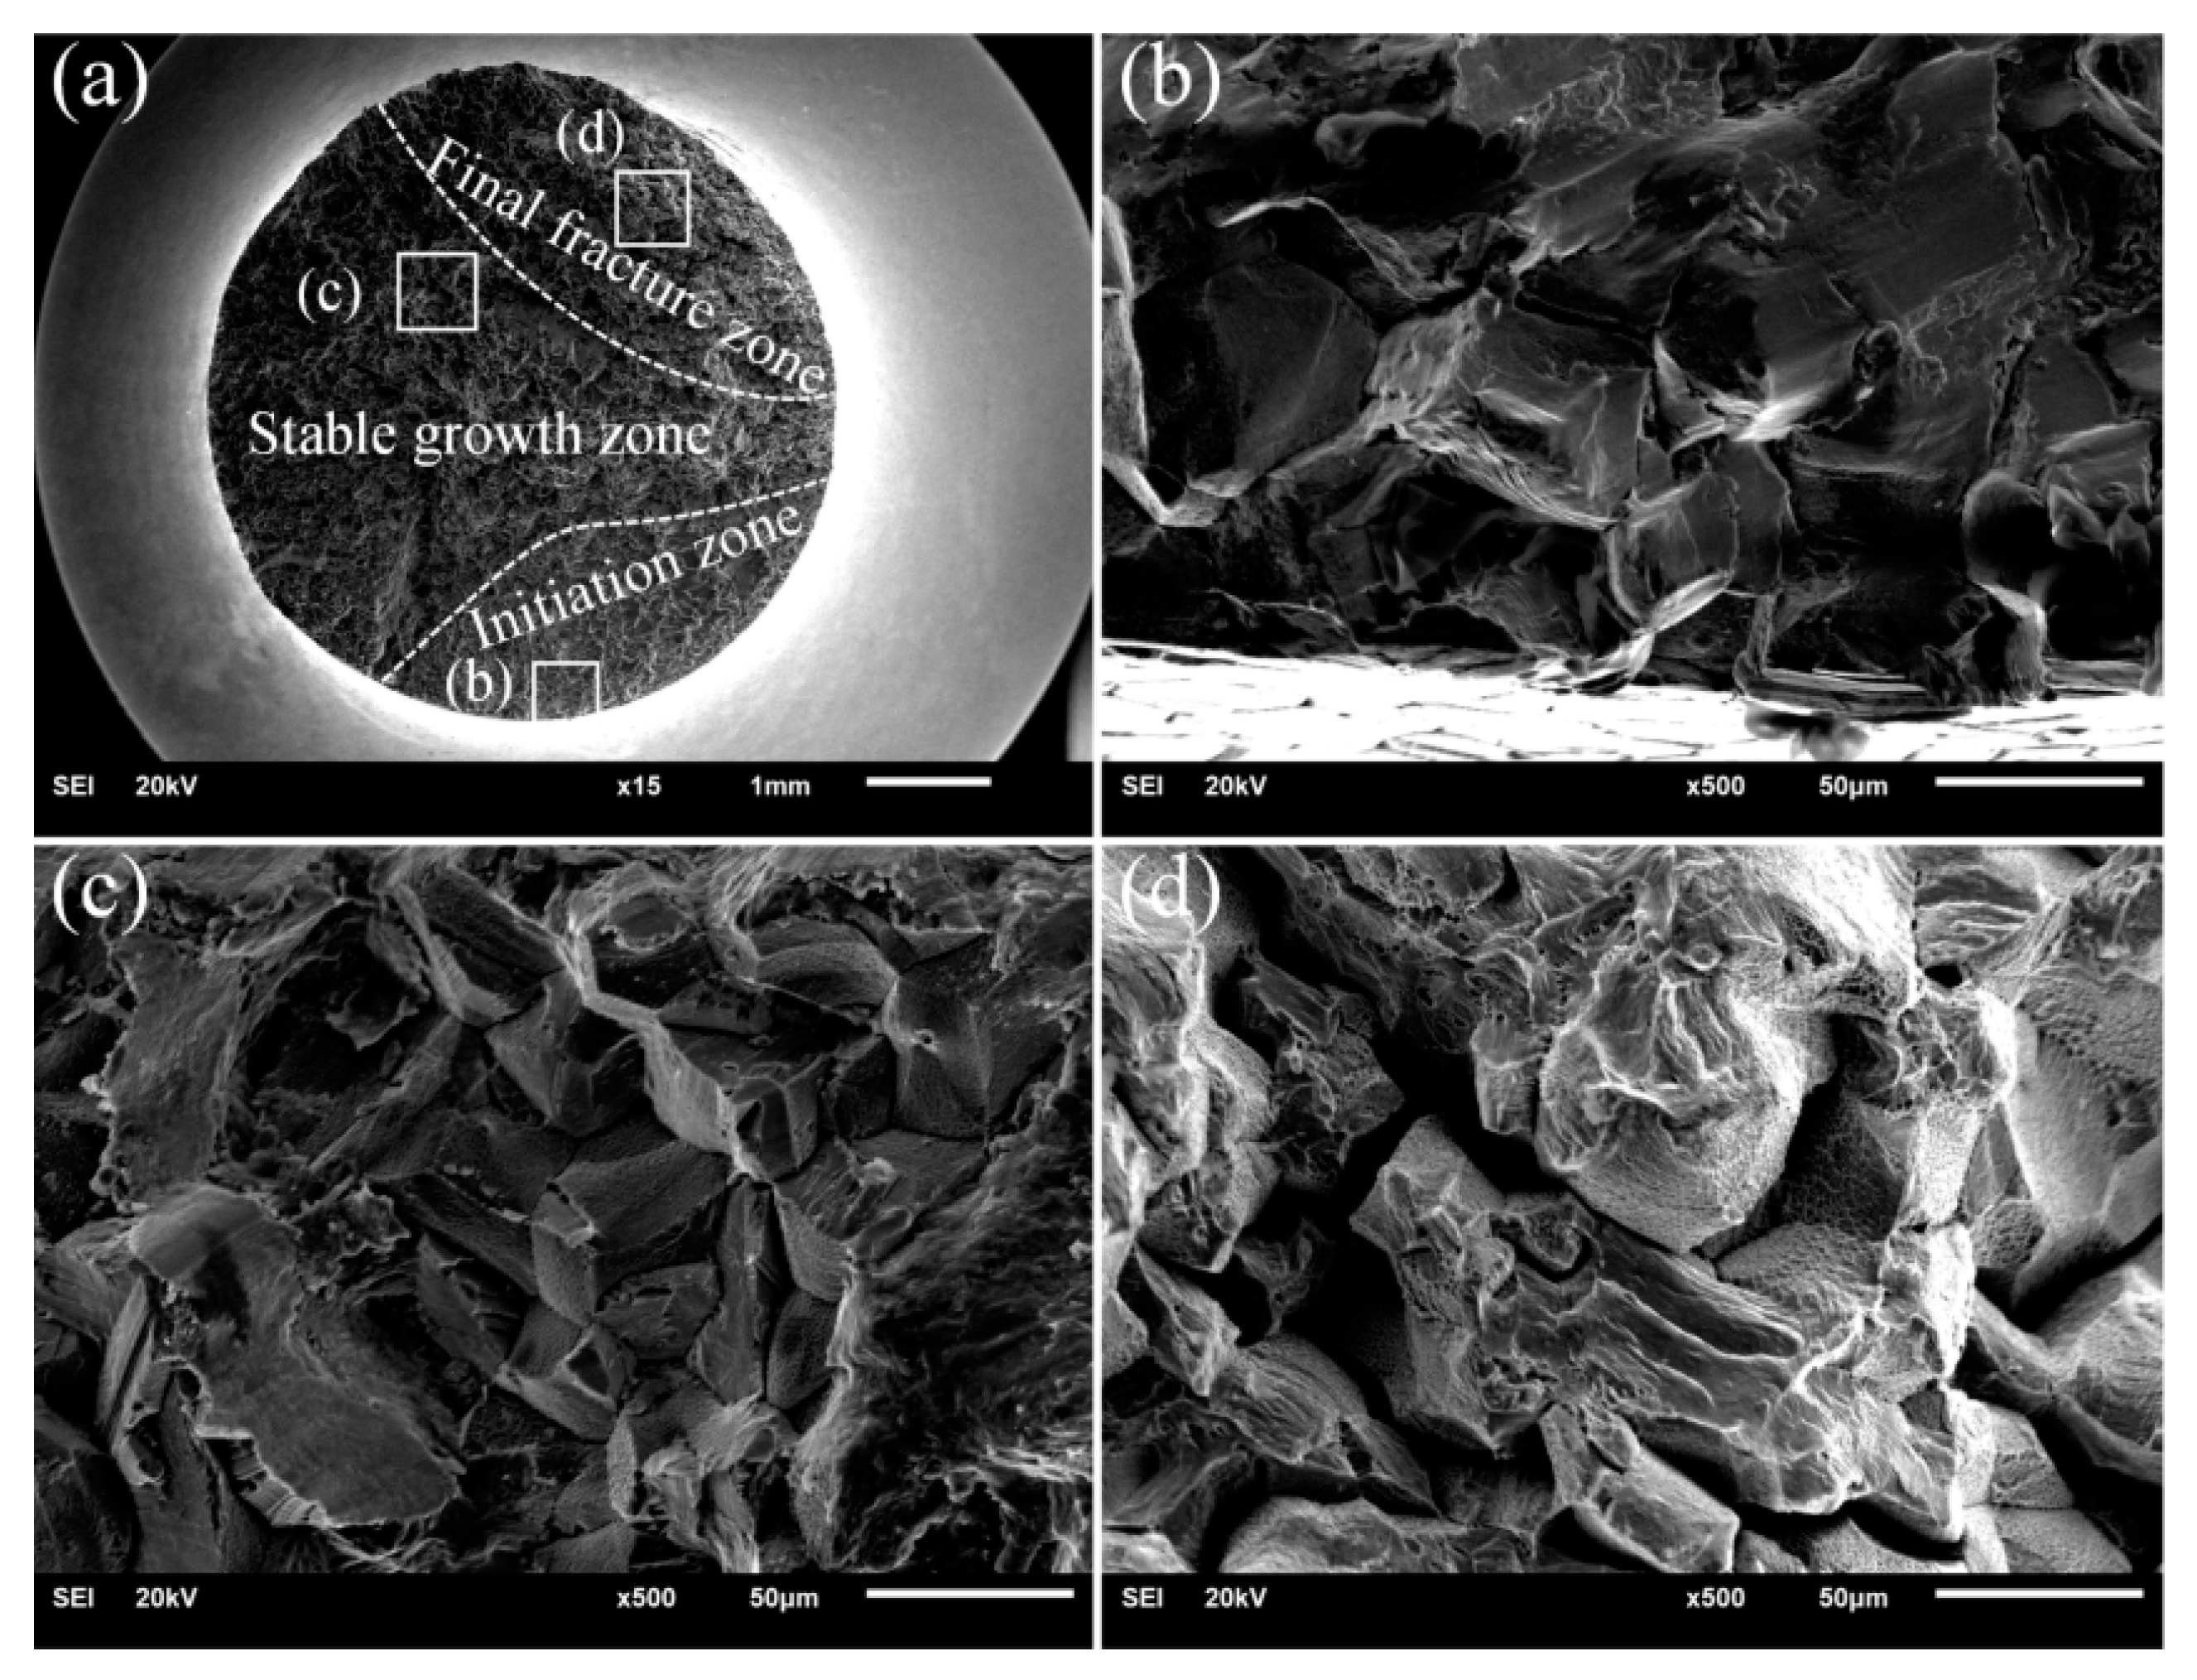
3.2. Observation of Fracture
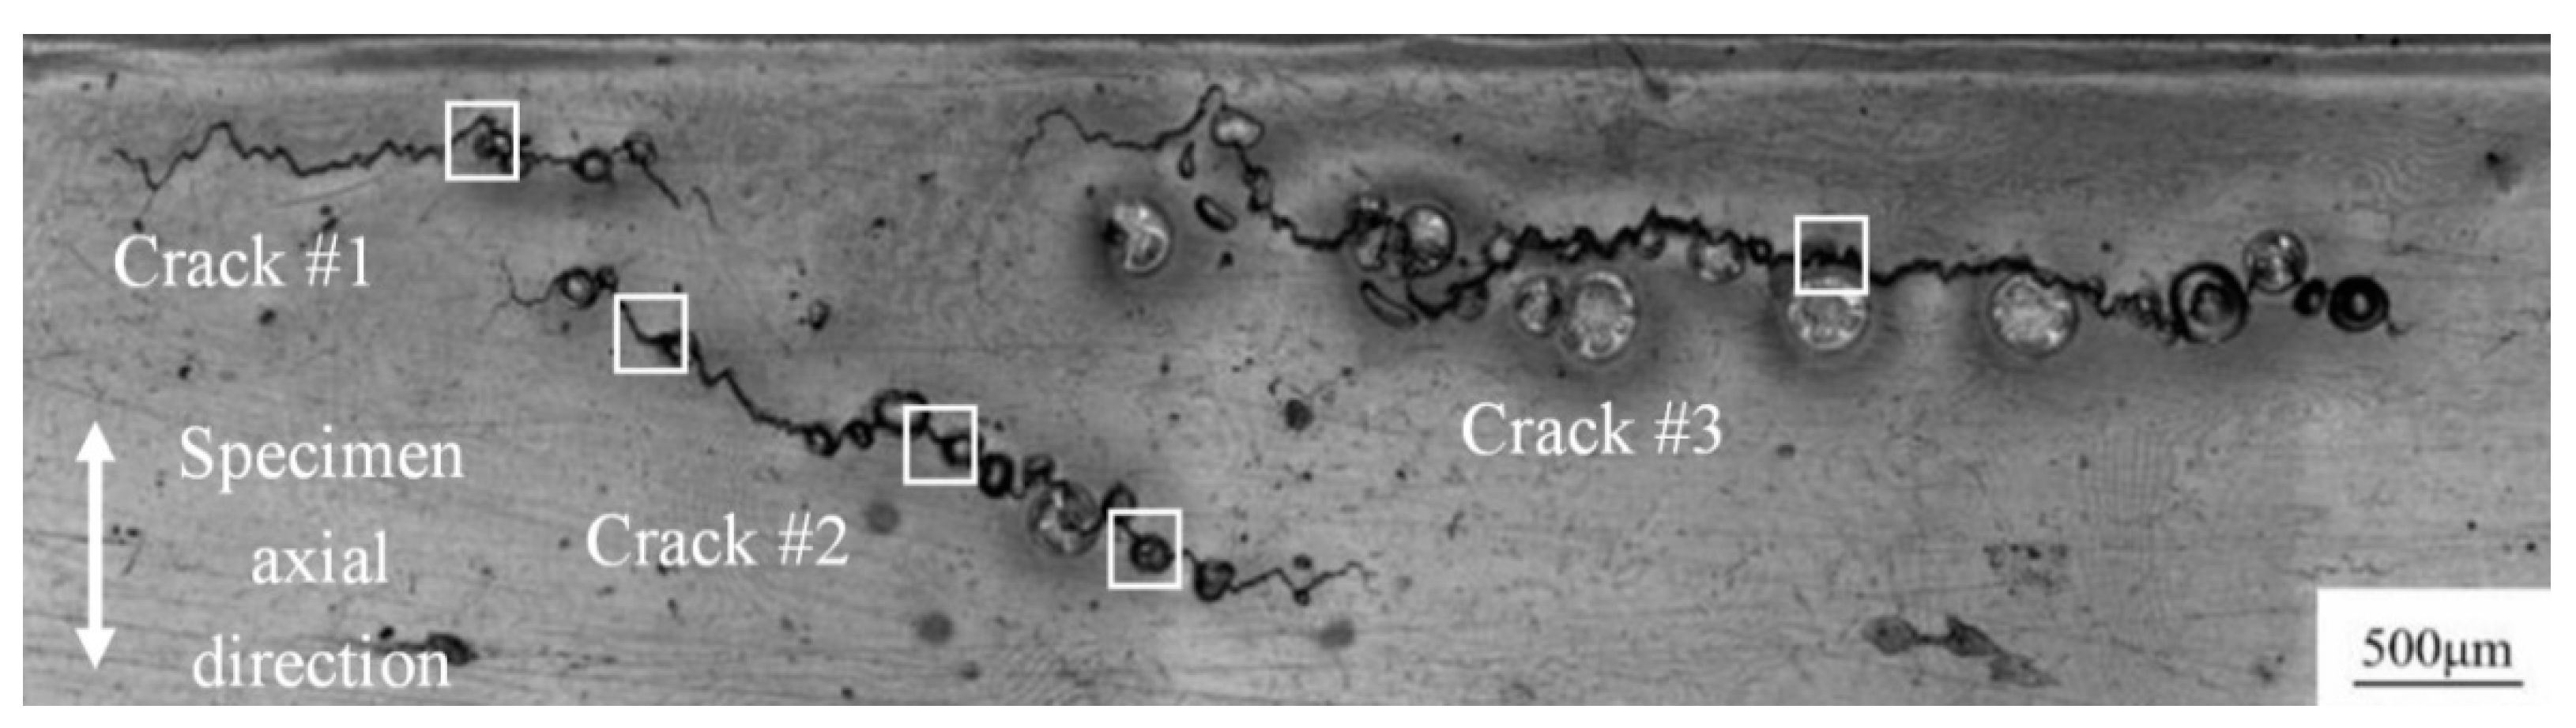
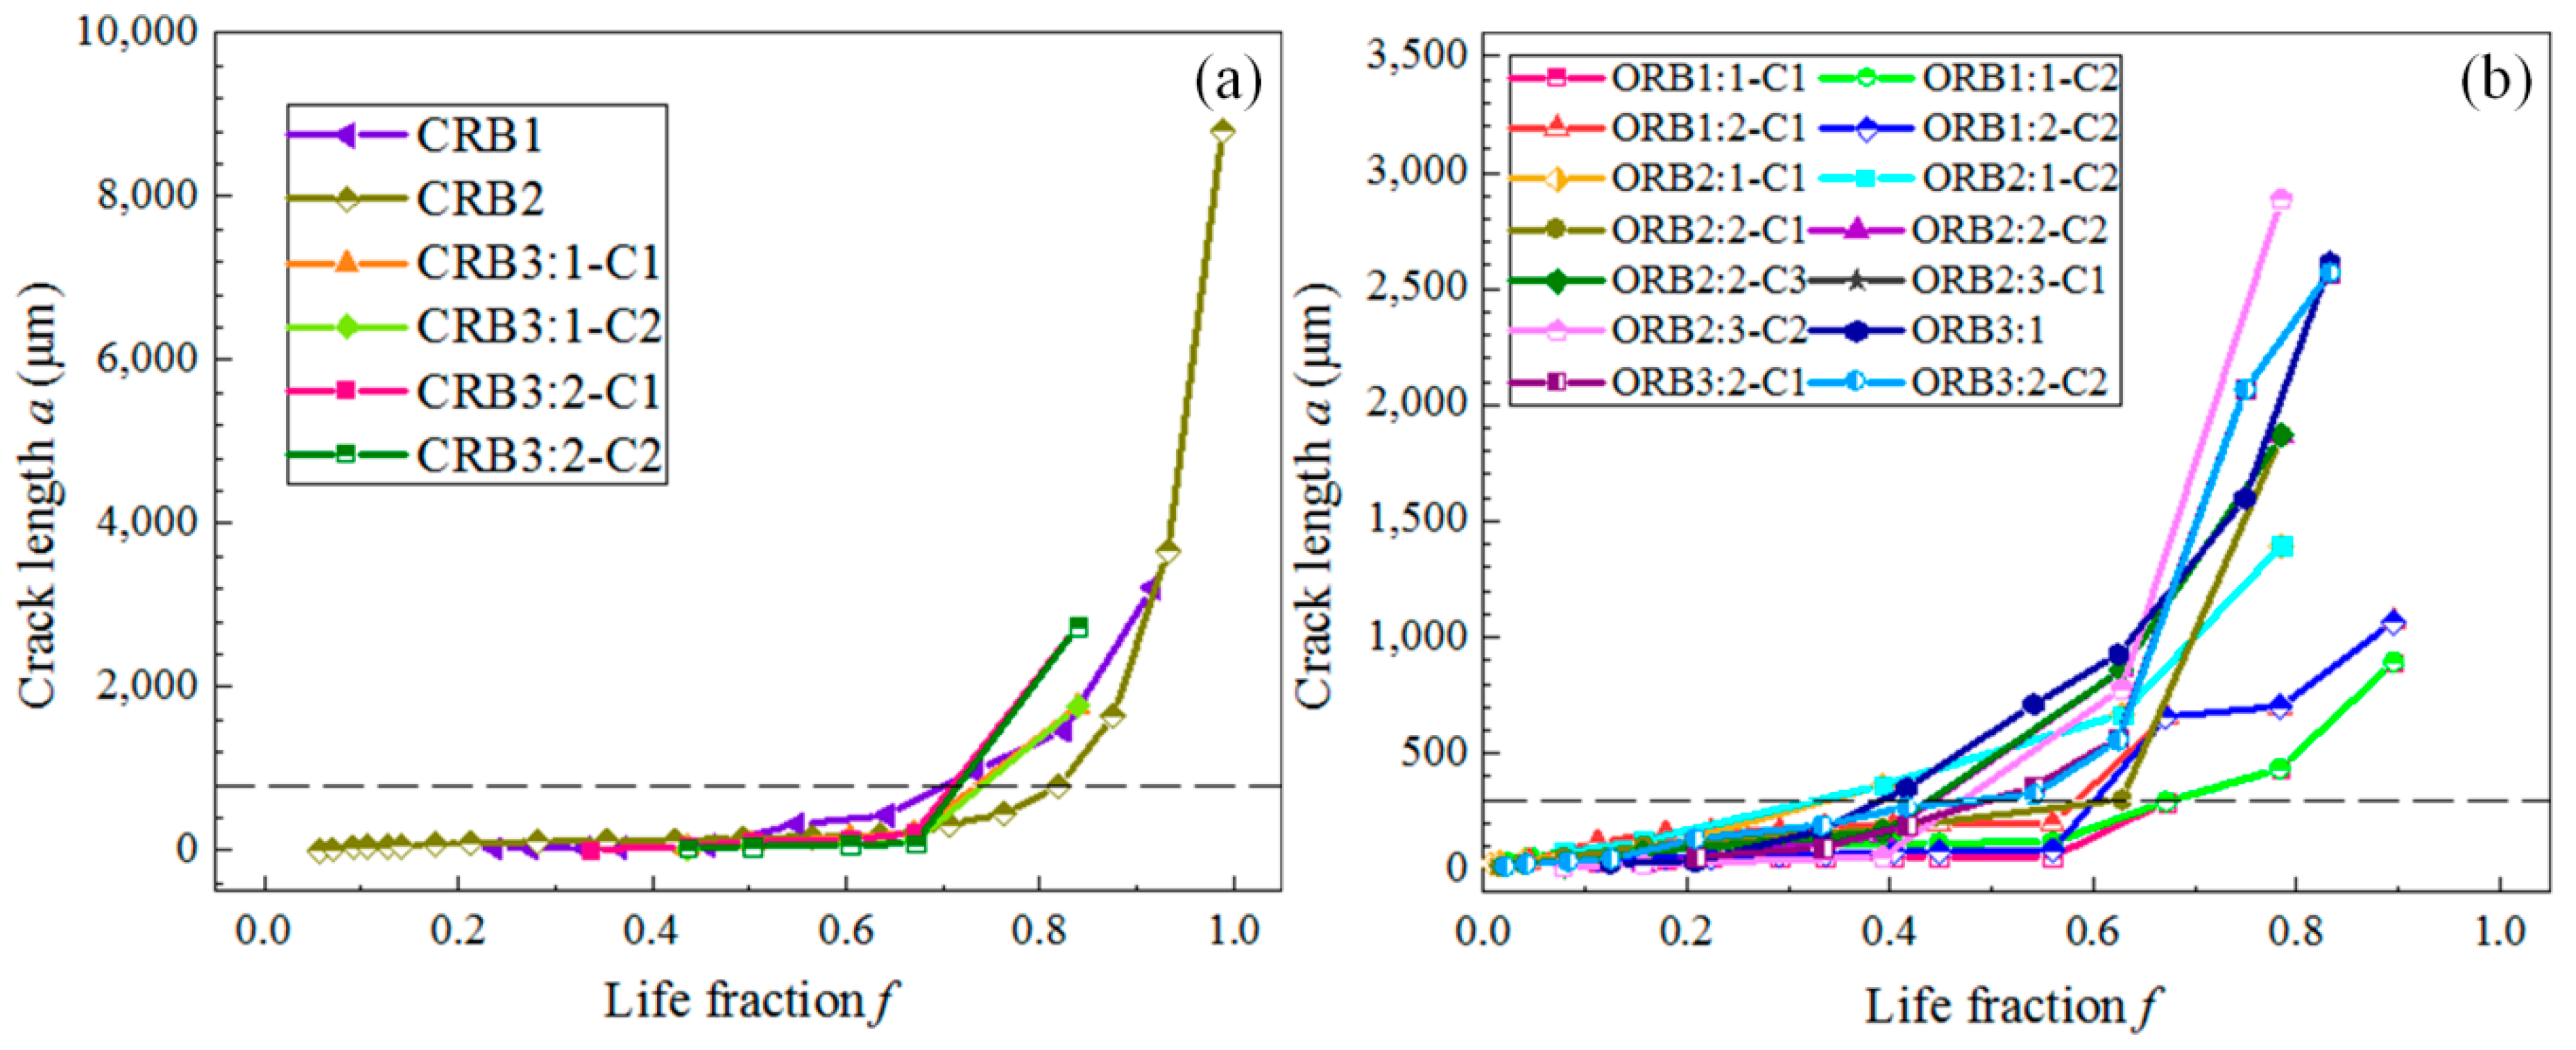
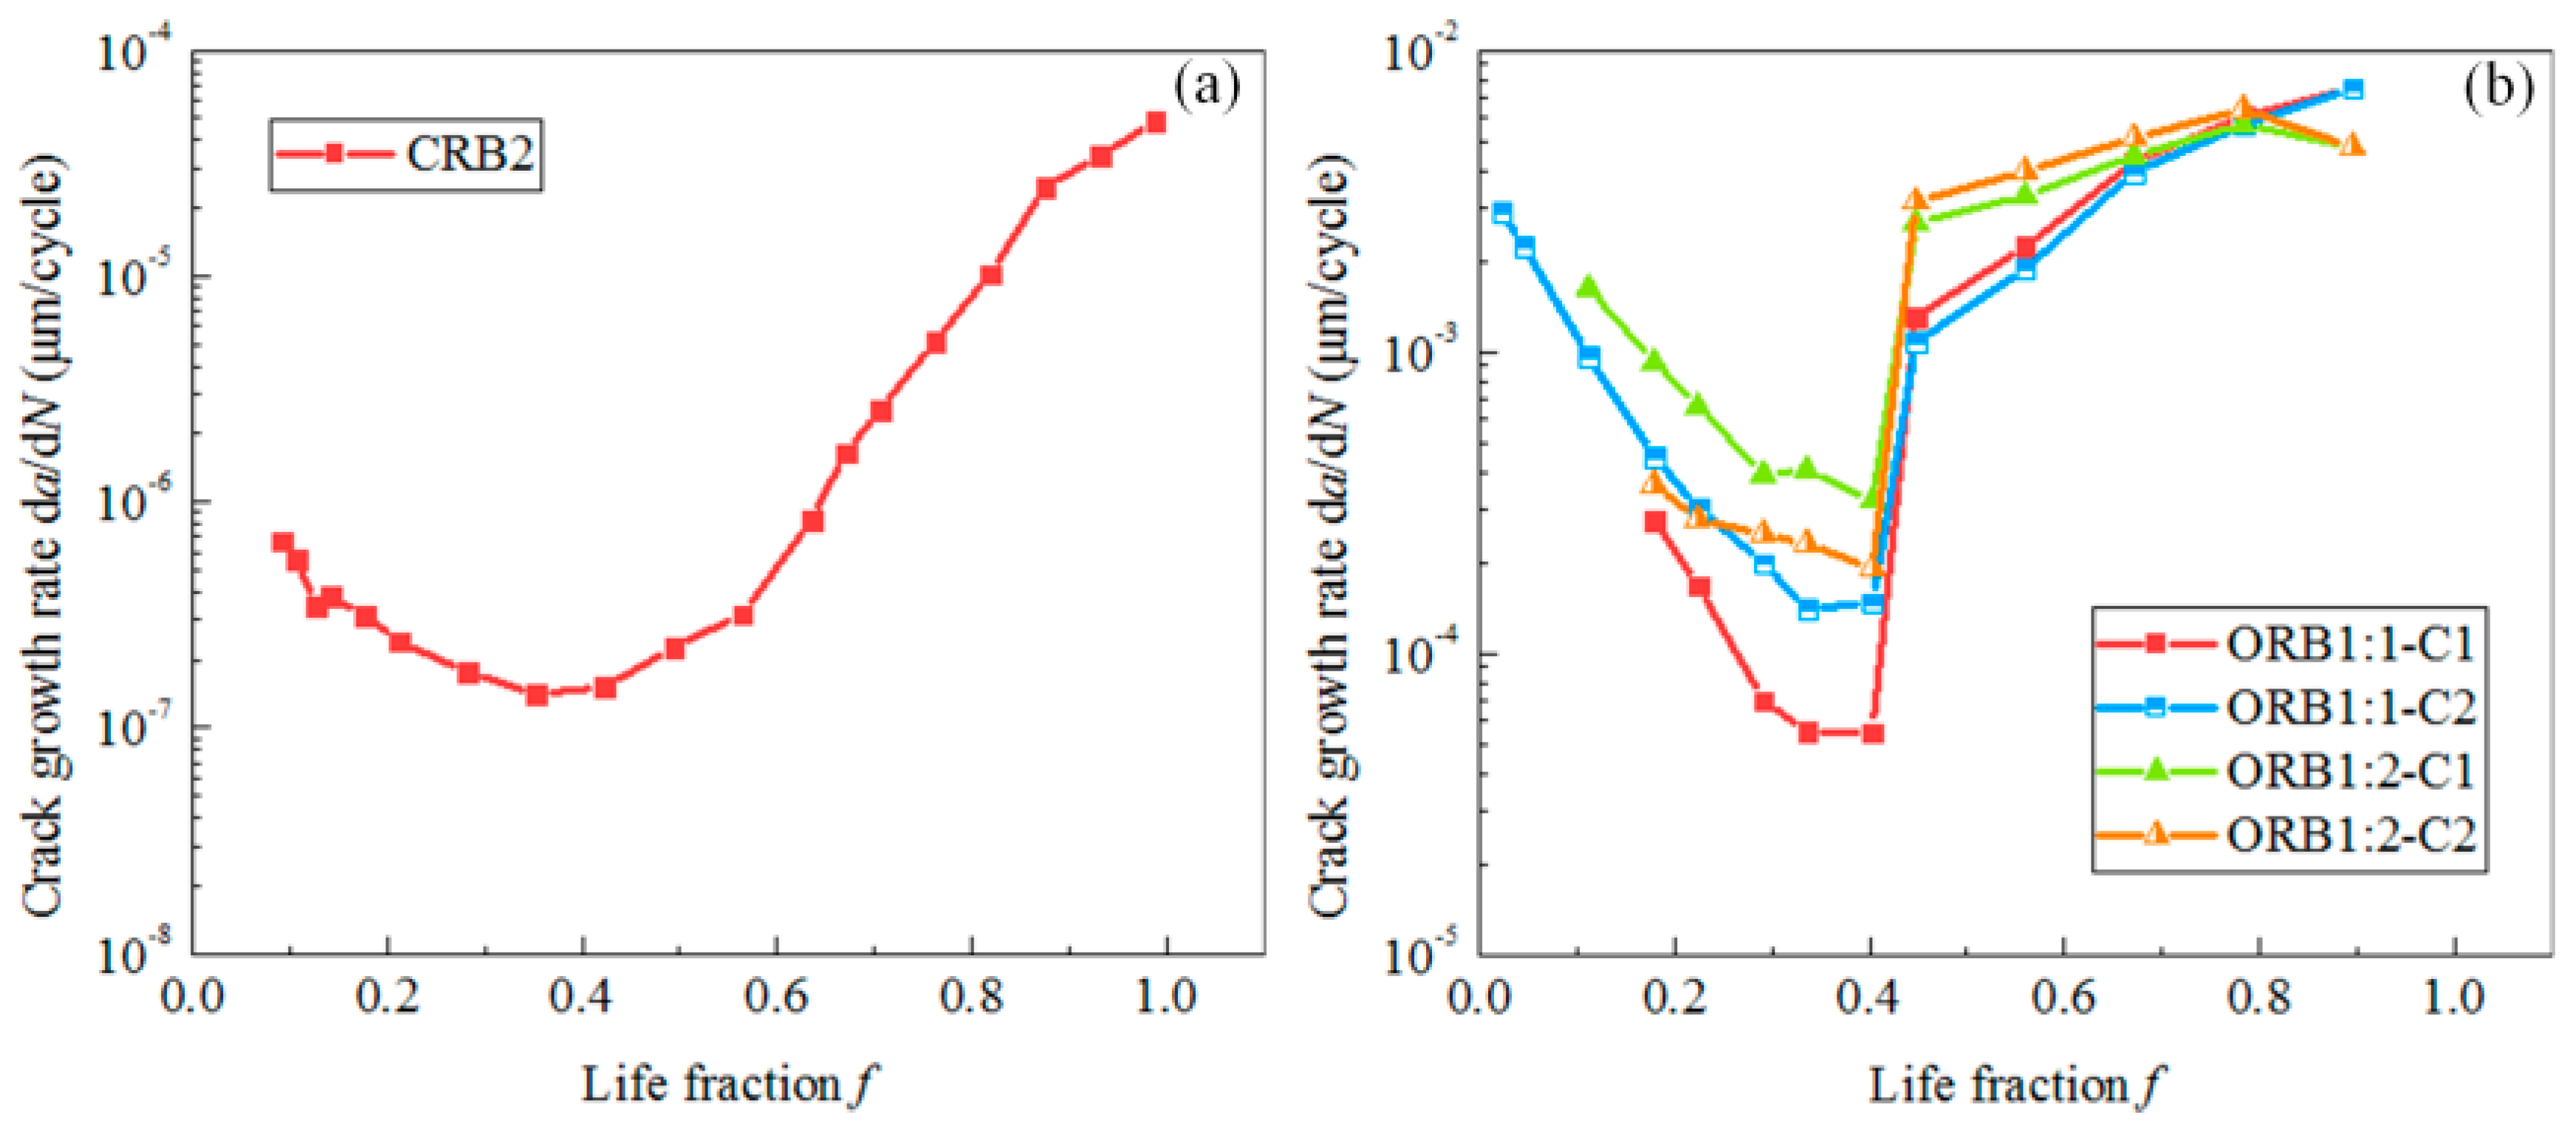
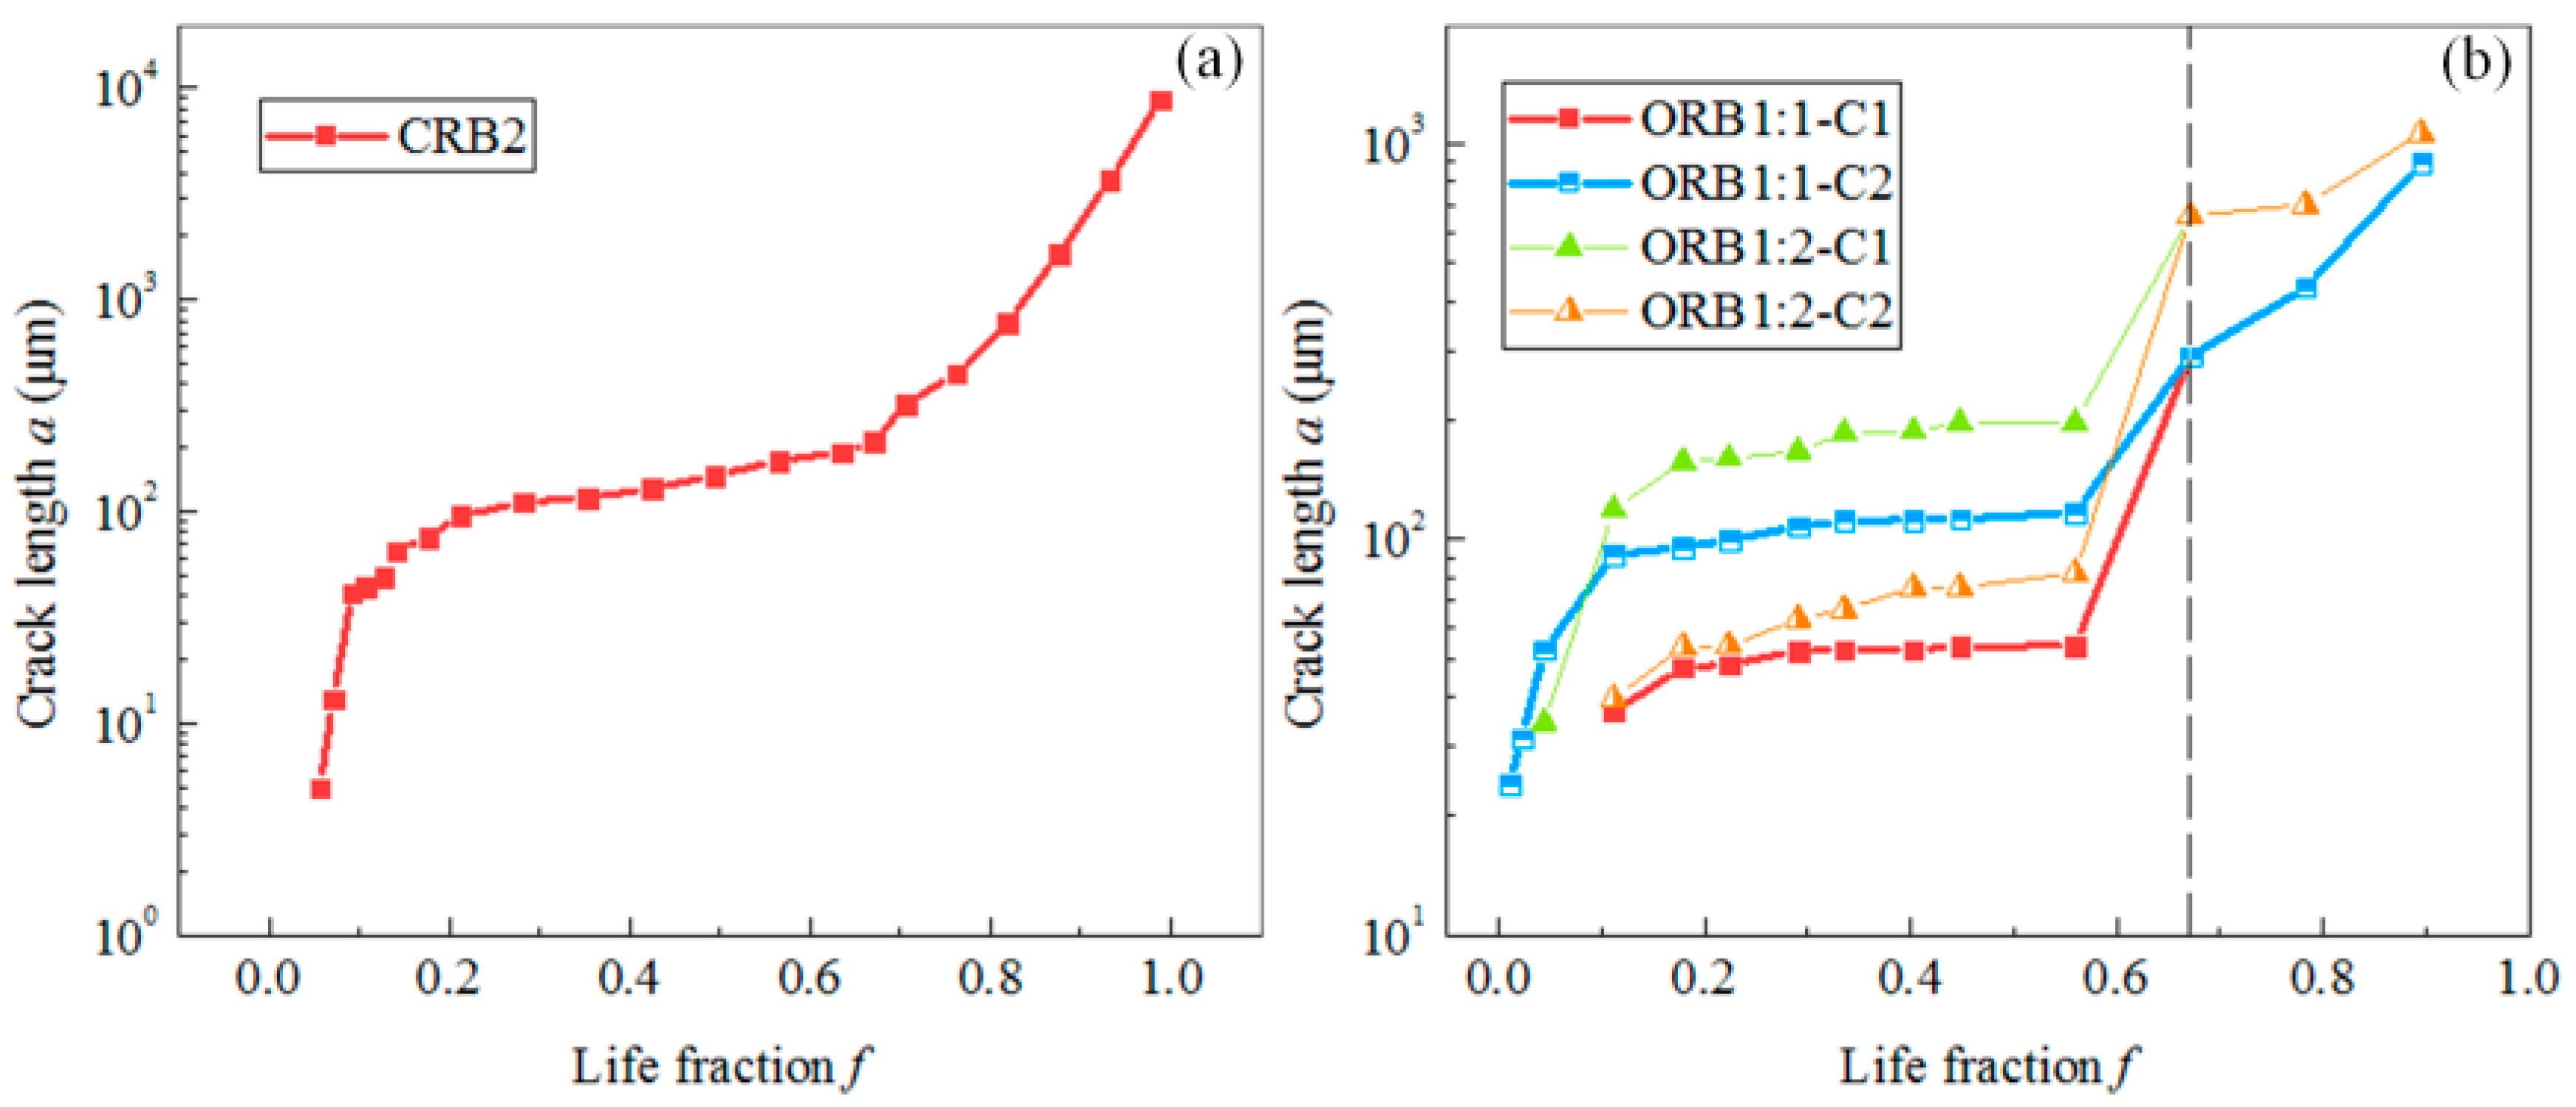
3.3. Crack Propagation Behaviors
3.4. Discussion
4. Conclusions
Author Contributions
Funding
Acknowledgments
Conflicts of Interest
References
- Lei, Q.; Li, Z.; Wang, J.; Xie, J.; Chen, X.; Li, S.; Gao, Y.; Li, L. Hot working behavior of a super high strength Cu–Ni–Si alloy. Mater. Des. 2013, 51, 1104–1109. [Google Scholar] [CrossRef]
- Lei, Q.; Xiao, Z.; Hu, W.; Derby, B.; Li, Z. Phase transformation behaviors and properties of a high strength Cu-Ni-Si alloy. Mater. Sci. Eng. A 2017, 697, 37–47. [Google Scholar] [CrossRef]
- Jia, L.; Lin, X.; Xie, H.; Lu, Z.L.; Wang, X. Abnormal improvement on electrical conductivity of Cu–Ni–Si alloys resulting from semi-solid isothermal treatment. Mater. Lett. 2012, 77, 107–109. [Google Scholar] [CrossRef]
- Lei, Q.; Li, Z.; Han, L.; Xiao, Z.; Xiao, T. Effect of Aging Time on the Corrosion Behavior of a Cu–Ni–Si Alloy in 3.5 wt% NaCl Solution. Corrosion 2016, 72, 615–627. [Google Scholar] [CrossRef]
- Wang, H.Q.; Wu, M.Z.; Zhang, J.W.; Lu, L.T. On the effect of precooling deformation on fatigue performance and failure behavior of Cu-Ni-Si alloy. J. Exp. Mech. 2018, 33, 877–884. [Google Scholar]
- Huang, F.; Ma, J.; Ning, H.; Cao, Y.; Geng, Z. Precipitation in Cu–Ni–Si–Zn alloy for lead frame. Mater. Lett. 2003, 57, 2135–2139. [Google Scholar] [CrossRef]
- Yang, B.; Wu, M.; Li, X.; Zhang, J.; Wang, H. Effects of cold working and corrosion on fatigue properties and fracture behaviors of precipitate strengthened Cu-Ni-Si alloy. Int. J. Fatigue 2018, 116, 118–127. [Google Scholar] [CrossRef]
- Hui, Z.; Xiaohui, X.; Guangfeng, Q.; Hongyan, X.; Hongmei, L. Analysis of fatigue life of catenary dropper for high-speed railway. Eng. J. Wuhan Univ. 2019, 4, 11. [Google Scholar]
- Zhao, G.H. Analysis on Problems Existed on Integral Droppers of Overhead Contact System for High Speed Railway and Their Counter-measures. Electr. Railw. 2017, 28, 14–18. [Google Scholar]
- Gholami, M.; Veselý, J.; Altenberger, I.; Kuhn, H.A.; Wollmann, M.; Janecek, M.; Wagner, L. Influence of grain size and precipitation hardening on high cycle fatigue performance of CuNiSi alloys. Mater. Sci. Eng. A 2017, 684, 524–533. [Google Scholar] [CrossRef]
- Goto, M.; Iwamura, T.; Han, S.Z.; Kim, S.; Yamamoto, T.; Lim, S.; Ahn, J.H.; Kitamura, J.; Lee, J. Fatigue crack initiation and propagation behaviors of solution-treated and air-cooled Cu-6Ni-1.5Si alloy strengthened by precipitation hardening. Int. J. Fatigue 2019, 123, 135–143. [Google Scholar] [CrossRef]
- Goto, M.; Han, S.Z.; Lim, S.; Kitamura, J.; Fujimura, T.; Ahn, J.H.; Yamamoto, T.; Kim, S.; Lee, J. Role of microstructure on initiation and propagation of fatigue cracks in precipitate strengthened Cu–Ni–Si alloy. Int. J. Fatigue 2016, 87, 15–21. [Google Scholar] [CrossRef]
- Gholami, M.; Veselý, J.; Altenberger, I.; Kuhn, H.A.; Janecek, M.; Wollmann, M.; Wagner, L.; Kermanshahi, M.G. Effects of microstructure on mechanical properties of CuNiSi alloys. J. Alloys Compd. 2017, 696, 201–212. [Google Scholar] [CrossRef]
- Goto, M.; Yamamoto, T.; Han, S.Z.; Lim, S.; Kim, S.; Iwamura, T.; Kitamura, J.; Ahn, J.H.; Yakushiji, T.; Lee, J. Microstructure-dependent fatigue behavior of aged Cu-6Ni-1.5Si alloy with discontinuous/cellular precipitates. Mater. Sci. Eng. A 2019, 747, 63–72. [Google Scholar] [CrossRef]
- Zhang, J.; Li, X.; Yang, B.; Wang, H.; Zhang, J. Effect of micro-shot peening on fatigue properties of precipitate strengthened Cu-Ni-Si alloy in air and in salt atmosphere. Surf. Coat. Technol. 2019, 359, 16–23. [Google Scholar] [CrossRef]
- Yang, B.; Li, Y.; Qin, Y.; Zhang, J.; Feng, B.; Liao, Z.; Xiao, S.; Yang, G.; Zhu, T. Fatigue Crack Growth Behaviour of Precipitate-Strengthened CuNi2Si Alloy under Different Loading Modes. Materials 2020, 13, 2228. [Google Scholar] [CrossRef]
- Wu, Y.; Bao, R. Fatigue crack tip strain evolution and crack growth prediction under single overload in laser melting deposited Ti-6.5Al-3.5Mo-1.5Zr-0.3Si titanium alloy. Int. J. Fatigue 2018, 116, 462–472. [Google Scholar] [CrossRef]
- Bai, S.; Sha, Y.; Zhang, J. The effect of compression loading on fatigue crack propagation after a single tensile overload at negative stress ratios. Int. J. Fatigue 2018, 110, 162–171. [Google Scholar] [CrossRef]
- Borrego, L.F.; Costa, J.M.; Ferreira, J.M. Fatigue crack growth in thin aluminium alloy sheets under loading sequences with periodic overloads. Thin Walled Struct. 2005, 43, 772–788. [Google Scholar] [CrossRef]
- Dalaei, K.; Karlsson, B. Influence of overloading on fatigue durability and stability of residual stresses in shot peened normalized steel. Mater. Sci. Eng. A 2011, 528, 7323–7330. [Google Scholar] [CrossRef]
- Saalfeld, S.; Scholtes, B.; Niendorf, T. On the influence of overloads on the fatigue performance of deep rolled steel SAE 1045. Int. J. Fatigue 2019, 126, 221–230. [Google Scholar] [CrossRef]
- Purnowidodo, A.; Makabe, C. The crack growth behavior after overloading on rotating bending fatigue. Eng. Fail. Anal. 2009, 16, 2245–2254. [Google Scholar] [CrossRef]
- Yang, B.; Zhao, Y. Experimental research on dominant effective short fatigue crack behavior for railway LZ50 axle steel. Int. J. Fatigue 2012, 35, 71–78. [Google Scholar] [CrossRef]
- Jordon, J.; Bernard, J.; Newman, J.C. Quantifying microstructurally small fatigue crack growth in an aluminum alloy using a silicon-rubber replica method. Int. J. Fatigue 2012, 36, 206–210. [Google Scholar] [CrossRef]
- Jia, F.Y.; Huo, L.X.; Zhang, Y.F.; Jing, H.Y.; Yang, X.Q.; Wang, D.P. Comparison with two data processing methods on fatigue crack growth rate. J. Mech. Strength 2003, 25, 568–571. [Google Scholar]
- Hansson, P. Crack growth rates for short fatigue cracks simulated using a discrete dislocation technique. Int. J. Fatigue 2009, 31, 1346–1355. [Google Scholar] [CrossRef]
- Christina, B.; Solveig, M. Growth of a short fatigue crack–A long term simulation using a dislocation technique. Int. J. Solids Struct. 2009, 46, 1196–1204. [Google Scholar]


| Specimen Types | Number | Fatigue Life (Cycles) | Average Life (Cycles) |
|---|---|---|---|
| Constant load specimens | CRB1 | 545,880 | 790,303 |
| CRB2 | 1,416,570 | ||
| CRB3 | 298,040 | ||
| CRB4 (etched) | 900,720 | ||
| Overload specimens | ORB1 | 446,630 | 248,323 |
| ORB2 | 127,380 | ||
| ORB3 | 240,220 | ||
| ORB4 (etched) | 179,060 |
| Cycles N | Life Fraction f | #1 | #2 | #3 | ||||
|---|---|---|---|---|---|---|---|---|
| 1-C1 | 1-C2 | 2-C1 | 2-C2 | 2-C3 | 3-C1 | 3-C2 | ||
| 1000 | 0.0079 | 23.0 | - | - | - | - | - | - |
| 2000 | 0.0157 | 31.2 | - | 12.4 | - | - | - | - |
| 5000 | 0.0393 | 37.9 | - | 24.7 | - | - | - | - |
| 10,000 | 0.0785 | 57.0 | 72.2 | 51.0 | - | 15.8 | - | 9.8 |
| 20,000 | 0.1570 | 75.8 | 122.7 | 101.2 | 17.1 | 74.1 | - | 20.4 |
| 50,000 | 0.3925 | 363.4 | 174.3 | 146.1 | 159.3 | 55.3 | 55.3 | |
| 80,000 | 0.6280 | 667.5 | 299.6 | 858.7 | 779.1 | |||
| 100,000 | 0.7851 | 1393.0 | 1868.1 | 2885.1 | ||||
© 2020 by the authors. Licensee MDPI, Basel, Switzerland. This article is an open access article distributed under the terms and conditions of the Creative Commons Attribution (CC BY) license (http://creativecommons.org/licenses/by/4.0/).
Share and Cite
Qin, Y.; Yang, B.; Feng, B.; Li, Y.; Xiao, S.; Yang, G.; Zhu, T. Effect of Periodic Overloads on Short Fatigue Crack Behavior in CuNi2Si Alloy under Rotating Bending Load. Metals 2020, 10, 1267. https://doi.org/10.3390/met10091267
Qin Y, Yang B, Feng B, Li Y, Xiao S, Yang G, Zhu T. Effect of Periodic Overloads on Short Fatigue Crack Behavior in CuNi2Si Alloy under Rotating Bending Load. Metals. 2020; 10(9):1267. https://doi.org/10.3390/met10091267
Chicago/Turabian StyleQin, Yahang, Bing Yang, Bo Feng, Yifan Li, Shoune Xiao, Guangwu Yang, and Tao Zhu. 2020. "Effect of Periodic Overloads on Short Fatigue Crack Behavior in CuNi2Si Alloy under Rotating Bending Load" Metals 10, no. 9: 1267. https://doi.org/10.3390/met10091267
APA StyleQin, Y., Yang, B., Feng, B., Li, Y., Xiao, S., Yang, G., & Zhu, T. (2020). Effect of Periodic Overloads on Short Fatigue Crack Behavior in CuNi2Si Alloy under Rotating Bending Load. Metals, 10(9), 1267. https://doi.org/10.3390/met10091267