Abstract
The in-plane biaxial specimen can well reflect the complex stress state of sheet metal. However, there is no standard for small-sized specimens used in the low-power biaxial fatigue testing machine. The main goal of this paper is to apply the finite element method and orthogonal experiment method to design the cruciform specimen, considering the influence of three main parameters including the diameter of the central semispherical thinning area, the minimum thickness of the center and the arm thickness of the specimen. According to the central strain dispersion coefficient and the strain concentration coefficient proposed in this paper, we ensured that the distribution of strain in the gauge area is uniform and the strain it at its maximum value at the same time. The optimized specimen is verified by a biaxial fatigue test with the digital image correlation (DIC) technique. It is found that the fatigue crack appears in the center region, which proves that the optimized specimen can be effectively used for biaxial fatigue test.
1. Introduction
In engineering applications, sheet metal is often in the complex stress state under biaxial or multiaxial cyclic loading, so it is not enough to study the mechanical properties of materials under uniaxial load. In the traditional tensile test, it is implied that the constitutive equation under uniaxial stress state is the same as that under complex stress state. However, this assumption has been proved by many scholars to be inconsistent with the real stress condition. The stress state of a metal plate under plane condition is usually biaxial stress or multiaxial stress. Once there are cracks or defects appearing in the structure, there will be a complex stress field around the defects. Generally, the thin-walled tubular and round bar specimens subjecting to axial or torsional loads are commonly used in the tests, which is not suitable for rolled plates [1]. Therefore, it is very important to study the in-plane biaxial fatigue life with the cruciform specimen, and the design of the cruciform specimen is the key to the success of this kind of test [2].
In recent years, many types of cruciform specimens have been introduced to study the biaxial quasi-static tensile or fatigue behavior of metallic materials [3,4,5,6,7]. The cruciform specimen proposed by Kuwabara [8] was used in biaxial tensile test international standard ISO 16842: 2014 (E) [9]. The design of filleting between arms and slotting in arms can be used to study the tensile yield behavior of materials. However, due to the low central strain level of the specimen, it is difficult to achieve necking or fracture state. Besides, if the strength at the slitted arm is lower than that of the central region, it will fracture prematurely at the slitted area under fatigue load. Thus, it is not applicable to the biaxial fatigue test. To overcome this shortcoming, solutions of thickness reduction and fillet design have been reported. Yuan et al. [10] and Seymen et al. [11] respectively adopted the central semispherical thinning and annular thinning design, which can dramatically improve the central plastic deformation limit without increasing notable shear stress. Yu et al. [12] studied the complex strain path of biaxial loading with the optimization design of two-step thickness reduction in the central area of the cruciform specimen. Baptista et al. [13] used direct multiple search (DMS) method to optimize multiple variables to obtain the best geometry for cross shaped specimen. The results show that the center reduced thickness value is the main variable affecting its stress level, and a smaller thickness will produce a larger center stress. Ebrahim et al. [14] found that the transition curve between the two arms of the cruciform specimen has a great influence on the strain distribution of the loading arm. Zhao et al. [15] used ABAQUS finite element software to compare and analyze three kinds of cruciform specimens with different inter arm filleting, and found that the central region of specimens with “line-arc-line” fillet can produce greater plastic strain. So far, previous works have been focused on the design of specimens with different shapes and sizes for high-power biaxial fatigue testing machine [15,16,17,18], which are not applicable to the in-situ biaxial testing machine (rated load 5 KN) used in this paper.
In this paper, the optimal design of a cruciform specimen for low-power biaxial testing machine is carried out. The orthogonal experiment design method is used to study the influence of several specimen parameters on the two objective functions, which are the strain dispersion coefficient and the strain concentration coefficient proposed in this paper. Considering the stress and strain field comprehensively, higher stress level and better stress uniformity are obtained in the central region. Through biaxial tensile and fatigue tests with the optimized specimens, combined with the digital image correlation (DIC) strain measurement method, the validity of the finite element simulation results is verified, and the goal that the fatigue failure occurs in the center of the specimen is achieved.
2. Optimization of Small Cruciform Fatigue Specimen
2.1. Design Criteria
The key part of a biaxial fatigue test is the cruciform specimen, and the design process of cruciform specimen should adhere to the following criteria [19,20,21]:
- (a)
- The stress and strain distribution in the central gauge area are uniform.
- (b)
- The stress concentration in the non-gauge area is as small as possible.
- (c)
- For the fatigue test, the fatigue failure should occur in the gauge area.
- (d)
- The test should be repeatable.
2.2. Basic Shape of Cruciform Specimen
Referring to the specimens shown in references [15,22,23] and combining this information with the characteristics of the existing biaxial testing machine fixtures in the laboratory, the basic shape of the cruciform specimen in this paper is determined, the overall dimensions are 100 mm × 100 mm, the arm width is 20 mm, as shown in Figure 1. The overall thickness of the specimen is the same, and the central area is not thinned. The transition fillet is composed of a segment of arc and two straight lines.
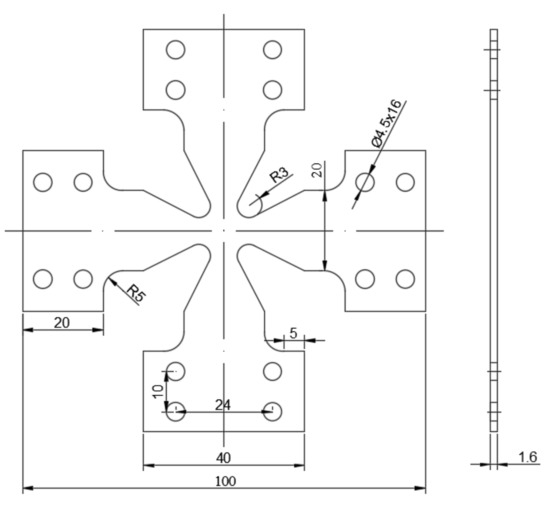
Figure 1.
Dimensions of basic cruciform specimen (unit: mm).
2.3. Finite Element Simulation
The cruciform specimen used in this test belongs to double symmetry plane geometry, and the 1/4 model is established by ANSYS 16.0 (ANSYS Inc., Pittsburgh, PA, USA). The solid structural unit of the model is eight-node finite element, and the overall unit size is set as 0.3 mm. Figure 2 is the finite element mesh and boundary conditions, the thickness direction is divided into six layers. The test material is commercial pure titanium TA2, according to the uniaxial tensile test, the elastic modulus is 121.92 GPa, Poisson’s ratio is 0.34, yield strength is 335.27 MPa. Figure 3 shows the true stress-strain response curve of the material. The model of elastic-plastic behavior used in finite element analysis (FEA) is Multilinear Isotropic Hardening Plasticity (MISO). The in-phase equibiaxial tensile stress of 100 MPa is applied to the horizontal and vertical end faces of the two arms respectively to obtain the maximum principal plastic strain nephogram, as shown in Figure 4.
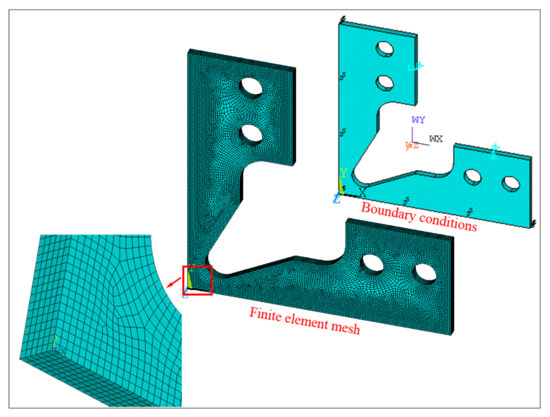
Figure 2.
Finite element mesh and boundary conditions.
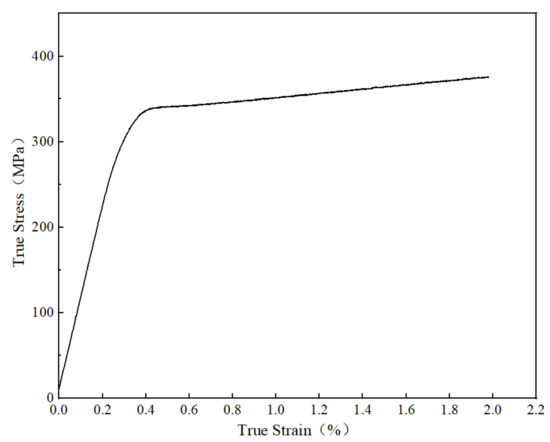
Figure 3.
True stress-strain curve of commercial pure titanium TA2.
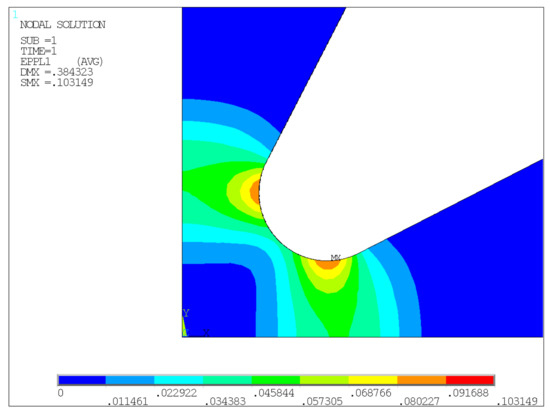
Figure 4.
Maximum principal plastic strain.
It can be seen in Figure 4 that the constant thickness of the basic specimen does not reach a high strain level in the central region, while there is a strain concentration at the fillet, which is not conducive to the fatigue failure of the specimen center. Through the design of center thinning and arm thickness reduction, the strain growth of the central region can be achieved, and the strain concentration at the fillet can be appropriately reduced. The parameters to be optimized are shown in Figure 5, i.e., the diameter of the central semispherical thinning area d, the arm thickness of the specimen t0 and the minimum thickness of the thinning area t. Spherical radius SR changes with d, t0 and t.
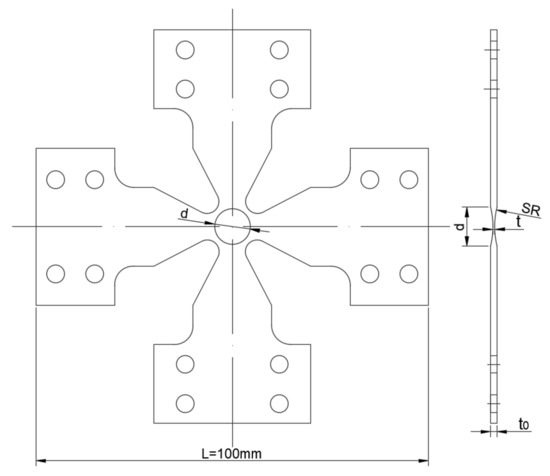
Figure 5.
Optimization parameters of specimen.
2.4. The Influence of the Diameter of the Central Thinning Area
As is known from Section 2.3, if the overall thickness of the specimen is kept the same, the strain value in the central region is relatively small, and there is a large stress concentration at the filleting of the two arms. Therefore, the central area needs to be thinned appropriately. In the literature, hemispherical thinning design is often used in the cruciform specimen for biaxial fatigue test. The advantage of this scheme is that it can increase the deformation of the central area and reduce the stress concentration at the fillet between the two arms. The hemispherical thinning mainly involves two parameters, one is the diameter of the hemispherical edge of the thinning area d, the other is the minimum thickness t of the thinning area. Firstly, the thickness of the loading arm is set as 1.2 mm, and the minimum thickness of the central thinning zone is 0.3 mm. The hemispherical edge diameter is changed from 7 mm to 10 mm, increasing by 1 mm each time. The biaxial tensile tests were simulated under different loads. The biaxial loadings are equal and in the same phase. The loading process includes 25 load steps, and the maximum load is 2000 N. The maximum principal plastic strain of the central point was extracted, as shown in Figure 6.
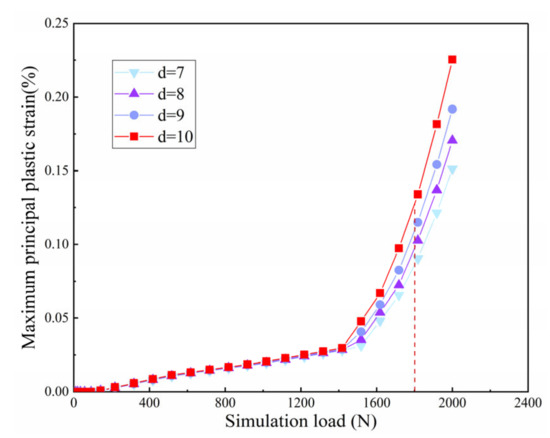
Figure 6.
Variation of maximum principal plastic strain of central point under loading.
With the increase of loading, especially after 1400 N, the maximum principal plastic strain and equivalent plastic strain of the central node show a large upward trend. The larger the center diameter, the more obvious the curve rises, and the greater the strain value under the same load. It can be seen from Figure 6 that the maximum principal plastic strain will be greatly different with various diameters, which means that the diameter of the thinning zone has a great influence on the strain of the central region.
2.5. The Influence of the Minimum Thickness of the Central Thinning Area
The minimum thickness of the central region has a certain influence on the strain concentration and strain value of the center. It can be seen from Figure 6 that when the diameter of the hemispherical thinning zone is 10 mm, the node in the central zone presents a large strain. Therefore, firstly, the center diameter is supposed to be 10 mm, and the loading arm thickness is 1.2 mm. Only the minimum thickness t of the central thinning area is changed, and the values are 0.2 mm, 0.3 mm, 0.4 mm and 0.5 mm respectively.
The simulation calculations of different thickness of the center were carried out respectively. Figure 7a shows the curve of the maximum principal plastic strain of the central node A with simulation load. It can be seen from the figure that the minimum thickness of the central zone has a great influence on the central strain level of the specimen. Under the same loading condition, the strain level increases with the decrease of the center thickness. When the central thickness is 0.4 mm and 0.5 mm, the maximum principal plastic strain in the central region is less than 0.10%. When the thickness is reduced to 0.3 mm and 0.2 mm, the strain level increases rapidly, reaching about 0.23% and 0.59% respectively.
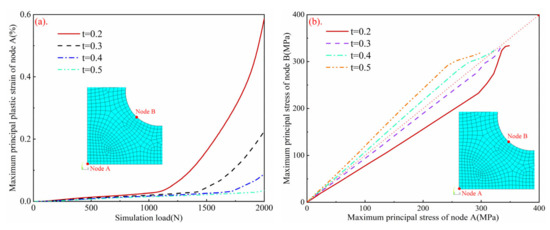
Figure 7.
(a) Variation of principal strain of central node A with simulation load; (b) Variation of principal stress of the fillet node B with principal stress of node A.
Figure 7b shows the variation curve of the stress value of node B at the fillet with the stress value of node A during the loading process. It can be seen that when the principal stress of node B is at the same value, the principal stress of central point A increases with the decrease of central thickness t. When t ≤ 0.3 mm, σB < σA, the stress concentration of central node A is large. When t ≥ 0.4 mm, σB > σA, the stress concentration of node B is greater, and the fracture will occur at the fillet, which is not reasonable. Generally speaking, the smaller the thickness of the center, the more concentrated the stress at the center relative to the fillet, which can effectively avoid the fracture of the fillet before the center due to the large stress value.
2.6. Optimization of Cruciform Specimen
2.6.1. Definition of Objective Coefficients
For the cruciform specimen, it is very important to ensure the large strain uniformity in the central gauge area and the greater stress concentration of the central region compared with the fillet. Therefore, it is necessary to define two objective coefficients as the measurement basis. A 1.2 mm × 1.2 mm square area in the center of the specimen is selected as the central strain extraction position. Here, the 1/4 model is established by finite element software, and the corresponding size is 0.6 mm × 0.6 mm. The arc length of about 1.2 mm is also selected to extract the strain at the fillet. The model is meshed using a 0.3 mm sized unit, as shown in Figure 8. There are nine nodes closest to the center and five nodes closest to the fillet. Then the central strain dispersion coefficient α is obtained:
where and represent the standard deviation and average value of the maximum principal strain of the nine nodes at the center respectively. The ratio of the two is the central strain dispersion coefficient α, which can be used to characterize the uniformity of strain distribution in the central region of the specimen. The smaller the value is, the greater the central strain uniformity is.
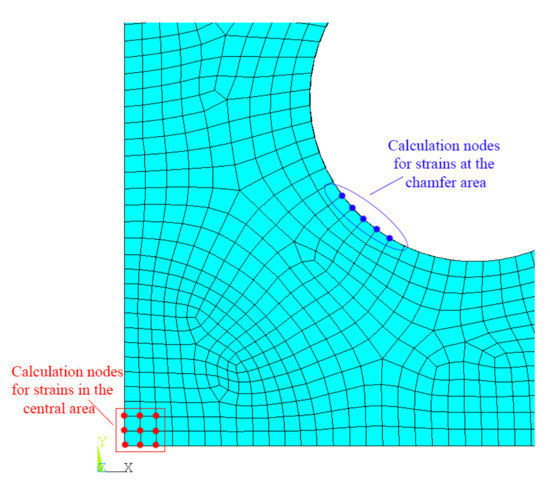
Figure 8.
Node positions of center area and fillet.
As shown in Figure 8, five nodes closest to the fillet are marked in blue and denoted by m (m = 5); nine nodes on the four elements closest to the center are marked in red and denoted by n (n = 9). Then the strain concentration coefficient β is obtained:
where the numerator represents the average value of the maximum principal strain of the nodes at the transition fillet, and the denominator represents the average value of the maximum principal strain of the nodes in the central region. The ratio of them is the strain concentration coefficient β, which can be used to characterize the strain concentration in the central region. The smaller the value is, the higher the central strain concentration is.
2.6.2. Orthogonal Design Scheme
The geometric factors to be considered in the design of cruciform specimen are the thickness of loading arm t0, the minimum thickness of central region t, and the diameter of hemispherical thinning area d. The scheme adopts three factors and four levels, the corresponding orthogonal table is L16 (43) [24]. The level of each factor is shown in Table 1.

Table 1.
Factors level.
In addition, the influence degree of various geometric factors on the two objective coefficients was calculated by the data analysis software statistica. According to the analysis of variance in Table 2, the order of the influence of each factor on the plastic strain distribution in the central region is as follows: the minimum thickness of the central region t > the thickness of loading arm t0 > the diameter of the hemispherical thinning area d.
Table 2.
Analysis of variance.
The orthogonal test table and the calculation results of objective coefficient are shown in Table 3. It contains 16 specimens with different size combinations, corresponding to 15 different ratios of center thickness to arm thickness, ranging from 0.125 to 0.5. This obviously expands the two thickness ratios (0.167 and 0.15) set in the optimization process of Baptista et al. [13], which can better reflect the relationship between these parameters and the specimen optimization geometry.
Table 3.
Results by orthogonal experiment.
It can be seen from Figure 9a that the minimum thickness t in the central region has the greatest influence on the objective coefficient, and the diameter d of the hemispherical thinning area has the least influence. When the load ratio Fx/Fy is 1:1, the combination of small strain dispersion coefficient α and strain concentration factor β is A1B1C3, that is, the specimen arm thickness is 1.6 mm, the minimum thickness of the central region is 0.2 mm, and the diameter of the hemispherical thinning area is 9 mm. The corresponding α and β are 0.1563 and 0.2776 respectively, as shown in Table 4.
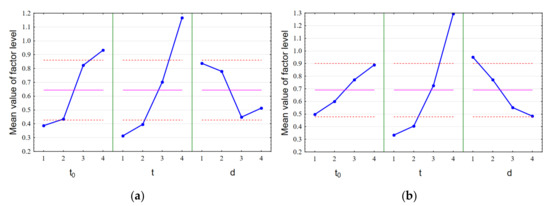
Figure 9.
Trend chart of relationship between factors and experimental indexes; (a) Load ratio 1:1, (b) Load ratio 2:1.
Table 4.
Objective coefficients of four combinations.
Considering the more complicated biaxial stress state in the experiment, the α and β of 16 groups of specimens in the orthogonal experiment table were calculated respectively when the biaxial load ratio is 2:1, as shown in Table 3. Figure 9b shows the mean value of each factor at each level, and the corresponding preferred combination is A1B1C4. It can be also seen that the minimum thickness t of the central region has the most significant impact on the results, while the arm thickness t0 and the diameter d of the central thinning area have little influence on the results, which is consistent with the conclusion in Figure 9a.
Under the load ratio of 1:1, when the arm thickness of the specimen is 1.6 mm, the central plastic strain value is only 0.2659% (as shown in Figure 10) under the simulated load of 2000 N, which is difficult to realize the large deformation and failure of the central region of the specimen. Considering that the arm thickness has little influence on the experimental indexes and the setting of the subsequent experimental scheme, the arm thickness of 1.2 mm is selected as the final size. Therefore, the optimal combination can be selected A3B1C3, which is the ninth combination in Table 3. Similarly, under the load ratio of 2:1, the optimal combination A3B1C4 obtained from the above orthogonal experiment. The strain dispersion coefficient α and strain concentration coefficient β of the above combinations are shown in Table 4 respectively. It can be seen from Table 4 and Figure 10 that the α of combination A3B1C3 and A3B1C4 is smaller than that of A1B1C3 and A1B1C4, indicating that the central strain uniformity is better, while the β is slightly larger, indicating that the central strain concentration is slightly less than the first two combinations. However, under the same 2000 N load, the combination A3B1C3 and A3B1C4 has a higher plastic strain level (0.4555% and 0.5071%, respectively), which can better meet the strain requirements of biaxial low-cycle fatigue test. For non-equibiaxial loading, A3B1C4 can meet the test requirements. Considering the subsequent fatigue tests are more based on equibiaxial loading, A3B1C3 is finally selected.
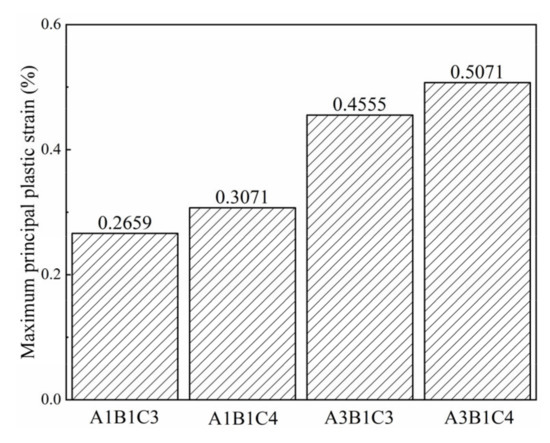
Figure 10.
Maximum principal plastic strain in the central region of four combinations.
In Figure 11, node strain distribution along the 45° diagonal path for specimen combination A3B1C3 under in-phase equibiaxial loading (Fx/Fy = 1). It is found that before the normalized distance is 0.6, the maximum principal plastic strain decreases with the increase of the distance from the center. Although the maximum principal plastic strain increases at the fillet, it is still far less than the central strain. Since the loading mode is mainly load control adopted in this paper, and most of the parameters related to fatigue life prediction are related to strain, the strain distribution in the central region of the combination meets the requirements of fatigue test. In conclusion, the optimized combination A3B1C3 is reasonable.
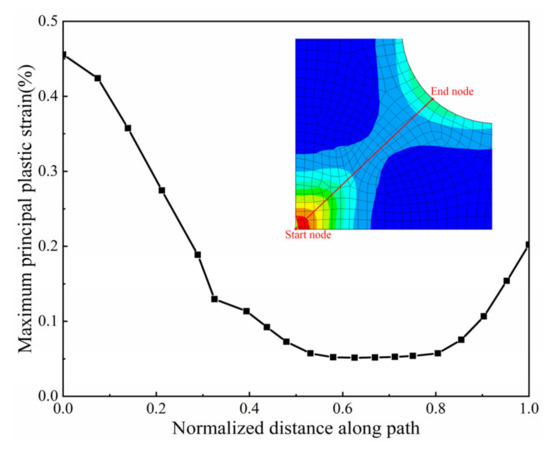
Figure 11.
Node strain distribution along the 45° diagonal path for specimen combination A3B1C3 under in-phase equibiaxial loading (Fx/Fy = 1).
For cruciform specimens, the effect of shear stress should also be considered in order to obtain a more uniform strain field in the central region. The same in-phase load of 3 KN is applied to the two axes. The shear stress distribution of the optimized sample is shown in Figure 12. The shear stress is the largest at the corner of the loading arm, and gradually decreases with the distance from the center area. Figure 13 shows the stress distribution of the nodes along the direction of the red arrow in Figure 12. It can be seen from the figure that the farther away from the center, the greater the shear stress. The shear stress at the farthest node 8 is 39 MPa, which is only about 9% of the major stress here. In the circular area with radius of 1.2 mm in the center, the shear stress has little effect on strain and the strain distribution is more uniform. Therefore, the circular range with a center diameter of 2.4 mm can be used as an effective strain measurement area.
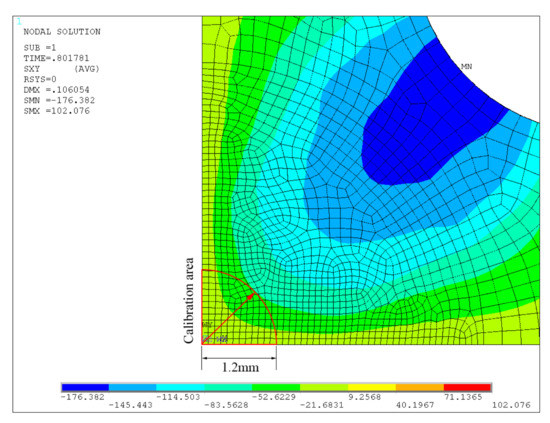
Figure 12.
Distribution of shear stress.
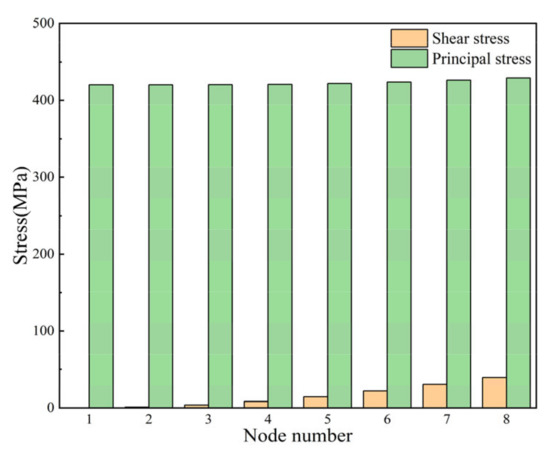
Figure 13.
Stress distribution in strain measurement area.
Therefore, through orthogonal experiment and finite element simulation calculation, the size of cruciform specimen for biaxial fatigue test is finally determined as follows: the arm thickness t0 is 1.2 mm, the minimum thickness t in the central region is 0.2 mm, and the diameter d of hemispherical thinning area is 9 mm. The detailed dimensions of the specimen are shown in Figure 14.
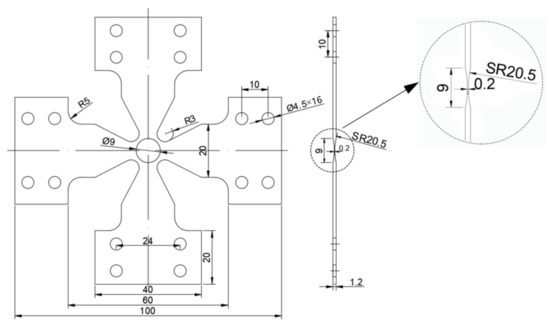
Figure 14.
Optimized size of cruciform specimen (unit: mm).
3. Verification by Biaxial Tension and Fatigue Test
Digital image correlation (DIC) technology is a non-contact full-field strain measurement method proposed by Peter and Ranson in the early 1980s [25]. By comparing the surface speckle images before and after deformation, the surface whole field displacement and strain distribution can be calculated. It has been used in many aspects of experimental research [26,27,28,29], especially in the field of biaxial fatigue. During cyclic loading, DIC can be used to detect the whole field cyclic strain and crack initiation [22] and extract the center average strain change history from the measured displacement/strain field. The material response to various loading conditions has been discussed [30].
The material used in this experiment is cold rolled and annealed TA2 Sheet, and its chemical composition is shown in Table 5. The in-situ biaxial testing machine (IPBF-5000, CARE Measurement & Control Co., Ltd., Tianjin, China) was used to carry out equibiaxial tensile tests on the TA2 cruciform specimen. The loading process was controlled by load, and 2 KN load was applied to the two loading arms respectively, so that the load ratio Fx/Fy of X-axis to Y-axis is always equal to 1. The cruciform specimen is shown in Figure 15. The central area of the specimen is hemispherical thinning, and the spherical milling cutter is used for cutting, so there are vortex-like traces in the center thinned area, but this does not affect the smoothness of the thinned area. In order not to affect the fatigue life of the material, metallographic sandpaper will be considered in subsequent tests to eliminate cutting traces.
Table 5.
Chemical composition of TA2 (wt.%).
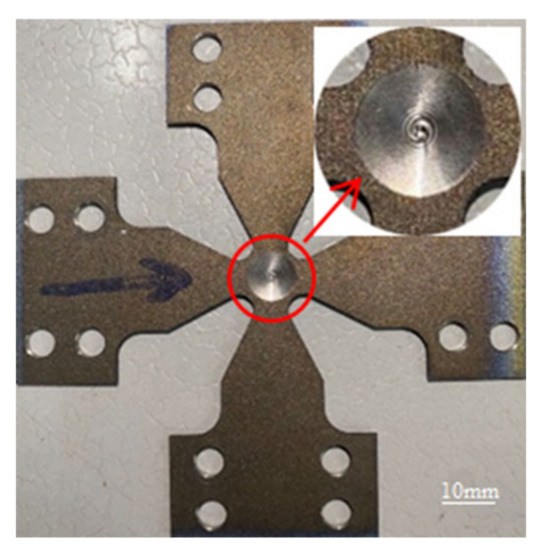
Figure 15.
Cruciform specimen.
The biaxial test system and the non-contact strain measurement system based on DIC are shown in Figure 16. The DIC system uses a CCD camera (FUJIFILM HOLDINGS CORP., Akasaka, Tokyo, Japan) (Figure 16b), with a resolution of 2452 × 2056 pixels. The post-processing software adopts the calculation criterion of zero-normalized sum of squared differences (ZNSSD), and the subset size is set to 21 px. In displacement measurement, Gaussian prefiltering was used to reduce the bias error. Subsequently, the filtered image set was analyzed using the affine shape function and bilinear quadrilateral polynomial interpolation. Before the test, it is necessary to spray black and white paint on the surface of the sample to make the speckle pattern, as shown in Figure 16e.
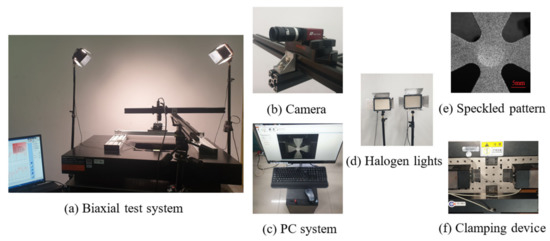
Figure 16.
Biaxial test system and digital image correlation (DIC) test system: (a) Biaxial test system; (b) camera; (c) PC system; (d) halogen lights; (e) speckled pattern; (f) clamping device.
The specimen shown in Figure 15 is used for the biaxial fatigue test. For the equibiaxial test (Fx/Fy = 1), the loading waveforms of both axes are sine wave with an average value of 1250 N, an amplitude of 1250 N, and a frequency setting of 0.2 Hz, as shown in Figure 17a. For biaxial test (Fx/Fy = 2), the loading sine wave of X-axis with an average value of 1250 N, an amplitude of 1250 N; and the loading sine wave of Y-axis with an average value of 625 N, an amplitude of 625 N. The loading frequency is 0.2 Hz in both axes, as shown in Figure 17b. The two axis loads are applied synchronously under the control of the servo motor.
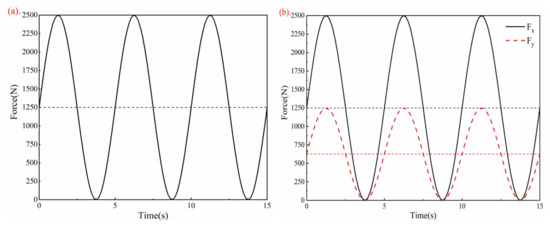
Figure 17.
Loading waveforms: (a) Equibiaxial test (Fx/Fy = 1); (b) Biaxial test (Fx/Fy = 2).
The equibiaxial tensile test is carried out on the cruciform specimen by in-situ biaxial testing machine, and the whole field strain was measured by DIC. The post-processing software is used to extract the strain data points in the 45° diagonal direction of the central area of the specimen, and the results are compared with the finite element simulation results, as shown in Figure 18. It can be seen that the simulated value of von Mises strain on the diagonal reaches the peak at the center, and it is symmetrically distributed at the fillets on both sides. Although the experimental value measured by DIC is slightly lower than the simulation value, the overall change trend of the two is basically consistent. Due to the limitation of specimen processing technology, the thickness of the four arms cannot be guaranteed to be uniform and equal. According to ISO 16842: 2014 (E) [9], the accuracy of arm thickness meets the tolerance of ±0.1 mm. These errors make the strain of the fillet on both sides to show asymmetry. However, this effect cannot be taken into account because only the central strain of the specimen needs to be measured in the later fatigue test.
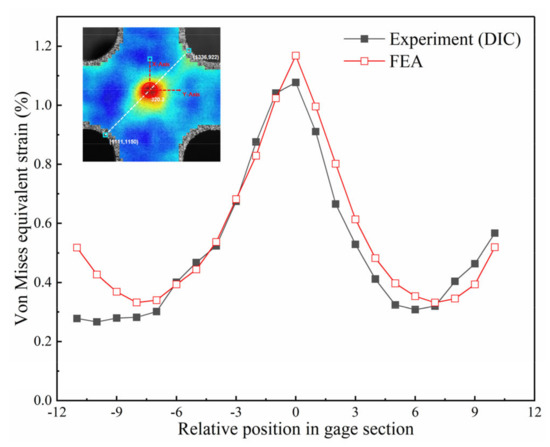
Figure 18.
Comparison of DIC and FEA simulation results.
The results of biaxial fatigue test are shown in Figure 19. Under load ratio Fx/Fy = 1:1, a microcrack visible to the naked eye was captured by CCD camera in the central area of the specimen surface, and the angle between the crack initiation angle and the horizontal direction is close to 45°, as shown in Figure 19a, which is consistent with the results obtained in reference [31], and is close to the ideal state of equal biaxial loading. Similarly, under load ratio Fx/Fy = 2:1, the initial crack occurs in the central region, and the crack direction is perpendicular to the loading X-axis, as shown in Figure 19b. These findings are in good agreement with the results of Ackermann et al. [7] who found that the major cracks are oriented at an angle of 45° to the loading axes under equibiaxial loading, and perpendicular to the axis of maximum principal strain under biaxial loading ratio 2:1. The tests results show that the optimized specimen can be effectively used for biaxial fatigue test.
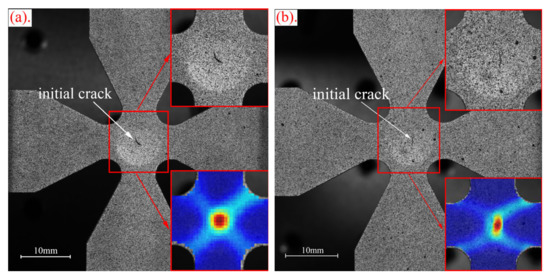
Figure 19.
DIC crack initiation detection: (a) Load ratio 1:1; (b) Load ratio 2:1.
4. Conclusions
In this paper, we provided a type of cruciform specimen for biaxial fatigue test. The main means of specimen optimization is finite element simulation analysis. The influence of three main specimen parameters t0, t and d on the above two objective coefficients was discussed by using the orthogonal test optimization method, and the change of different biaxial stress ratio was fully considered. Finally, the suitable specimen was determined.
Biaxial tensile and fatigue tests were carried out on an in-situ biaxial testing machine (IPBF-5000) with optimized cruciform specimens. The whole field strain was measured by DIC system. The results showed that the central strain measured by the experiment was in good agreement with the finite element simulation value, which verifies the measurement accuracy of DIC and the accuracy of finite element simulation. Under the condition of equibiaxial loading, fatigue crack initiation occurs in the central region of the specimen. With the accumulation of cyclic plastic strain, the crack propagates along the direction of 45° until fracture. Under the condition of biaxial load ratio 2:1, the crack initiation also appears in the central region of the specimen, and the crack direction is perpendicular to the X-axis.
The cruciform specimen obtained in this paper provides a possibility for fatigue test of low-power biaxial testing machine (rated load 5 KN), which can realize the fatigue failure of material in a small load range, and then study its mechanical properties under fatigue load. In the future, biaxial fatigue tests with different biaxial stress ratios or different loading paths can be carried out to study the more complex plane biaxial fatigue behavior.
Author Contributions
Conceptualization, Z.L. and X.-H.H.; methodology, Z.L.; software, Z.L.; validation, Z.L., C.-Y.Z. and X.-H.H.; formal analysis, Z.L.; investigation, Z.L. and J.-Y.Z.; resources, J.-Y.Z.; data curation, J.-Y.Z.; writing—original draft preparation, Z.L.; writing—review and editing, X.-H.H.; visualization, J.-Y.Z.; supervision, C.-Y.Z.; project administration, X.-H.H.; funding acquisition, C.-Y.Z. and X.-H.H. All authors have read and agreed to the published version of the manuscript.
Funding
This study was funded by the National Natural Science Foundation of China with the grant number 51675260 and 51975271.
Acknowledgments
The authors gratefully acknowledge the financial support of the National Natural Science Foundation of China (51675260, 51975271).
Conflicts of Interest
The authors declare no conflict of interest.
References
- Tiernan, P.; Hannon, A. Design optimization of biaxial tensile test specimen using finite element analysis. Int. J. Mater. Form. 2014, 7, 117–123. [Google Scholar] [CrossRef]
- Hannon, A.; Tiernan, P. A review of planar biaxial tensile test systems for sheet metal. J. Mater. Process. Tech. 2008, 198, 1–13. [Google Scholar] [CrossRef]
- Kwon, H.J.; Jar, P.-Y.B.; Xia, Z. Characterization of biaxial fatigue resistance of polymer plates. J. Mater. Sci. 2005, 40, 965–972. [Google Scholar] [CrossRef]
- Kulawinski, D.; Nagel, K.; Henkel, S.; Hübner, P.; Fischer, H.; Kuna, M.; Biermann, H. Characterization of stress—Strain behavior of a cast trip steel under different biaxial planar load ratios. Eng. Fract. Mech. 2011, 78, 1684–1695. [Google Scholar] [CrossRef]
- Lamkanfi, E.; Van Paepegem, W.; Degrieck, J.; Ramault, C.; Makris, A.; Van Hemelrijck, D. Strain distribution in cruciform specimens subjected to biaxial loading conditions. Part 1: Two-dimensional versus three-dimensional finite element model. Polym. Test. 2010, 29, 7–13. [Google Scholar] [CrossRef]
- Liu, W.; Guines, D.; Leotoing, L.; Ragneau, E. Identification of sheet metal hardening for large strains with an in-plane biaxial tensile test and a dedicated cross specimen. Int. J. Mech. Sci. 2015, 101, 387–398. [Google Scholar] [CrossRef]
- Ackermann, S.; Lippmann, T.; Kulawinski, D.; Henkel, S.; Biermann, H. Biaxial fatigue behavior of a powder metallurgical trip steel. Frat. Ed Integrita Strutt. 2015, 34, 580–589. [Google Scholar]
- Kuwabara, T. Biaxial stress testing methods for sheet metals. In Comprehensive Materials Processing; Elsevier: Amsterdam, The Netherlands, 2014; Volume 1, pp. 95–111. [Google Scholar]
- ISO/CD 16842. Metallic Materials—Sheet and Strip—Biaxial Tensile Testing Method Using Cruciform Specimen; ISO: Geneva, Switzerland, 2014. [Google Scholar]
- Yuan, W.N.; Wan, M.; Wu, X.D.; Cheng, C.; Cai, Z.Y.; Ma, B.L. A numerical M-K approach for predicting the forming limits of material AA5754-O. Int. J. Adv. Manuf. Tech. 2018, 98, 811–825. [Google Scholar] [CrossRef]
- Seymen, Y.; Güler, B.; Efe, M. Large strain and small-scale biaxial testing of sheet metals. Exp. Mech. 2016, 56, 1519–1530. [Google Scholar] [CrossRef]
- Yu, Y.; Wan, M.; Wu, X.D.; Zhou, X.B. Design of a cruciform biaxial tensile specimen for limit strain analysis by FEM. J. Mater. Process. Tech. 2002, 123, 67–70. [Google Scholar] [CrossRef]
- Baptista, R.; Claudio, R.A.; Reis, L.; Madeira, J.F.A.; Guelho, I.; Freitas, M. Optimization of cruciform specimens for biaxial fatigue loading with direct multi search. Theor. Appl. Fract. Mech. 2015, 80, 65–72. [Google Scholar] [CrossRef]
- Lamkanfi, E.; Van Paepegem, W.; Degrieck, J. Shape optimization of a cruciform geometry for biaxial testing of polymers. Polym. Test. 2015, 41, 7–16. [Google Scholar] [CrossRef]
- Zhao, K.; Chen, L.; Xiao, R.; Ding, Z.; Zhou, L. Design of a biaxial tensile testing device and cruciform specimens for large plastic deformation in the central zone. J. Mater. Sci. 2019, 54, 7231–7245. [Google Scholar] [CrossRef]
- Makinde, A.; Thibodeau, L.; Neale, K.W. Development of an apparatus for biaxial testing using cruciform specimens. Exp. Mech. 1992, 32, 138–144. [Google Scholar] [CrossRef]
- Kulawinski, D.; Ackermann, S.; Seupel, A.; Lippmann, T.; Henkel, S.; Kuna, M.; Weidner, A.; Biermann, H. Deformation and strain hardening behavior of powder metallurgical trip steel under quasi-static biaxial-planar loading. Mat. Sci. Eng. A 2015, 642, 317–329. [Google Scholar] [CrossRef]
- Parsons, M.W.; Pascoe, K.J. Development of a biaxial fatigue testing rig. J. Strain. Anal. Eng. 1975, 10, 1–9. [Google Scholar] [CrossRef]
- Makris, A.; Vandenbergh, T.; Ramault, C.; Van Hemelrijck, D.; Lamkanfi, E.; Van Paepegem, W. Shape optimisation of a biaxially loaded cruciform specimen. Polym. Test. 2010, 29, 216–223. [Google Scholar] [CrossRef]
- Xiao, R.; Li, X.X.; Lang, L.H.; Chen, Y.K.; Yang, Y.F. Biaxial tensile testing of cruciform slim superalloy at elevated temperatures. Mater. Des. 2016, 94, 286–294. [Google Scholar] [CrossRef]
- Zhu, Z.K.; Lu, Z.; Zhang, P.; Fu, W.; Zhou, C.Y.; He, X.H. Optimal design of a miniaturized cruciform specimen for biaxial testing of TA2 alloys. Metals 2019, 9, 823. [Google Scholar] [CrossRef]
- Poncelet, M.; Barbier, G.; Raka, B.; Courtin, S.; Desmorat, R.; Le-Roux, J.C.; Vincent, L. Biaxial High Cycle Fatigue of a type 304L stainless steel: Cyclic strains and crack initiation detection by digital image correlation. Eur. J. Mech. A Solids 2010, 29, 810–825. [Google Scholar] [CrossRef][Green Version]
- Cláudio, R.A.; Reis, L.; Freitas, M. Biaxial high-cycle fatigue life assessment of ductile aluminium cruciform specimens. Theor. Appl. Fract. Mech. 2014, 73, 82–90. [Google Scholar] [CrossRef]
- Montgomery, D.C. Design and Analysis of Experiments, 9th ed.; Wiley: Hoboken, NJ, USA, 2017. [Google Scholar]
- Peters, W.H.; Ranson, W.F. Digital imaging techniques in experimental stress analysis. Opt. Eng. 1982, 21, 427–431. [Google Scholar] [CrossRef]
- Breitbarth, E.; Besel, M. Fatigue crack deflection in cruciform specimens subjected to biaxial loading conditions. Int. J. Fatigue 2018, 113, 345–350. [Google Scholar] [CrossRef]
- Lopez-Crespo, P.; Moreno, B.; Lopez-Moreno, A.; Zapatero, J. Characterisation of crack-tip fields in biaxial fatigue based on high-magnification image correlation and electro-spray technique. Int. J. Fatigue 2015, 71, 17–25. [Google Scholar] [CrossRef]
- Merklein, M.; Biasutti, M. Development of a biaxial tensile machine for characterization of sheet metals. J. Mater. Process. Tech. 2013, 213, 939–946. [Google Scholar] [CrossRef]
- Sun, P.Y.; Zhu, Z.K.; Su, C.Y.; Lu, L.; Zhou, C.Y.; He, X.H. Experimental characterisation of mechanical behaviour for a T A2 welded joint using digital image correlation. Opt. Laser. Eng. 2019, 115, 161–171. [Google Scholar] [CrossRef]
- Tomičević, Z.; Kodvanj, J.; Hild, F. Characterization of the nonlinear behavior of nodular graphite cast iron via inverse identification: Analysis of biaxial tests. Eur. J. Mech. A Solids 2016, 59, 195–209. [Google Scholar]
- Bonnand, V.; Chaboche, J.L.; Gomez, P.; Kanouté, P.; Pacou, D. Investigation of multiaxial fatigue in the context of turboengine disc applications. Int. J. Fatigue 2011, 33, 1006–1016. [Google Scholar] [CrossRef]
© 2020 by the authors. Licensee MDPI, Basel, Switzerland. This article is an open access article distributed under the terms and conditions of the Creative Commons Attribution (CC BY) license (http://creativecommons.org/licenses/by/4.0/).