Article

Bone Loss in Bruxist Patients Wearing Dental Implant Prostheses: A Finite Element Analysis

by
Luis-Guillermo Oliveros-López
1,
Raquel Castillo-de-Oyagüe
2,
María-Ángeles Serrera-Figallo
1,*,
Álvaro-José Martínez-González
3,
Andrea Pérez-Velasco
3,
Daniel Torres-Lagares
1 and
José-Luis Gutiérrez-Pérez
1
1
Faculty of Dentistry, University of Seville, U.S., Calle Avicena s/n, 41009 Seville, Spain
2
Faculty of Dentistry, Complutense University of Madrid, U.C.M., Plaza Ramón y Cajal s/n, 28040 Madrid, Spain
3
ICEMM S.L.U., Oficina 0-8. Edificio Antares, Calle de las Fábricas, 28923 Madrid, Spain
*
Author to whom correspondence should be addressed.
Metals 2020, 10(9), 1132; https://doi.org/10.3390/met10091132
Submission received: 12 June 2020 / Revised: 19 August 2020 / Accepted: 20 August 2020 / Published: 22 August 2020

Abstract

:
Bruxism is an unconscious, involuntary and sustained motor activity that results in excessive teeth grinding or jaw clenching that could affect patients’ implants and rehabilitations. The aetiology for bruxism remains unknown, but it is known to involve multiple factors. The literature lacks studies on the possible effect of implant morphology on the resistance of the bone-implant osseointegrated interface when bruxism is present. Our objective is to assess the mechanical response of the bone-implant interface in bruxist patients whose implant prostheses are subjected to parafunctional cyclic loading over a simulated period of 10 years. A comparison was carried out between two implant types (M-12 and Astra Tech), and a pattern of bone loss was established considering both the stress state and the cortical bone surface loss as the evaluation criteria. Numerical simulation techniques based on the finite element analysis method were applied in a dynamic analysis of the received forces, together with a constitutive model of bone remodelling that alters the physical properties of the bone. The simulated cortical bone surface loss at the implant neck area was 8.6% greater in the Astra implant than in the M-12 implant. Compared to the M-12 implant, the higher sustained stress observed over time in the Astra implant, together with the greater cortical bone surface loss that occurred at its neck area, may be related to the major probability of failure of the prostheses placed over Astra implants in bruxist patients.

1. Introduction

Bruxism is a persistent mandibular parafunction whose aetiology remains unknown, but it is known that multiple factors are involve [1,2,3,4,5]. Although the influences of stress, depression and anxiety appear to stand out over other factors [6], some authors classify etiologically bruxism into psycho-dependent or occlusion-dependent categories, or a mix of both depending on the occlusion and the psychological pattern [7].
Bruxism may cause various levels of damage to stomatognathic structures, because it is essentially based on nonfunctional forces that can be maintained for several hours with a considerably greater intensity than that of physiological masticatory loads [8,9,10,11]. Bruxism has been categorised as centric, lateral eccentric, anterior eccentric, mixed eccentric and extra eccentric mandibular movement [7]. Deemed the most common oral parafunctional habit, bruxism can affect the teeth, muscles, temporomandibular joints, bone, implants, restorative materials or other prosthetic components [12,13,14,15,16].
Bruxism may be classified into primary or secondary conditions. Whereas primary bruxism is considered idiopathic, secondary bruxism is frequently observed as a side effect of the use of drugs or neurological and developmental disorders [17,18,19]. Primary bruxism may be nocturnal or diurnal [7,17,18,19,20,21]. Nocturnal or sleep bruxism (eccentric), characterised by parafunctional grinding forces, affects 10% of the population (normally called ‘bruxist patients’) and seems to diminish with age [7,17,18,21]. Diurnal or wakeful bruxism (centric), which manifests as with parafunctional clenching forces between antagonist occlusal surfaces without movement, is more prevalent in women (usually called ‘clencher patients’).
In relation to fatigue fractures, an increase in the duration of occlusal forces constitutes a remarkable problem in patients with bruxism because that the masticatory muscles become strengthened and the number of force cycles on prosthetic components increases [8,9,10,11,16].
In 1996, an analytical study of 4045 functional implants placed over a 5-years period, in which 6 of the 8 fractured implants supported prostheses in posterior areas, concluded that the fractures had occurred in patients with parafunctional habits [22]. Other authors suggest that bruxism may increase the rate of mechanical complications in implant restorations, including the higher prevalence of implant fractures registered in bruxist patients [23].
Even though bruxism does not represent a definite contraindication for implants [8,9,10,11,16], the presence of parafunctions is one of the most important factors to consider in treatment planning. Sleep bruxism is riskier for implant restorations compared with wakeful bruxism, because the horizontal and oblique forces exerted during the grinding of teeth are far more prone to cause the failure of osseointegration compared with the compressive axial loads related to clenching teeth [24]. The main difference in the diagnoses of grinding and clenching habits is the presence of wear on the occlusal surfaces of natural teeth, which may be seen in bruxist patients [9,10].
Common signs and symptoms of bruxism are headaches, repeated losses of cementation of restorations, jawbone discomfort on waking and muscular sensitivity. Clinical signs of bruxism are an increase in the size of temporal and masseter muscles, sensitivity to muscles palpation, mandibular deviation on opening the mouth, limited occlusal opening, dental mobility, abfraction of cervical surface of the teeth and fracture of teeth or restorations [1,2,3,4,5].
Several investigations have focussed on the ideal prosthesis design and restorative materials for bruxist patients [11,23,25]. However, the literature lacks studies on the possible effect of the implant morphology on the resistance of the bone-implant osseointegrated interface when sleep bruxism is present. Implant macrodesign plays a key role in force distribution along the implant and surrounding bone regardless of bone type [26,27,28]. Azcárate et al. conducted a finite element analysis (FEA) of bone quality relative to mechanical interaction between implant and bone. They used the same two dental implants as in our study, but few publications have analysed the parafunctional forces over implants [29]. They focus on abutment material or occlusal splint devices [30,31]. Studies that assess the mechanical response of the bone–implant interface in bruxist patients are needed.
The meshing of the two materials was done using C3D4 elements, first-order tetrahedra, with an average mesh size of 0.05 mm. In turn, embedment boundary conditions have been imposed on the base and Y-movement in the lateral tooth cuts has been restricted. The preparation of the finite element models for the implants was as follows: ASTRA; nodes: 432,276; elements (4-node linear tetrahedron): 2,567,561. M12; nodes: 330,492; elements (4-node linear tetrahedron): 1,973,646. Our mesh was very dense, and the stress discontinuity was very low, corresponding to a very precise model.
The aim of this study is to use numerical simulation techniques based on the FEA method to evaluate the stress state and peri-implant bone loss around two types of implants under simulated sleep bruxism (grinding forces) for 10 years.
We hypothesised that the implants’ morphology as measured in terms of peri-implant bone loss would not affect the distribution of forces under sustained bruxist grinding loads for a simulated period of 10 years.

2. Materials and Methods

2.1. Dental Implants and Bone Type

Two dental implants with 4 mm diameters and 13 mm lengths, and with evident morphological differences from each other, were selected for the study. Their characteristics have previously been described in detail as follows [29]:
M-12 (Oxtein, Madrid, Spain) is a tapered implant of grade IV titanium with double internal hexagons and an argon-treated surface. It has coronal microthreads, double U-spins in the middle third, and microthreads in the valleys, which increases the contact surface with the bone. This implant has a neck length of 3 mm and includes 6 coarse microthreads with a pitch of 0.3 mm and a depth of 0.15 mm (Figure 1A).
Astra (Astra Tech, Dentsply Sirona, New York, NY, USA) is a straight implant of grade IV titanium with double internal hexagons and a surface blasted with titanium dioxide and modified with fluorine. This implant has a neck length of 3.7 mm and fine microthreads along the entire neck, which have a pitch of 0.2 mm and a depth of 0.1 mm (Figure 1B).
The primary reason to study these implants was to compare the influence of macrodesign on force distribution on cortical and trabecular zones on tapered and parallel implants with the same platform design (double internal hexagons), length and diameter. This eligibility criterion has also been applied in other studies [29].
In addition, four bone types (D1, D2, D3 and D4) have been described in the maxillae from higher (D1) to lower density (D4) of the cortical bone (Table 1) [24]. For the comparative study of the implants, the same bone matter was assumed (i.e., the D3 bone type, with a cortical thickness of 1.5 mm) [9,10]. D3 bone is representative of susceptibility to bone loss and is quite commonly found in the mandibular region. The basic bone geometry was taken from a real cone beam computerised tomography of the posterior mandibular area; the dimensions of the bone to be modelled were defined from it. As in a related FEA study on the influence of the mechanical interaction between implant and bone [29], the depth was set at 10 mm, and the upper area was cut to leave a free space of 6.5 mm with the aim of housing the implant properly. Each element of the FEA is given a different value for Young’s modulus (GPa), Poisson’s coefficient and density (g/cm3) according to its nature (Table 2).

2.2. Loading Spectrum

In reference to the usual loading spectrum for assessing the temporal progress of bone loss under bruxism-induced cyclic loading, the protocol described by Nishigawa et al. [32] was used as reference, wherein the data from ten patients were collected over a period of 137 h. This protocol includes the following principles: total loading = 220.7 N; loading angle = 15°; number of daily episodes = 72; duration of each episode = 7.1 s; study period = 10 years. UNI EN ISO 14801 was the test standard applied [33].

2.3. FEA Model

The FEA method was applied using the Abaqus Standard 6.14.2 software package (Abaqus, Johnston, IW, USA). The characteristics of the materials are specified in point 2.3 (Constitutive model). The mesh of the two materials was done with C3D4 elements, which are first-order tetrahedrals with a mean mesh size of 0.05 mm. In turn, embedding boundary conditions were imposed on the base, whereas displacement along Y-direction was restricted at the lateral sections (Figure 1A,B) [29].
One-hundred-percent implant–bone interface was simulated [34,35]. At the start of the study, bone loss was zero in the simulation of both implants. The application point of the loading was placed 5 mm from the upper surface of the cortical bone and was distributed by employing a rigid interpolation element to impose restrictions between the degrees of freedom of one set of nodes and the movement of a rigid body, defined by a reference node [29].

2.4. Constitutive Model

The implants, cortical bone and trabecular bone were rendered as linearly elastic, homogeneous and isotropic [36]. The model establishes a bone remodelling theory based on Stanford’s isotropic model [36], after being adapted to the spatial–temporal needs required for both the requests indicated and the time stipulated [29]. In such a modification, a certain threshold was set from which the bone loss occurred when the loading state described above was reached. When this value was surpassed (at each finite element model point of the implant), the bone was removed, thus relieving the connection between the bone and the implant at the level of the affected finite element model point of the implant (Figure 2).
It is deemed that the bone tissue needs a certain intensity of mechanical stimulus to maintain its characteristics [37]. Bone´s inherent self-regulation capacity allows it to maintain its level. In other words, the bone modifies its density when it is subjected to higher than usual stress states. As mentioned elsewhere, the stress threshold for bone destruction was set at 2.75 N/mm2 [38].
The daily stress stimulus at the tissue level is defined by:
ψ t = n c 1 m ( ρ c ρ ) 2 σ ¯
where:
  • ψt is the daily stress at the tissue level.
  • nc is the number of loading cycles.
  • m is the constant that quantifies the importance of the stress state and the number of daily cycles. Based on previous research, it may adopt values between 3 and 8 [39]. The calibration value of our model was 3.
  • ρc is the maximum bone density.
  • ρ is the apparent density.
  • σ is the effective stress at the tissue level.
Bearing in mind the duration of each episode, and making an extrapolation on an annual time scale, which is equivalent to 2 days per year of biting at the abovementioned study loading (no recovery nor unloading time was considered), the law of apparent density progression was determined by the following formula:
ρ ˙ = r ˙ S u ρ t ρ ( t + Δ t ) = ρ ( t ) + p ˙ Δ t
where:
  • is the derivative of density depending on time. An explicit Euler integration algorithm was used to obtain the state variable associated with it.
  • is the speed of bone remodelling that quantifies the amount of bone formed on the available surface of the bone matrix per unit of time. This variable was not nil when the established threshold was surpassed.
  • Su is the specific surface.
  • ρt is the tissue density.
Once the law of density progression for each element of the model was known, the value of the apparent mechanical properties was determined based on it. Given that the bone is considered an isotropic material, only Young’s modulus and the Poisson coefficient were considered [39].
E   ( M P a ) = { 2014   ρ 2.50 ,   ρ < 1.2 g / c m 3   1763   ρ 3.23 ,   ρ 1.2 g / c m 3
ν = { 0.20 ,     ρ < 1.2   g / c m 3   0.32 ,     ρ 1.2   g / c m 3
These new parameters obtained for each element of the numeric model were updated in the FEA model to obtain a new stress state after the bone-remodelling process. The block diagram outlined in Figure 2 determined the information flow embodied in the constitutive model.
As a reference for the usual loading spectrum for assessing the temporal progress of bone loss under bruxism-induced cyclic loading, the protocol described by Nishigawa et al. [32] was used, wherein the data from ten patients were collected over a period of 137 h. This protocol includes the following principles: total loading = 220.7 N; loading angle = 15°; number of daily episodes = 72; duration of each episode = 7.1 s; study period = 10 years.

3. Results

After the process described in the previous section was applied to simulate a period of 10 years, the progress of the stress state for each implant was evaluated along with the bone loss due to the established cyclic-loading state.
In the initial stress state, an overload on the more rigid material was detected. The same occurred in the area that reacted depending on the direction in which the lateral component of the loading had been applied (e.g., the left part of the cortical bone at the implant neck area). As it progressed over time, the part of this material next to the implant was biologically removed because the critical stress level set at 6.9 N/mm2 was surpassed [38]. Therefore, in the absence of rigidity, the forces were redistributed, loading on other areas of the cortical bone at the implant neck and on the trabecular bone that was subjected to loading. As a secondary finding, a high concentration of stress was identified in the lower area of the implant due to the boundary conditions imposed at this point (neither being representative of the model nor affecting the ultimate aim of this study).
The stress state during the Astra implant simulation was greater in comparison with that of the M-12 implant (Figure 3A). In terms of contact surface loss at the bone-implant contact-site, this involves a greater resorption of the bone surrounding the implant prosthesis.
Under equal conditions, by the end of the study, the contact surface loss was 8.6% higher in the Astra implant than in the M-12 implant at the neck area between the implant and the cortical bone (Figure 3B). Hence, the Astra implant lost 12.40 mm2, whereas the M-12 implant lost 10.83 mm2 of cortical bone in the same period (Table 3).
Finally, a greater loss of trabecular bone was registered in the case of the Astra implant with respect to the M-12 implant. This may be due to the loading redistribution produced via the smaller surface contact with the more rigid bone existing at the neck area of the Astra implant (Figure 4 and Figure 5).

4. Discussion

In this study, the simulated mechanical behaviour of the interaction between the bone and 2 morphologically different types of implants in bruxist patients was observed. Although it is true that the occlusal load is an important factor in bruxism, other factors are related to the bone loss (e.g., inflammation of the peri-implant tissues). However, addressing the other factors was not the objective of this article [40]. For analytical purposes, the FEA method together with a constitutive model for bone remodelling was used, with stress changes and bone loss assessed over various periods. In this regard, the FEA model has been recognised as a valid tool for studying situations close to reality, which can be difficult to investigate clinically, or in which the existence of innumerable factors can introduce biases that are difficult to control [41,42,43].
Previous research has used the FEA method to analyse the stress state and bone loss in various areas of the body (e.g., dental implants and femoral head prostheses) [44,45]. Such investigations, which combine various types, surfaces and bone densities, conclude that the achievement of positive data for both abovementioned parameters may be the key to efficient long-term treatment.
Bruxism is often cited as a risk factor for implant failure, having both biological and biomechanical effects because the forces transmitted to the parts of the implant, during parafunctional activities, may result in overloading (Table 1) [23,46,47,48,49]. However, scant literature exists on this topic, and what exists is not unequivocal; the majority of reports in this field consist of expert opinions based on clinical and empirical experience. Despite this, it has been shown that one must be cautious when proposing implant prostheses to patients with bruxism [40]. This is shown in the data from the experimental literature on the effects of various types of occlusal loading on the marginal peri-implant bone loss, as well as study data related to the intensity of the forces transmitted to the same bone during teeth clenching and grinding activities.
Bone density is directly related to bone strength. Misch [24] described the trabecular bone properties using his classification of densities, where it can be seen that the strength of the dense D1 bone type is ten times greater than that of the D4 bone type (Table 2 and Table 3) [9,10].
In relation to the percentage of bone-implant contact and bone density, the D3 and D4 bone types present higher risks than the others do. Their fine trabecular bone characteristics and their low strength make them prone to receiving greater stress at the bone-implant interface [9,10]. Therefore, the D2 bone type was chosen for modelling, both because it is representative of the susceptibility to bone loss and because it is the usual bone type in the mandibular area.
To establish a time scale, several calibration studies for the numerical model were carried out, and the stresses associated with bone loss were analysed, concluding that a study period of 10 years was representative of the problem (Figure 2).
The response obtained in this type of study is significantly determined by the loading state, and it is essential that the correct loading spectrum is chosen, because not all of them compromise the proper functioning of the implant prosthesis [36] (Figure 1). It is known that some forces can lead to the failure of an implant. Therefore, a typical loading spectrum for patients with bruxism was adopted. Their bites and frequencies were greater than those of other patients not suffering from this pathology [32]. Many other variables apart from this one may negatively affect the functionality of an implant, such as age, smoking, alcoholism, diabetes or hygiene habits, which may be interesting to investigate in the future [50,51,52].
For a consistent representation of reality, finite element modelling was used on Abaqus, a software program that was designed for this purpose and offers several types of elements for establishing the model mesh. Both implants were executed using C3D4 elements, which are first-order tetrahedral elements, because they offered optimum results for the mesh density employed, as well as a lower computing cost compared with C3D10 elements, or second-order tetrahedrals [29].
Several authors use Stanford’s bone remodelling constitutive model to study the stress stimulus of other regions of the human body [35]. This isotropic model is proposed as an attempt to take the ideas of Beaupré and his collaborators to a time-dependent model [39]. The essence of this theory is based on the need for a certain level of the mechanical stimulation of the bone to facilitate its self-regulation. Starting from this basis, a constitutive model was established and was adapted to the time scale needed for the present investigation such that the bone destruction could be taken into account based on a set level of critical stress.
Several interesting results were obtained in this study. Our hypothesis was rejected, because the force distribution under bruxist grinding loads exerted for a simulated period of 10 years was conditioned by the implants’ morphology as measured in terms of peri-implant bone loss.
The stress behaviour and the progress associated with both models correspond with the aim of this study. In agreement with the literature both implants presented lower stress in the apical area, and more concentrated stress around the neck. It is at this location that the greatest bone loss occurs and consequently a load redistribution [53,54].
One-hundred-percent implant-bone interface was simulated which is impossible in clinical situations; several publications have also considered it [34,35], because they show fractures occurring further away from the bone-implant interface on removing osseointegrated dental implants with roughened surfaces [55]. Even though this might not significantly affect the results [56,57], micromotion can occur in the interface. In the cervical aspect minor micromotion in the range of 0.75 µm could be found, whereas at the most apical part almost no relative displacement can be found between implant and bone [58].
On the other hand, studies show that reducing the thread pitch and the depth of the thread in low-density bone can improve primary stability and decrease the period of osseointegration [59], as well as lead to a better distribution of axial forces [60,61]. The thread depth should exceed 0.44 mm to optimise the mechanical properties [62].
Stress distribution patterns may have been different depending on the properties assigned to materials of the model. The inherent limitations of the finite element stress analysis should be taken into consideration [35].
An earlier study in which the FEA method was used to compare two types of implants concluded that after they were subjected to the contemplated loading, both presented low stress in the medullar bone, meaning that the greatest stress concentration was located at the cortical area [3]. In a systematic review carried out in 2014, the authors stated that it was unlikely that bruxism was a risk factor for the appearance of biological complications around dental implants. Nonetheless, research has suggested that such parafunction could be a risk factor for mechanical complications [11]. In this study, biological and mechanical changes were observed after 10 years of simulated loading on both implants (Figure 4 and Figure 5).
A greater probability for the implant prosthesis to fail could be expected when Astra implants are used in bruxist patients, mainly for two reasons: (a) The 8.6% greater contact surface loss detected in the Astra implant with respect to the M-12 implant at the neck area between the implant and the cortical bone; and (b) the greater increase in the stress state identified in the Astra implant when compared with the M-12 model at the same location (this being the main area for implant support) (Figure 3, Figure 4 and Figure 5; Table 3).
Finally, it can be concluded that the greater loss of trabecular bone in the M-12 implant may be due to the shape of the bone extraction canals, as well as to the shape of the implant thread, where a greater concentration of stress is produced, thereby determining areas that are prone to bone loss. This effect could be mitigated by reducing the size of such canals and improving the design of the threads to reduce these stress peaks.

5. Conclusions

Within the limitations of this experiment, the following conclusions may be drawn:
  • All of the hypotheses adopted are representative of simulating the behaviour of the bone-implant interface, which was the study object.
  • At the initial stress state of both implants, an overloading occurred on the left part of the cortical bone area at the implant neck, obtaining lower stress levels in the apical region.
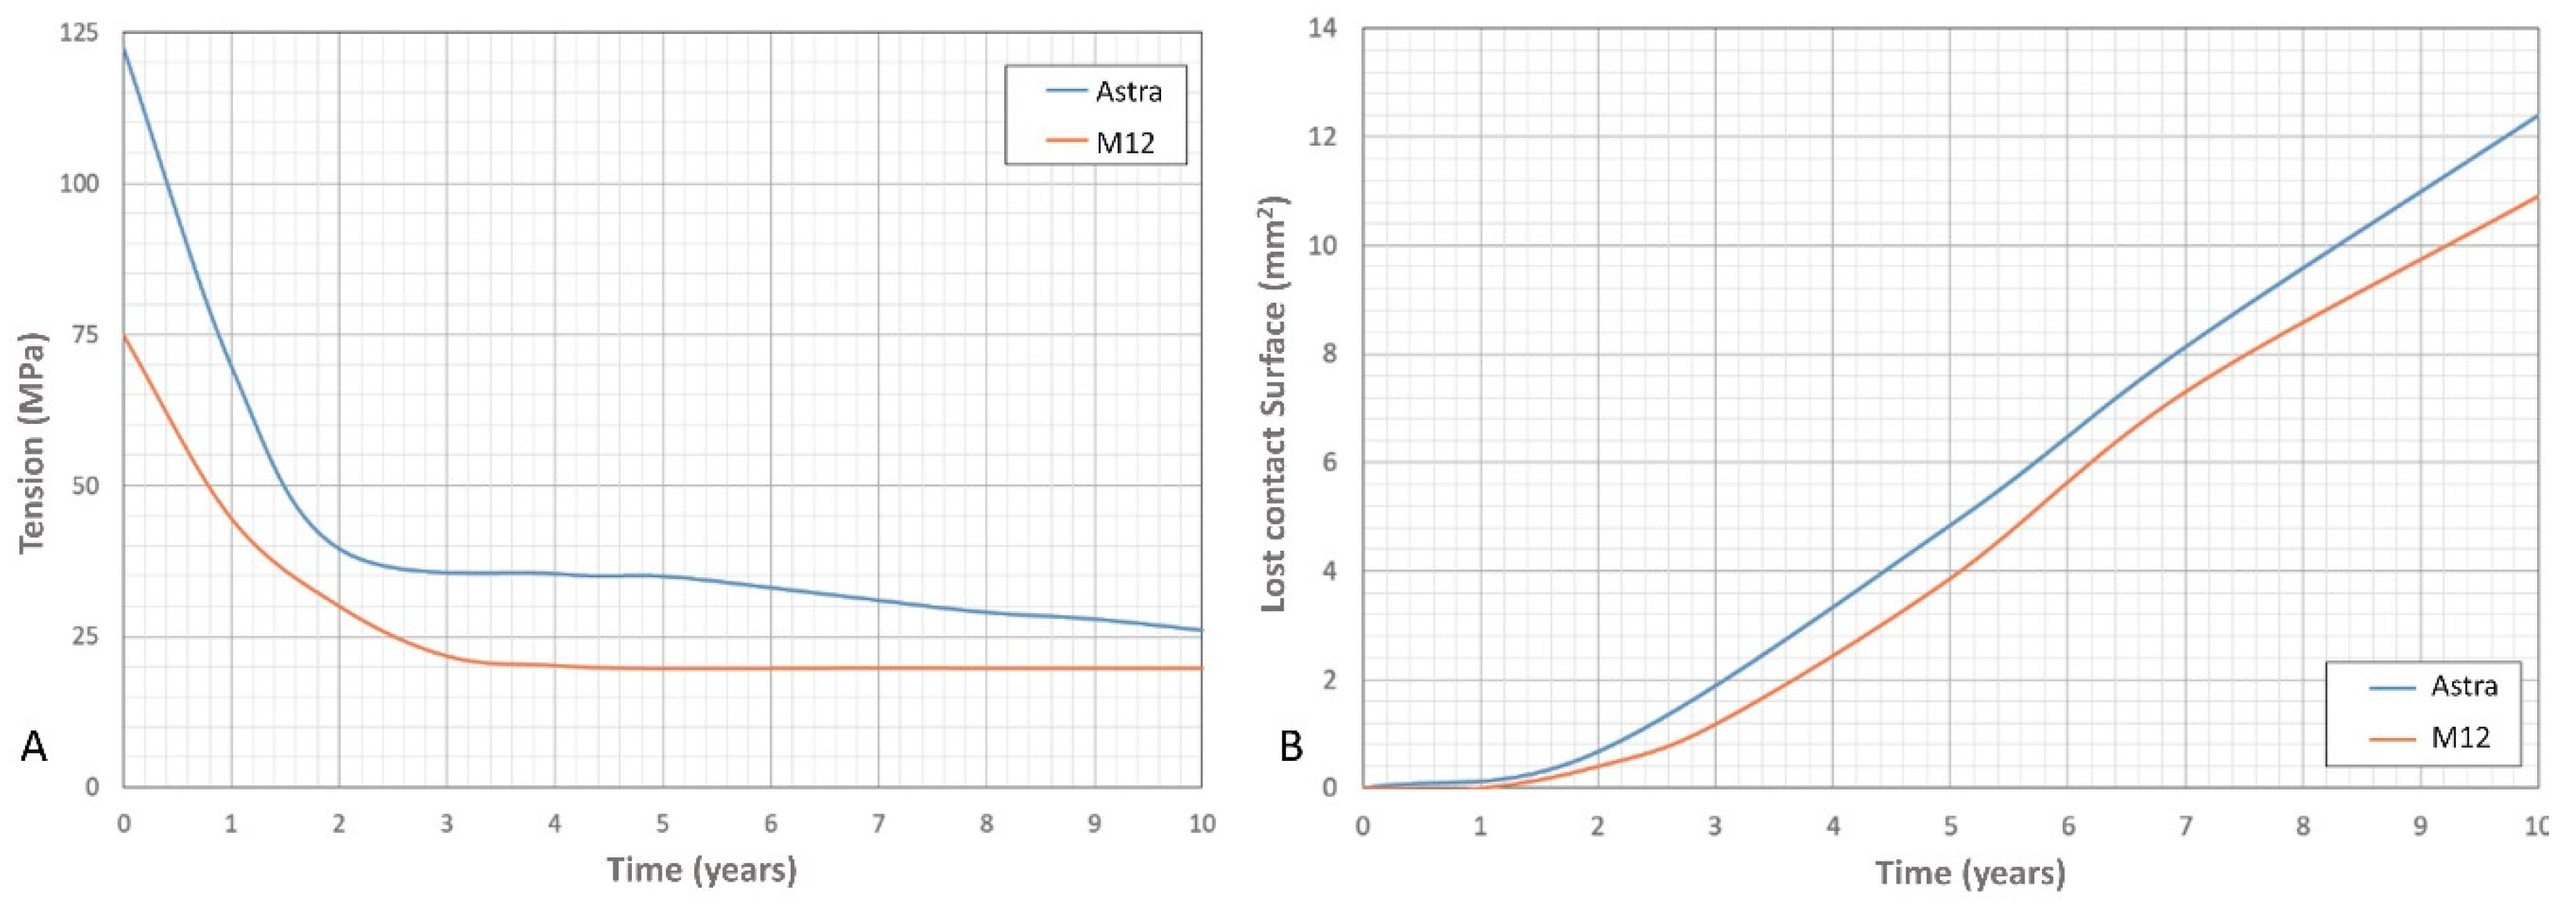
  • When compared to the Astra model, the M-12 implant allows better dissipation of forces in the neck area (where most forces are concentrated).
  • In the Astra model, the greater sustained stress over time and the contact surface loss observed in the cortical bone around the implant’s neck area may be attributed to the lower contact surface initially achieved at the cervical level of this type of implant when compared to the M-12 implant.
  • The higher loss of trabecular bone recorded in the M-12 model may be due to the shape of its bone extraction canals and implant thread. Given that the greater stress peaks were registered in these areas, more prone to bone loss a reduction of the canals and a modification of the implant thread may be suggested to avoid this problem.
  • In light of the study results, prostheses placed over M-12 implants may be expected to have more predictable prognosis than those constructed onto Astra implants in bruxist patients.

Author Contributions

Conceptualisation, R.C.-d.-O., M.-Á.S.-F., Á.-J.M.-G. and D.T.-L.; formal analysis, L.-G.O.-L. and Á.-J.M.-G.; funding acquisition, D.T.-L. and J.-L.G.-P.; investigation, L.-G.O.-L., R.C.-d.-O., M.-Á.S.-F., Á.-J.M.-G., A.P.-V., D.T.-L. and J.-L.G.-P.; methodology, L.-G.O.-L., R.C.-d.-O., M.-Á.S.-F., A.P.-V., D.T.-L. and J.-L.G.-P.; project administration, D.T.-L. and J.-L.G.-P.; software, Á.-J.M.-G. and A.P.-V.; supervision, Á.-J.M.-G. and J.-L.G.-P.; validation, R.C.-d.-O., D.T.-L. and J.-L.G.-P.; visualisation, L.-G.O.-L. and M.-Á.S-F.; writing—original draft, L.-G.O.-L., R.C.-d.-O., M.-Á.S.-F., Á.-J.M.-G., A.P.-V., D.T.-L. and J.-L.G.-P.; writing—review and editing, L.-G.O.-L., R.C.-d.-O., M.-Á.S.-F., Á.-J.M.-G., A.P.-V., D.T.-L and J.-L.G.-P. All authors have read and agreed to the published version of the manuscript.

Funding

This research was funding by Oxtein Iberia SL—USE-OXTEIN-003.

Conflicts of Interest

The authors declare no conflict of interest.

References

  1. Afrashtehfar, K.I.; Huynh, N. Five things to know about sleep bruxism. J. N. J. Dent. Assoc. 2016, 87, 14. [Google Scholar] [PubMed]
  2. Afrashtehfar, K.I.; Afrashtehfar, C.D.M.; Huynh, N. Managing a patient with sleep bruxism. J. Can. Dent. Assoc. 2014, 80, e48. [Google Scholar] [PubMed]
  3. Casas, E.B.L.; Ferreira, P.C.; Cimini, C.A.; Toledo, E.M.; Barra, L.P.D.S.; Cruz, M. Comparative 3D finite element stress analysis of straight and angled wedge-shaped implant designs. Int. J. Oral Maxillofac. Implant. 2008, 23, 215–225. [Google Scholar]
  4. Coray, R.; Zeltner, M.; Özcan, M. Fracture strength of implant abutments after fatigue testing: A systematic review and a meta-analysis. J. Mech. Behav. Biomed. Mater. 2016, 62, 333–346. [Google Scholar] [CrossRef] [PubMed]
  5. Papaspyridakos, P.; Mokti, M.; Chen, C.J.; Benic, G.I.; Gallucci, G.O.; Chronopoulos, V. Implant and prosthodontic survival rates with implant fixed complete dental prostheses in the edentulous mandible after at least 5 years: A systematic review. Clin. Implant. Dent. Relat. Res. 2013, 16, 705–717. [Google Scholar] [CrossRef] [PubMed]
  6. Palinkas, M.; Marrara, J.; Bataglion, C.; Hallak, J.; Canto, G.D.L.; Scalize, P.H.; Regalo, I.; Siéssere, S.; Regalo, S. Analysis of the sleep period and the amount of habitual snoring in individuals with sleep bruxism. Med. Oral. Patol. Oral. Cir. Bucal. 2019, 24, e782–e786. [Google Scholar] [CrossRef] [PubMed]
  7. Lobbezoo, F.; Ahlberg, J.; Glaros, A.G.; Kato, T.; Koyano, K.; Lavigne, G.J.; De Leeuw, R.; Manfredini, D.; Svensson, P.; Winocur, E. Bruxism defined and graded: An international consensus. J. Oral Rehabilit. 2013, 40, 2–4. [Google Scholar] [CrossRef]
  8. Lobbezoo, F.; Brouwers, J.E.I.G.; Cune, M.; Naeije, M. Dental implants in patients with bruxing habits. J. Oral Rehabilit. 2006, 33, 152–159. [Google Scholar] [CrossRef]
  9. Resnik, R. Misch’s Contemporary Implant Dentistry; Mosby-Elsevier: St Louis, MO, USA, 2020. [Google Scholar]
  10. Misch, C.E. Dental Implant Prosthetics; Mosby-Elsevier: St Louis, MO, USA, 2015. [Google Scholar]
  11. Manfredini, D.; Poggio, C.E.; Lobbezoo, F. Is bruxism a risk factor for dental implants? A systematic review of the literature. Clin. Implant. Dent. Relat. Res. 2014, 16, 460–469. [Google Scholar] [CrossRef]
  12. Huang, H.M.; Tsai, C.M.; Chang, C.C.; Lin, C.T.; Lee, S.Y. Evaluation of loading conditions on fatigue-failed implants by fracture surface analysis. Int. J. Oral Maxillofac. Implant. 2005, 20, 854–859. [Google Scholar]
  13. Albrektsson, T.; Donos, N.; Working Group Implant Survival and Complications. The Third EAO consensus conference 2012. Clin. Oral Implant. Res. 2012, 23, 63–65. [Google Scholar] [CrossRef] [PubMed]
  14. Paesani, D.A.; Lobbezoo, F.; Gelos, C.; Nardini, L.G.; Ahlberg, J.; Manfredini, D. Correlation between self-reported and clinically based diagnoses of bruxism in temporomandibular disorders patients. J. Oral Rehabilit. 2013, 40, 803–809. [Google Scholar] [CrossRef] [PubMed]
  15. Chitumalla, R.; Kumari, K.H.; Mohapatra, A.; Parihar, A.S.; Anand, K.; Katragadda, P. Assessment of survival rate of dental implants in patients with bruxism: A 5-year retrospective study. Contemp. Clin. Dent. 2018, 9, S278–S282. [Google Scholar] [CrossRef] [PubMed]
  16. Manfredini, D.; Lobbezoo, F. Relationship between bruxism and temporo-mandibular disorders: A systematic review of literature from 1998 to 2008. Oral Surg. Oral Med. Oral Pathol. Oral Radiol. Endod. 2010, 109, e26–e50. [Google Scholar] [CrossRef]
  17. Lavigne, G.J.; Khoury, S.; Abe, S.; Yamaguchi, T.; Raphael, K.G. Bruxism physiology and pathology: An overview for clinicians. J. Oral Rehabilit. 2008, 35, 476–494. [Google Scholar] [CrossRef]
  18. Manfredini, D.; Winocur, E.; Guarda-Nardini, L.; Paesani, D.; Lobbezoo, F. Epidemiology of bruxism in adults: A systematic review of the literature. J. Orofac. Pain 2013, 27, 99–110. [Google Scholar] [CrossRef] [Green Version]
  19. Behr, M.; Hahnel, S.; Faltermeier, A.; Bürgers, R.; Kolbeck, C.; Handel, G.; Proff, P. The two main theories on dental bruxism. Ann. Anat. Anz. 2012, 194, 216–219. [Google Scholar] [CrossRef]
  20. Ilovar, S.; Zolger, D.; Castrillon, E.E.; Car, J.; Huckvale, K. Biofeedback for treatment of awake and sleep bruxism in adults: Systematic review protocol. Syst. Rev. 2014, 3, 42. [Google Scholar] [CrossRef] [Green Version]
  21. De La Hoz-Aizpurua, J.L.; Díaz-Alonso, E.; LaTouche-Arbizu, R.; Mesa-Jiménez, J. Sleep bruxism. Conceptual review and update. Med. Oral Patol. Oral Cir. Bucal. 2011, 16, e231–e238. [Google Scholar] [CrossRef] [Green Version]
  22. Balshi, T.J. An analysis and management of fractured implants: A clinical report. Int. J. Oral Maxillofac. Implant. 1996, 11, 660–666. [Google Scholar]
  23. Chrcanovic, B.R.; Kisch, J.; Albrektsson, T.; Wennerberg, A. Bruxism and dental implant treatment complications: A retrospective comparative study of 98 bruxer patients and a matched group. Clin. Oral Implant. Res. 2016, 28, e1–e9. [Google Scholar] [CrossRef] [PubMed]
  24. Misch, C.E. Contemporary Implantology; Mosby-Elsevier: St Louis, MO, USA, 2009. [Google Scholar]
  25. Koenig, V.; Wulfman, C.; Bekaert, S.; Dupont, N.; Le Goff, S.; Eldafrawy, M.; Vanheusden, A.; Mainjot, A.K.J. Clinical behavior of second-generation zirconia monolithic posterior restorations: Two-year results of a prospective study with Ex vivo analyses including patients with clinical signs of bruxism. J. Dent. 2019, 91, 103229. [Google Scholar] [CrossRef] [PubMed]
  26. Pirmoradian, M.; Naeeni, H.A.; Firouzbakht, M.; Toghraie, D.; Khabaz, M.K.; Darabi, R. Finite element analysis and experimental evaluation on stress distribution and sensitivity of dental implants to assess optimum length and thread pitch. Comput. Methods Programs Biomed. 2020, 187, 105258. [Google Scholar] [CrossRef] [PubMed]
  27. Li, T.; Kong, L.; Wang, Y.; Hu, K.; Song, L.; Liu, B.; Li, D.; Shao, J.; Ding, Y. Selection of optimal dental implant diameter and length in type IV bone: A three-dimensional finite element analysis. Int. J. Oral Maxillofac. Surg. 2009, 38, 1077–1083. [Google Scholar] [CrossRef] [PubMed]
  28. Zarei, I.; Khajehpour, S.; Sabouri, A.; Haghnegahdar, A.Z.; Jafari, K.D. Assessing the effect of dental implants thread design on distribution of stress in impact loadings using three dimensional finite element method. J. Dent. Biomater. 2016, 3, 233–240. [Google Scholar]
  29. Azcarate-Velázquez, F.; Castillo-Oyagüe, R.; Oliveros-López, L.G.; Torres-Lagares, D.; Martínez-González, Á.-J.; Pérez-Velasco, A.; Lynch, C.D.; Gutiérrez-Pérez, J.L.; Serrera-Figallo, M.A. Influence of bone quality on the mechanical interaction between implant and bone: A finite element analysis. J. Dent. 2019, 88, 103161. [Google Scholar] [CrossRef]
  30. Sivrikaya, E.C.; Guler, M.S.; Bekci, M.L. A comparative study between zirconia and titanium abutments on the stress distribution in parafunctional loading: A 3D finite element analysis. Technol. Health Care 2020, 10, THC-202305. [Google Scholar] [CrossRef]
  31. Radaelli, M.T.B.; Idogava, H.T.; Spazzin, A.O.; Noritomi, P.Y.; Boscato, N. Parafunctional loading and occlusal device on stress distribution around implants: A 3D finite element analysis. J. Prosthet. Dent. 2018, 120, 565–572. [Google Scholar] [CrossRef]
  32. Nishigawa, K.; Bando, E.; Nakano, M. Quantitative study of bite force during sleep associated bruxism. J. Oral Rehabilit. 2001, 28, 485–491. [Google Scholar] [CrossRef]
  33. UNE-EN ISO 14801:2016. Dentistry—Implants—Dynamic Loading Test for Endosseous Dental Implants; International Organization for Standardization: Geneva, Switzerland, 2017. [Google Scholar]
  34. Koca, O.L.; Eskitascioglu, G.; Usumez, A.; Eskitaşcıoğlu, G. Three-dimensional finite-element analysis of functional stresses in different bone locations produced by implants placed in the maxillary posterior region of the sinus floor. J. Prosthet. Dent. 2005, 93, 38–44. [Google Scholar] [CrossRef]
  35. Iplikçioğlu, H.; Akça, K. Comparative evaluation of the effect of diameter, length and number of implants supporting three-unit fixed partial prostheses on stress distribution in the bone. J. Dent. 2002, 30, 41–46. [Google Scholar] [CrossRef]
  36. Levadnyi, I.; Awrejcewicz, J.; Gubaua, J.E.; Pereira, J.T. Numerical evaluation of bone remodelling and adaptation considering different hip prosthesis designs. Clin. Biomech. 2017, 50, 122–129. [Google Scholar] [CrossRef] [PubMed]
  37. Fernández-Tresguerres-Hernández-Gil, I.; Alobera-Gracia, M.A.; Del-Canto-Pingarrón, M.; Blanco-Jerez, L. Physiological bases of bone regeneration II. The remodeling process. Med. Oral Patol. Oral Cir. Bucal. 2006, 11, 151–157. [Google Scholar]
  38. Hassler, C.R.; Rybicki, E.F.; Cummings, K.D.; Clark, L.C. Quantification of bone stresses during remodeling. J. Biomech. 1980, 13, 185–190. [Google Scholar] [CrossRef]
  39. Beaupré, G.S.; Orr, T.E.; Carter, D.R. An approach for time-dependent bone modeling and remodeling-theoretical development. J. Orthop. Res. 1990, 8, 651–661. [Google Scholar] [CrossRef]
  40. Afrashtehfar, K.I.; Afrashtehfar, C.D. Lack of association between overload and peri-implant tissue loss in healthy conditions. Evid. Based Dent. 2016, 17, 92–93. [Google Scholar] [CrossRef]
  41. Fabris, D.; Souza, J.C.; Silva, F.S.; Fredel, M.; Gasik, M.; Henriques, B. Influence of specimens’ geometry and materials on the thermal stresses in dental restorative materials during thermal cycling. J. Dent. 2018, 69, 41–48. [Google Scholar] [CrossRef]
  42. Favot, L.M.; Berry-Kromer, V.; Haboussi, M.; Thiébaud, F.; Ben Zineb, T. Numerical study of the influence of material parameters on the mechanical behaviour of a rehabilitated edentulous mandible. J. Dent. 2014, 42, 287–297. [Google Scholar] [CrossRef] [Green Version]
  43. Lin, C.L.; Chang, S.H.; Wang, J.C.; Chang, W.J. Mechanical interactions of an implant/tooth-supported system under different periodontal supports and number of splinted teeth with rigid and non-rigid connections. J. Dent. 2006, 34, 682–691. [Google Scholar] [CrossRef]
  44. Oliva Quecedo, J. Modelos de Cálculo Para Solicitaciones Estáticas y Dinámicas en Huesos. Aplicación a la Simulación Mediante Elementos Finitos de Impactos en El Fémur Humano. Ph.D. Thesis, Mecánica de Medios Contínuos y Teoría de Estructuras, Universidad Politécnica de Madrid, Madrid, Spain, 2007. [Google Scholar]
  45. Chou, H.-Y.; Jagodnik, J.J.; Muftu, S. Predictions of bone remodeling around dental implant systems. J. Biomech. 2008, 41, 1365–1373. [Google Scholar] [CrossRef]
  46. Chrcanovic, B.R.; Albrektsson, T.; Wennerberg, A. Bruxism and dental implants: A meta-analysis. Implant. Dent. 2015, 24, 505–516. [Google Scholar] [CrossRef]
  47. Chrcanovic, B.R.; Kisch, J.; Albrektsson, T.; Wennerberg, A. Bruxism and dental implant failures: A multilevel mixed effects parametric survival analysis approach. J. Oral Rehabilit. 2016, 43, 813–823. [Google Scholar] [CrossRef] [PubMed]
  48. Chrcanovic, B.R.; Kisch, J.; Albrektsson, T.; Wennerberg, A. Factors influencing the fracture of dental implants. Clin. Implant. Dent. Relat. Res. 2008, 20, 58–67. [Google Scholar] [CrossRef] [PubMed]
  49. Manfredini, D.; Bucci, M.B.; Bucci-Sabattini, V.; Lobbezoo, F. Bruxism: Overview of current knowledge and suggestions for dental implants planning. Cranio 2011, 29, 304–312. [Google Scholar] [CrossRef] [PubMed] [Green Version]
  50. Brocard, D.; Barthet, P.; Baysse, E.; Duffort, J.F.; Eller, P.; Justumus, P.; Marin, P.; Oscaby, F.; Simonet, T.; Benqué, E.; et al. A multicenter report on 1,022 consecutively placed ITI implants: A 7-year longitudinal study. Int. J. Oral Maxillofac. Implant. 2000, 15, 691–700. [Google Scholar]
  51. Moy, P.K.; Medina, D.; Shetty, V.; Aghaloo, T.L. Dental implant failure rates and associated risk factors. Int. J. Oral Maxillofac. Implant. 2005, 20, 569–577. [Google Scholar]
  52. Meyle, J.; Casado, P.; Fourmousis, I.; Kumar, P.; Quirynen, M.; Salvi, G.E. General genetic and acquired risk factors, and prevalence of peri-implant diseases—Consensus report of working group 1. Int. Dent. J. 2019, 69 (Suppl. 2), 3–6. [Google Scholar] [CrossRef] [Green Version]
  53. Adell, R.; Lekholm, U.; Rockler, B.; Brånemark, P.-I. A 15-year study of osseointegrated implants in the treatment of the edentulous jaw. Int. J. Oral Surg. 1981, 10, 387–416. [Google Scholar] [CrossRef]
  54. Cruz, M.; Lourenço, A.F.; Toledo, E.M.; Barra, L.P.D.S.; Lemonge, A.C.D.C.; Wassall, T. Finite element stress analysis of cuneiform and cylindrical threaded implant geometries. Technol. Health Care 2006, 14, 421–438. [Google Scholar] [CrossRef]
  55. Moeen, F.; Nisar, S.; Dar, N. A step by step guide to finite element analysis in dental implantology. Pak. Oral Dental J. 2014, 1, 164–169. [Google Scholar]
  56. Keyak, J.; Meagher, J.; Skinner, H.; Mote, C.D., Jr. Automated three-dimensional finite element modelling of bone: A new method. J. Biomed. Eng. 1990, 12, 389–397. [Google Scholar] [CrossRef]
  57. Huang, H.L.; Huang, J.S.; Ko, C.C.; Hsu, J.T.; Chang, C.H.; Chen, M.Y.C. Effects of splinted prosthesis supported a wide implant or two implants: A three-dimensional finite element analysis. Clin. Oral Implant. Res. 2005, 16, 466–472. [Google Scholar] [CrossRef] [PubMed]
  58. Winter, W.; Klein, D.; Karl, M. Micromotion of dental implants: Basic mechanical considerations. J. Med. Eng. 2012, 2013, 1–9. [Google Scholar] [CrossRef] [PubMed] [Green Version]
  59. Kong, L.; Liu, B.; Hu, K.J.; Li, D.H.; Song, Y.L.; Ma, P.; Yang, J. Optimized thread pitch design and stress analysis of the cylinder screwed dental implant. Hua Xi Kou Qiang Yi Xue Za Zhi 2006, 24, 509–512. [Google Scholar]
  60. Bicudo, P.; Reiß, J.; Deus, A.M.; Reis, L.; Vaz, M.F. Mechanical behaviour of dental implants. Procedia Struct. Integr. 2016, 1, 26–33. [Google Scholar] [CrossRef] [Green Version]
  61. Santiago, J.F.; Verri, F.R.; Almeida, D.A.D.F.; De Souza Batista, V.E.; Lemos, C.A.A.; Pellizzer, E.P.; Junior, J.F.S. Finite element analysis on influence of implant surface treatments, connection and bone types. Mater. Sci. Eng. C 2016, 63, 292–300. [Google Scholar] [CrossRef] [Green Version]
  62. Ao, J.; Li, T.; Liu, Y.; Ding, Y.; Wu, G.; Hu, K.; Kong, L. Optimal design of thread height and width on an immediately loaded cylinder implant: A finite element analysis. Comput. Biol. Med. 2010, 40, 681–686. [Google Scholar] [CrossRef]
Figure 1. Boundary conditions and loading state for the M-12 implant model (A). Boundary conditions and loading state for the Astra implant model (B). The point of application of the load is 5 mm above the implant, affecting the prosthetic abutment, although the implant platform appears directly in the diagram.
Metals 10 01132 g001
Figure 2. Flow diagram with information of the finite element analysis (FEA) model and the bone reconstitution model for each year of the study period considered (10 years).
Metals 10 01132 g002
Figure 3. Progress of the stress state for the M-12 implant (A). Progress of the stress state for the Astra implant (B). Because of the bone loss, peak stress in the interaction between bone and implant is relaxed. Curves shown in Figure 3 represent the peak stress in the interaction between bone and implant, and it is not related to the same location along the time.
Metals 10 01132 g003
Figure 4. Progress of the maximum stress over the 10-year period for the two implants tested in the present study. M-12 implant (AC). Astra implant (DF).
Metals 10 01132 g004
Figure 5. Progress of the contact surface loss between the cortical bone and the implant surface over the 10-year period. Bone loss at 5 and 10 years for the M-12 implant (A,B) and Astra implant (C,D).
Metals 10 01132 g005
Table 1. Misch’s bone density classification [7].
Bone DensityDescriptionAnatomical Location
D1Dense corticaeMandibular anterior area
D2Porous corticae and thick trabecularMandibular anterior area
Mandibular posterior area
Maxilla anterior area
Mandibular posterior areaPorous (thin) corticae and thin trabecularMaxilla anterior area
Maxilla posterior area
Mandibular posterior area
Maxilla anterior areaThin trabecularMaxilla posterior
Table 2. Initial data employed in the numerical models for the M-12 and Astra implants considering bone type (III). The structure and arrangement of the different tissues can be seen in Figure 1.
Data Employed in the Numerical Models Young Module (GPa)Poisson CoefficientDensity (g/cm3)
Implants1100.3-
Trabecular bone1.60.30.91
Cortical bone13.70.31.89
Table 3. Tooth surface loss between cortical bone and implant.
Tooth Surface Loss between Cortical Bone and ImplantTotal Surface Area (mm2)Surface Area Lost%
M-1218.8510.8157.3
Astra18.8512.4065.9

