Abstract
A mechanism to reduce the porosity by changing the arc angle during aluminum alloy welding was studied. Industrial computed tomography was used to scan the welds with different arc angles, and the scanned model was processed by a specific software package to obtain the digital size and position of weld pores. The forces acting on the pores in the molten pool explained the test results that the number of pores decreases and the average size increases. As the inclination angle of the arc increased, the vertical component that prevented the bubble from rising decreased, and the horizontal component that pushed the molten metal flow and promoted the nucleation and growth of the bubbles increased. A horizontal movement during the droplet transition as the arc inclination was produced, which was conducive to the growth and overflow of bubbles. The theoretical analysis and temperature field measured by a far-infrared with different torch angle showed that when the arc was tilted from 0, the shape of the molten pool changed from the circle to the ellipse. The long axis of the ellipse increased as the bevel angle of the arc increased. This showed that the molten metal existed a longer time for the bubbles to escape from the molten pool when the angle of the arc increased. The paper provides fundamental insights into a mechanism for porosity reduction during the welding of Al alloys.
1. Introduction
Defects in welds such as pores are important factors that determine weld quality [1,2,3]. The number, size and morphology of the defects have been found to severely impair the resistance at various stress levels in welds [4,5]. If porosity formation could be alleviated—or ideally eliminated—then this would confer substantial advantages in structural applications [6].
One way of reducing weld pores is to reduce the content of gas components in the molten metal. Specific measures include increasing the protection of the molten pool and arc, such as improving the protection of the molten pool by increasing the pressure of a protective gas [7]. Another way is to reduce the gas composition in welding materials and base materials that go into the molten pool [8]. The optimization of welding parameters is usually the approach that is considered [9,10,11].
Another way to reduce the number of weld pores is to help the bubbles overflow and escape from the molten metal. Arc-ultrasonic technology has been applied during welding in order to prevent pores, and the bubbles were able to escape due to the application of an ultrasonic frequency [12,13,14]. Laser welding assisted with a hot wire is a very effective approach to avoid pore formation [15]. Varying the arc pressure and alternating the shielding gas are ways to create a stirring action within the liquid weld metal and reduce the number of pores in welds [16]. Small weld pores, which are less than 300 µm in size, are redistributed or removed by remelting welds due to tungsten inert gas welding (TIG) dressing [17].
The following approaches were used to study welding porosity. During the welding process, the flow of the molten pool and the dynamic behavior of the keyhole were observed with a high-speed video camera, and the variation in the weld temperature was determined using an infrared (IR) thermal imaging system. For the finished weld, the pore morphology and pore types were analyzed by scanning electron microscopy (SEM) and energy dispersive spectroscopy (EDS) [1,15,18]. The nondestructive ultrasonic or laser ultrasonic techniques were used to analyze the porosity level in welds [13,14,19]. X-ray techniques have also become the commonly used methods to detect pores in welds [20,21]. Industrial computed tomography (ICT) has been used to determine the porosity and the number of pores in fabricated parts and in a single weld [6,18].
Currently, there are few studies about the effect of arc angle on welding pores. The object of this study is to investigate mechanisms to reduce the porosity during argon arc welding of aluminum alloys by changing the arc angle.
For our purposes, an aluminum alloy material that readily produces weld pores is selected as the test material. The relationship between weld pores and arc angle is studied by a digital method, ICT and a specific software package. A theoretical analysis of the forces in the molten pool is carried out, and the mechanical causes leading to a change in the pores is discussed. The temperature field of the molten pool during welding is measured by an IR thermal imaging system, and the reason of molten pool shape to reduce the pores with the changing of the inclination angle of the arc is also discussed.
2. Materials and Methods
The welding sample material was 6061 aluminum alloy; the specimen size was 180 mm × 75 mm × 2 mm. The welding wire material was ER5356 filler metal with a diameter of φ1.2 mm. The composition of welding materials are shown in Table 1. Argon (99.9%) was used as the shielding gas.

Table 1.
Composition of welding materials.
The welding power source was a CMT Advanced 4000 R nc system. To avoid poor repeatability due to manual welding, a robot (KR5 R1400) (KUKA Roboter GmbH, Augsburg, Bavaria, Germany) was used to drive the movement of the welding torch.
The welding process was carried out with a direct current and reverse polarity. The following welding parameters were constant: a 66 A welding current, a 0.0060 m/s welding speed, a 15-L/min flux of shielded gas, a 12-mm length of wire extension and room temperature (approximately 20 °C). The welding condition that changed is the arc angles. The varying tilt angle of the welding torch is shown in Table 2.
Table 2.
Tilt angle of the welding arc.
The backward welding method was adopted. A surfacing weld on the sample was used to avoid the adverse effect of different forms of base metal joints on the results. To prevent the oxide skin on the surface of the sample from affecting the test results, the surface of the sample was sanded with 200-grit sandpaper for 2 min before every welding process to transform the smooth surface into a rough surface. After sanding, the welding was done immediately.
An E95 infrared thermometer (FLIR) (FLIR Systems, Inc., Boston, MA, USA) was used to measure the temperature field of the molten pool during the welding process and the distance between the probe head and welded specimen was 1000 mm.
The welded specimens were scanned by the ICT equipment (XRayWorkX) (North Star Imaging, Inc., St. Paul, MN, USA) with a voltage of 200 kV and a current of 80 μA. The completed specimens were kept on the objective table of the ICT device as shown in Figure 1. The scanning parameters are as follows: the focal spot size was 16 microns; the microfocus focal spot mode and continuous scan type were used. The radiation coefficient of the sample was 0.06, the temperature in the room was 20 °C, the measuring temperature ranged from 300–1500 °C; the reflection temperature was 20 °C.
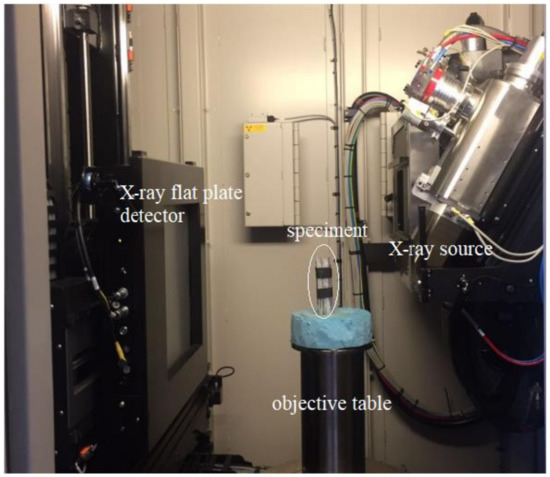
Figure 1.
Sample to be scanned on industrial computed tomography (ICT) equipment.
The models scanned with ICT were processed by VGSTUDIO software (FLIR Systems, Inc., Boston, MA, USA). A three-dimensional coordinate system was established on each sample and the spatial coordinates of every pore center were obtained. The fitting radius, volume and superficial area of each pore were calculated, and a perspective space view of the pores in the weld was obtained.
The minimum radius analyzed by this method was 0.1 mm. The length of the weld was 100 mm.
3. Results
3.1. Weld Pores in the Perspective Space View of the Welds
Figure 2 shows the perspective space view of the pores in the welds processed by VGSTUDIO software with a 15° oblique angle of the welding gun. The location, shape and size of the pores and their distribution can be seen. The digital analysis of the pores in the weld was done as follows:
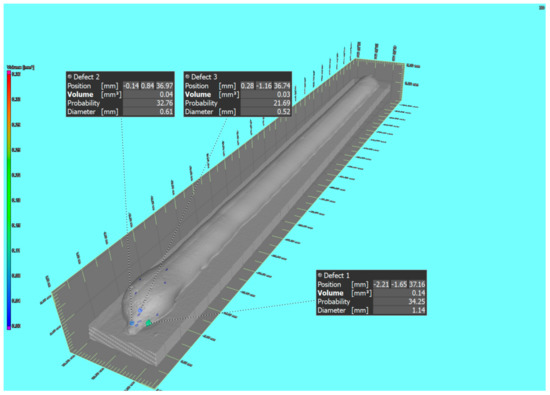
Figure 2.
Perspective space view of the pores in weld with 15° obliquity of the welding gun.
3.2. Arc Angle and Number of Pores
The angle between the axis of the welding gun nozzle and the vertical line of the upper surface of the specimen in the split face of the weld length direction was defined as the bevel angle or angle of inclination, and it was only a variable in the experiments.
Note: The method used in the research can only identify pores with a diameter of 0.1 mm and pores below 0.1 mm are regarded as errors of the system in Figure 3.
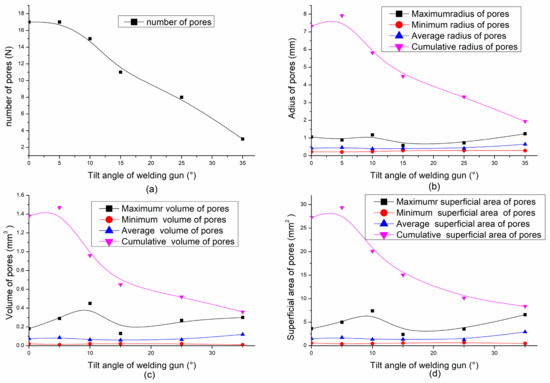
Figure 3.
Influence of arc tilt on welding pores for (a) number of pores and (b) radius of pores and (c) volume of pores and (d) superficial area of pores.
When the axis of the welding torch nozzle moved from the direction that was perpendicular to the sample towards the direction that was parallel to the sample and along the length of the weld, it was considered that the bevel angle changed from a small to large value. If the change in the angle was very little (≤5°), the number of weld pores did not change. Thereafter, as the oblique angle increased, the number of weld pores decreased. There was a monotonous decline, as shown in Figure 3a. This shows that as the bevel angle increased, the number of the pores in the weld decreased. B-spline curves are used on the graph according to the obtained data.
3.3. Arc Angle and Radius, Volume and Superficial Area of the Pores
There were 4 kinds of radii, volume and superficial area to describe the weld pores that included the maximum radius, minimum, average and cumulative value of the radius, volume and superficial area of the pores in each weld, as shown in Figure 3b–d.
The minimum radius of the pores in each weld did not change substantially as the bevel angle increased, and there was a monotonous incline with a slight upward trend as shown in Figure 3b. The trend for the largest radius of the pores in each weld had an approximately W-shaped curve as the bevel angle increased, and the smallest radius of the pores occurred at a bevel angle of 15°. The average radius of all pores in each weld also had a slight upward trend. For the sum of the total pore radius values in each weld there was almost no change in the sum, but it increased slightly when the inclination angle was below 5°; after that, as the bevel angle increased, the sum of the total pore radius values decreased and had a monotonous decline and concave curve.
As the bevel angle increased from 0° to 35°, the minimum volume, average volume and cumulative volumes of the pores in each weld changed as same as the variation of the pore radius. The change for the largest volume of the weld pores was only different and had an N-shaped curve. The smallest volume of the pores in the weld was also at a bevel angle of 15°, but maximum volume of the pores was at a bevel angle of 10°.
The superficial area and the volume of the weld pores had the same trend as the bevel angle increased from 0° to 35°.
The radius, volume and superficial area of the pores had the same rules as follows:
- (i)
- The average value of all pores in each weld had a slight upward trend;
- (ii)
- The sum value of the pores in each weld slightly increased.
when the inclination angle was below 5° and after this—as the bevel angle increased—the sum value of the superficial area of the pores decreased and had a monotonous decline and a convex shape.
4. Discussion
4.1. Causes of Pore Production in the Aluminum Alloy Welds
The base metal and the welding material in the heat of the arc are melted to form a molten pool and the hydrogen from the base and welding materials or auxiliary materials enter the molten pool due to inadequate protection during the welding process. The process mainly occurs in the front and the middle of the molten pool.
The aluminum alloy liquid has a relatively high solubility of hydrogen, so it is easy to dissolve a large amount of hydrogen in the aluminum alloy molten pool. On other hand, the solubility of hydrogen decreases sharply when the aluminum alloy molten becomes solid, so there is a large amount of hydrogen from the crystallized solid to enters the aluminum alloy liquid at the solidification front [6].
Because aluminum alloy materials are good thermal conductors, the cooling rate of the molten pool was very fast, and the dendrite formation was severe during solidification, due to the high degree of undercooling during the cooling process.
The precipitated hydrogen atoms combine to form hydrogen molecules, which aggregate to form hydrogen bubbles that nucleate, grow and float upward. Most of the bubbles do not have enough time to overflow and be released from the surface of the molten pool and remain in the solidified weld to form pores. On other hand, the dendrites prevent the bubbles from leaving the molten pool. This crystal process takes place at the bottom of the back half of the molten metal.
4.2. Pore Size Trends
The total number of pores in each weld decreased much, as shown in Figure 3a, as the inclination angle α increased. The average radius, average volume, and average surface area of a pore in single weld increased slightly when the inclination angle α increased, as shown in Figure 3b–d. The causes of these phenomena are discussed next.
4.3. Forces Acting on the Molten Weld Metal
A schematic diagram of the force of the molten pool is shown in Figure 4a. There were arc, Lorentz force, plasma shear, buoyancy force and Marangoni forces in the molten pool during GTAW [22]. There was also the impact of the metal droplets on the molten pool during gas metal arc welding process in this research. Plasma shear was due to the arc plasma moving radially outwards on the weld pool surface, causing a drag force and was therefore a function of the dynamic viscosity and radial velocity of the shielding gas [22].
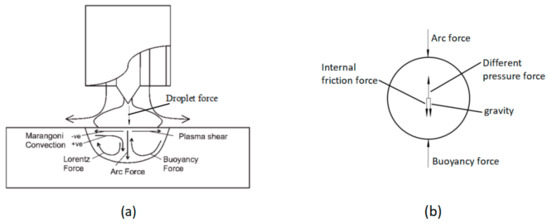
Figure 4.
(a) Forces acting on liquid weld metal and (b) forces acting on a bubble in molten pool.
4.4. Forces Acting on the Bubbles
To understand the formation mechanism of the pores and the effect of hydrogen on pore formation, there are three main aspects that need to be considered: (i) the dynamics of bubble nucleation in the melt, (ii) the driving force for bubble growth and (iii) bubble flow in the weld pool and their entrapment [6].
The plasma force acts on the upper surface of the molten pool and its direction is perpendicular to the molten pool height. The bubbles are nonferromagnetic and are not subjected to the Lorentz force.
It is assumed that affection of the droplet force and the plasma force and the Lorentz force for bubbles were too small to consider. The forces that acted on the bubbles in the molten pool are shown Figure 4b. The forces on the bubbles included the liquid buoyancy , their own gravity and the combined force of the pressure difference between different parts of the volume. When bubbles move in a liquid, they also experience a viscous resistance , which is called internal friction. The bubbles in the molten pool were also affected by the arc force .
The mechanical formula for floating bubbles was established as follows for all the forces acting on the bubble.
The liquid buoyancy and the combined force are the power to promote the bubble to float in the molten pool and the viscous resistance , the gravity of the bubble and the arc force provide the resistance to the bubble to float. is the attraction of the earth to the gas in the bubble and very small.
If Formula (1) is true, the bubbles can rise and may overflow and escape from the metal surface of the molten pool if the time is sufficient. If Formula (1) is not true—or if Formula (1) is true, but the time is not sufficient—the bubbles would stay in the molten pool and eventually form pores in the weld.
The effect of the arc force on the bubbles in the molten pool is discussed since the forces and are constant and and are small as the inclination angle change, so we assumed that they are all constant during the bubble survival period.
This work mainly studies the influence of arc tilt on all forces. Before and after the arc tilt, if there is for the forces no change or the change is small enough to be ignored, it will not be discussed.
4.5. Vertical Component of the Arc Force
The arc force directly acts on the surface of the molten pool and forms a pressure on the liquid metal. The pressure is transmitted to the bubble through the metal liquid in Figure 5a. This pressure force prevents the bubbles from rising in the liquid metal. When the welding gun is tilted, the arc force also forms an inclination angle with respect to the surface of the molten pool. The vertical direction force of the on the bubble stops the bubbles from rising is as fellow shown in Figure 5b:
where is the component of the arc force in the vertical direction and has a cosine relation with the tilt angle α.
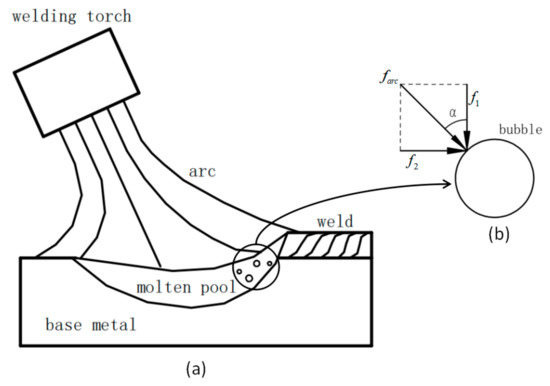
Figure 5.
(a) Bubble schematic during welding and (b) force analysis diagram on bubbles in molten pool.
The arc force perpendicular to the surface of the weld pool, causes a convection of the molten metal, its direction of the movement is as shown in Figure 4a. The convection can cause that the direction of a force acting on the bubble is downward and prevents the bubbles from rising.
What is the relationship between the trend of weld porosity change and arc inclination angle?
In fact, the forces acting on the bubble in the molten pool are complex and are difficult to be tested and observed directly, so it is difficult to obtain the law of bubble change from the quantitative analysis of bubble forces. The influence of arc tilt for the pores change is more difficult to carry out quantitative analysis. In order to be able to analyze the influence of the arc tilt on the bubbles, from the known results, that is, the results of the pores are observed to look for the law and then speculate the trend of the force acting on bubble.
Figure 6a shows the contrast curve for the number of actual pores and the number of pores calculated according to the cosine of the arc inclination angle. Figure 6b shows the contrast curve for the actual total volume of the pores and the total volume calculated according to the cosine of the arc inclination angle. It can be seen in Figure 6 that the number and total volume of the weld pores are approximately consistent with the trend of the calculation of the number and total volume according to the cosine of the arc inclination angle. From Formula (2), there is also cosine law between the force and arc angle α that is, the number of pores and the total volume in the weld seam had a similar trend with the change in the vertical division force of the arc.
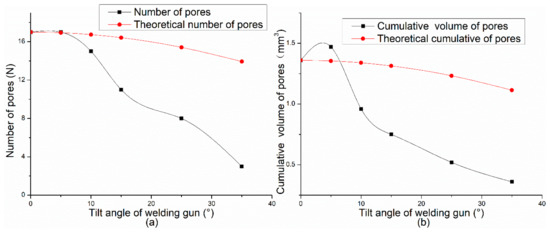
Figure 6.
(a) Calculation and actual curve of the pore number and (b) calculation and actual curve of the pore total volume.
Therefore, it can be inferred that the vertical component of the arc force is one of the main factors affecting the weld pores.
Formula (1) in the vertical direction can therefore be changed to Formula (3):
The value of decreases as the angle α increases. This means that the right side of Formula (3) decreases because the tilt of welding torch does not cause other forces to change the lift of the bubble. That is, the resistance force decreases and the bubble takes a decreased amount of time to overflow and be released from the molten pool. Therefore, there are fewer bubbles in the weld.
The result above shows that the decrease of vertical resistance caused by the tilt of the welding gun is the one important factor to leads to a reduction in the number and total volume of the pores.
4.6. Horizontal Component of the Arc Force and Stirring Power
When the torch is tilted, the arc force acting on the surface of the molten pool decomposes a horizontal component of the force as a function of α, as shown in Formula (4):
where is the horizontal component of the arc force, which has sine relation with the tilt angle α.
The value of promotes the molten metal in the front and middle of the molten pool to flow towards the rear of the molten pool, so it has a stirring effect on the molten pool.
How does the inclination of the weld gun promote the growth of average pore size in Figure 3? When the welding gun is tilted, due to the stirring effect of the , a liquid metal flow is formed. This movement of the metal liquid causes the hydrogen bubbles and molecules from the solidification front in the molten pool to move together. This movement not only promotes the accumulation of hydrogen molecules, it forms hydrogen bubble cores and also promotes the integration of hydrogen molecules into existing bubbles. The value of accelerates the growth of bubbles in the molten pool. Therefore, the average radius and average volume increase as the tilt angle α increases, as shown in Figure 3a,c.
In addition, the flow of the molten metal in the solidification front drives the bubbles to escape from the dendrites that block them, so more bubbles are able to float upward.
The stirring force makes bubbles easier to increase in size and obtain buoyancy to float up. This is another way the bubbles easily overcome resistance while floating upward in the molten pool. The number of weld pores also decreases due to these reasons.
4.7. Arc Angle and Shape of the Molten Pool
How does the shape of the molten pool change with change of the arc inclination angle? The following text is a theoretical analysis.
The arc inclination angle is the only changing factor in the analysis and all other welding parameters and other conditions do not change. Therefore, there are no need to consider the changes of the thermophysical properties in welding materials, arcs and environmental.
The following assumptions are made for the convenience of analysis.
- (1)
- Assuming arc column is a cylinder, the arc column does not spread along its length direction;
- (2)
- The arc is insulated with the outside and there is no heat exchange with the environment;
- (3)
- The temperature on a line parallel to the arc axis is equal at everywhere;
- (4)
- The temperatures at each point on the base metal are equal.
In the arc cross section, the temperature is different at different points from the center of the arc. The highest temperature is at the arc center, but lower at out side. When the temperature of a certain spot of the arc on the heating area is lower than a certain value, it could not make the base material melted. On the contrary, the material could only be melted by the arc temperature over certain value. All points in the arc that can melt the base material form a cylinder, this cylinder in the arc is defined a melting arc column and the base material area under the melting arc column is melted to form a molten pool, as shown in Figure 7a.
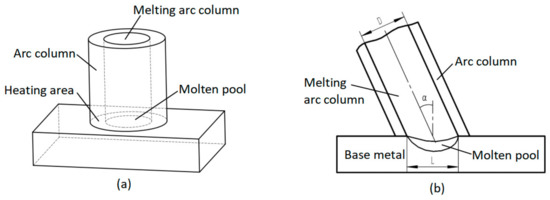
Figure 7.
(a) Schematic diagram of melting arc column in arc and (b) schematic diagram of weld pool size after arc tilt.
The shape changes of the molten pool under the melting arc column on the surface of the base material are only discussed below. As the inclination angle began to increase from 0, the shape of the molten pool also changes from a circle to an ellipse on the surface of the base metal. The minor axis of the ellipse equals the diameter of the melting arc column and the long axis of the ellipse has a cosine relation with the tilt angle α as shown in Figure 7b.
where L is the long axis of the ellipse and also is the long axis of the molten pool, D is the diameter of the melting arc column.
When arc is tilted from 0, the long axis of the ellipse is directly proportional to the reciprocal of the cosine of the tilt angle α from Equation (6).
When the arc inclines, the melting area of the upper surface of the base material changes from a circle to an ellipse and the melting area becomes larger and the density of the arc power decreases and the energy density per unit area could also decreases. Therefore, the shape of the molten pool is still elliptical, but its size is smaller than one above theoretical analysis.
When arc is tilted from 0, the shape of the molten pool changes from the circle to the ellipse and the time of the presence of liquid metal increases.
4.8. Arc Angle and Length of the Molten Pool
In fact, the arc will dissipate heat to the outside, so there is a temperature gradient along the arc axis; the arc column will diverge along the length and the arc shape is mostly a bell jar or a frustum cone. The temperature at different point on the base metal is also different during welding process. The influence of these realistic factors on the shape of the molten pool is more complicated. Hence, the welding temperature field was measured by a far infrared thermometer to detect the shape and size of the molten pool.
The relationship between the molten pool length and arc angle is analyzed below.
Table 3 shows the shape and size of the molten pool at the 0.5 s point and one second, two second and three second points under different arc angles. The shape of the molten pool is defined as the area above melting point of aluminum, that is, 660 °C in Table 3. The molten pool at 0.5 s point can be regarded as the initial molten pool shape. It can be seen from Table 3 that the initial molten pool shape changes from a circle to an ellipse as the arc angle increases. The molten pool is circle at the 0.5 s point and the 1 s point, and an approximate circular molten pool drags a tail at the 2- and 3-s point when the arc is not inclined. When the arc is inclined, the molten pool becomes elliptical. As the inclination of the arc increases, the long axis of the ellipse increases, this means that the length of the molten pool increases, and the width of the molten pool remains constant at different points. The length of the molten pool is longest at 3 s point, the molten pool length at 2 s point is shorter than that at 3 s point, the molten pool length at 0.5 s point is shortest. The length of the molten pool at 3 s point appears too long, and this is due to the small sample size and small heat capacity.
Table 3.
Arc angle and length of the molten pool.
The length of the molten pool at four points increased with an increase in the inclination angle of the arc. This means that the molten metal existed for an extended time in the molten pool, and there was an increased amount of time for the bubbles to overflow and escape the molten pool, so the number of pores was thus reduced.
4.9. Analysis of Molten Metal Flow
The flowing path and direction of molten metal in the molten pool are shown in Figure 8 by the action of arc force.
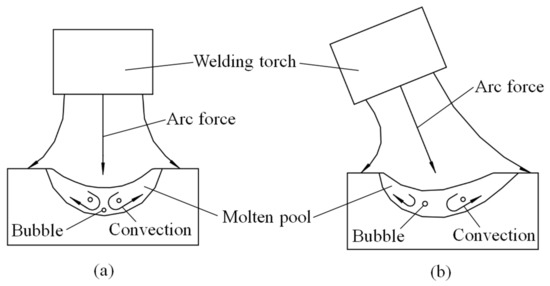
Figure 8.
Schematic diagram of the flowing molten metal in molten pool (a) arc vertical of the welding surface, (b) arc tilt of the welding surface.
When the arc is vertical to the surface of the molten pool, the arc force pressure acts on the surface of the molten metal. The arc force pressure is the largest at the center, and the pressure is the smallest at the surrounding of the molten pool. The flowing path and direction of the molten metal are downwards at the center and when touching the bottom of the molten pool, the flowing direction turn along the bottom towards the outer edges of the molten pool, as shown in Figure 8a.
When the arc is inclined, under the action of the horizontal component of the arc force, that is, the stirring force of the molten pool, more liquid metal flows to the tail of the molten pool, and less liquid metal flows to the front, as shown in Figure 8b. The arc tilt makes the flowing path of most of the liquid becomes longer. On the other hand, the long axis of the molten pool ellipse also becomes longer. The two factors are superimposed, and most of the liquid flows longer and exists more time, which is conducive to the growth and overflow of bubbles. Thereby reducing the porosity in the weld metal.
4.10. Influence of the Droplet Impact
The droplet transit intermittently into the molten pool. The impact of the droplet transition on the molten pool is analyzed below.
When the arc is perpendicular to the surface of the molten pool, the gravity of the droplet is in the same direction as the arc force, and the direction of the droplet movement is vertically downward. The droplet falls generally in the center of the molten pool, and the impact force on the molten pool is downward in area of droplet contact, and then the droplets push the liquid in other area to move outward, as shown in Figure 9a. The impact of the droplet transition causes a downward force on the bubble and prevent bubbles from rising.
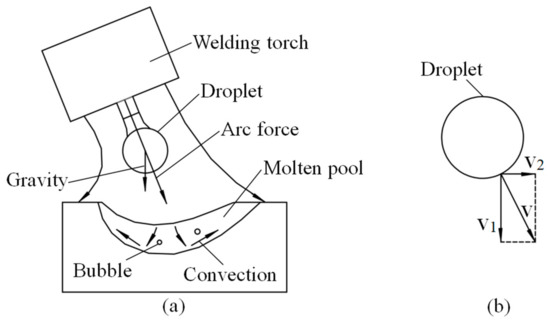
Figure 9.
Schematic diagram of the droplet impact (a) droplet force diagram; (b) droplet movement diagram.
When the arc is tilted, except the effects described above, under the action of the horizontal component of the arc force, the droplet produces a horizontal moving speed. When it transitions to the molten pool, it is superimposed with the liquid movement of the molten pool analyzed in 4.9. More liquid move to the tail of the molten pool and moving speed is faster to the tail. The movement of the droplets is shown in Figure 9b. After the arc is tilted, the transition of the droplets causes more liquid to flow towards the tail and faster flowing speed of the molten metal. It is more easily to take away the hydrogen molecules in the solidification front, while the existence time of the molten pool does not change, the bubbles are more likely to grow up and overflow from the liquid metal surface. The weld pores also reduces.
5. Conclusions
A mechanism to reduce pores during argon arc welding of aluminum alloys by changing arc angle was investigated. Our findings are as follows:
- (1)
- The number of pores in the aluminum alloy weld decreased monotonously as the bevel angle of the welding torch increased;
- (2)
- The average value of the radius, volume and surface area of the pores in the single weld increased as the bevel angle of the welding torch increased;
- (3)
- The sum value of the radius, volume and surface area of the pores in the single weld decreased as the bevel angle of the welding torch increased;
- (4)
- The vertical component of the arc force was the main factor that prevented the bubbles from floating;
- (5)
- The horizontal component of the arc force was the main factor driving the nucleation and growth of the bubbles in the molten pool;
- (6)
- The droplet transition was beneficial to the growth and overflow of bubbles in the molten pool as the arc was tilted and the porosity in the weld decreased;
- (7)
- When the arc was tilted from 0, the initial shape of the molten pool changed from a circle to an ellipse. The long axis of the ellipse increased as the bevel angle of the arc increased, and the minor axis of the ellipse was constant;
- (8)
- The shape of the molten pool changed from a circle to an ellipse as the arc angle increased—the larger the tilt angle, the longer the long axis of the ellipse;
- (9)
- There was an extended period of time for the welding pores to overflow and escape from the molten pool as the length of the molten pool increased.
Author Contributions
S.C. and Y.S. conceived the project, P.Z. take part in to prepare the testing equipment. S.C. performed all experiments, S.C. and Y.C. performed the data analysis, S.C. and Y.S. led the results interpretation, S.C. and Y.C. led the study writing, with all authors contributing. All authors have read and agreed to the published version of the manuscript.
Funding
This work was supported by the National Natural Science Foundation of China under Grant No 51790174, the Guangdong Province Applied Major Project under Grant No: 2015B090920006 and Guangdong University Engineering Technology Research (Technology Development) Center under Grant No: 2017GCZX003.
Acknowledgments
The authors would like to thank Jianlin Ju of North Star Imaging (NSI) for his help in sample scanning and image processing. Xi Chen proposed amendments to the text.
Conflicts of Interest
The authors declare no conflict of interest.
References
- Liu, H.; Yanga, S.; Xie, C.; Zhang, Q.; Cao, Y. Microstructure characterization and mechanism of fatigue crack initiation near pores for 6005A CMT welded joint. Mater. Sci. Eng. A 2017, 707, 22–29. [Google Scholar] [CrossRef]
- Seto, N.; Katayama, S.; Matsunawa, A. Porosity formation mechanism and suppression procedure in laser welding of aluminium alloys. Weld. Int. 2001, 15, 191–202. [Google Scholar] [CrossRef]
- Rack, A.; Helwig, H.-M.; Butow, A.; Rueda, A.; Matijasevic-Lux, B.; Helfen, L.; Goebbels, J.; Banhart, J. Early pore formation in aluminium foams studied by synchrotron-based microtomography and 3-D image analysis. Acta Mater. 2009, 57, 4809–4821. [Google Scholar] [CrossRef]
- Marko, A.; Raute, J.; Linaschke, D.; Graf, B.; Rethmeier, M. Porosity of LMD manufactured parts analyzed by Archimedes method and CT. Int. J. Mater. Res. 2018, 60, 11. [Google Scholar] [CrossRef]
- Busachi, A.; Erkoyuncu, J.; Colegrove, P.; Martina, F.; Ding, J. Designing a WAAM based manufacturing system for defense application. Procrdia CIRP 2015, 37, 48–53. [Google Scholar] [CrossRef]
- Huang, J.L.; Warnken, N.; Gebelin, J.C.; Strangwood, M.; Reed, R.C. On the mechanism of porosity formation during welding of titanium alloys. Acta Mater. 2012, 60, 3215–3225. [Google Scholar] [CrossRef]
- Ham, H.-S.; Oh, D.-S.; Cho, S.-M. Measurement of arc pressure and shield gas pressure effect on surface of molten pool in TIG welding. Sci. Technol. Weld. Join. 2012, 17, 594–600. [Google Scholar] [CrossRef]
- Shtrikmana, M.M.; Pinskiia, A.V.; Filatovb, A.A.; Koshkinb, V.V.; Mezentsevab, E.A.; Gukb, N.V. Methods for reducing weld porosity in argon-shielded arc welding of aluminium alloys. Weld. Int. 2011, 25, 457–462. [Google Scholar] [CrossRef]
- Norris, J.T.; Robino, C.V.; Hirchfeld, D.A.; Perricone, M.J. Effects of Laser Parameters on Porosity Formation: Investigating Millimeter Scale Continuous Wave Nd: YAG Laser Welds. Weld. Res. 2011, 90, 198–203. [Google Scholar]
- Zhu, C.; Tang, X.; He, Y.; Lu, F.; Cui, H. Characteristics and formation mechanism of sidewall pores in NG-GMAW of 5083 Al-alloy. J. Mater. Process. Technol. 2016, 238, 274–283. [Google Scholar] [CrossRef]
- Chi, C.-T.; Chao, C.-G.; Liu, T.-F.; Wang, C.-C. Optimal parameters for low and high voltage electron beam welding of AZ series magnesium alloys and mechanism of weld shape and pore formation. Sci. Technol. Weld. Join. 2008, 13, 199–211. [Google Scholar] [CrossRef]
- Zhua, Q.; Lei, Y.; Wang, Y.; Huang, W.; Xiao, B.; Ye, Y. Effects of arc-ultrasonic on pores distribution and tensile property in TIG welding joints of MGH956 alloy. Fus. Eng. Des. 2014, 89, 2964–2970. [Google Scholar] [CrossRef]
- Chen, Q.; Ge, H.; Yang, C.; Lin, S.; Fan, C. Study on Pores in Ultrasonic-Assisted TIG Weld of Aluminum Alloy. Metals 2017, 7, 53. [Google Scholar] [CrossRef]
- Diot, G.; Koudri-David, A.; Walaszek, H.; Guégan, S.; Fliflfla, J. Non-destructive Testing of Porosity in Laser Welded Aluminium Alloy Plates: Laser Ultrasound and Frequency-Bandwidth Analysis. J. Nondestruct. Eval. 2013, 32, 354–361. [Google Scholar] [CrossRef]
- Mazar Atabaki, M.; Ma, J.; Liu, W.; Kovacevic, R. Pore formation and its mitigation during hybrid laser/arc welding of advanced high strength steel. Mater. Des. 2015, 67, 509–521. [Google Scholar] [CrossRef]
- Campbell, S.W.; Galloway1, A.M.; McPherson, N.A. Arc pressure and weld metal fluid flow while using alternating shielding gases. Part 1: Arc pressure measurement. Sci. Technol. Weld. Join. 2013, 18, 591–596. [Google Scholar] [CrossRef]
- Yi, H.-J.; Lee, Y.-J.; Lee, K.-O. TIG Dressing Effects on Weld Pores and Pore Cracking of Titanium Weldments. Metals 2016, 6, 243. [Google Scholar] [CrossRef]
- Zhang, Y.; Chena, G.; Zhou, C.; Jiang, Y.; Zhong, P.; Li, S. Pores formation in laser–MAG welding of 42CrMo steel. J. Mater. Process. Technol. 2017, 245, 309–317. [Google Scholar] [CrossRef]
- Hernández-Ortega, J.J.; Zamora, R.; LópezInt, J.; Faura, F. Analysis of vacuum melting, ultrasonic, and radiographic techniques for gas porosity evaluation in die castings. J. Adv. Manuf. Technol. 2013, 67, 745–757. [Google Scholar] [CrossRef]
- Youssef, Y.M.; Chaijaruwanich, A.; Hamilton, R.W.; Nagaumi, H.; Dashwood, R.J.; Lee, P.D. X-ray microtomographic characterisation of pore evolution during homogenisation and rolling of Al–6Mg. Mater. Sci. Technol. 2006, 22, 1087–1093. [Google Scholar] [CrossRef]
- Bacaicoa, I.; Lütje, M.; Sälzer, P.; Umbach, C.; Brückner-Foit, A.; Heim, H.; Middendorf, B. Comparative investigation of two-dimensional imaging methods and X-ray tomography in the characterization of microstructure. Int. J. Mater. Res. 2017, 59, 829–836. [Google Scholar] [CrossRef]
- Campbell1, S.W.; Galloway, A.M.; McPherson, N.A. Arc pressure and fluid flow during alternating shielding gases. Part 2: Arc force determination. Sci. Technol. Weld. Join. 2013, 18, 597–602. [Google Scholar] [CrossRef]

© 2020 by the authors. Licensee MDPI, Basel, Switzerland. This article is an open access article distributed under the terms and conditions of the Creative Commons Attribution (CC BY) license (http://creativecommons.org/licenses/by/4.0/).