Review

A Review of the Serrated-Flow Phenomenon and Its Role in the Deformation Behavior of High-Entropy Alloys

1
The Bredesen Center for Interdisciplinary Research and Graduate Education, The University of Tennessee, Knoxville, TN 37996, USA
2
Department of Materials Science and Engineering, The University of Tennessee, Knoxville, TN 37996, USA
3
State Key Laboratory for Advanced Metals and Materials, University of Science and Technology Beijing, Beijing 100083, China
*
Author to whom correspondence should be addressed.
Metals 2020, 10(8), 1101; https://doi.org/10.3390/met10081101
Submission received: 10 July 2020 / Revised: 6 August 2020 / Accepted: 11 August 2020 / Published: 13 August 2020

Abstract

:
High-entropy alloys (HEAs) are a novel class of alloys that have many desirable properties. The serrated flow that occurs in high-entropy alloys during mechanical deformation is an important phenomenon since it can lead to significant changes in the microstructure of the alloy. In this article, we review the recent findings on the serration behavior in a variety of high-entropy alloys. Relationships among the serrated flow behavior, composition, microstructure, and testing condition are explored. Importantly, the mechanical-testing type (compression/tension), testing temperature, applied strain rate, and serration type for certain high-entropy alloys are summarized. The literature reveals that the serrated flow can be affected by experimental conditions such as the strain rate and test temperature. Furthermore, this type of phenomenon has been successfully modeled and analyzed, using several different types of analytical methods, including the mean-field theory formalism and the complexity-analysis technique. Importantly, the results of the analyses show that the serrated flow in HEAs consists of complex dynamical behavior. It is anticipated that this review will provide some useful and clarifying information regarding the serrated-flow mechanisms in this material system. Finally, suggestions for future research directions in this field are proposed, such as the effects of irradiation, additives (such as C and Al), the presence of nanoparticles, and twinning on the serrated flow behavior in HEAs.

1. Introduction

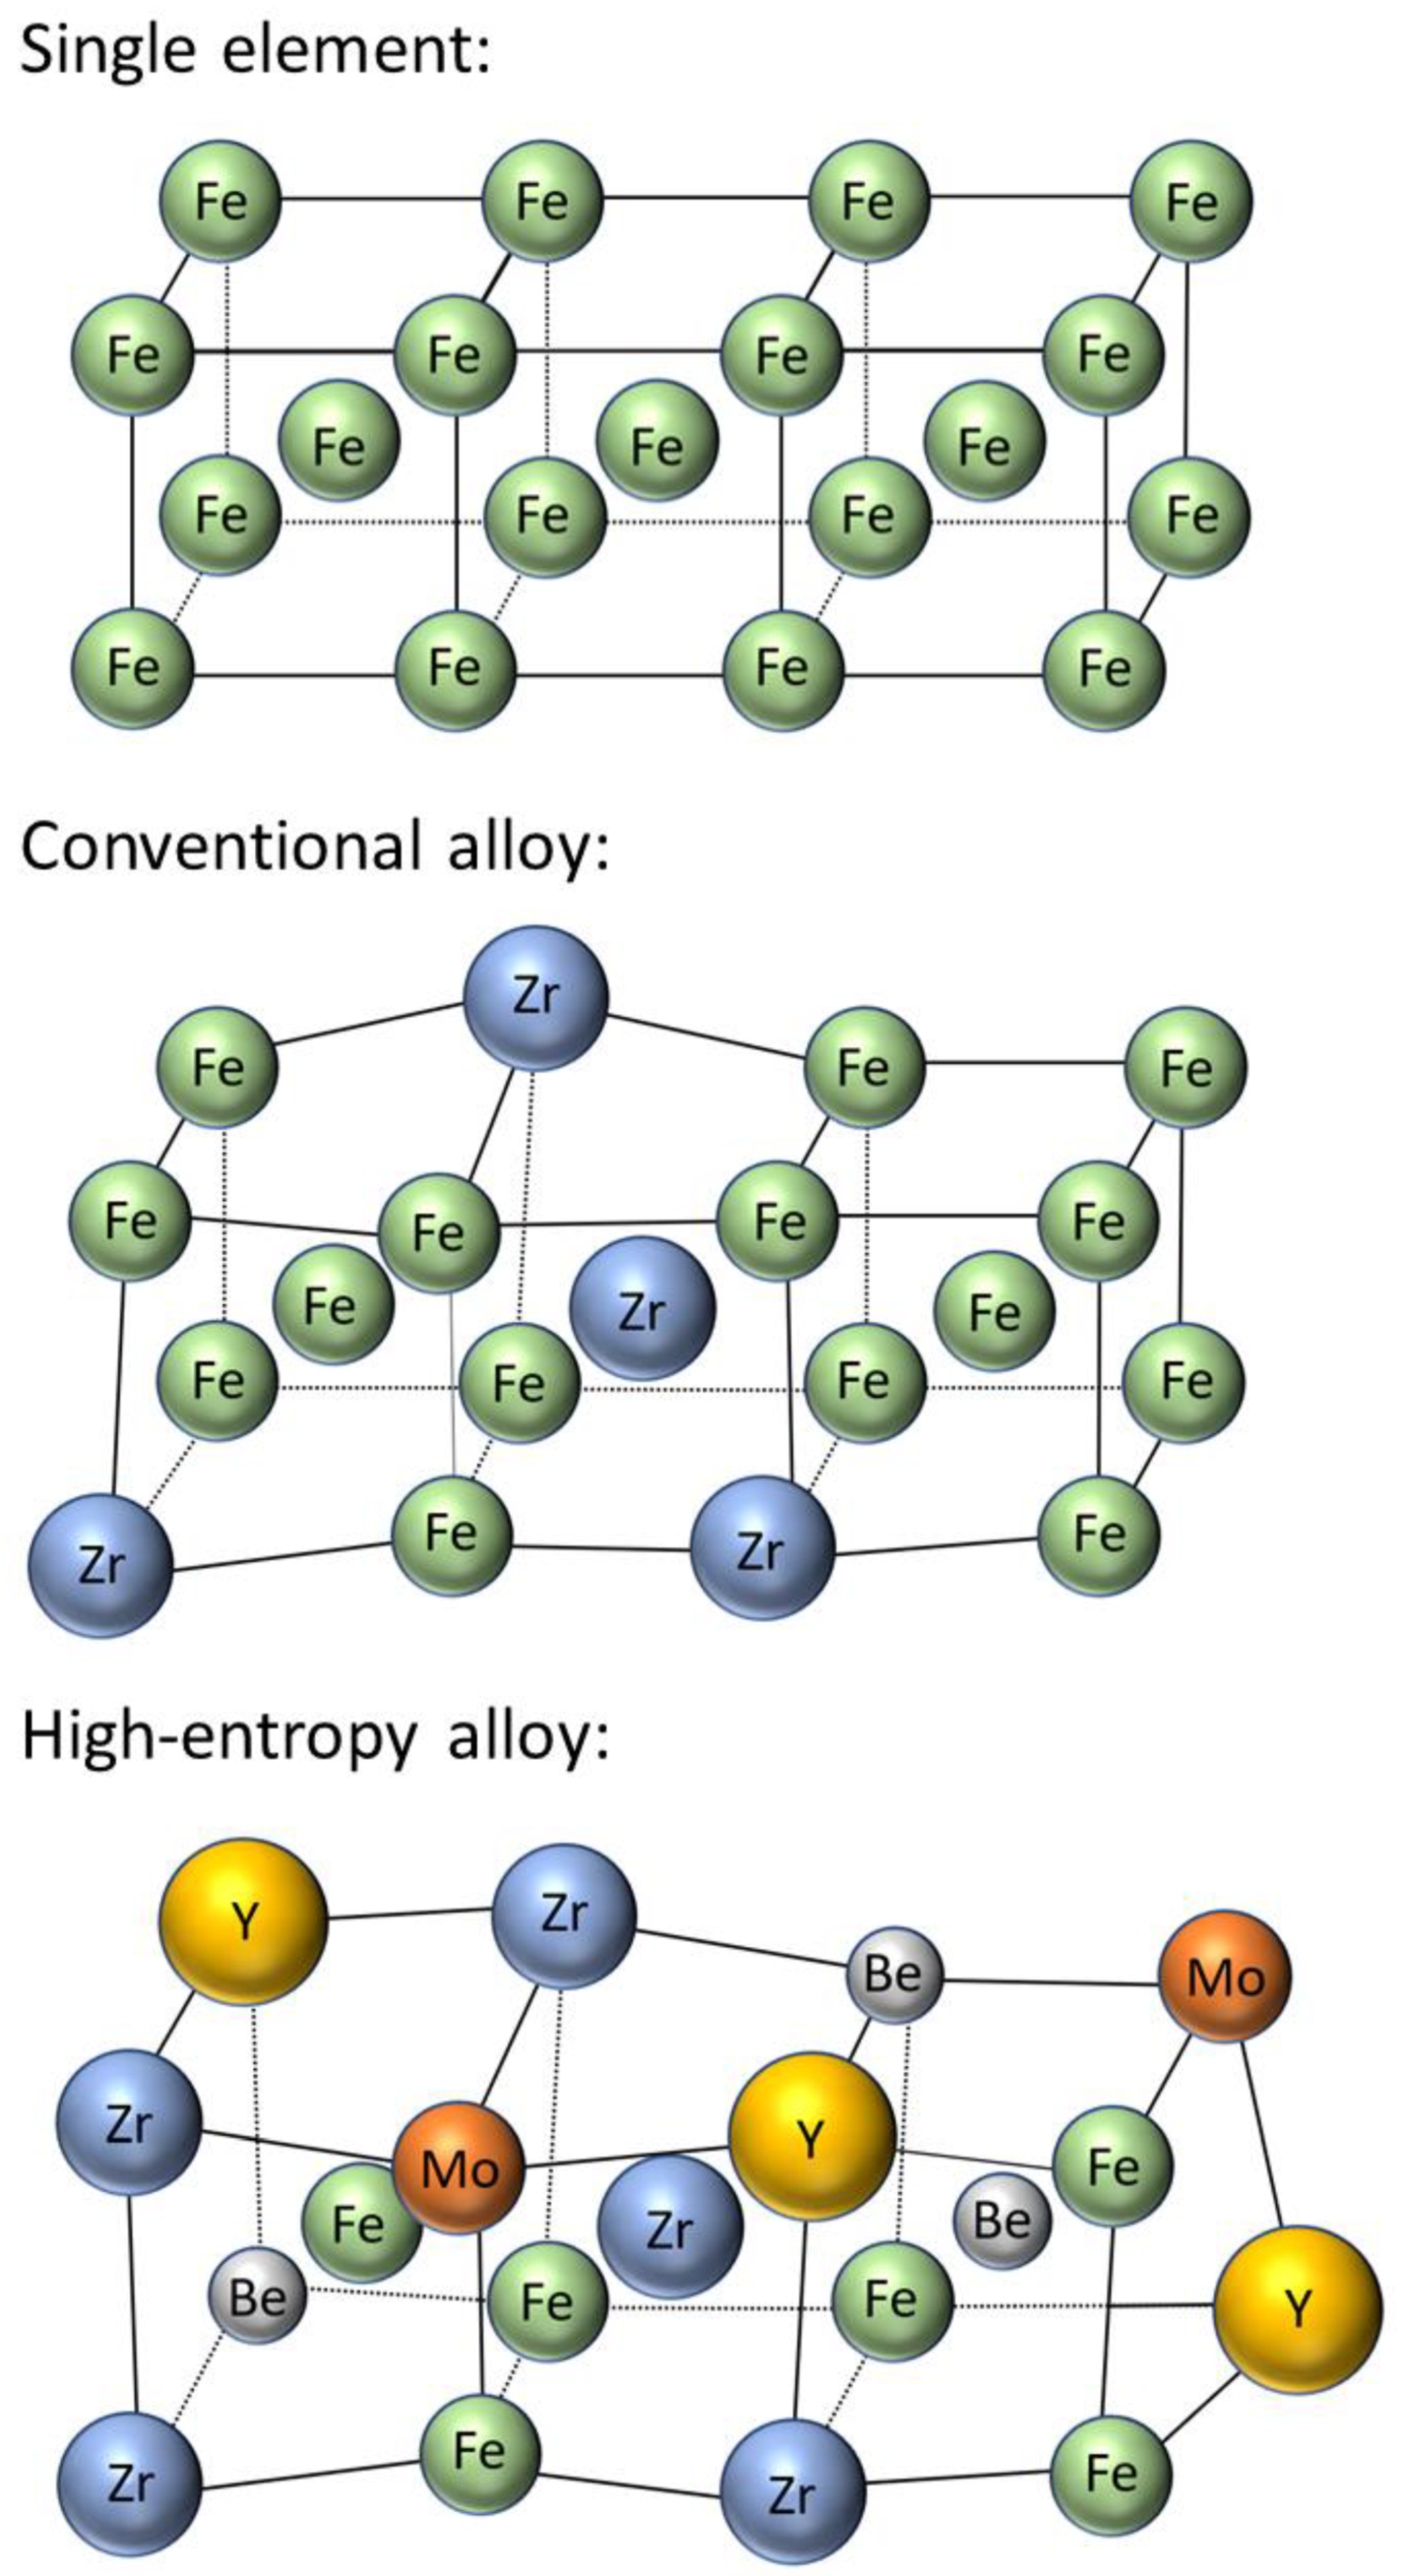
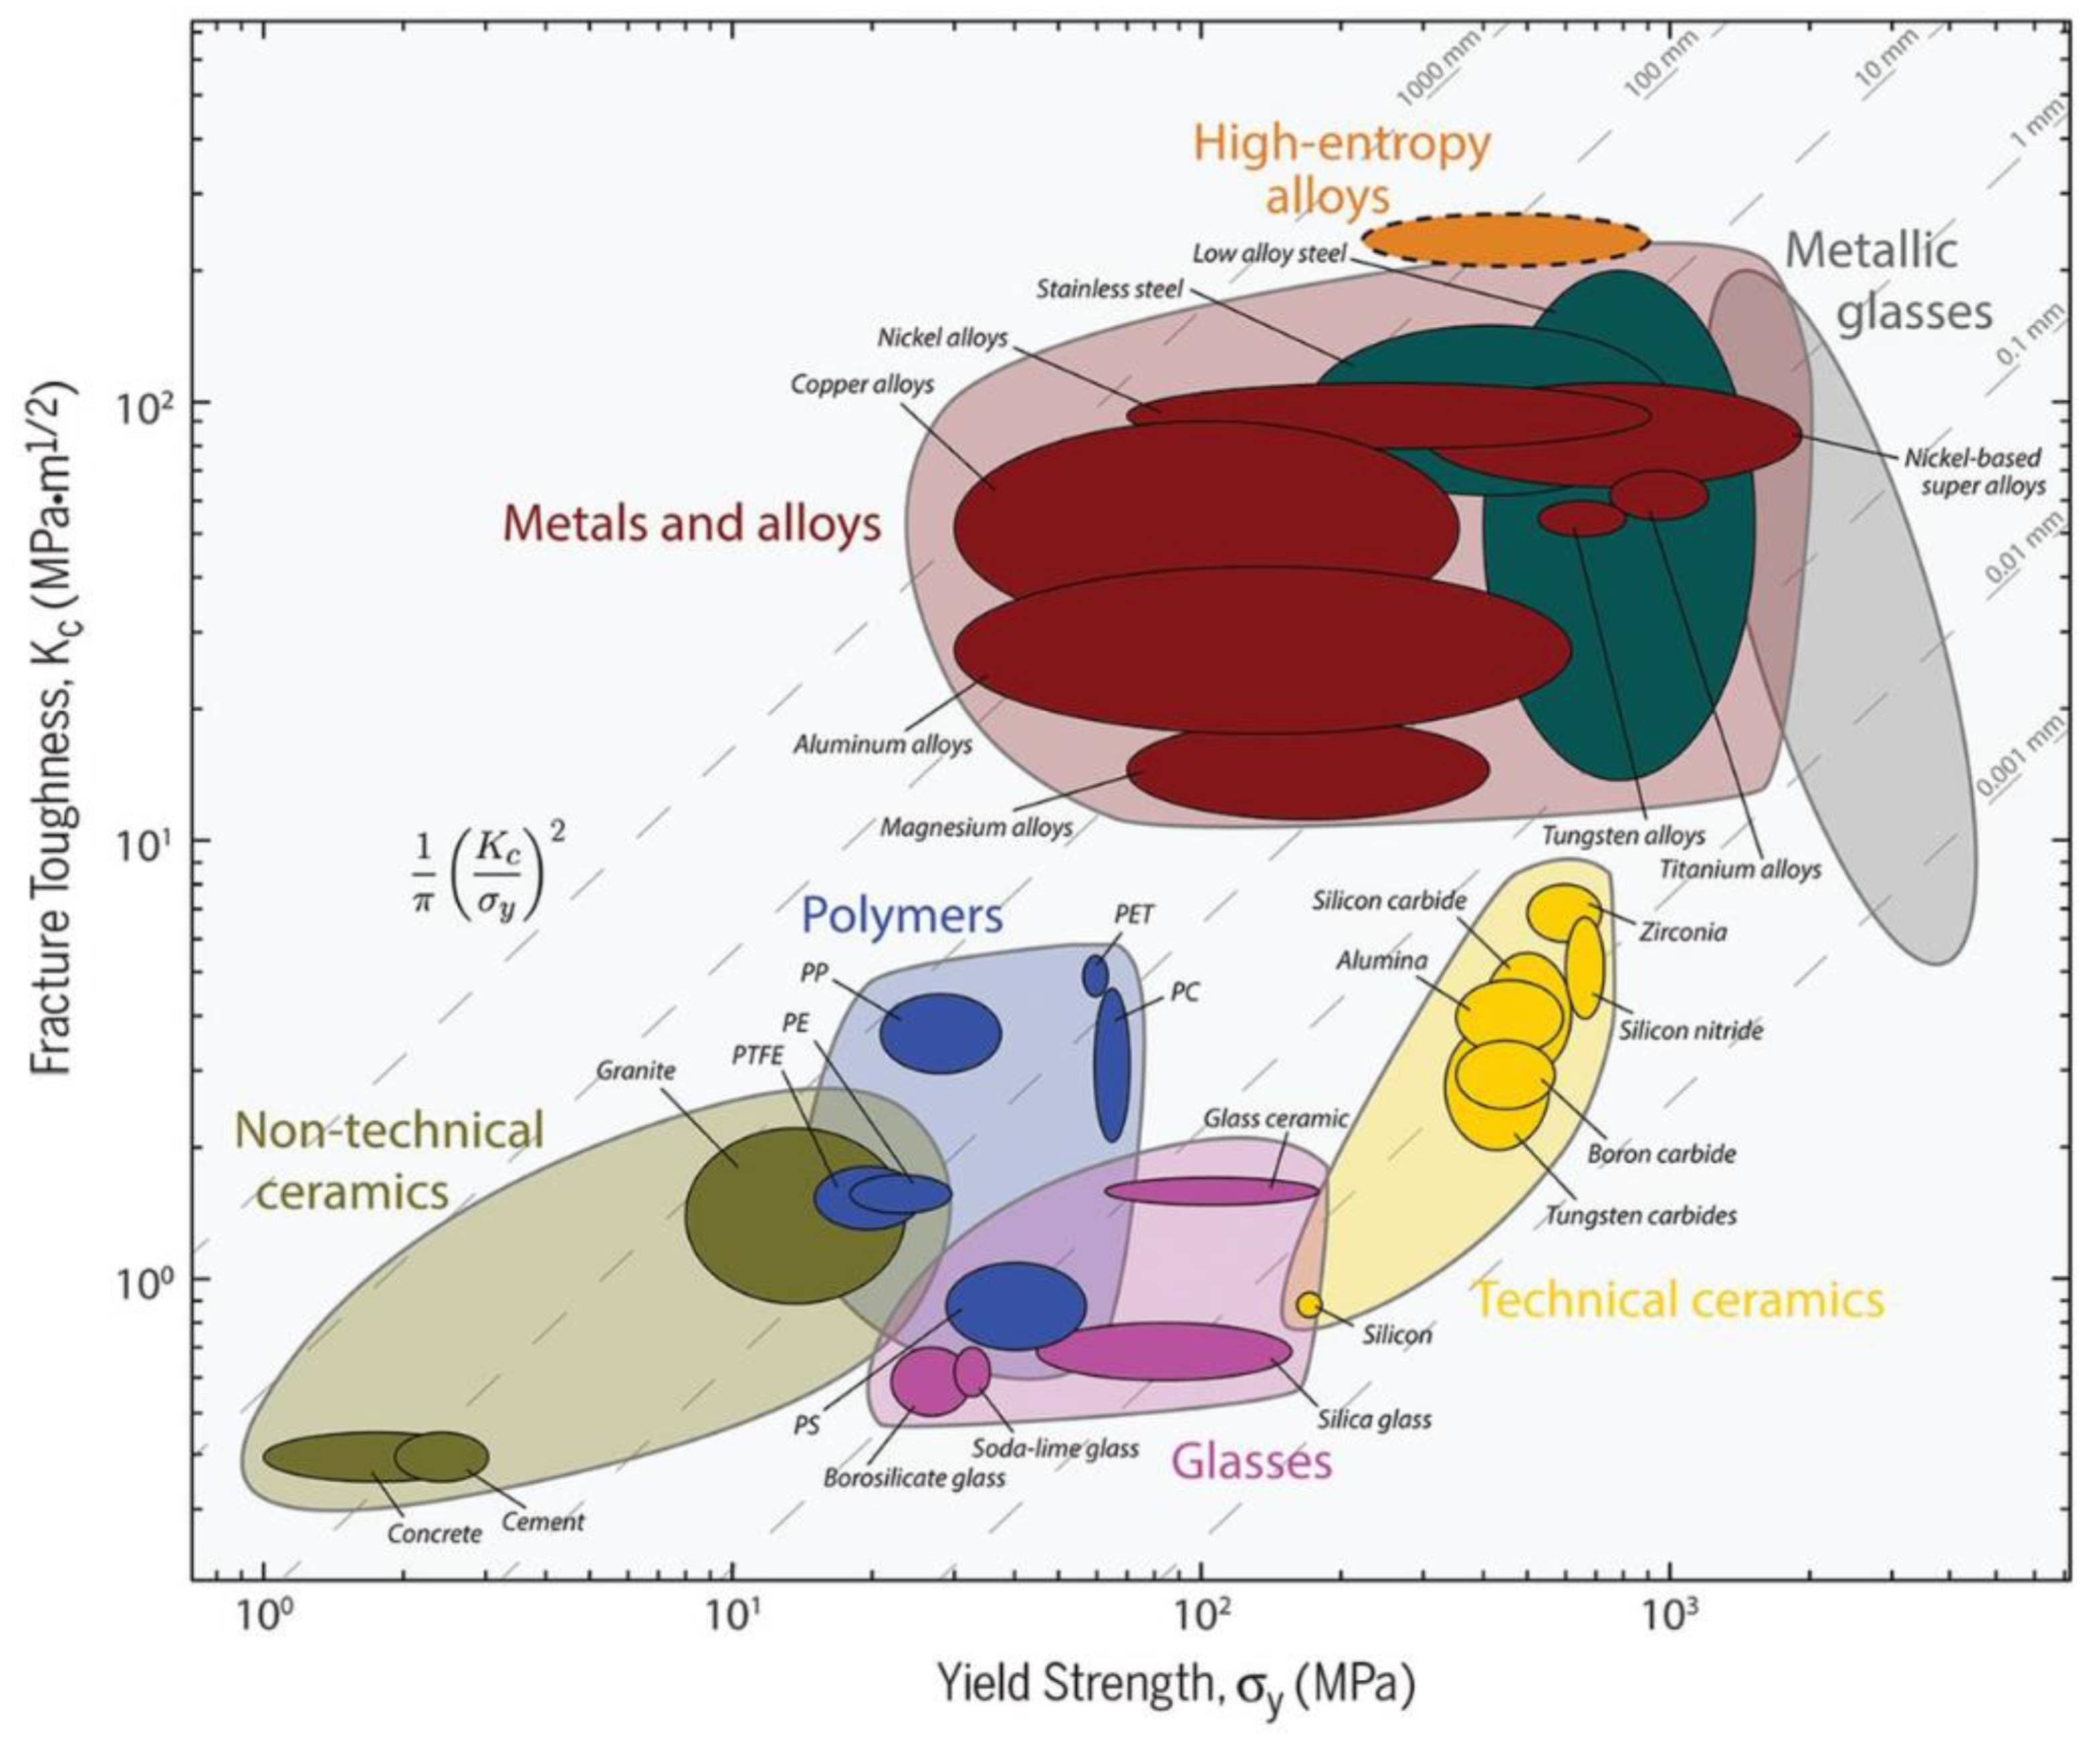
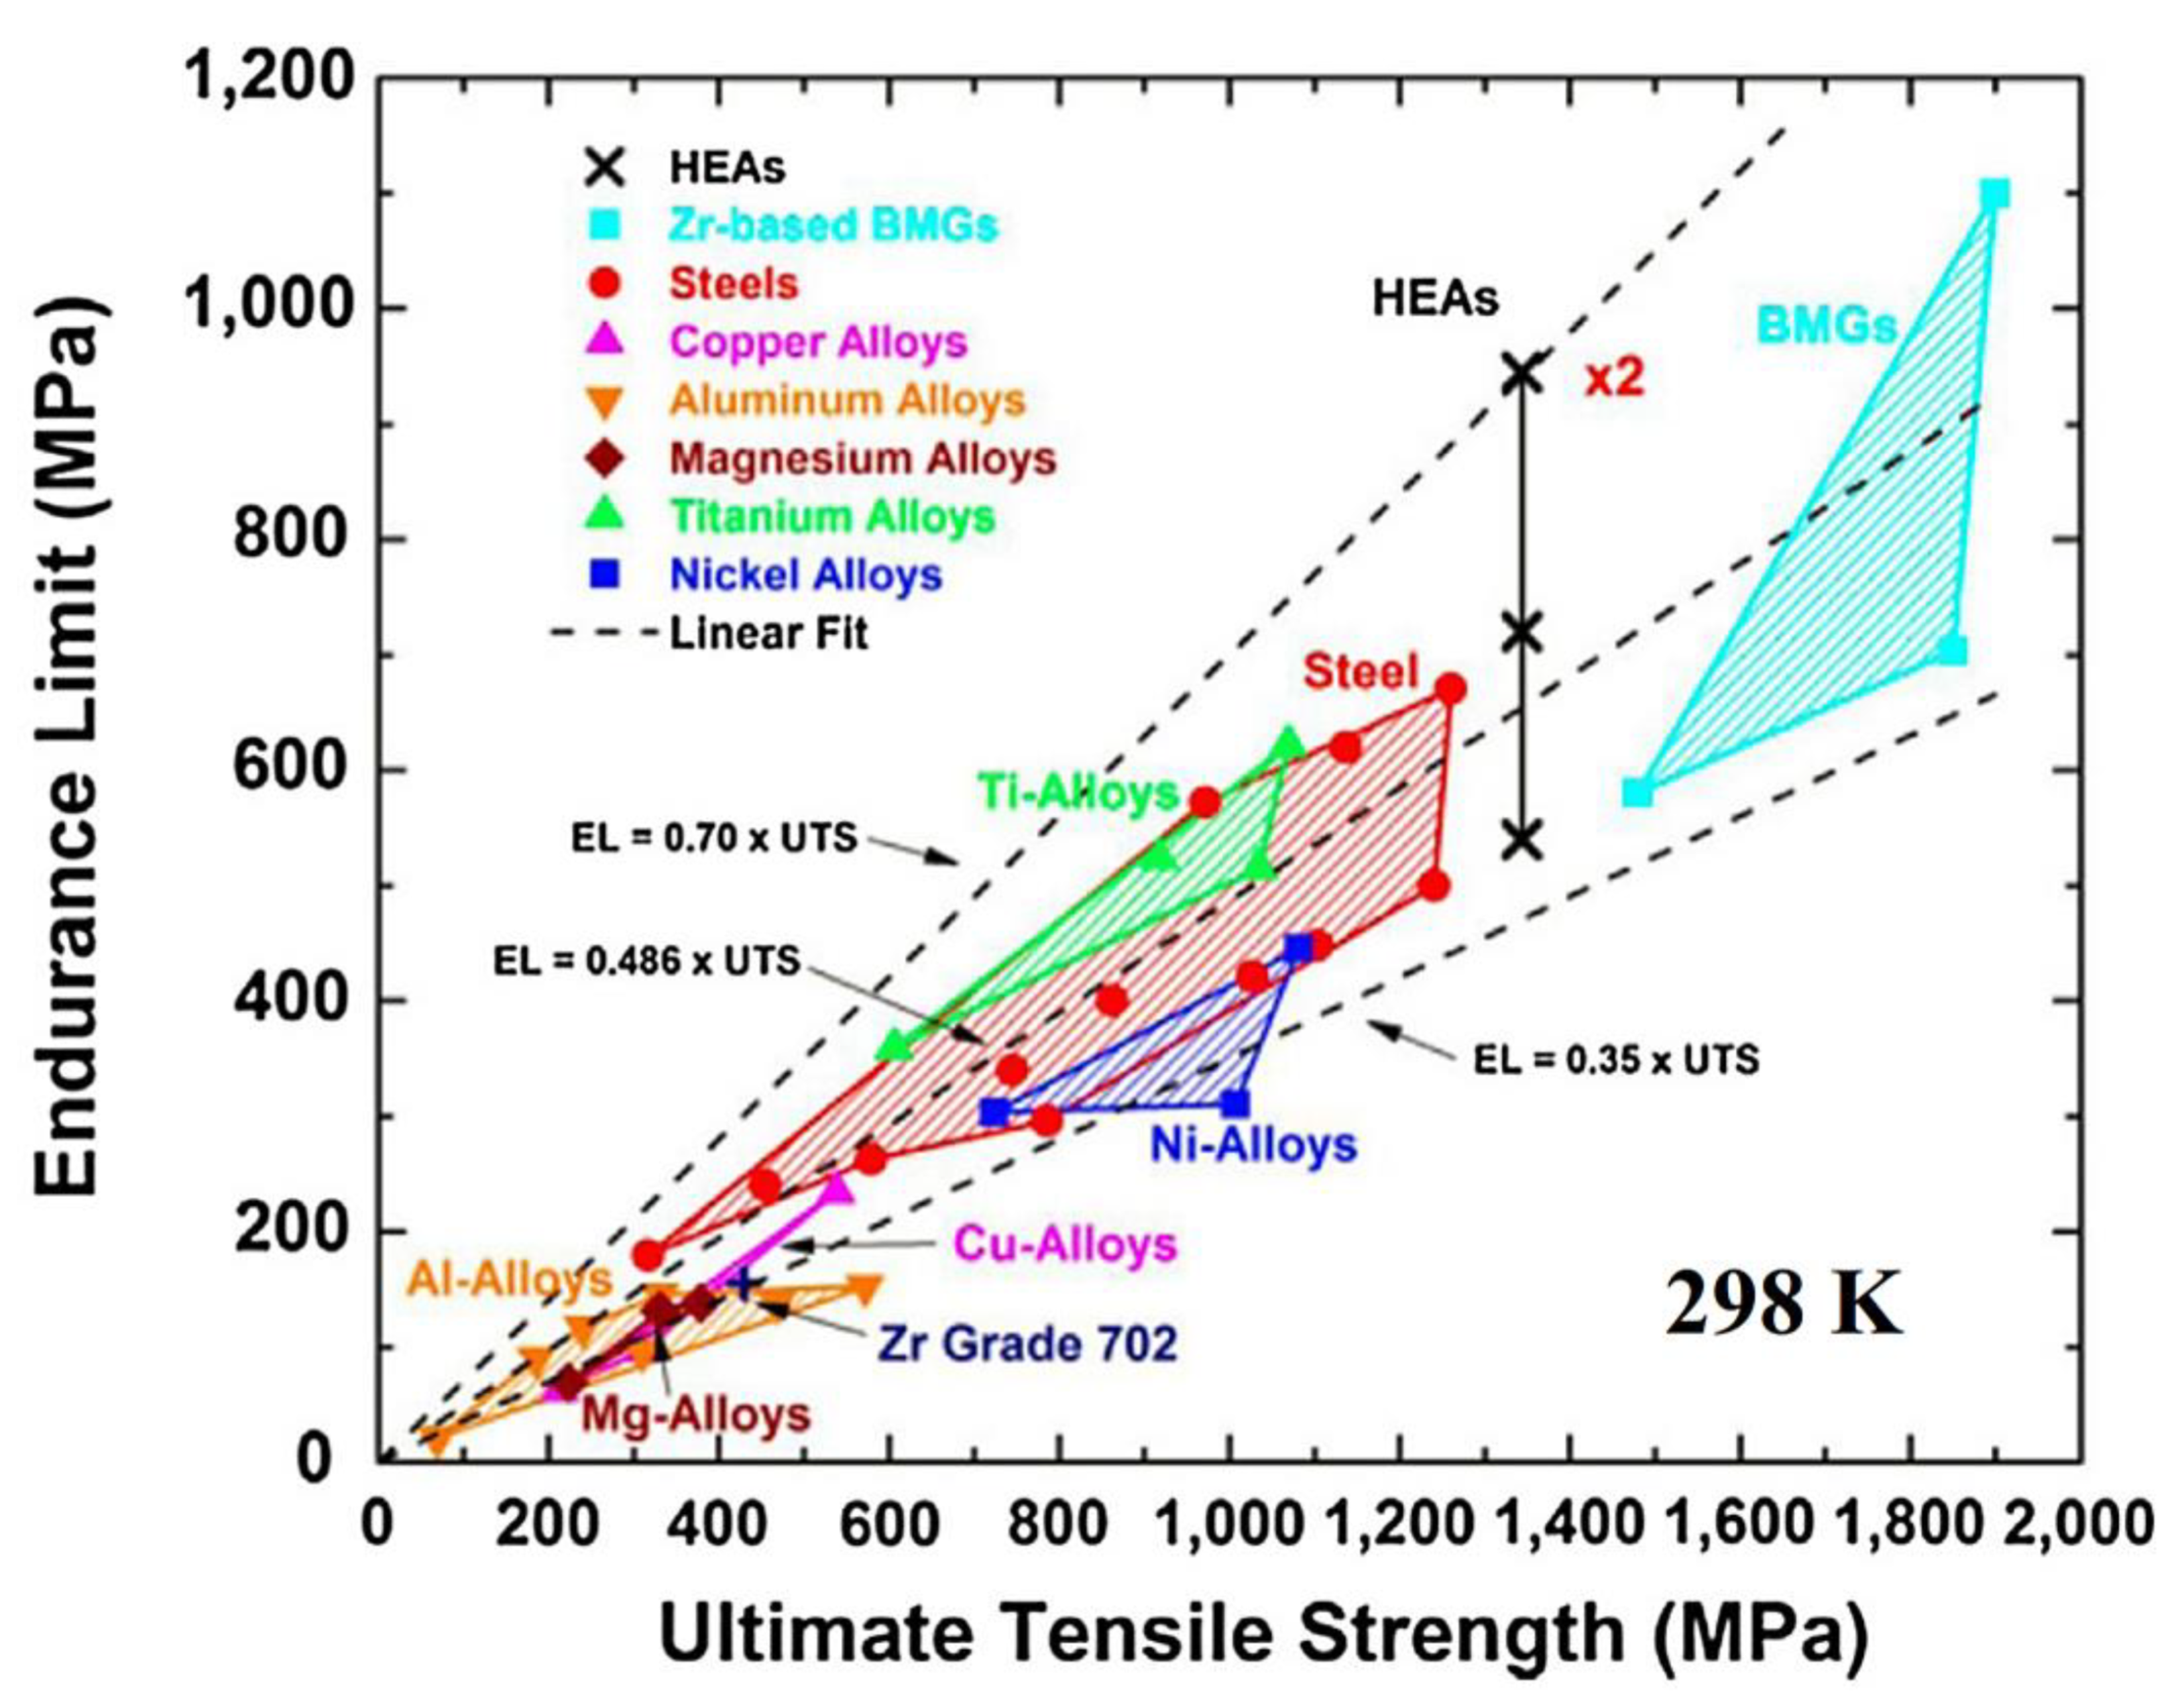
1.1. High-Entropy Alloys

High-entropy alloys (HEAs) are an important class of materials that emerged in the earlier part of this century [1,2]. Background investigations on HEAs officially began circa 1996, which resulted in five publications on the subject in 2004 [1,2,3,4,5]. HEAs are a type of complex concentrated alloy that typically consists of five or more (some HEAs with four elements have also been reported) principal elements with atomic concentrations that vary from 5 to 35 atomic percent (at.%) [1,2,6,7,8]. This combination of elements leads to a high mixing entropy that favors disordered solid solutions at elevated temperatures [9,10]. An HEA is also defined as having a configurational entropy (ΔSconf) of 1.5R or more, where R is the ideal gas constant [11]. The configurational entropy of an alloy can be calculated with Equation (1) [12]:
Δ S c o n f = R i n 1 n i Ln 1 n i
where R is the ideal gas constant, and 1/ni is the atomic fraction of the ith element in the alloy. In the case of an equiatomic alloy, 1/ni can be written as Xi, where Xi equals the atomic percentage of the element, which gives ΔSconf = RLnXi. Therefore, the primary elements in HEAs, in principle, can produce an alloy that has more than twice the configurational entropy, as compared to conventional alloys (0–0.7R) [13]. This relatively high entropy, as well as not having one primary element, results in several effects that account for the unique properties exhibited by HEAs, such as the high-entropy effect, severe lattice distortion, sluggish diffusion, and the cocktail effect [13,14].
It is commonly accepted that the high-entropy effect explains why HEAs often are observed to form only one or two primary phases, while the Gibbs’s phase rule indicates that they could form five or more phases [13,14,15,16]. This effect also corresponds to a relatively lower Gibbs free energy of mixing for the solid-solution phases in the alloy, as determined by the following equation [13,14,15]:
Δ G m i x = Δ H m i x T Δ S m i x
where ΔGmix, ΔHmix, T, and ΔSmix are the Gibbs free energy of mixing, the enthalpy of mixing, the temperature, and the entropy of mixing, respectively. Since the intermetallics consist of highly ordered structures, the increase in ΔSmix is often sufficient to lower the ΔGmix of the solid-solution phases to below that of the ΔGmix of the corresponding intermetallic phases in HEAs [13,15]. Consequently, solid-solution phases are more energetically favorable than intermetallic phases in many HEAs. However, there is still controversy regarding the true effect of high entropy on the solid-solution stability of HEAs. For instance, recent research suggests that the mutual solubility of constituent elements in the primary structure of the HEAs is the contributing factor for only one or two primary phases in the matrix [15]. Therefore, more investigative work is needed to determine the true mechanism for the high solid-solution stability of HEAs.
Another factor contributing to the unique properties of HEAs is known as the lattice distortion effect, which corresponds to the random distribution of elements in the matrix [17,18]. This random distribution leads to a large amount of lattice distortion due to a lower adherence to the Hume-Rothery rules than conventional alloys [13]. Figure 1 compares the lattice structure of a monoatomic metal and a multiatomic alloy with an HEA [14]. It is apparent from the figure that the lattice of the HEA is significantly more distorted, as compared to the other metals. The severe lattice distortion is thought to enhance the strength, hardness, and thermal and electrical resistance of HEAs by disrupting dislocation motion and increasing the mean free path of electrons and phonons [13,14,17].
Furthermore, the random distribution of elements (and lattice-potential energy) in the alloy may also be a contributing factor to the sluggish diffusion of atoms and vacancies to lattice sites of lower energies [13,19]. This sluggish diffusion effect results in the potential beneficial properties of slower grain growth [2], exceptional elevated-temperature stability [20], high-temperature strength [21], and a higher recrystallization temperature. However, there is still some debate regarding the validity of the sluggish-diffusion concept [18,22,23,24,25].
The last effect is the cocktail effect, which states that inter-element interactions give rise to unusual behaviors, as well as average composite properties (rule-of-mixtures) [26]. It should also be mentioned that the composite properties arise from the mutual interactions among the different elements, as well as the severe lattice distortion [27]. This phenomenon has been described as an overall effect that arises from the composition, structure, and microstructure that can result in enhanced properties [26,28]. For example, the cocktail effect has been cited as a contributing factor for the high magnetization and electrical resistance, high strength, and excellent plasticity of a FeCoNi(AlSi)0.2 HEA [29].
In terms of their properties, HEAs exhibit good corrosion resistance [30,31,32,33,34,35], high fatigue resistance [36,37,38,39,40,41], high strength and fracture toughness [17,42,43,44,45,46,47], notable resistance to shear failure [48], decent irradiation stability [49,50,51,52,53,54,55,56,57,58], biocompatibility [59,60,61], good cryogenic tensile and fracture properties [46,62,63,64,65], and excellent wear resistance [66,67]. Figure 2 presents an Ashby plot that compares the fracture toughness and yield strength of HEAs with several other material systems [46,47]. As can be seen, the HEAs have fracture-toughness values that exceed almost every material on the graph. Furthermore, this alloy has comparable yield strength values with those of stainless steels. Figure 3 displays the endurance limit and ultimate tensile strength for HEAs and conventional alloys [68]. Except for the bulk metallic glass, the HEA exhibits comparatively higher values, as compared to the other alloy systems.

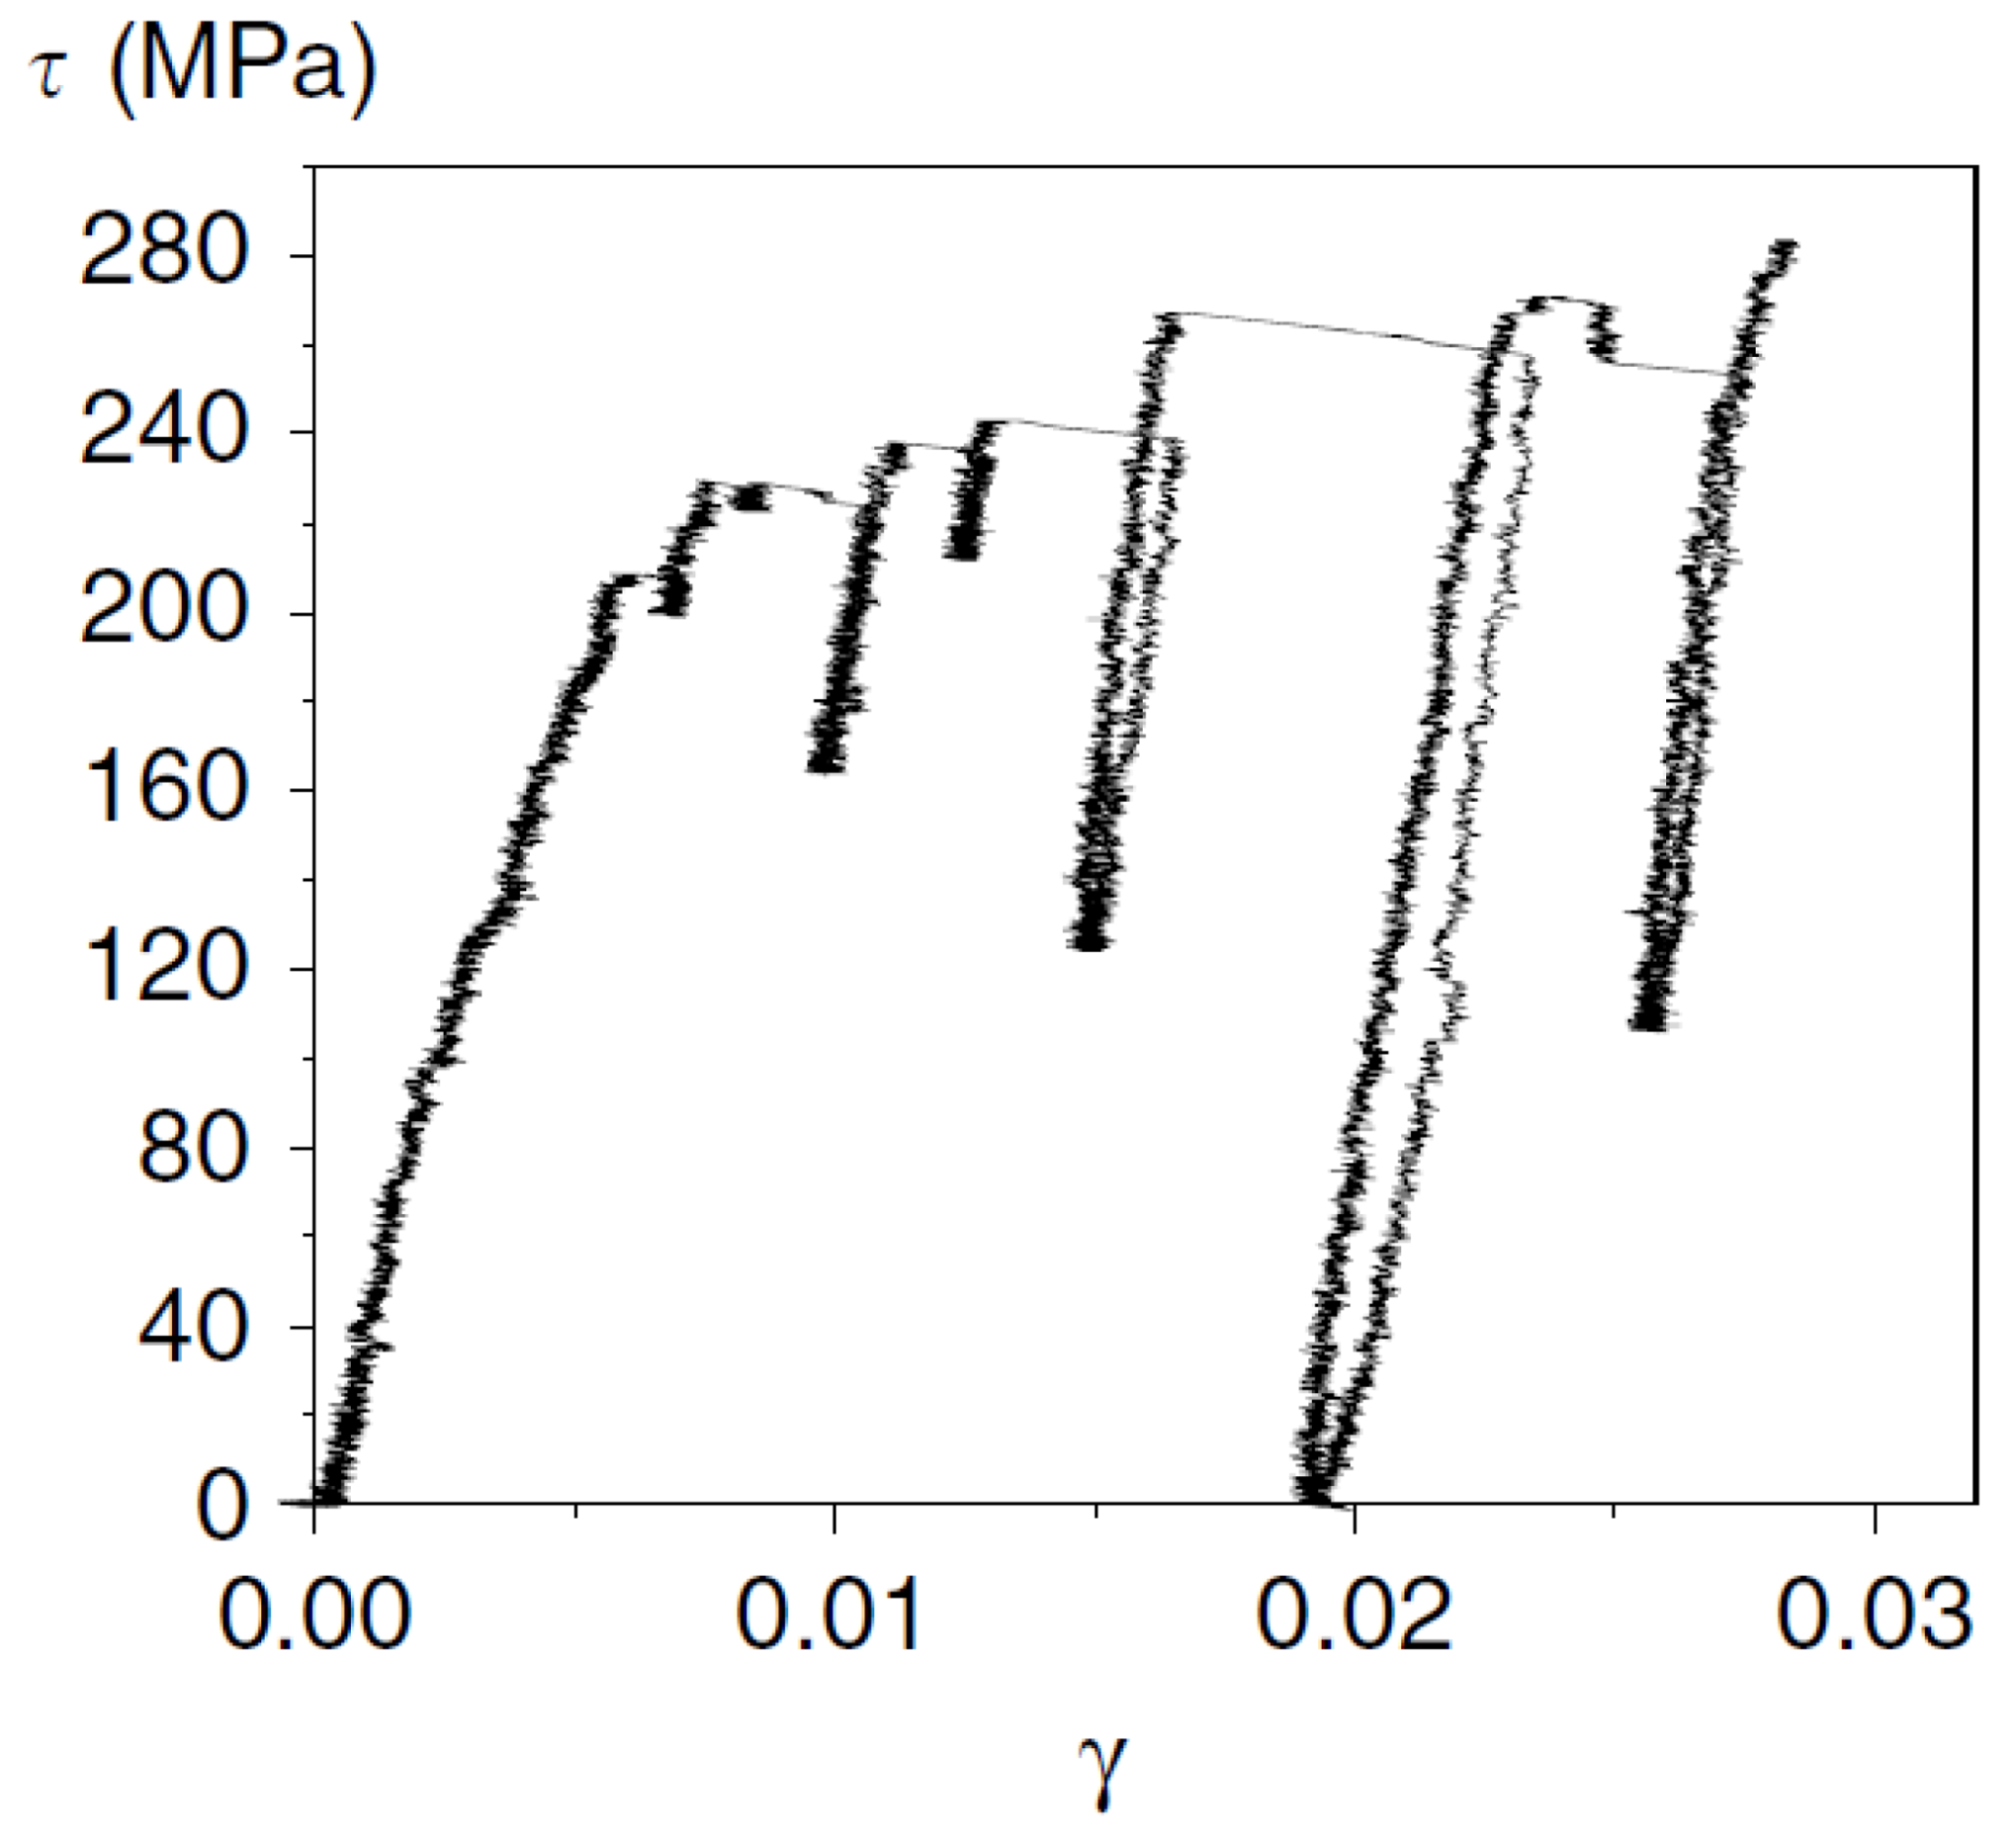
1.2. The Serrated-Flow Phenomenon

The Concise Oxford English Dictionary defines a serration as “a tooth or point of a serrated edge or surface” [69]. A typical morphology of serrations is displayed in Figure 4a,b, which features the high-magnification light micrographs of the teeth for two species of shark [70]. The figure displays the two main types of serrations: large primary serrations and small, interspersed secondary serrations. Serrations have also been observed in different phenomena, such as the Barkhausen noise in magnetic materials [8,71,72,73,74] (see Figure 5), crackling noise during earthquakes [75,76,77,78], discrete strain bursts in nanocrystals [76], various economic indices [79,80,81,82,83], and neuronal avalanches that occur during the operation of the brain’s network (see Figure 6) [84,85,86,87,88,89,90,91,92].
In addition to the above phenomena, serrations (or the serrated flow) can occur during the dynamic strain aging (DSA) of a material while undergoing mechanical testing. The serrated flow is of great engineering significance since it corresponds to substantial changes in the microstructure and can have deleterious effects on the mechanical behavior of a material [8,9,93,94,95]. For example, the plastic instabilities that occur during the serrated flow can lead to a loss in the ductility of the material, as well as an unacceptable surface quality [95]. The study of this type of behavior is important for the production of metal-alloy parts with smooth surfaces and elucidates the fundamental understanding of microscale plastic deformation [96]. The serrated-flow behavior that occurs during material deformation has been reported as far back as the 1970s [97]. With respect to the compression and tension testing, serrations are typically characterized by the fluctuations in the corresponding stress–strain graph [8]. Additionally, the serrated flow has also been observed in the form of pop-ins during nanoindentation testing, which are characterized by displacement bursts in the load vs. displacement graph. A variety of material systems have exhibited this type of behavior [8,9,98,99], including single and polycrystalline metals [100,101,102,103], Al alloys [8,104,105,106,107,108,109,110,111,112,113,114,115], Cu alloys [116], V alloys [117,118], steels [8,119,120,121,122,123,124,125,126,127,128,129,130,131], granular systems [132], bulk metallic glasses (BMGs) [8,97,132,133,134,135,136,137,138,139,140,141,142,143,144,145,146,147,148,149,150,151], and medium-entropy and high-entropy alloys [8,9,68,94,152,153,154,155,156,157,158,159,160,161,162,163,164,165,166,167,168,169,170,171,172,173,174,175,176,177,178,179,180,181]. It is thought that the standard interpretations can be applied to HEAs since a similar weakening effect is observed during the DSA, where solute atoms diffuse and lock dislocations, thereby immobilizing them [153,180].
A graph listing the number of journal publications that feature the serrated flow phenomenon in HEAs for years 2011 through July 2020 is displayed in Figure 7. The results featured in the graph were found via the Web of Science database. As can be seen, the number of articles continually increased per year. Before moving on, it should be mentioned that the numbers for 2020 are still ongoing.

1.3. Mechanisms of Serrated Flow

Several mechanisms can contribute to the serrated flow in materials during mechanical deformation, including the dislocation pinning by solute atoms, mechanical twinning, grain boundaries, order–disorder phase transformations, phase transformations induced by stress and strain, and yielding across fracture surfaces in brittle materials [182,183,184,185,186]. In terms of dislocation pinning by solute atoms, both interstitial and substitutional solutes can participate in the dislocation-pinning process. With respect to interstitial solute pinning, Cottrell and Bilby provided one of the earliest theoretical explanations for this phenomenon [187]. In their work, they suggested that at sufficiently high temperatures interstitial solute atoms (such as C or N) diffuse toward dislocation cores, where they impede their motion [186]. As mentioned above, substitutional solutes can also participate in dislocation pinning. Here, substitutional solutes diffuse via a vacancy mechanism during plastic deformation [188]. Solute atoms that are larger than the parent metal diffuse below the dislocation line, where the strains are tensile [189]. On the other hand, solutes that are smaller than the matrix atoms migrate to sites above the dislocation line, where compressive strains occur. Consequently, these strain fields pin the dislocation in place. Once the stress becomes sufficiently large, the dislocation can break free and then migrate until it is pinned again. If the pinning and unpinning processes are repeated cyclically, it leads to a DSA effect [190].
Figure 8 presents an illustration of the pinning–unpinning cycle [152]. Dislocations are pinned by diffusion solute atoms (labeled I in the figure). As the stress increases, the dislocation remains pinned (section II) until a critical stress is reached, where there is sufficient energy for the dislocation to break free. The escape of the dislocation corresponds to the stress drop in the stress–strain curve (marked by III in the figure). After escaping the solute atoms, the dislocation moves until it is pinned again by a migrating solute atom (designated IV in the figure). This pinning is accompanied by an increase in the stress, and the process then repeats.
It is widely accepted that, in HEAs, any atom can act as a solute atom [1]. However, there are cases in which only certain atoms in the matrix can participate in dislocation locking. In fact, some investigations have revealed that only certain additives such as Al may hinder dislocation motion in HEAs during deformation [94,180,191]. For instance, Yasuda et al. compared the mechanical behavior of Al0.3CoCrFeNi and CoCrFeNi HEAs during DSA [191]. It was reported that the Al-containing HEA exhibited serrations, whereas the latter specimen did not. It was hypothesized that the creation of Al-containing solute atmospheres near a moving dislocation core results in an increase of the frictional stress on the dislocations, thus resulting in serrations. Niu et al. also found a similar trend when investigating the DSA in Al0.5CoCrFeNi and CoCrFeNi HEAs [94]. In a study of carbon-doped CoCrFeMnNi HEAs, serrated flows at room temperature (RT) occurred due to interactions between carbon impurities and dislocations, as well as an increase in the stacking fault (SF) energy due to the presence of the carbon [192].
In addition to solute atoms, nanoparticles and phase structures may also participate in the dislocation-locking process during the serrated flow in HEAs. For instance, Chen et al. reported that L12 particles could provide an obstacle for the mobile dislocations during compression in an Al0.5CoCrCuFeNi HEA [155]. Transmission electron microscopy (TEM) characterization revealed that L12 nanoparticles were present in the matrix for the samples tested at 500 and 600 °C. In another study [193], it has been reported that, in CoCrFeNiMnVx HEAs, sigma-phase particles and dendrite boundaries can provide a barrier to dislocation motion, resulting in serrations. Twinning, which occurs at cryogenic temperatures, is another mechanism that can lead to the serrated flow in HEAs by hindering dislocation motion at twin boundaries [8,9,122,123,159]. In Reference [159], it was found that, in the CoCrFeNi HEA, twinning at 4.2 K was accompanied by a phase transformation from face-centered cubic (FCC) to hexagonal close-packed (HCP) structures. In other studies [194,195], the lack of observed serrations during mechanical testing of FeCrCoNiMnV and FeNiCoCuV HEAs indicates that the presence of secondary phase precipitates within the solid solution grains may be required for the serrated flow to occur. However, another investigation on an FeCoNiCuCr HEA found that serrations did not occur, even though there were intermetallic compound precipitates present in the matrix [196].
In contrast to crystalline alloys such as HEAs and steels, the serrated flow in BMGs occurs via different mechanisms. Table 1 compares some of the different mechanisms responsible for the serrated flow in crystalline and amorphous alloys. These mechanisms include the flow defect unit and liquid-like site agglomeration, and shear band formation and propagation [197,198,199,200,201]. The activation and percolation of the flow units are typically caused by an applied stress or elevated temperature [202]. In terms of the shear bands, there is a general agreement that their initiation is caused by local structural softening, owing to free volume generation [203]. After the initiation of a shear band, it propagates until the stored elastic energy is sufficiently released, leading to its arrest [198].
Figure 9 displays an illustration of the serration process that occurs due to the flow defect accumulation and subsequent shear-band initiation and propagation in a BMG [197]. At the beginning of a serration event, the applied stress leads to stress concentrations that arise from the modulus difference between the flow units and the glassy matrix. Consequently, these stress concentrations activate the flow units (labeled I in the figure). With an increase in the applied stress, the liquid-like regions that are composed of the flow defects grow and coalesce with adjacent regions (labeled II in the figure). Once the applied stress reaches a critical value, which corresponds to the local peak in the stress (labeled III in the graph), a shear band is initiated in the coalesced liquid-like region. Consequently, the shear band activates and propagates, leading to a drop in the stress that corresponds to a dissipation of the stored elastic energy. Once a sufficient amount of elastic energy is dissipated, the shear band is arrested. This arrest is accompanied by a recovery of the liquid-like layer and subsequent restoration of the solid-like (glassy) matrix (labeled IV in the figure) in the shear plane [198]. Once the glassy matrix is fully restored, the process repeats.

1.4. Types of Serrated Flow

Serrations have been categorized into five distinct types, which have been labeled as A, B, C, D, and E [8,9,153,182,204]. Figure 10 displays the five types of serrations, and as can be observed, each type of serrations has distinct characteristics. Type-A serrations occur in a periodic fashion in which the curve rises above the general level of stress values before there is a sharp decrease in the stress. Type-B serrations typically fluctuate above the general level of stress with a higher frequency, as compared to Type-A serrations. Type-C serrations are characterized by yield drops that occur below the general level of stress. Furthermore, the elapsed time between stress drops is randomly distributed. In contrast to the serration types previously described, Type-D serrations consist of a stair-stepping pattern in the stress vs. strain graph. Finally, Type-E serrations are characterized by fluctuations that display an irregular pattern and occur with little or no working hardening during band propagation [182]. It should also be noted that combinations of serration types can occur during the serrated flow, such as A + B and B + C [204]. As is discussed later, in Section 1.5, the serration type is typically dependent on the applied strain rate or test temperature during either tension or compression testing [8,9,133,153]. For instance, serrations have been observed to transition from Type-A to Type-C behavior when the testing temperature is increased [180].

1.5. Factors Affecting Serrated Flow

The serration behavior can be affected by factors such as the composition, temperature, irradiation damage, and strain rate. For example, Cai et al. [205] observed that, in Ni-based superalloys, the γ′ precipitates could lead to the aggregation of solute atoms around moving dislocations, thereby enhancing serrations in the material. Similarly, Chandravathi et al. found that the serration behavior in a 9Cr-1Mo steel was also born out of DSA, as the serrated flow was observed in all variations of microstructures, except in certain conditions where increased soaking temperatures above 1423 K led to elevated hardness due to the larger austenitic grain size [206]. Bayramin et al. determined that microstructure played a primary role in the serration behavior of a dual-phase low-carbon steel [207]. They found that the DSA was more pronounced in a sample with a higher concentration of the ferrite phase present. From the results, they hypothesized that the pronounced DSA was attributed to a dislocation density, which increased with increasing strain, such that the dislocation pinning was more prevalent in the ferrite microstructures. Such behavior has been observed in prior studies [207,208,209].
Temperature has also been reported to play an important role in the serration behavior of materials [8,117,153,210,211,212,213,214]. With an increase in temperature, the mobility of diffusing solute atoms increases, allowing them to pin dislocations at a faster rate. However, once a limiting temperature is exceeded, serrations do not occur due to factors such as a prohibitively high critical strain, smaller critical plastic strain for the termination of serrations, or exceedingly large atomic thermal vibrations, which prevent solutes from settling down the effective locking [8,153]. Conversely, a decrease in the temperature reduces the migration speed of the solute atoms, thereby diminishing their ability to lock dislocations. Once the temperature becomes low enough, the solutes can no longer catch and pin dislocations [215].
The increase in the pinning rate of dislocations (due to an increase in temperature) results in a significant change of the dynamical behavior of the stress and corresponding serrated flow curves (and serration type). For instance, Sakthivel et al. observed that when Hastelloy X underwent tension testing, the serration type changed with an increase in temperature [211]. More specifically, the serrated flow evolved from Type-A at 400 °C to Type-A + Type-B at 500–550 °C, followed by Type-B at 600 °C, and then finally to Type-C at 650 °C. It was also reported that the height of serrations in the stress–strain curve increased with an increase in the temperature. The critical plastic strain, which is the strain associated with the onset of serrations, was found to decrease with an increase in the test temperature.
It has also been reported that the combinations of temperature and irradiation damage can affect the serrated-flow behavior. Rowcliffe et al. reported that temperature and neutron irradiation led to a change in the serrated-flow behavior of the V-4Cr-4Ti alloy during tension [117]. Figure 11a,b presents the engineering stress vs. strain behavior for the unirradiated and irradiated alloys during tension at temperatures ranging from 20 to 850 °C and a strain rate of 10−3 s−1. For the irradiation conditions, samples were bombarded by neutrons to doses of 0.5 displacements per atom (dpa) at temperatures ranging from 160 to 420 °C, and also to a dose of 0.1 dpa at 505 °C. It was observed that, for the unirradiated samples, pronounced serrations occurred for temperatures of 300–700 °C. Below 300 °C, serrations were not observed, since the interstitial solutes were relatively immobile. For temperatures above 700 °C, the magnitude and frequency of the serrations significantly declined, while at 800 °C, serrations were restricted to the Lüders region. At 850 °C, there were no observable serrations. As for the irradiated samples, the serrated flow was apparent for temperatures ≥420 °C. Furthermore, as compared to the unirradiated samples, there were significantly fewer and less pronounced serrations in the irradiated specimens. This reduction in the serrated flow may have been caused by a loss of pinning solute atoms that become trapped in either small dislocation loops (T ≤ 400 °C) or fairly coarse {0 0 1} defects (T > 420 °C) that formed during irradiation.
In addition to temperature and irradiation, strain rate can also affect the serrated-flow behavior [8,211,212,216,217]. Typically, the critical strain for the onset of serrations increases with an increase in the strain rate [8]. However, there are cases where the critical strain will also increase with a decreasing strain rate [217]. In this scenario, the increase in the critical strain is due to an increase in the strength of solute obstacles, which reduces the ability of solutes to migrate and pin dislocations. Robinson et al. reported the dependence of the serrated flow during Lüders-band formation on the strain rate (as well as temperature) in an Al-5Mg (at.%) alloy [212]. The results of this study can be observed in Figure 12, and as can be seen, Type-C serrations tended to occur at higher temperatures, while Types A and B were found at lower temperatures. Furthermore, the strain rate at which a transition in the serration type occurred, i.e., Type-A to Type-A + Type-B transition increased with an increase in the temperature.
Similar to conventional crystalline alloys, the serrated flow in HEAs can be affected by factors such as temperature and strain rate [152,153,155,180,193]. For example, Type-C serrations have been typically observed at relatively lower strain rates and higher temperatures, while the reverse is true for Type-A serrations [152,153,155,180]. In an Al0.5CoCrCuFeNi HEA, for example, the transition from Types A to C serrations with increasing temperature was attributed to the increase in the migration speed of the solute atoms that pin dislocations [153]. In this scenario, the increased speed allows the solutes to immediately pin the dislocation after it breaks free. After pinning, the stress increase is characterized by a downward bending curve that is typical of Type-C serrations. Furthermore, the formation of ordered L12 nanoprecipitates and the emergence of the B2 phase in the alloy during testing at 600 °C were thought to play a role in altering the characteristic behavior of the serrated flow in this HEA [180]. Tsai et al. hypothesized that increasing the number of solute atoms in an HEA can increase the abundance and the atomic-size differences that enhances the pinning force in the lattice [181]. Such a change results in an increase in the range of temperatures in which the serrated flow can occur.
In BMGs, factors such as the strain rate, temperature, and pre-annealing can also affect the serrated-flow dynamics [133,145,150,151,218]. It has been reported that, during compression, an increase in the strain rate leads to the creation of free volumes [218]. The creation of free volumes is accompanied by the formation of shear bands that can better accommodate the applied strain during compression. Jiang et al. observed that, with a decrease in the temperature, the time interval between stress peaks during serrations significantly decreased [145]. It has been observed that, in a Zr52.5Cu17.9Ni14.6Al10Ti5 BMG, pre-annealing at 300 °C for one week led to more irregular serration behavior during compression testing [150]. The increase in the irregularity of the serrated flow was thought to be due to the annihilation of excess free volumes (and associated defects) during the thermally induced structural relaxation of the alloy [219,220].

2. Modeling and Analytical Techniques

In the past, several different types of modeling and analytical techniques have been used to help quantify the serration behavior in a great amount of alloy systems. These techniques include statistical [8,9,76,105,133,134,135,152,153,154,155,221,222], multifractal [180,216,221,223,224], and complexity [104,119,131,180,225] methods. The above methods have been used to model and analyze the serrated flow, since it is believed that serration curves contain scaling laws, self-similarity, and complex dynamics [180].

2.1. Complexity Modeling and Analysis

Entropy-based complexity measurements have been employed to analyze a host of different fluctuating phenomena, including financial-time series, biological signals, and time-dependent serrated-flow behavior during mechanical testing [119,226,227,228]. In the present context, entropy increases with the degree of disorder (or irregularity) and is the maximum for completely random systems [226]. With respect to the serration behavior in HEAs, higher values are attributed to more complex dynamical behavior during the serrated flow. For biological systems, the complexity of physiological signals is related to the ability of a living system to adjust to an ever-changing environment [227]. For instance, a relatively lower complexity measure has been attributed to pathological conditions, such as the congestive heart failure [226,227,229]. Applying the above ideas to material systems, the complexity of the serrated flow may be a measure of a material’s ability to adapt to an applied load [151].

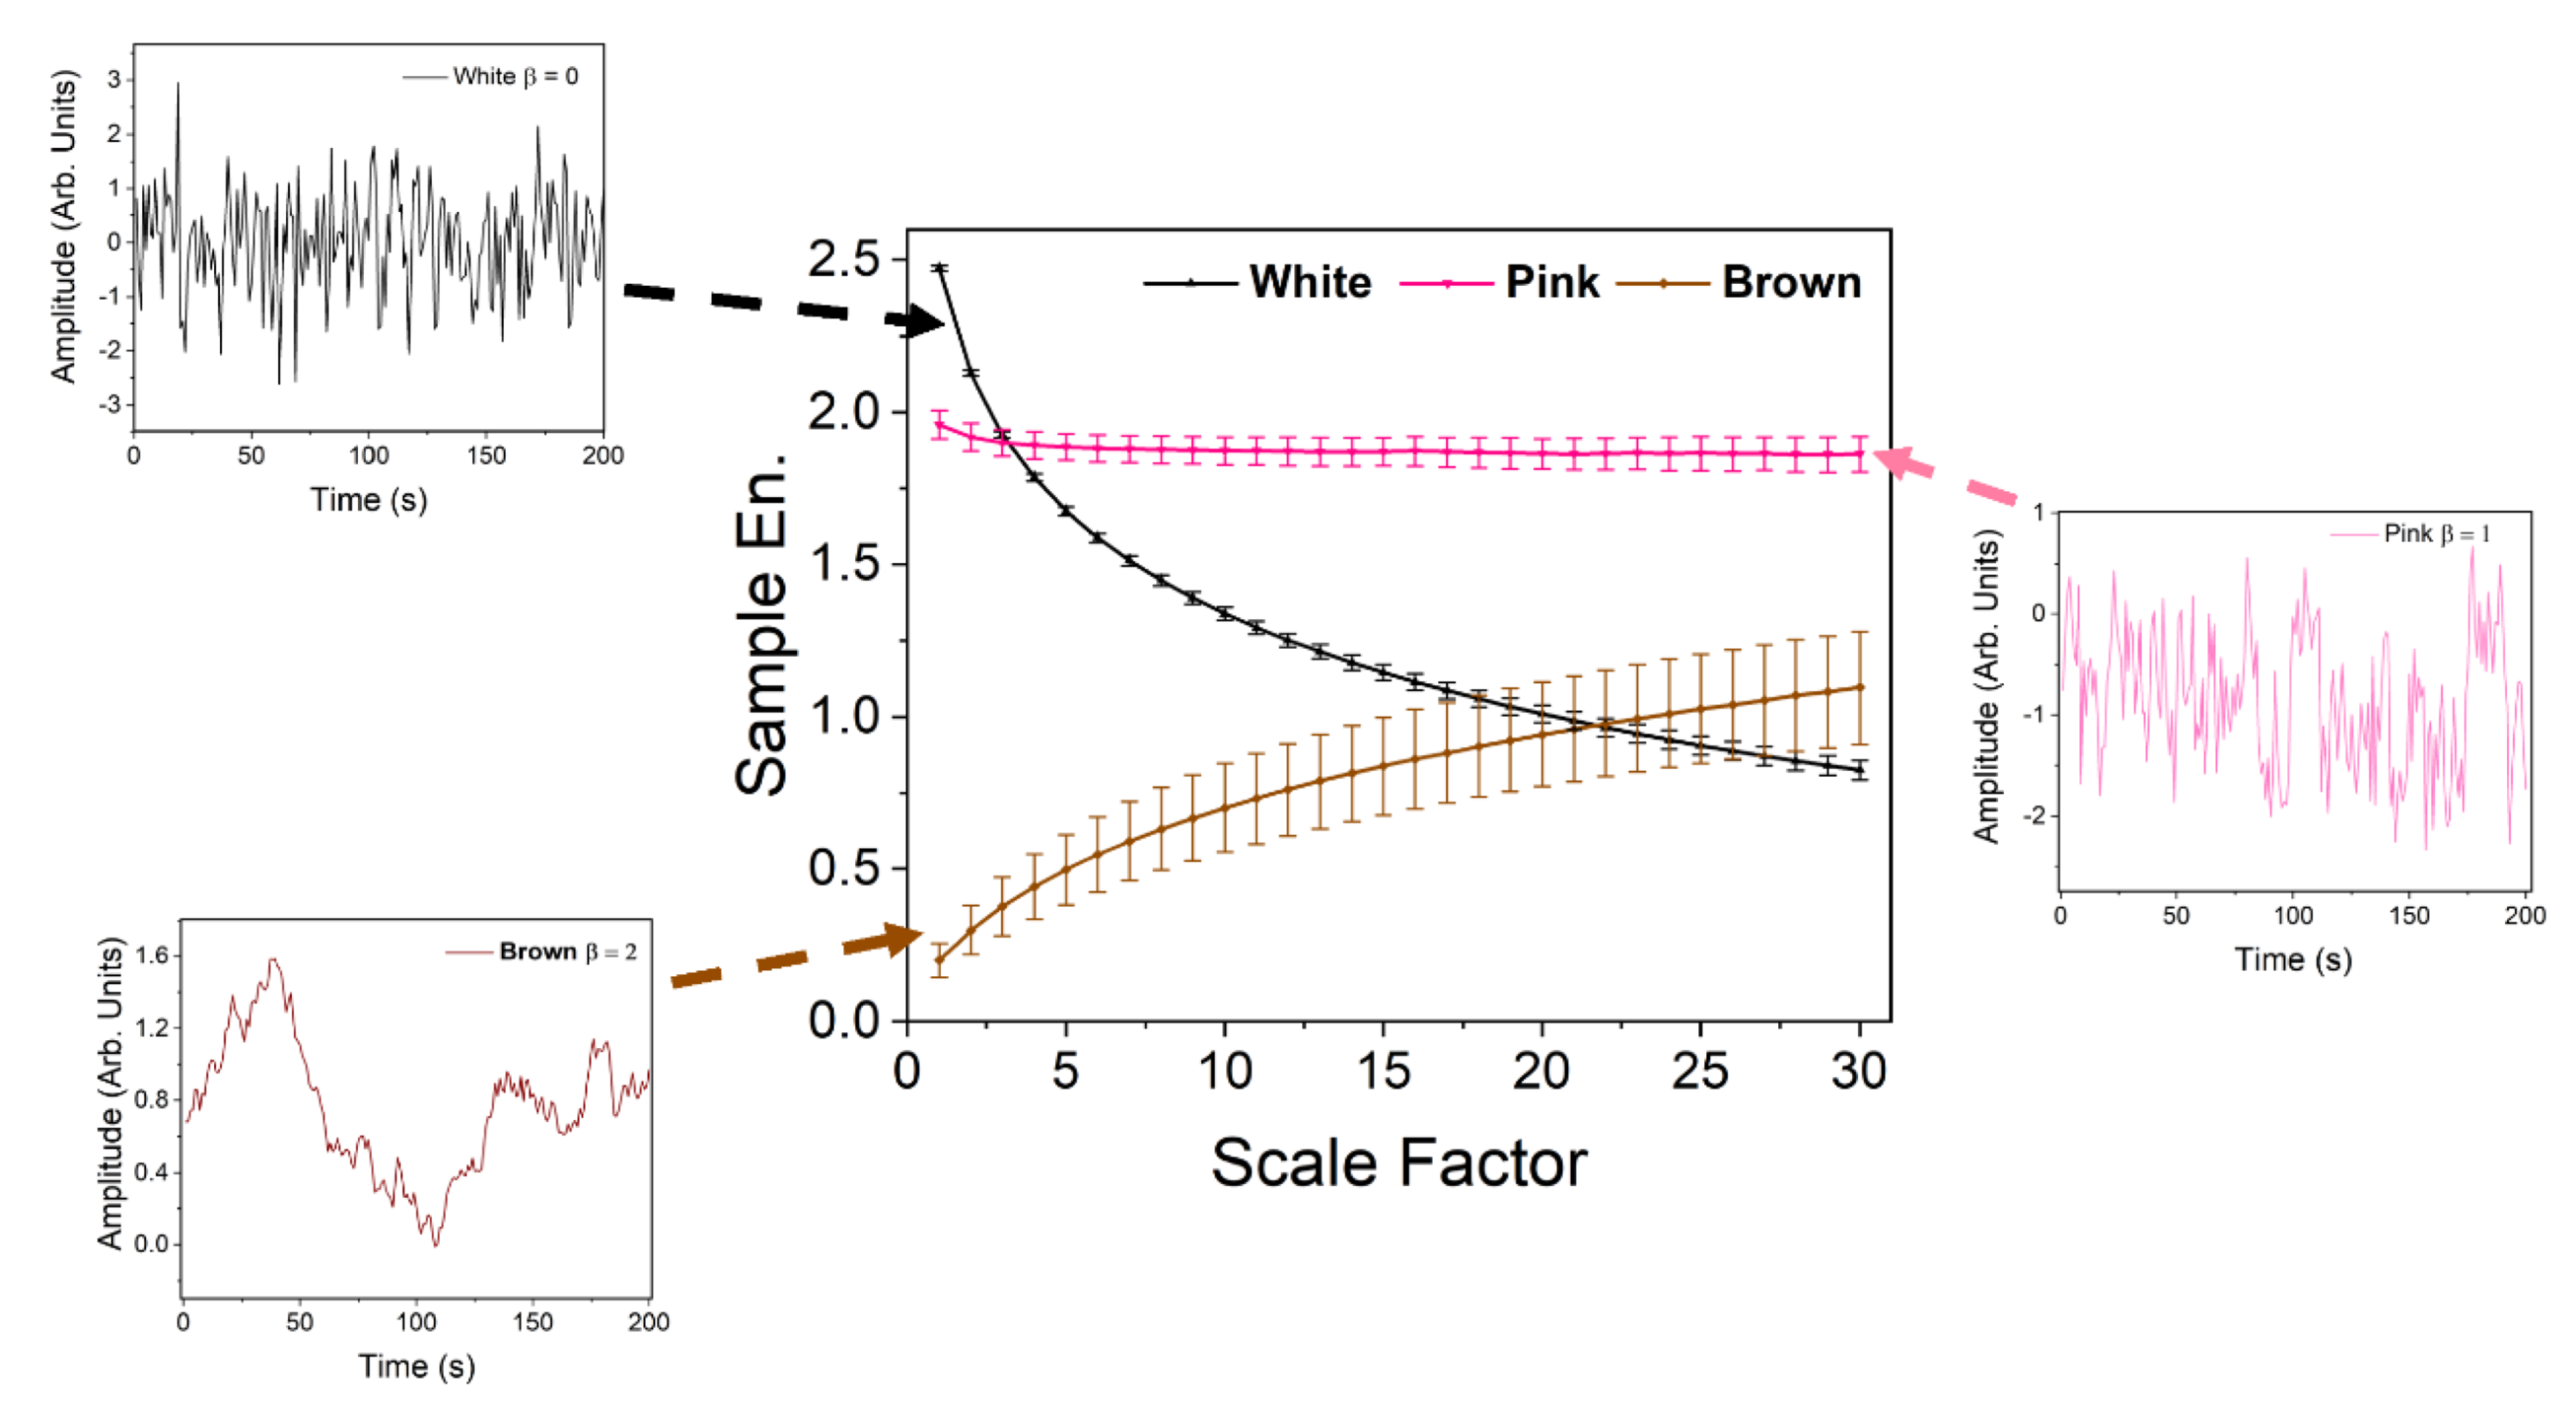
2.1.1. Approximate Entropy Algorithm

One such method that has been used to gauge the complexity of a time series is known as the approximate entropy (ApEn) technique [230]. Lower ApEn values are assigned to more regular time series, while higher ApEn values are assigned to more irregular, less predictable time series [227]. This method has been widely used in physiology and medicine [226,231]. However, there are issues with this method, namely that the technique inherently includes a bias toward regularity (or regularity bias), as it will count a self-match of vectors [232].
The procedure used to calculate the ApEn is discussed below. Given a time series of size, N, one constructs the dataset, X(i) = [x(i), x(i + 1), …, x(i + m − 1)] (m denotes the embedding dimension), consisting of N data samples from a given time series with 1 ≤ iNm + 1 [233]. Next, one determines the number of given vectors, n i m (r), which are within a distance, d[X(i), X(j)] < r = 0.2σ, where σ is the standard deviation of X [154]. This distance is defined as follows [230]:
d [ X ( i ) , X ( j ) ] = max k = 1 , 2 , , m { | x ( i + k 1 ) x ( j + k 1 ) | }
Next we define the following:
Φ m ( r ) = 1 N m + 1 i = 1 N m + 1 C i m ( r )
where C i m (r) = n i m (r)/(Nm + 1) [230], and Φ m ( r ) represents the average degree of self-correlation [153]. The approximate entropy, ApEn, can now be defined for a fixed m and r as follows:
A p E n ( m , r , N ) = Φ m ( r ) Φ m + 1 ( r )
where Φm(r) − Φm + 1(r) signifies the degree of randomness of the sequences, X(i) (i = 1, 2, …).

2.1.2. Refined Composite Multiscale Entropy Methods

A technique that does not suffer from the issue of regularity bias is known as the multiscale-entropy (MSE) algorithm [227]. Similar to the ApEn technique, this method has been used to derive the representations of a system’s dynamics on different time scales [234]. The MSE method has been used to analyze the complexity of the serration behavior in different material systems, including the low-carbon steel, Al-Mg alloy, and HT-9 steel [104,119,225].
Previous studies have observed that the microstructural composition can affect the complexity of serrations. For example, Sarkar et al. compared the serrated-flow behavior of a low-carbon steel and an Al-Mg alloy [225]. The results of the MSE analysis revealed that the carbon steel produced serrations that had significantly larger complexity values than the Al-Mg alloy. The authors surmised that the complexity values were related to the type of solute atoms in the matrix. In the present context, the carbon solutes in the steel are able to interact with both screw and edge dislocations, whereas the Al-substitutional solutes could only interact with edge dislocations [225]. As such, the higher variety of interactions exhibited by the low-carbon steel resulted in more intricate behavior during the serrated flow and, hence, higher complexity values as compared to the Al-Mg alloy. It has also been reported that an increase in the concentration of carbon impurities in steels led to an increase in the complexity of the serrated flow during tension [131]. In addition to the microstructure, the complexity of the serrated flow has also been linked to different serration types [104,180]. For instance, Type-A and Type-B serrations have been associated with a higher degree of complexity, as compared to Type-C [104].
Due to issues regarding the accuracy of the MSE algorithm when applied to smaller datasets (N < 750), alternative techniques were later developed [227,234,235]. One such algorithm includes the refined composite entropy multiscale entropy (RCMSE) method [235], which has been used to investigate various phenomena, such as the serrated flow, chaos, and noise, and cognitive tasks [131,151,178,180,235,236,237]. The advantage of the RCMSE technique was illustrated in Reference [235], where the RCMSE and MSE algorithms were applied to model and analyze the 1/f noise (f is the frequency of the generated noise). It was reported that the MSE technique had a non-zero probability of inducing undefined entropy values, whereas the RCMSE technique had negligible probability.
To begin the RCMSE analysis, the underlying trend of the stress vs. time data in the strain-hardening regime is first eliminated [119]. To perform this task, a moving average or a third-order polynomial is used to fit the data [238]. The fit is then subtracted from the original data. Subsequently, the coarse-grained time series, y k , j τ , is constructed by using the following equation [131]:
y k , j τ = 1 τ i = ( j 1 ) τ + k j τ + k 1 x i             ;     1 j N τ                 1 k τ
where xi is the ith point from the detrended time-series data, N is the total number of data points from the detrended time series, τ is the scale factor, and k is an indexing factor, which denotes at what data point to begin the averaging. To give the reader perspective, setting τ equal to 1 yields the original detrended time series. Once y k , j τ is determined, construct the time series, y k τ , which is represented as a vector for each τ [235]:
y k τ = { y k , 1 τ     y k , 2 τ   .   y k , M τ }
where each y k , j τ is determined from Equation (6), and M equals the integer below N/τ. Now determine the template vectors of dimension, m:
y k , i τ , m = { y k , i τ       y k , i + 1 τ   .     y k , i + m 1 τ }       ;         1 i N m   ; 1 k τ
Next, find n-matching sets of distinct template vectors for each k, using the following equation:
d j l τ , m = y j τ , m y l τ , m = max { | y 1 , j τ y 1 , l τ | | y i + m 1 , j τ y i + m 1 , l τ | } < r
where d j l τ , m is the distance between two vectors, as calculated by the infinity norm [239], and r is typically chosen as 0.15 times the standard deviation of the data, which ensures that the sample entropy does not depend on the variance of the data [226,227,240]. As indicated by Equation (9), two vectors match when d j l τ , m is less than r. Now repeat the above process for template vectors of size m + 1. Next, determine the total number of matching vectors, n k , τ m , for m and m + 1 by summing from k = 1 to τ. Finally, the RCMSE (or sample entropy) value for the detrended time-series data can be determined by taking the ratio of the natural log for these two sums, using the following equation [235]:
R C M S E ( X ,   τ ,   m ,   r ) = L n ( k = 1 τ n k , τ m k = 1 τ n k , τ m + 1 )
Here, it should be mentioned that the sample entropy is only undefined when n k , τ m or n k , τ m + 1 , are zero for all k.
To illustrate the RCMSE method, the 1/fβ noise was analyzed, using the RCMSE method in a similar fashion as was done in Reference [131]. This process was performed for β = 0, 1, and 2, which correspond to white, pink, and brown noise, respectively. Figure 13 features a graph of the mean Sample En. (sample entropy) vs. scale factor for the three types of noise plotted. As can be seen, the white and brown noise displayed decreasing and increasing trends, respectively. The sample-entropy values for the brown noise were greater than those for the white noise when τ > 22. This result indicates that the brown noise exhibits more complex behavior as compared to the white noise.
The above findings also suggest that a random-walk signal with persistent behavior, such as the brown noise, contains higher spatiotemporal correlations, as compared to a noise-like signal that is inherent in the white noise [241]. As compared to the white and brown noise, the pink noise exhibits the greatest sample-entropy values for τ > 3. This result supports the theory that, as compared to the brown and white noise, the 1/f noise exhibits fluctuations that contain a greater degree of long-range correlations and are the most complex in nature [227]. Furthermore, the relatively higher complexity of the pink noise may also be attributed to its inherent mix of random-walk and noise-like characters.

2.2. Multifractal Modeling and Analysis

In contrast to the fractal approach, which can only characterize global scaling properties, the multifractal formalism can analyze not only the underlying fractal geometry but also the distribution of the underlying physical properties on the fractal support [180,242]. The multifractal method has been used to model and analyze the serrated flow in different material systems, including Al-Mg alloys [216,221,223,224,243,244,245], bulk-metallic glasses [246,247], and HEAs [180]. Specifically, this method has been used to examine the relationship between the serration type and its corresponding multifractal spectra. For instance, Lebyodkin et al. reported that the multifractal characteristics of the serrated flow in an Al-Mg alloy were affected by the phase composition of the material [242]. They also observed that the serrated deformation curves with an underlying multifractal and hierarchical structure results from the self-organization of dislocation motion. In another investigation, it was observed that the transition from Type-B to Type-A serrations was associated with a sharp increase in the multifractality of the stress-burst behavior [216].
In a similar fashion as the RCMSE method, the underlying trend associated with the strain hardening is omitted from the original signal. As discussed earlier, one can accomplish this task by subtracting away the moving average of the polynomial fit from the data. Next, determine the magnitude of the burst in the plastic activity, β i | d σ d t | t = t i . This step is accomplished by taking the absolute value of the numerical time derivative of the stress at each point in time. Now partition the detrended dataset into non-overlapping windows of size Δτ [244,245] and let the size of the window vary as (Δτ)2j for j = 1 … n. For each window, calculate the normalized amplitude of the probability measure for the plastic bursts:
p i ( Δ τ ) = ( j = 1 M β j ) i k = 1 P β k
where M is the total number of points in the ith window. Now compute the measure, μiτ, q):
μ i ( Δ τ , q ) = p i q ( Δ τ ) j p j q ( Δ τ )
where q is a real number. From μi, determine the local singularity strength, α [216,248]:
α = lim Δ τ 0 i μ i ( Δ τ , q ) L n [ p i ( Δ τ ) ] L n ( Δ τ )
Since piτ)~Δτα, the singularity strength is an important quantity, since it can give a measure of the scaling relationship between the interval size and the probability measure of the dataset. Next, one can solve for the fractal dimension f(α) of the subset of intervals characterized by the singularity strength [180]:
f ( α ) = lim Δ τ 0 i μ i ( Δ τ , q ) L n μ i ( Δ τ ) L n ( Δ τ )
It is important to note that, typically, the limits from Equations (13) and (14) cannot be calculated directly, and instead a linear-regression analysis must be implemented. A plot of f(α) vs. α is known as the multifractal spectra and is typically characterized by a parabolic shape. The width of the multifractal spectrum, which is defined here as Δ = αmaxαmin, measures the signal heterogeneity and is associated with the dynamical heterogeneity of the serrated flow [244].

2.3. Mean-Field Theory and the Mean-Field Interaction Model

During deformation, several materials, such as BMGs, HEAs, densely packed granular materials, rocks, and other composite materials, can exhibit jerky flows that occur via slip avalanches [76,134,153,249,250,251,252]. These slip avalanches typically exhibit a broad distribution of slip sizes, which can be described by relatively simple probability distribution function (pdf) models [253]. These mean-field interaction models, which are based on the mean-field theory (MFT), assume that a solid material has weak spots that are elastically coupled [132]. The type of weak spots will also depend on the kind of material. For instance, in crystalline materials, weak spots may comprise regions with dislocations that can undergo dislocation slip. In non-crystalline materials, on the other hand, weak spots may be regions that consist of shear bands, shear-transformation zones, or other relatively weak regions in the material [133,254,255]. This type of long-range interaction terminates once the stress at every point in the system is below its current failure stress [256].
The MFT model assumes that, during an applied shear stress, a weak spot can trigger other weak spots to slip, resulting in a slip avalanche [133]. Furthermore, the model assumes that the long length-scale behavior of the slip statistics is independent of the microscopic structural details of the material. The power of the MFT model lies in its ability to predict many statistical distributions and quantities. Typically, these models involve a power-law distribution of slip sizes multiplied with an exponentially decaying cutoff function [132,133,134,140,251,252,256]. As an example, the underlying equation for the MFT model has been written as follows [133]:
D ( S , q ) = S κ D ( S q λ )
where S is the avalanche-slip size; q is an experimentally tunable parameter, such as the applied stress or strain rate; D′(y) is a universal scaling function; and κ and λ are universal power-law exponents. It is important to note that the maximum avalanche-slip size, Smax, is proportional to q as qλ. For a more comprehensive discussion on the MFT model, please see Reference [76].
Another important quantity is the corresponding complementary cumulative distribution function (CCDF), C(S, q), which gives the probability of observing an avalanche of size greater than S, is useful for systems with low numbers of avalanches [133,180]:
C ( S , q ) = S D ( S , q ) d S
Importantly, this type of analysis is used by experimentalists and theorists to model the stress-drop behavior in multiple systems, including BMGs [133] and HEAs [8,9,32,153,180]. If we substitute Equation (15) into Equation (16) and integrate, we obtain the following:
C ( S , q ) = q λ ( κ 1 ) C ( S q λ )
where C′(Sqλ) is some other scaling function. Next, plot C(S, q)qλ(κ − 1) vs. S q λ and then tune the universal exponents until the curves lie on top of each other. This procedure will yield the correct values of the critical exponents.
This type of modeling and analysis has been proven to be a useful tool in the analysis of serrated flows in HEAs. Zhang et al. applied the MFT-modeling technique to examine the effect of temperature on the weak spot (dislocations) avalanche dynamics in HEAs [8]. Carroll et al. employed the MFT model to analyze the serrations that were exhibited by low-, medium-, and high-entropy alloys [153]. Results indicated that the serration-type change from Type-A to Type-B to Type-C with an increase in the temperature. It was also reported that an increase in the strain rate corresponded to a transition from Type-C to Type-B to Type-A serrations in the HEAs.
In addition to analyzing the stress-drop behavior of materials undergoing tension and compression testing, statistical analysis of the nanoindentation pop-in behavior has also been conducted. For this type of analysis, the cumulative probability distribution of the size of the displacement bursts, S, is analyzed. A displacement burst is characterized as a sudden displacement at a constant load during a plastic-deformation event. One such equation that can be used to analyze this type of behavior is written as follows [257]:
P ( > S ) = A S β e S S c
where A is a normalization constant, β is a scaling exponent, and Sc is the cutoff value of S. It should be mentioned that, for pop-in sizes smaller than Sc, their behavior follows a power-law distribution. Once S exceeds the cutoff value, the magnitudes of the pop-ins decrease in an exponential fashion.

2.4. Chaos Analysis

Chaos, which is the exponential sensitivity to small perturbations, is a ubiquitous phenomenon in nature [258,259]. Furthermore, chaos is related to how a deterministic dynamical system can be potentially unpredictable due to an extreme sensitivity to initial conditions, which is also known as the “Butterfly Effect” [259]. Chaos has been observed in many different phenomena, including electric circuits [260,261,262], weather [263,264,265], physiological systems [266,267,268], financial markets [269,270,271], complex networks [272], the serrated flow in alloys [116,216,273], and ecological systems [274,275,276].
One of the earliest attempts to apply a chaotic mathematical model to the repeated yielding behavior was done by Ananthakrishna et al. [277]. Similar to the Lorenz system [278], their model consisted of a set of four time-dependent differential equations. The equations were based on the time-dependent behavior of the stress, the mobile density, the immobile density, and the density of structures with clouds of solute atoms. The results of the analysis indicated that the dynamical behavior of this system exhibited an infinite sequence of period-doubling bifurcations that eventually led to chaos. Subsequent works confirmed the presence of chaos in the serrated flow of CuAl and AlMg alloys during tension testing [116,216,273]. For the studies involving the AlMg alloy, the chaotic behavior was observed for strain rates below ~3 × 10⁻⁴ s−1 and corresponded to Type-B serrations [216,273].
One such way to determine whether a dynamical system is exhibiting the chaotic behavior is to determine the largest Lyapunov exponent [279] for the given time series. A positive exponent signifies that the underlying dynamical behavior is chaotic. On the other hand, a negative value indicates that the system will evolve into a stable state [159]. The following discussion gives a basic recipe on how to calculate this value for the time-dependent serration data from an experiment. From a given stress-time series, one can define the reconstructed attractor Y(t, m) = [σ(t), σ(t + τ), …, σ(t + [m − 1]τ)], where σ is the stress value at time t = [1, 2, … N − (m − 1)τ], τ is an arbitrarily chosen delay time, m is the embedding dimension, and N is the number of data points in the time series [154,280].
To begin the analysis, one locates the nearest neighbor (in a Euclidean sense [280]) to the initial point, Y0(t0, m), and determines the distance between them. This distance is defined as L(t0) = |Y(t0, m) − Y0(t0, m)|. At some later time, which is denoted as t1, the initial length will become L (t1) = |Y(t1, m) − Y0(t1, m)|. However, if it is determined that Y0(t1, m) is not a nearest neighbor point of Y(t1, m), then a new point, Y1(t1, m), will be chosen. Next, determine L(t1) = |Y(t1, m) − Y1(t1, m)|. For each step, the angle between L(ti) and L(ti+1) is minimized to reduce the influence on the orbit evolution when a nearest neighbor point is chosen [159]. This process is repeated until the m-dimensional vector, Y(ti), reaches the end of the time series [154]. From the results, one can determine the largest Lyapunov exponent, λ1 [280]:
λ 1 = 1 t M t 0 k = 1 M L o g 2 L ( t k ) L ( t k 1 )
where M is defined as the total number of the replacement steps, and tM is the final time point.

3. Serration Studies in HEAs

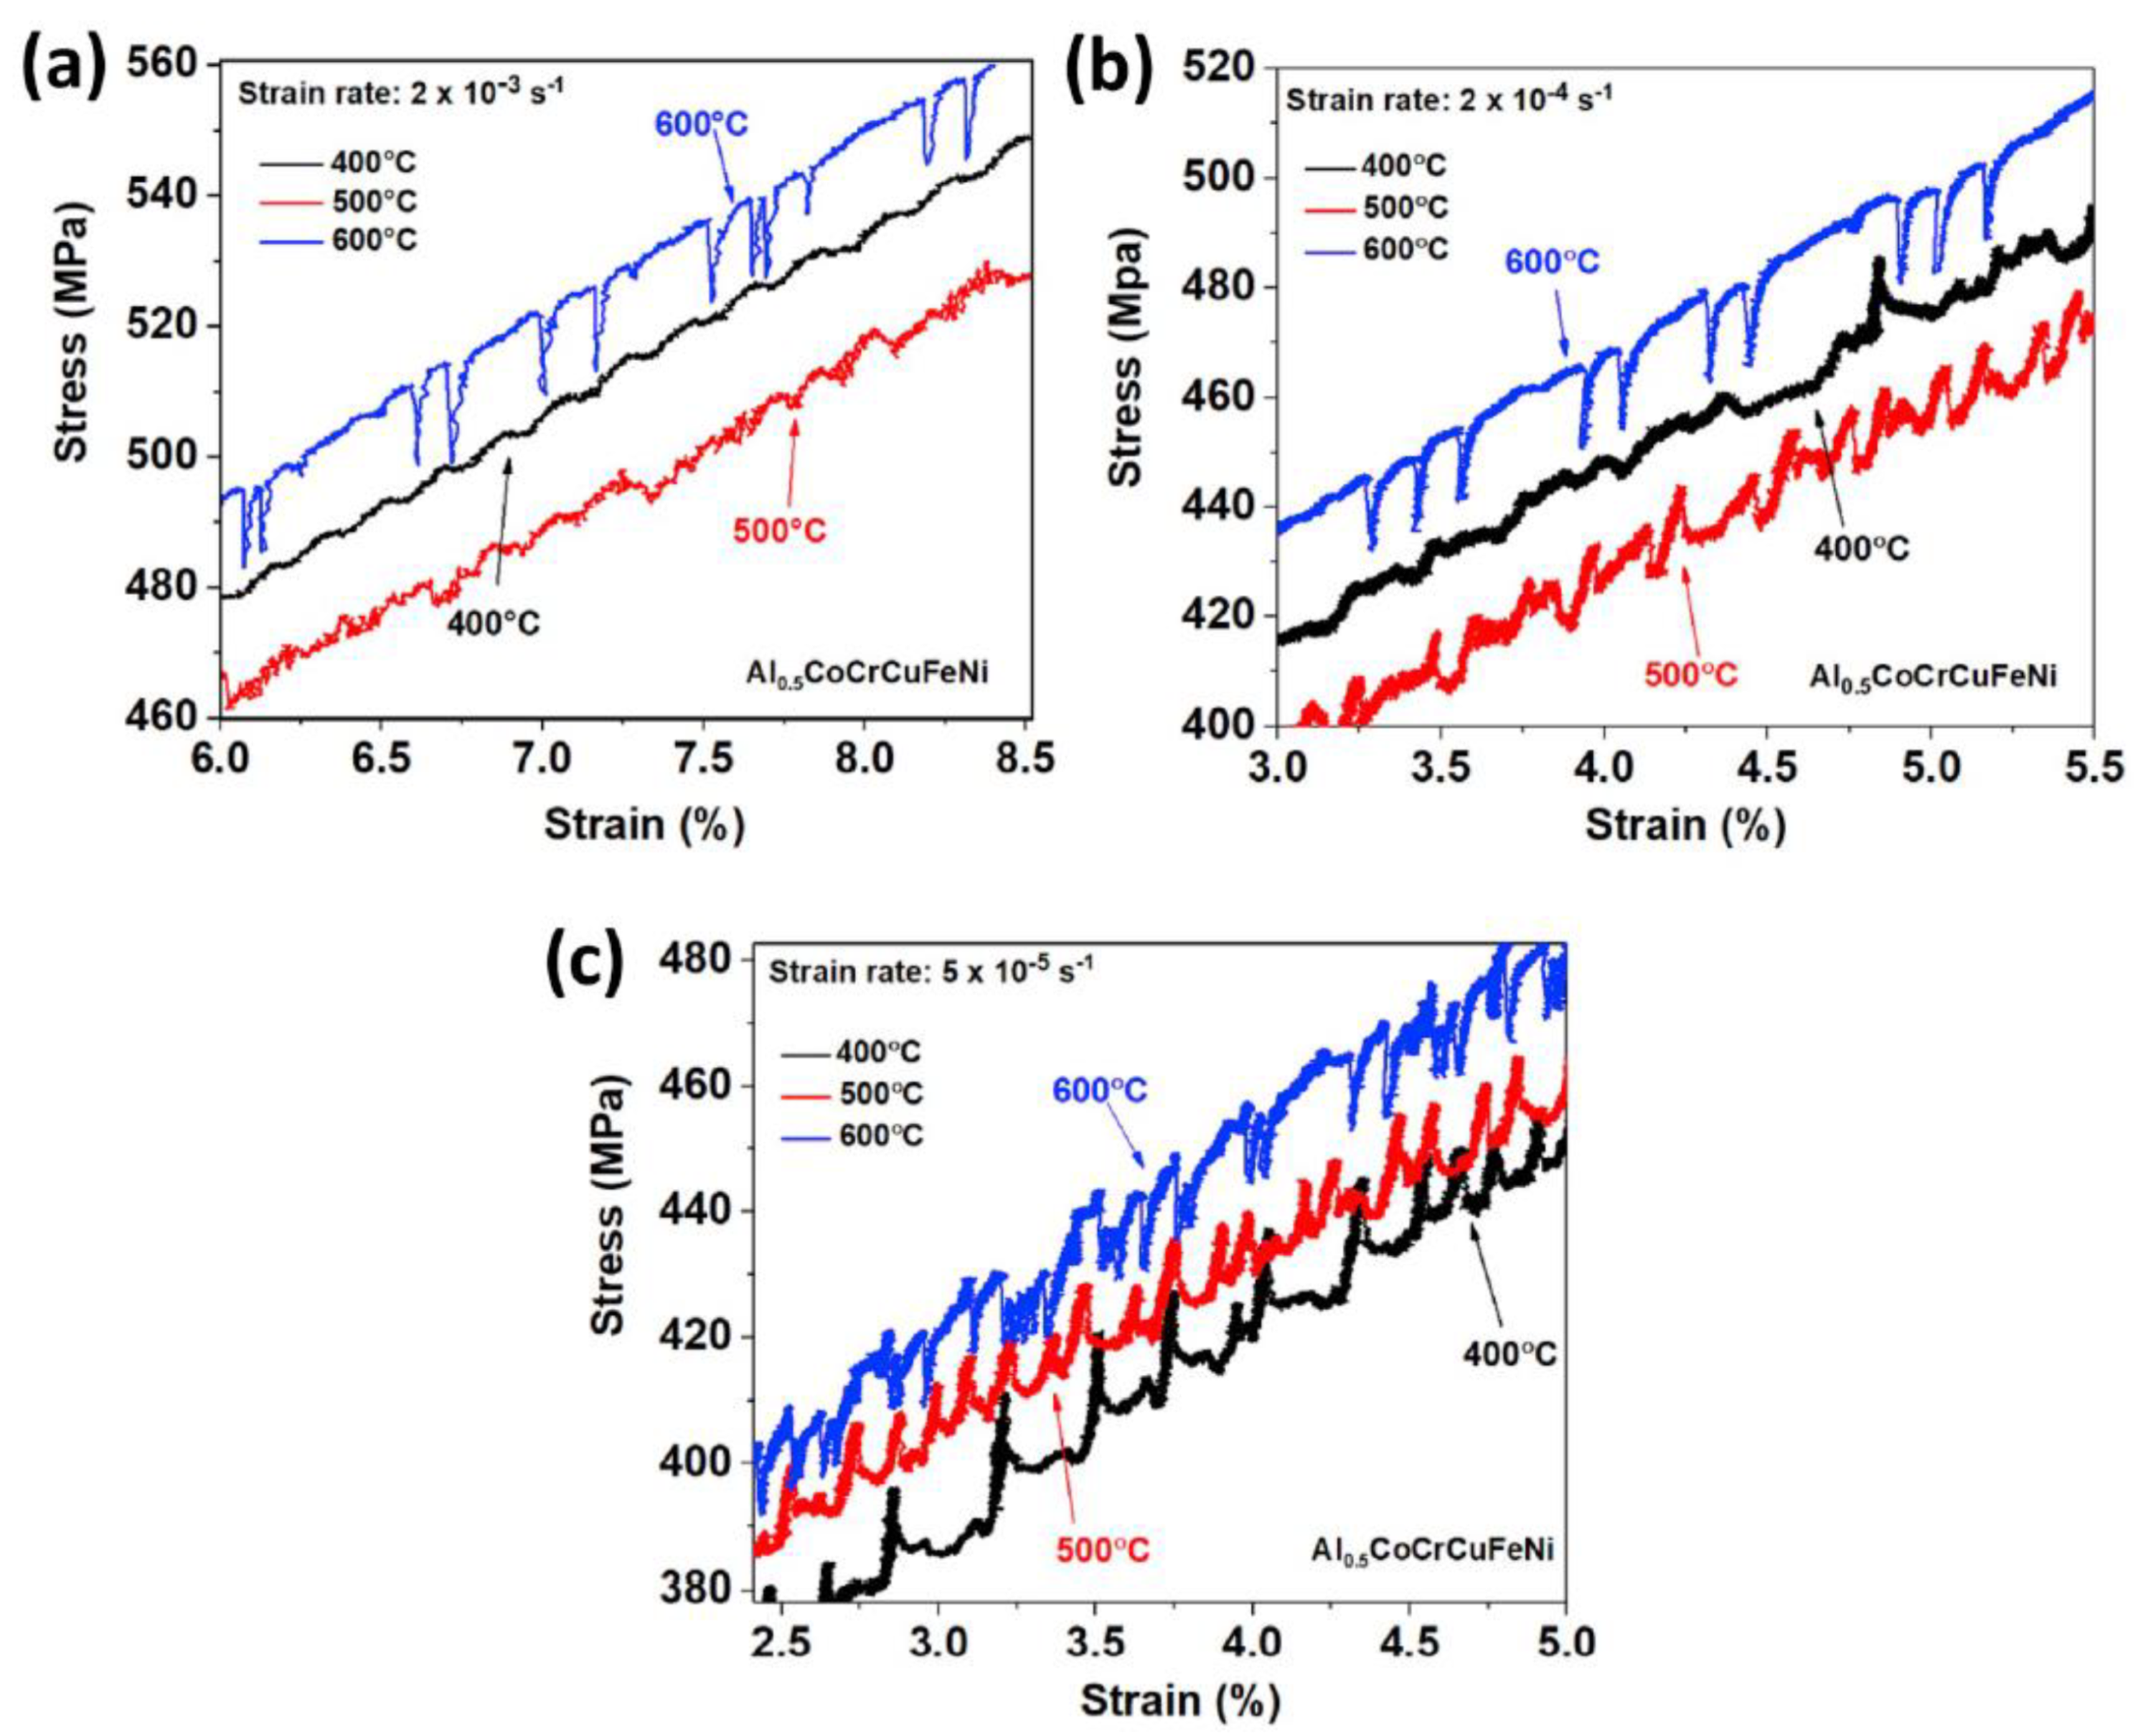
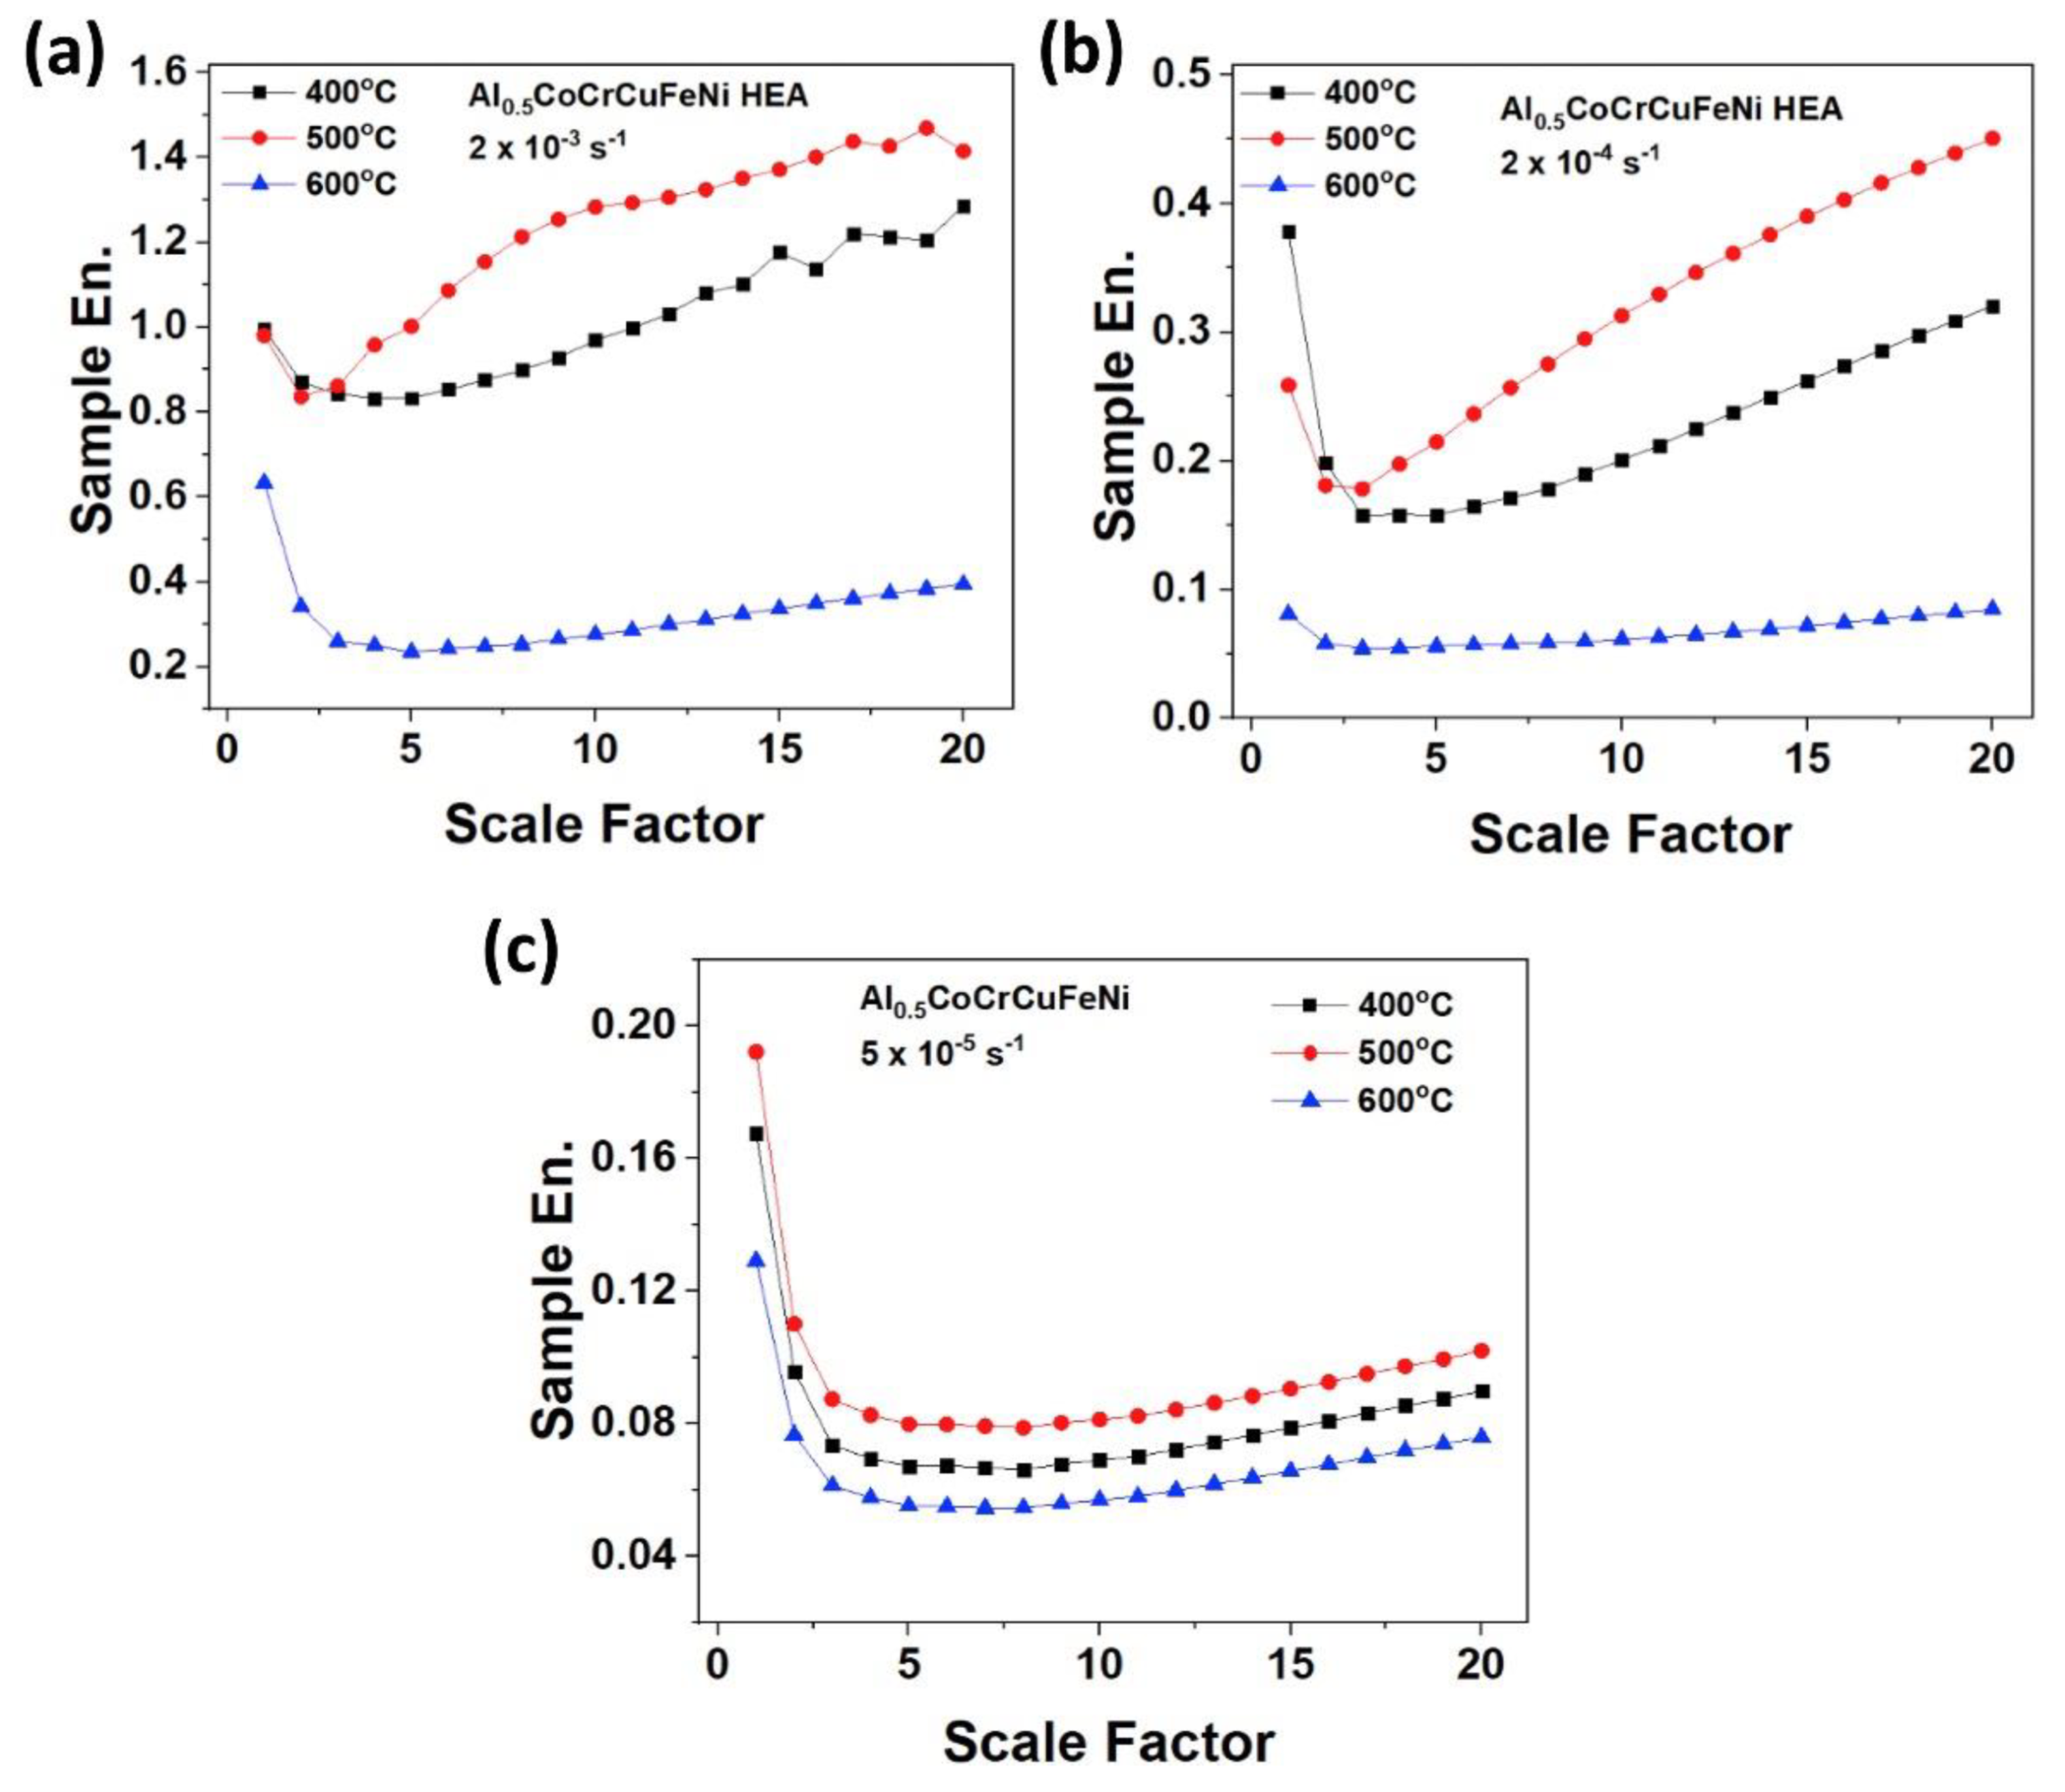
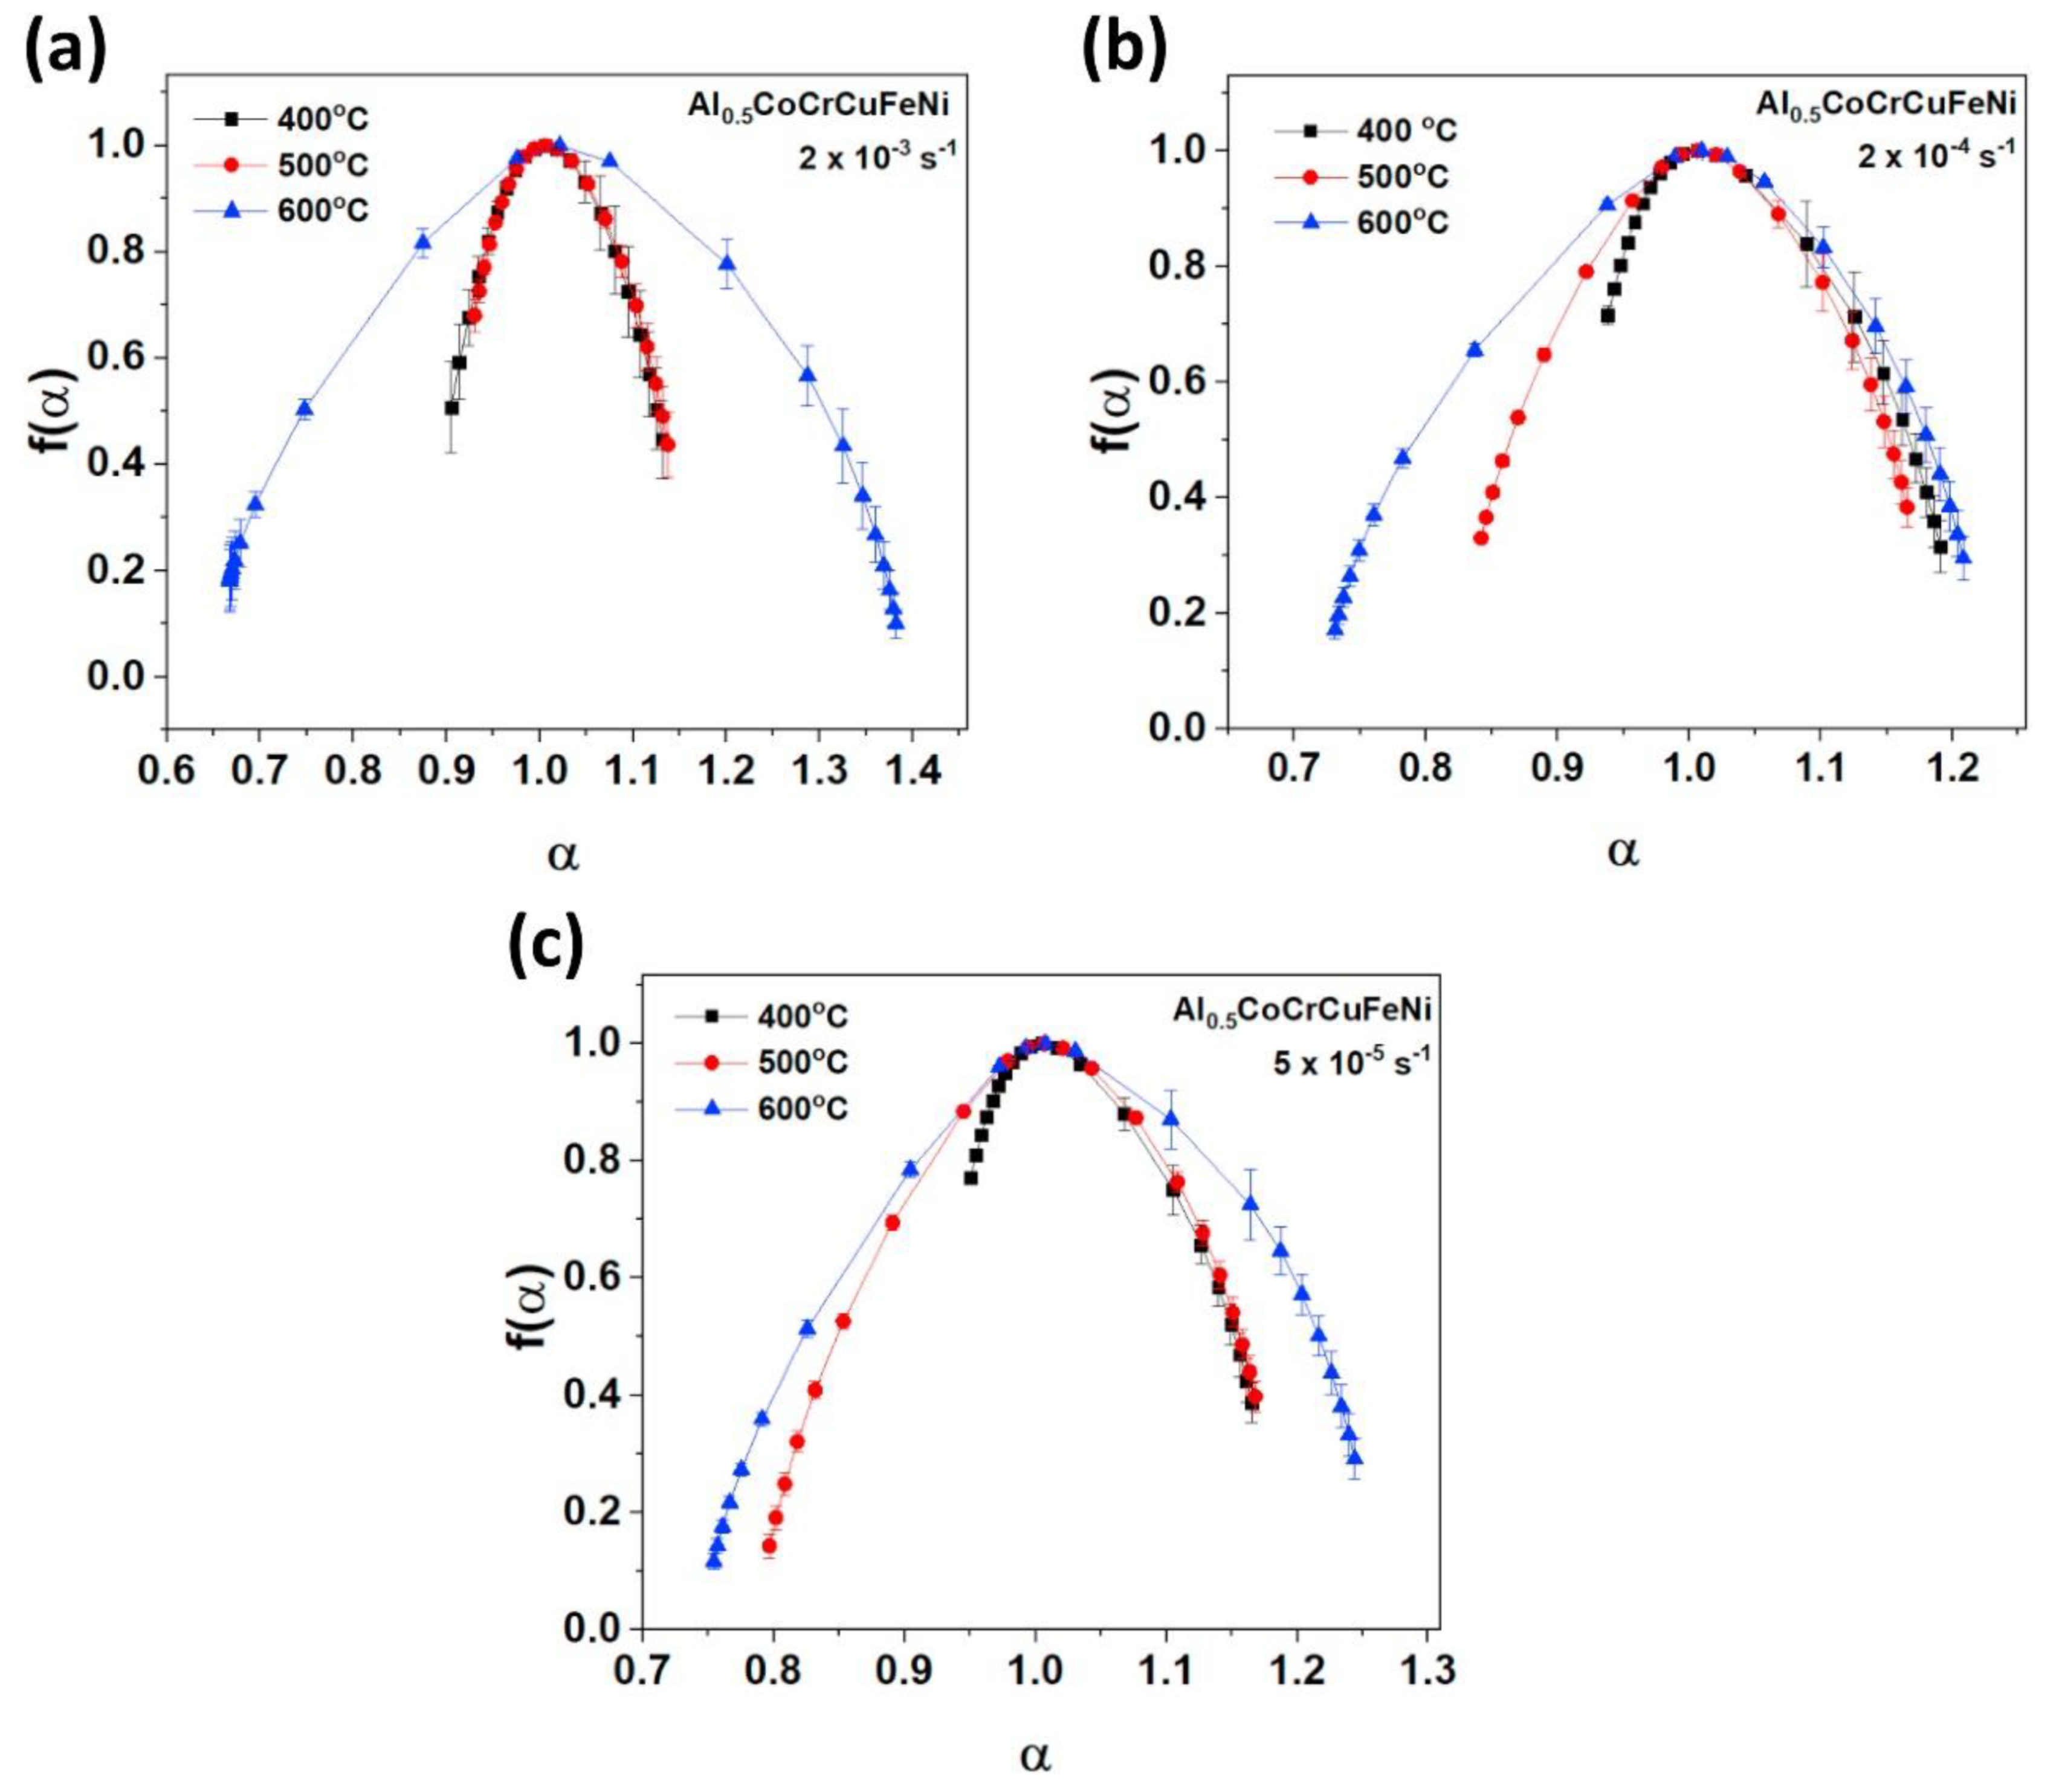
3.1. Al0.5CoCrCuFeNi HEA

Chen et al. performed multiple investigations on the serrated-flow behavior in an Al0.5CoCrCuFeNi HEA [152,154,155,157]. In Reference [152], they examined the effects of temperature on the serrated flow of the above alloy during compression tests. Here, tests were performed at temperatures of 400, 500, and 600 °C, using a strain rate of 5 × 10⁻⁵∙s−1. Synchrotron X-ray diffraction (XRD) (Advanced Photon Source (APS), Argonne National Laboratory, Chicago, IL, USA) revealed that the alloy contained only an FCC phase after testing at 400 and 500 °C, whereas both FCC and body-centered-cubic (BCC) phases were present in the sample tested at 600 °C. Furthermore, it was reported that, with an increase in the test temperature, the critical strain for the onset of serrations decreased, whereas the Young’s modulus increased. The increase in the Young’s modulus with temperature was attributed to the presence of the BCC phase in the sample. It was thought that the decrease in the critical strain with increasing temperature was due to the increased mobility of solute atoms that can catch and pin dislocations, reducing the amount of strains that can occur before the onset of serrations.
In a subsequent study, the serration behavior of the above alloy was examined after being compressed at strain rates of 5 × 10⁻⁵ s−1, 2 × 10⁻⁴ s−1, and 2 × 10⁻³ s−1 and temperatures of 400, 500, and 600 °C [180]. Figure 14 displays the stress vs. strain curves of the experiments. Table 2 presents a list of the serration type for each of the experimental parameters, as defined above. The serration type was dependent on the test temperature, and to a smaller extent, the strain rate. For instance, Type-A serrations were primarily observed at 400 °C, Types A and B were seen at 500 °C, and Type-C serrations occurred at 600 °C.
The serration data were analyzed by using different analytical techniques, such as the RCMSE (complexity) and multifractal methods. The results of the complexity analysis can be observed in Figure 15a–c. For all of the strain rates, the sample-entropy values were the highest for the samples compressed at 500 °C, while they were the lowest for those compressed at 600 °C. This result indicates that, at 500 °C, the serrations exhibited the most complex dynamical behavior, while the opposite was true for the specimens compressed at 600 °C. Using the results from Table 2, we can surmise that, as compared to the Type-A and Type-B serrations, the Type-C serrations exhibited less complex behavior. This lower complexity was attributed to the repeated pinning and unpinning of dislocations [152], which is characteristic of simple behavior. In contrast, the more complex behavior inherent in the Type-A and Type-B serrations corresponded to a couple of factors. Firstly, the relatively greater complexity of the serration behavior could be attributed to the presence of the deterministic chaos that is inherent in Type-B serrations. Secondly, the increased complexity could be related to the greater variety of defect interactions that occur during the serrated flow. These interactions include the solute atom–dislocation line, dislocation line–dislocation line, dislocation line–precipitate interactions, as well as the solute atom–solute atom interactions [180].
Figure 16a–c displays the multifractal spectra for the specimens tested at the prescribed temperatures and strain rates. As can be observed, all the spectra exhibited a parabolic shape for all the experimental conditions. Furthermore, the multifractality was generally found to increase with an increase in the temperature for each strain rate. Consequently, the Type-C serrations were accompanied by the widest multifractal spectra (greatest multifractality), as compared to the other serration types. There was also a sharp increase in the multifractality, and hence the dynamical heterogeneity, at 600 °C for a strain rate of 2 × 10⁻³ s−1. This burst in the multifractality may represent a transition point between different serration types or dynamical behavior [244]. It should also be mentioned that, for the samples tested at 400 and 500 °C, where Type-A and Type-B serrations were observed, the multifractality of the serrated flow was markedly lower. The relatively lower multifractality of the serrations at these temperatures may correspond to serration dynamics that exhibit the self-organized criticality [216].
In another study [155], the Al0.5CoCrCuFeNi HEA was compression tested at temperatures ranging from RT to 700 °C and a strain rate of 5 × 10⁻⁵ s−1. The subsequent TEM (see Figure 17a–d) and XRD characterization revealed that, after testing at a temperature of 600 °C, the matrix contained dislocations, fully ordered L12 particles, and both BCC and FCC phase structures in the alloy. It was also determined that, at 500 °C, there were the partially ordered L12 particles and an FCC phase present in the matrix. It was hypothesized that, during compression, the L12 particles can act as an obstacle for the moving dislocations [155]. This obstruction reduces the mobility of the dislocations enough such that mobile solute atoms can catch and pin them, resulting in the serrated flow. With regards to the serration dynamics, the less complex serrations (Type-C) that were observed at 600 °C may somehow be related to the presence of the fully ordered L12 nanoparticles and BCC phase in the matrix. On the other hand, the more complex serrations observed at 500 °C (Types A and B) were apparently associated with a matrix that contains partially ordered nanoparticles and a single FCC phase. However, the exact relation between the nanoparticles and serration dynamics are still not well understood and should therefore be the focus of future investigations.
In addition to compression and tension testing, the nanoindentation [281] serration behavior of the Al0.5CoCrCuFeNi HEA has also been examined [157]. For their work, nanoindentations were performed, using a NanoTest Vantage (Micro Materials Ltd., Wrexham, UK) equipped with a diamond Berkovich indenter. For the indentations, the samples were indented to a maximum load of 100 mN, using a loading rate of 10 mN/s. To study the effect of temperature on the indentation deformation, the experiments were performed at RT and 200 °C. Figure 18 displays the nanoindentation load as a function of displacement. The magnified insets show that there was a noticeable stair-step pattern for both the RT and 200 °C conditions, which correspond to the serrated flow (displacement bursts). These serrations were thought to be caused by several factors, including the breakaway of dislocations from various obstacles, such as atoms or precipitates, dislocation multiplication, or the evolution of dislocation cells or tangles [282].
Furthermore, it was observed that, for the 200 °C nanoindentation, the sample exhibited larger displacement bursts, as compared to the RT condition. These relatively larger displacement bursts indicate that, at higher temperatures, there is a greater concentration of dislocations that can be activated during the nanoindentation deformation. It should also be noted that, as compared to the RT condition, the tip penetrated the sample at greater depths during nanoindentation at 200 °C. This result suggests that the sample exhibited softening with an increase in the temperature and was most likely a direct result of the promoted thermal activation of dislocations during deformation at higher temperatures.
In a later study, Chen et al. analyzed the nanoindentation-serration behavior of the Al0.5CoCrCuFeNi HEA, using multiple analytical techniques, including the chaos analysis and ApEn methods [154]. Here, indentations were performed, using a Berkovich tip at RT and 200 °C to a peak load of 100 mN. For each temperature condition, three different holding times, namely 5, 10, and 20 s, at the peak load were used. Figure 19 displays the associated depth vs. time data for the nanoindentation experiments with the prescribed temperatures and loading times. As can be observed, there was serrated flow in the holding regime of the data.
The data corresponding to the serrated flow that occurred during the holding periods were analyzed by using methods such as the chaos and ApEn analytical techniques. Figure 20 displays the largest Lyapunov exponent, λ1, and the ApEn results as a function of holding time for times ranging from 5 to 20 s. For both the RT and 200 °C conditions, the λ1 values are positive for all the loading times. This finding signifies that for all the experimental conditions, the serrated flow is associated with slip-band dynamics that exhibit chaotic behavior. The result also means that the serration dynamics are sensitive to initial conditions. Furthermore, the largest Lyapunov exponent increased with an increase in the temperature (for a given holding time), indicating that the serrated flow exhibited a greater degree of chaotic behavior at 200 °C. This increase in the chaotic dynamics at the elevated temperature was attributed to a greater mobility of dislocations. It was also observed that, for both temperatures, λ1 attained a minimum at a holding time of 10 s, which indicates that the serrated-flow behavior was the least affected by initial conditions, as compared to the other holding times. In terms of the ApEn values, they exhibited a similar trend as λ1 for the sample tested at 200 °C. Furthermore, both values attained a maximum for a holding time of 5 s. The authors hypothesized that the maximum values for the lower holding time corresponded to the increase in the number of interactions among the slip bands that are indicative of a more complex process. As for the room-temperature nanoindentation, a holding time of 10 s was accompanied by both a minimum λ1 value and a maximum value for the ApEn. This result indicates that the serration behavior exhibited dynamical behavior that has both a relatively low sensitivity to initial conditions and also a greater degree of freedom [154].
Antonaglia et al. applied the mean-field theory to analyze the slip-avalanche statistics for the investigated conditions [167]. For the experiments, specimens with a length of 4 mm and diameter of 2 mm underwent uniaxial-compression tests at a strain rate of 4 × 10⁻⁴ s−1, at temperatures of 7, 7.5, and 9 K. The test temperature was controlled by using liquid He. Figure 21a shows the stress vs. strain data resulting from the compression experiments, and the results of the analysis are displayed in Figure 21b. As can be seen, serrations were observed at all three test temperatures. Furthermore, it was found that the magnitude of the serrations significantly increases with an increase in the compression strain. It was also noted that a similar trend has previously been observed in BMGs [133,136,283]. The largest stress-drop size decreases as the temperature increases from 7 to 9 K. This decrease in the slip size for the above temperature range is in agreement with the model prediction, which states that the magnitude of the slip avalanche will be reduced as the temperature increases [284]. The reduction in the avalanche size was related to the twinning phenomenon in the HEA at cryogenic temperatures, where an increase in the temperature increased the difficulty in which deformation twinning could be induced during compression.
In a similar study, the serrated flow during uniaxial compression was analyzed by using the chaos formalism [165]. Here, samples were compressed at a strain rate of 4 × 10⁻⁴ s−1 and temperatures ranging from 4.2 to 9 K. It was found that the serrated flow exhibited similar behavior (7.5 and 9 K) to that observed by Antonaglia et al. [167]. The results of the analysis revealed that the largest Lyapunov exponent was negative at all the test temperatures. This result indicates that the serrated flow did not exhibit chaotic behavior and indicates that the slip dynamics are stable. It is interesting to note that these results are in contrast with those from Chen et al, where it was determined that the serrated flow during nanoindentation at RT and 200 °C exhibited chaotic behavior [154]. However, it is important to note that the deformation mechanisms associated with twinning at cryogenic temperatures are completely different from those which occur during nanoindentation pop-ins at temperatures greater than or equal to RT. Therefore, these findings suggest that the sensitivity of the serration behavior to initial conditions may depend on the underlying deformation mechanisms.

3.2. Al0.1CoCrFeNi HEA

Xia et al. studied the deformation mechanisms of an Al0.1CoCrFeNi HEA that was produced by vacuum-levitation methods [285]. For the experiment, specimens underwent uniaxial-compressive tests where samples were exposed to a strain of 2 × 10⁻⁴ s−1 and temperatures of 77 K, 200 K, and 298 K. Results showed that the serrated flow was only observed in the sample compressed at 77 K.
To gain a better understanding of the underlying deformation mechanisms, TEM characterization was performed on the samples after testing (see Figure 22a–d). Figure 22a,b displays the microstructures of the specimens that were tested at 200 and 298 K, respectively. As can be seen, the sample that was compressed at 200 K had a greater dislocation density, as compared to the sample that was tested at 298 K. The results of the Burgers-vector analysis revealed that at these temperatures, the plastic deformation in the HEA occurred mainly by the planar slip of ½ < 110> type dislocations on {111}-type planes. This result indicates that deformation at these temperatures occurs only by the dislocation glide. Importantly, this finding is consistent with what is observed in other FCC solid solutions [286]. Figure 22c,d shows the TEM imaging results for the sample tested at 77 K. Here, the microstructure consisted of narrow deformation twins that had widths on the order of tens of nanometers. Furthermore, the TEM characterization indicated that nanoscale-deformation twins leading to the {111} <110> primary slip system were the primary deformation mechanisms responsible for the serrated flow during compression.
Hu et al. examined the serrations in the compressed nanopillars composed of the Al0.1CoCrFeNi HEA [160]. For the experiments, pillars with diameters of 500–700 nm underwent in situ compression tests, using direct electron imaging. The compression tests were performed by using a strain rate of ~1 × 10⁻³ s−1 in a Hysitron PI95 picoindenter equipped with a 2 μm flat punch diamond indenter in a JEOL 2010 LaB6 TEM (JEOL USA Inc., Boston, MA, USA) with an operating energy of 200 keV. The mechanical-deformation data were accumulated, using a data-acquisition rate of 500 Hz.
Figure 23 presents the stress vs. strain data for the in situ TEM compression test. As can be observed, there were multiple slip events that occurred during the experiment. Furthermore, the authors divided the deformation process into three stages that consisted of (1) little or no stress drops, (2) medium-sized stress-drops, and (3) relatively larger stress-drops. A comparison of the stress-time data and the three corresponding stages of the stress-drop behavior, as observed by the TEM and SEM, can be seen in Figure 24a–e. With respect to stage I, the stress drops corresponded to the wave-like propagation of dislocations from the top of the pillar to the bottom. As for Stage-II stress drops, they were attributed to small dislocation avalanches. Finally, stage III stress drops corresponded to dislocation avalanches that led to large crystal slips.
The CCDF analysis was performed on the serration behavior, and the results can be seen in Figure 25a,b. The data were modeled according to Equations (15) and (16), for which D(S, q) = S−(κ − 1)g[S(σσc)1/β], where κ and β are critical exponents, σ is the applied stress, σc is the failure stress, and g is a universal scaling function defined as x κ 1 x e A t t κ d t [222] with A = 1.2. These data were for samples with diameters ranging from ~512 to 655 nm. For Figure 25a, the CCDF, as a function of the stress level over the maximum stress, was plotted with respect to the slip size. Figure 25b displays the rescaled CCDFs in which the curves have collapsed onto one another. The critical exponents, κ and β, were determined by tuning them until the curves collapsed, and were found to be consistent with the predicted MFT values of 1.5 and 0.5, respectively [222].
The results of the analysis led to the following important conclusions. Firstly, the distribution used in their analysis is predicted by a simple, coarse-grained model [222,256]. Secondly, the avalanche mechanism responsible for the observed serration behavior in the samples is based not only on the interactions between the dislocation bands and the dislocation pileups, but also the pileup and the dislocation pinning centers, as well. Thirdly, the applied stress is a critical tuning parameter due to the dependence of the slip avalanche on the stress level. Finally, the deformation behavior exhibited by the Al0.1CoCrFeNi HEA is characteristic of the tuned critical behavior rather than the self-organized criticality, indicating that the corresponding avalanche distribution is universal in nature.

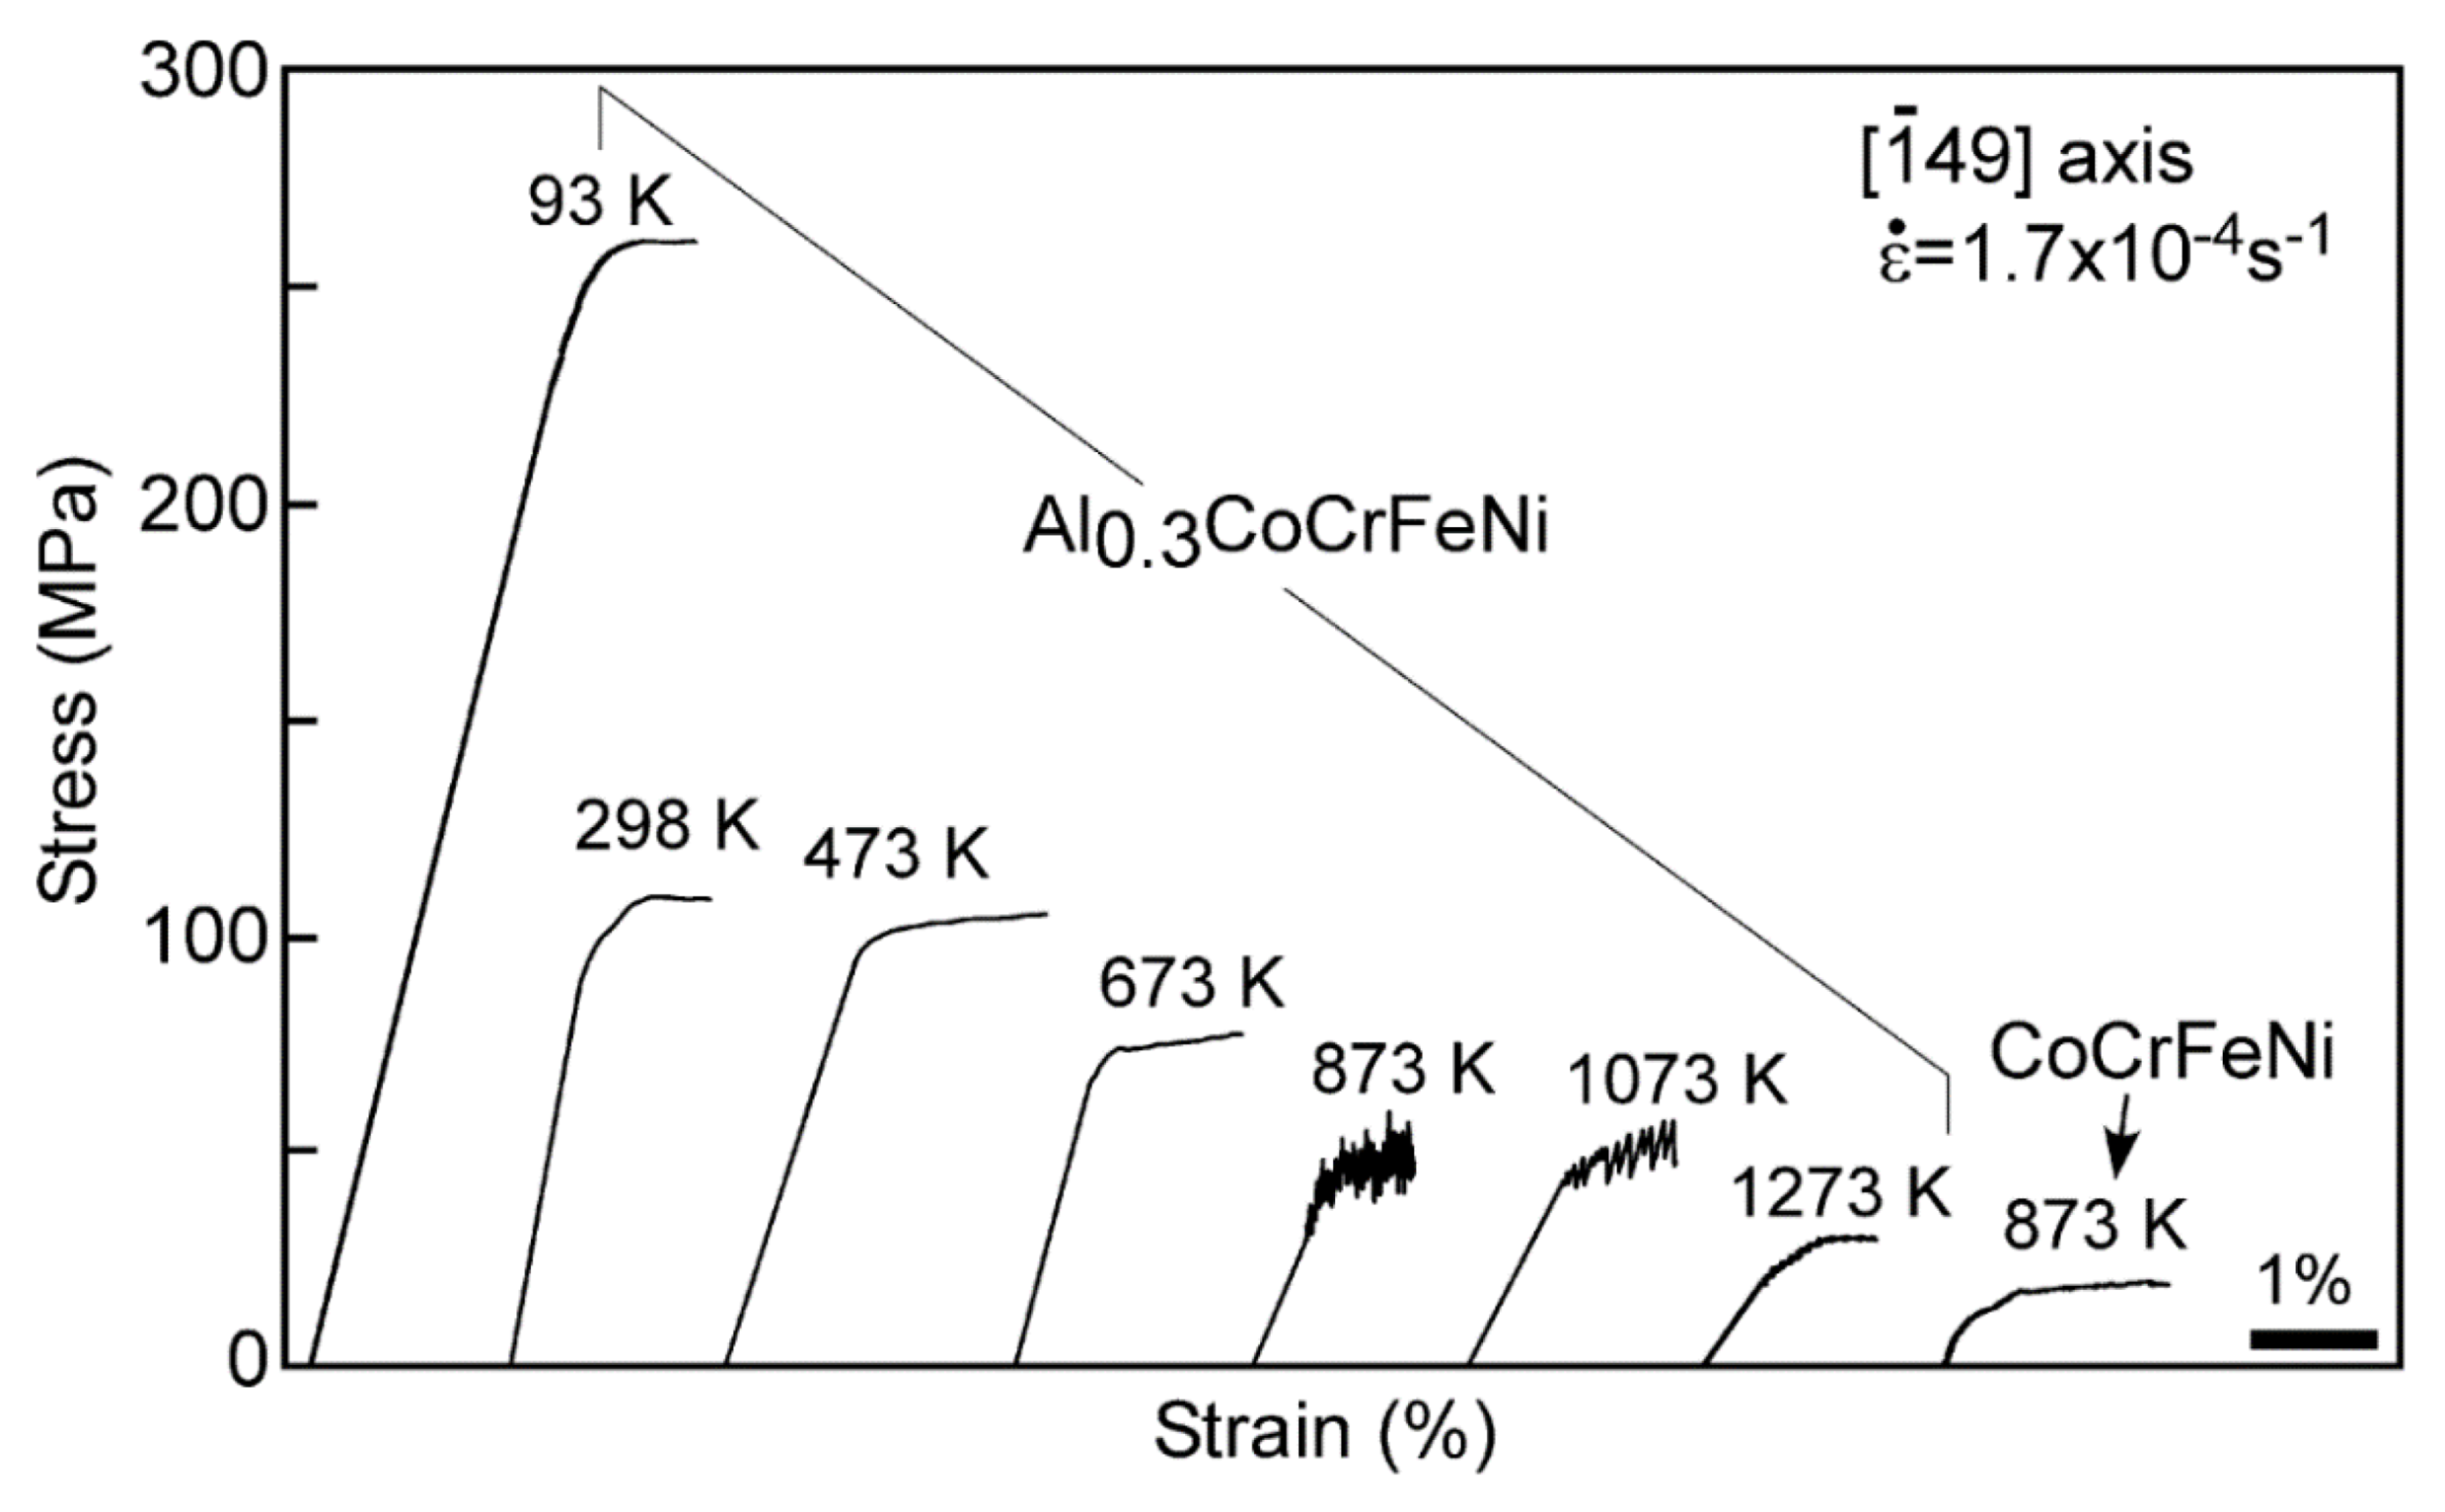
3.3. Al0.3CoCrFeNi HEA

The effect of Al on the serrated flow has also been observed in an investigation involving the Al0.3CoCrFeNi HEA [191]. Here, Yasuda et al. examined the deformation behavior of the single-crystal CoCrFeNi and Al0.3CoCrFeNi HEAs during compression. For their experiment, they compressed samples at a strain rate of 1.7 × 10⁻⁴ s−1 for temperatures ranging from −180 to 1000 °C (93–1273 K). Figure 26 displays the results, and, as can be observed, the Al0.3CoCrFeNi HEA exhibited the serrated flow, while the other specimen did not when tested at 600 °C. The serrated flow that was observed in the DSA regime was thought to be related to Al-containing solute atmospheres that were created near a moving dislocation core, thus leading to an increase of the frictional stress on the dislocations. Similar to the findings reported by Niu et al. [94], this result indicates that Al atoms play an important role in the serrated-flow behavior that occurs in the HEA during DSA. This finding also suggests that not every atom can act as a solute that participates in dislocation locking that results in the serrated flow.
Zhang et al. also examined the compression behavior of the Al0.3CoCrFeNi HEA [169]. The compression tests were performed on a Gleeble 3500 thermo-mechanical simulator (Dynamic Systems Inc., Poestenkill, NY, USA) at temperatures ranging from 400 to 900 °C at a strain rate of 10−3 s−1. Figure 27a–d shows the true stress vs. true strain behavior for the samples tested at the above conditions. Serrations were observed in all of the deformation curves, and it was determined that the serration type was dependent on the test temperature. A summary of the serration type for each of the experimental conditions is displayed in Table 3. As can be seen in the table, Type-C serrations were observed at 400, 500, and 600 °C. At 700 °C, the serrated flow exhibited Type-B + Type-C serrations, whereas only Type-B serrations could be observed in the deformation curve at 800–900 °C. The authors reported that the number of relatively larger stress drops decreases with respect to the test temperature. Furthermore, it was also found that Type-A serrations were not observed in any of the deformation curves. These results appear to contradict those of other studies [8] where serrations have been observed to evolve from Type-A to Type-B, and then to Type-C with increasing temperature. Importantly, it was hypothesized that Type-C serrations were related to the nucleation and growth of twins, while Type-B serrations corresponded to the pinning (by mobile solute atoms) and unpinning of moving dislocations that is inherent in the DSA model [94,191].
Qiang et al. investigated the nanoindentation-serration behavior of as-cast and torsionally deformed (nano-grained) Al0.3CrCoFeNi HEA samples [287]. Room-temperature nanoindentations were performed by using a Hysitron Triboindenter TI950 (Bruker Corp., Santa Barbara, CA, USA) equipped with a Berkovich indenter. For the deformed samples, they underwent a compressive pressure of 10 GPa (RT) for 1, 3, and 10 rotations at one revolution per minute. For the nanoindentations, 15 indents were performed in which a loading rate of 250 µN/s was used. The samples were also examined, using different methods, such as XRD and Vickers-hardness tests. The XRD characterization revealed that all the samples contained a single-phase FCC structure. Vickers-hardness tests revealed that torsion led to a significant hardening of the alloy. The results also showed that the grain size was reduced from hundreds of microns in the as-cast state to tens of nanometers after 10 revolutions. It was also found that nanotwins and SFs were observed in the nanograins, despite the reported high SF energy.
In terms of mechanical behavior, it was surmised that, in the deformed nanograined HEA, the emission of Shockley partial dislocations at the grain boundaries and/or grain-boundary sliding may be the dominant deformation mechanism in the alloy. It was also reported that the as-cast HEA showed the slip-avalanche behavior, while the deformed samples did not exhibit any pronounced pop-ins (see Figure 28a). The lack of pop-ins exhibited by the deformed samples were attributed to the presence of affluent grain boundaries that act as extra mediators for plastic deformation and barriers for dislocation motion. The pop-ins that occurred in the as-cast sample exhibited relatively smaller pop-ins, as compared to alloys with a BCC lattice that displays only one pronounced pop-in [288,289]. This difference in the magnitude and the number of pop-ins was likely due to different dislocation-nucleation processes in the alloys, such as perfect dislocations in BCC crystals and partial dislocations in FCC crystals [289].
Figure 28b presents the cumulative-probability distribution of the displacement burst size, S [ P ( > S ) = A S β e S S c ], for the as-cast Al0.3CrCoFeNi HEA sample. As previously discussed, the distribution represents the percentage of pop-in events with the displacement burst size being larger than a given value, S. As can be seen in the figure, the probability of observing a pop-in of a size, S, significantly decreases with an increase in the size, S. It was also reported that the parameters Sc and β were approximately 0.014 ± 0.000 and 0.15 ± 0.02, respectively, which indicates that slip avalanches did indeed occur in the as-cast sample during the nanoindentation deformation.

3.4. Al0.5CoCrFeNi HEA

Niu et al. examined the tension behavior of Al0.5CoCrFeNi and CoCrFeNi alloys [94]. For their investigation, samples underwent tension at strain rates of 10−3 s−1, 5 × 10⁻⁴ s−1, and 10−4 s−1, in addition to temperatures of 200–500 °C. Figure 29a–c presents the stress vs. strain curves for the Al0.5CoCrFeNi HEA samples tested in the above conditions. As can be observed, the serrated flow consisted of Type-A, Type-B, Type-C, Type-A + Type-B, and Type B + Type-C serrations, which have been tabulated in Table 4. The results indicate that the serrations evolve from Type-A to Type-A + Type-B, and then to Type-B + Type-C, with a decrease in the strain rate and increase in the temperature. They also found that the serrated flow was a consequence of the DSA effect, and not strain-induced transformations or twinning. Statistical analysis was also performed on the serration behavior, and it was found that the distribution of the stress-drop magnitudes primarily exhibited the power-law behavior.
Figure 30a,b shows a comparison of the stress vs. strain behavior for the Al0.5CoCrFeNi and CoCrFeNi alloys. As can be seen, the Al-containing HEA exhibited significantly more pronounced serrations, as compared to the CoCrFeNi alloy. From this result, the authors surmised that the Al played a significant role in the DSA phenomenon in the HEA and was attributed to the atomic-size mismatch between the Al and the rest of the matrix atoms. In addition to the above finding, the authors reported some other interesting results. For example, it was observed that the tensile strength and elongation of the material both decreased with increasing temperature, signifying an embrittlement of the alloy. They noted that similar trends were reported in other Al-containing HEAs [290,291], and thus concluded that the trend of embrittlement may be related to the DSA phenomenon in HEAs.

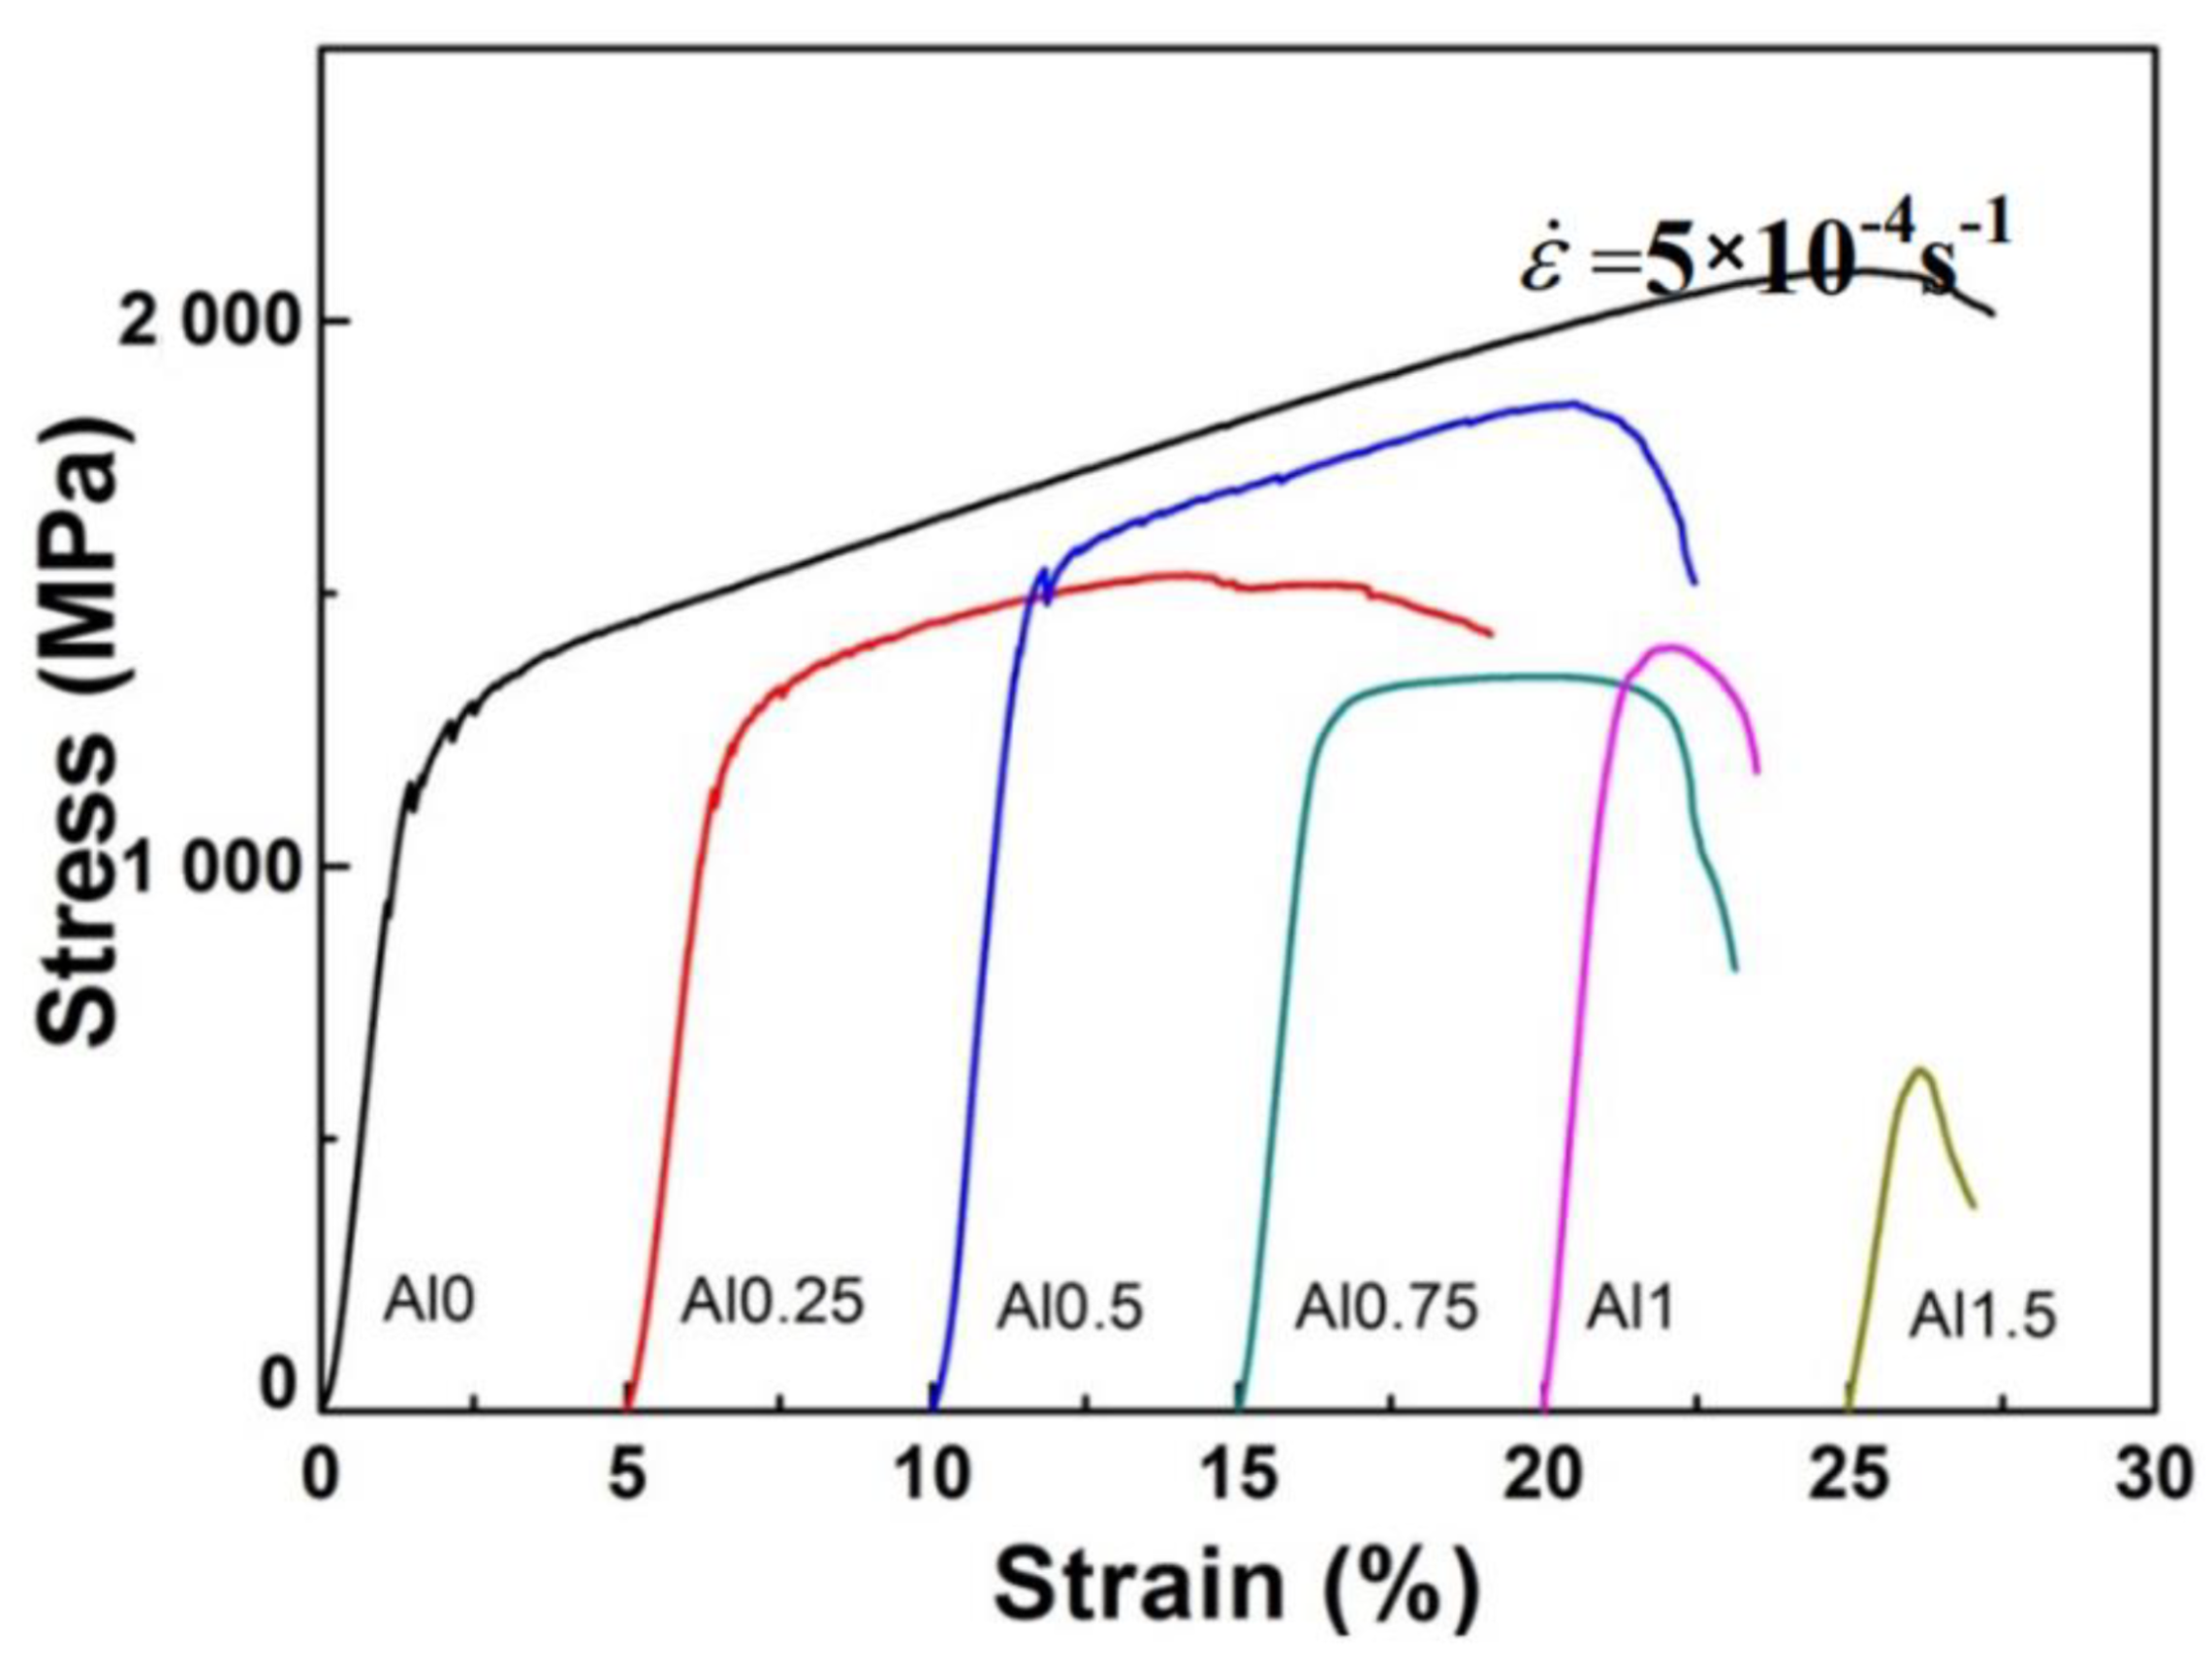
3.5. Al0.7CoCrFeNi HEA

Basu et al. investigated the nanoindentation-deformation behavior in a multi-phase Al0.7CrFeCoNi HEA that consisted of both BCC and FCC phases [292]. The energy-dispersive spectroscopy (EDS) characterization revealed that the BCC phases were composed of the (Ni, Al)-rich ordered B2 phase and (Fe, Cr)-rich disordered A2 phase. Figure 31a presents the load vs. displacement curve for four different indents that were performed inside the BCC HEA grain. Figure 31b presents a magnification of the indents, which features the elastic to plastic transitions, signifying a clear transition from Hertzian behavior [293]. The plastic regime of the nanoindentation curve that is displayed in Figure 31b consists of multiple pop-in events that are characteristic of the serrated flow in the alloy. The serrated flow was thought to be a consequence of the resistance provided by the interfacial-strengthening mechanisms between the soft A2 phase and the elastically stiffer B2 matrix against the dislocations.

3.6. AlxNbTiMoV HEA

Chen et al. investigated the compressive behavior of a BCC AlxNbTiMoV HEA [179]. Here, the molar ratio, x, of Al ranged from 0 to 1.5. For their experiments, samples underwent compression tests at RT and strain rates of 5 × 10⁻⁵ s−1, 5 × 10⁻⁴ s−1, 5 × 10⁻³ s−1, and 5 × 10⁻² s−1. Figure 32 displays the compressive engineering stress–strain curves for the alloy that was compressed at a strain rate of 5 × 10⁻⁴ s−1. As can be seen, there were observable serrations for x = 0, 0.25, and 0.5 around the yielding point. The authors surmised that the serrated flow was a consequence of the interactions between moving dislocations and Cottrell atmospheres [294]. In this context, the serrations occur due to the drag effect caused by Cottrell atmospheres that surround a dislocation and lock it in place. It was found that the yield strength of the alloy increased with an increase in x for this range of molar ratios. Furthermore, these values of x corresponded to atomic-size differences and lattice parameters that were greater than 3.22% and 3.191 Å, respectively. This result suggests that in the Al-containing HEA, there is an atomic size disparity and lattice volume, which, when exceeded, prohibits dislocation locking from occurring. As for the samples that did not contain Al (x = 0), serrations were observed for all the given strain rates. Furthermore, the amplitudes of the serrations were relatively larger for the intermediate strain rates of 5 × 10⁻⁴ s−1 and 5 × 10⁻³ s−1, while they were barely noticeable for the lowest strain rate of 5 × 10⁻⁵ s−1.
It is interesting to note that the presence of serrations in the sample which does not contain Al is in contrast with the results as reported by Yasuda et al., where serrations were observed in AlxCoCrFeNi HEA when x = 0 [191]. The serrations in the NbTiMoV alloy (i.e., x = 0) may be due to various reasons. For instance, the presence of interstitial impurities, such as C, may pin dislocations [295]. On the other hand, the observed serrations may be due to the other constituent elements pinning the dislocations, which supports the theory that any atom in the matrix can act as a solute in HEAs. Therefore, more work is required to elucidate the effect of impurities and additives, such as Al and C, on the serrated-flow behavior in HEAs.

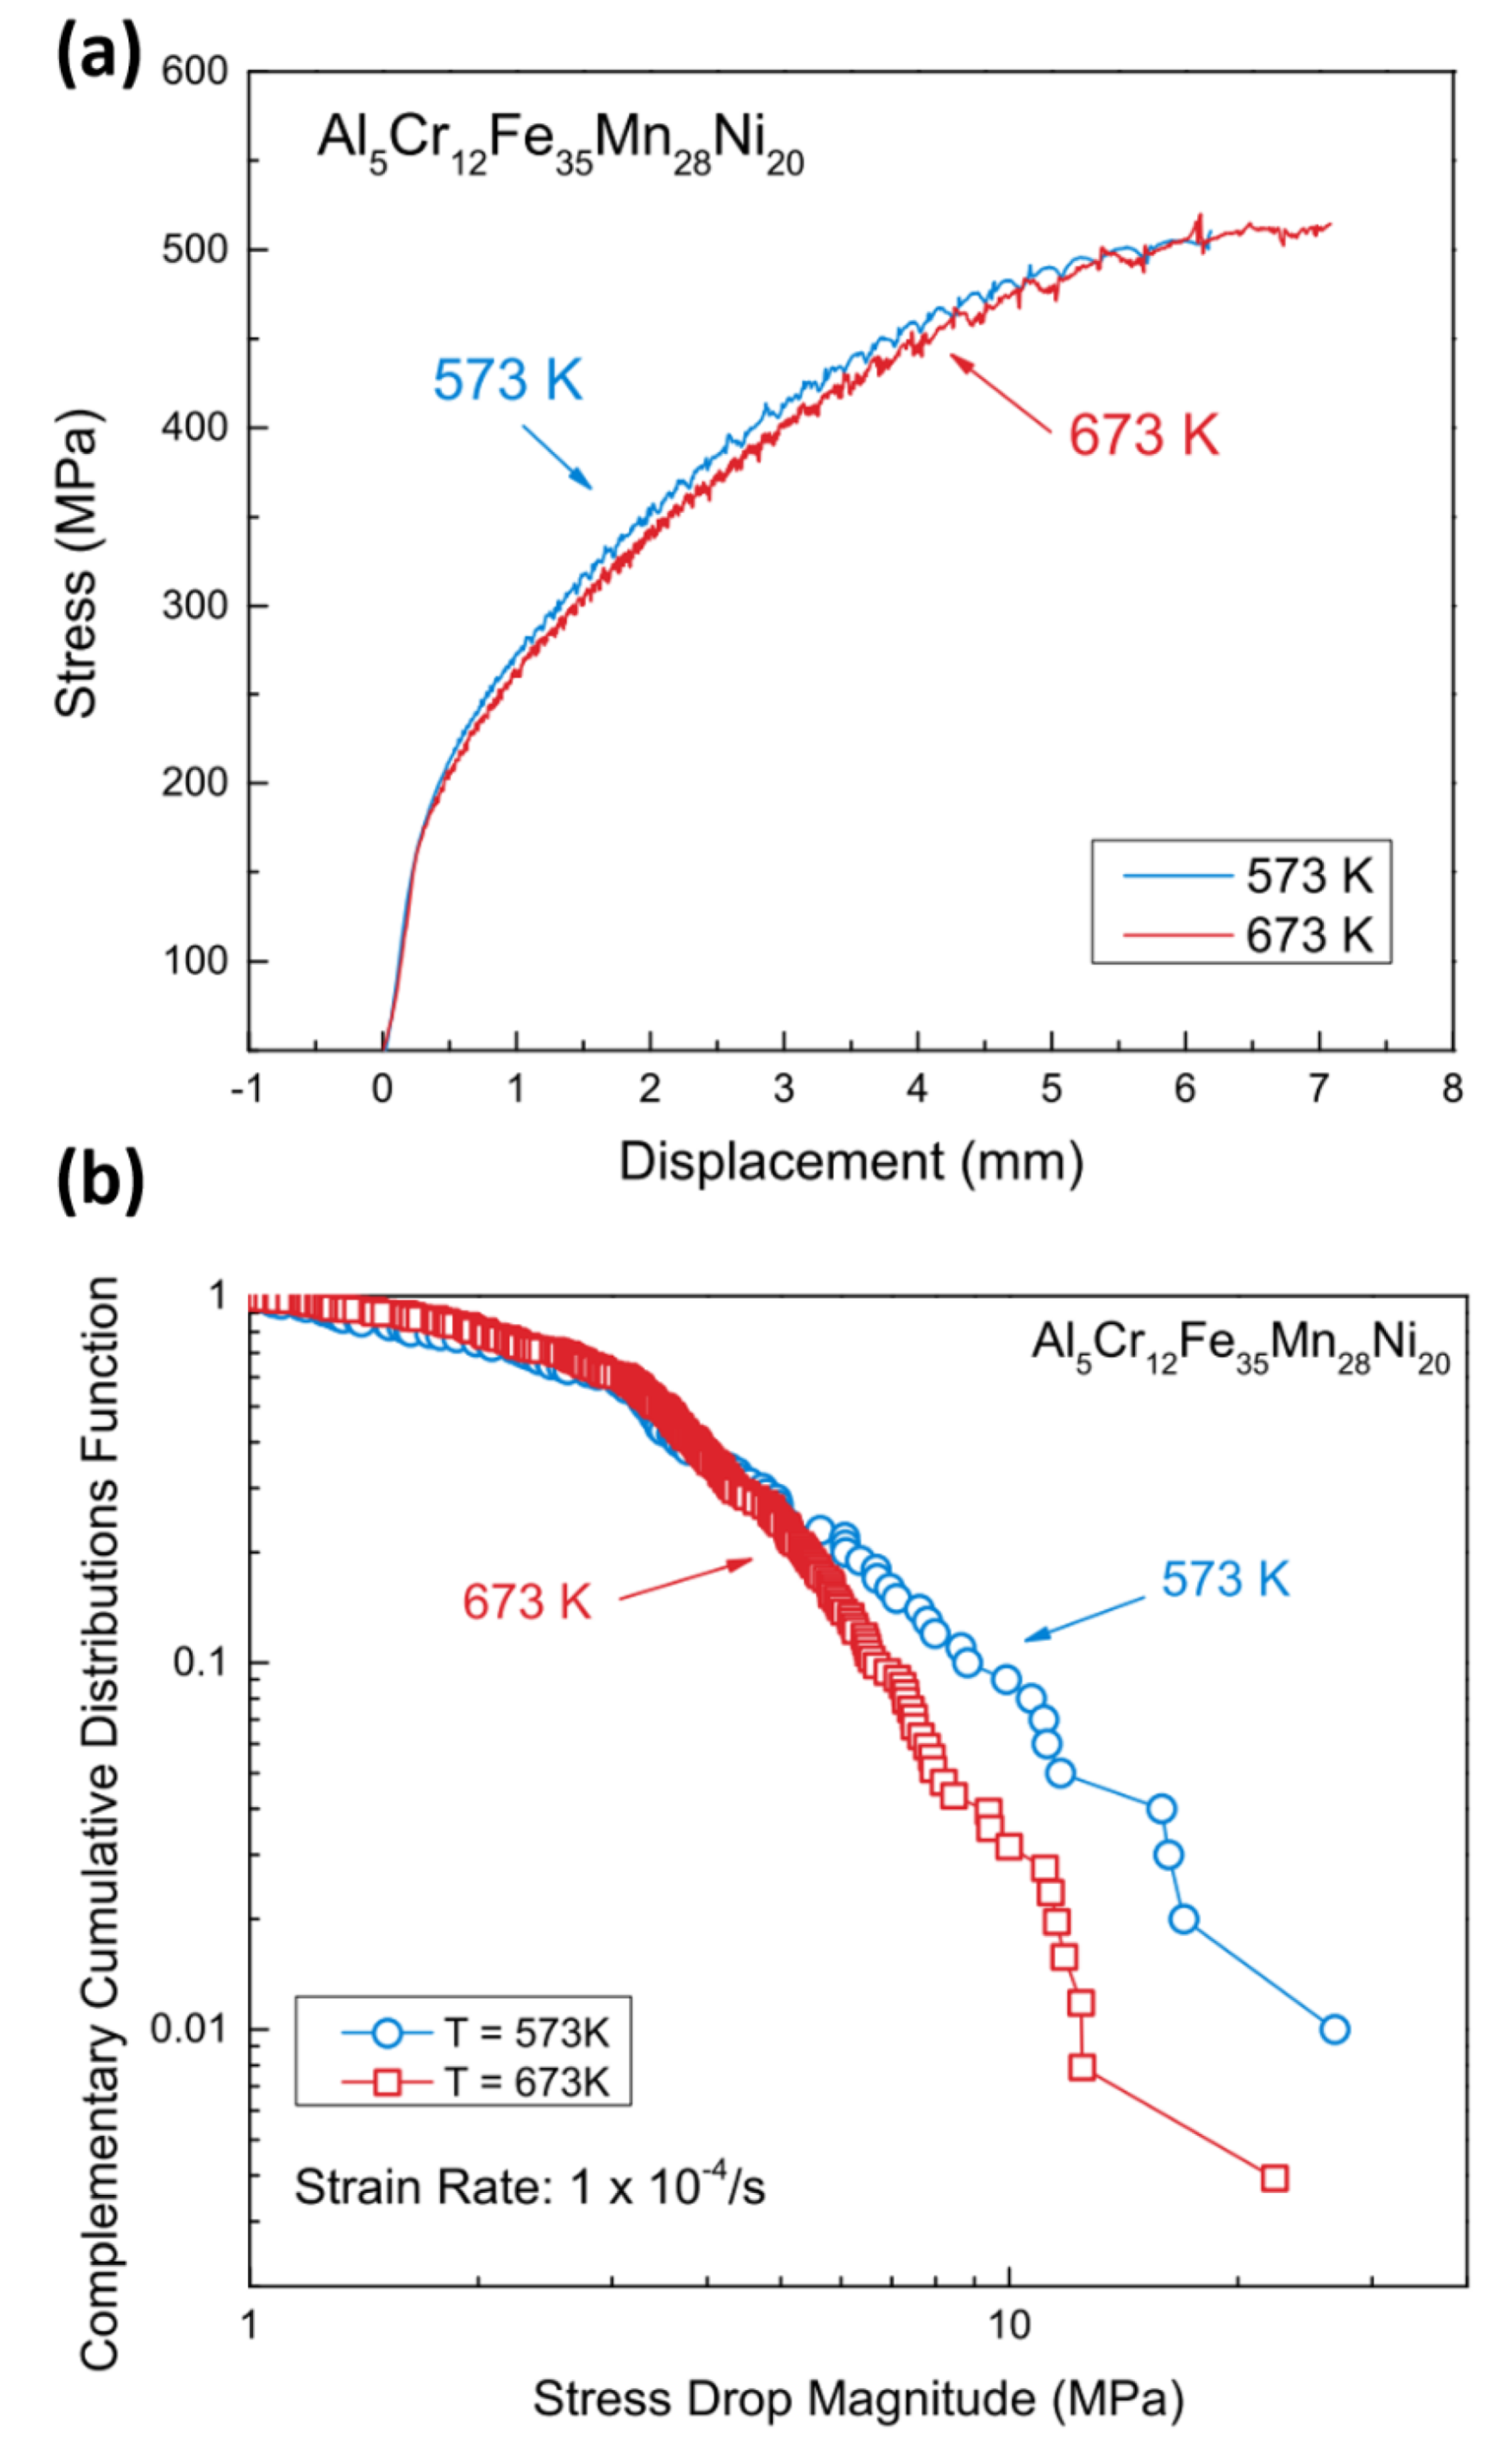
3.7. Al5Cr12Fe35Mn28Ni20 HEA

The serration behavior was examined in an Al5Cr12Fe35Mn28Ni20 HEA that was tension tested at temperatures of 300 and 400 °C and a strain rate of 1 × 10⁻⁴ s−1 [167]. Here, the gauge section of the specimens was 3 mm in diameter and 12 mm in length. The stress vs. displacement and the corresponding CCDF curve are displayed in Figure 33a,b. It is apparent from the graph that the samples exhibited serrations at both temperatures. Moreover, the magnitudes of the serrations were found to increase as the sample deformed. From the results of the statistical analysis, as displayed in Figure 33b, the magnitude of the largest stress drop decreased with an increase in the temperature. Importantly, this result is consistent with the reported trend predicted by the simple mean-field model [222,252,256]. The authors hypothesized that the relatively smaller slip sizes at the higher temperature is attributed to the increased thermal-vibration energy of the pinning solute atoms. More specifically, the pinning effect of the solute atoms on the dislocations is reduced at higher temperatures, since the solute atoms have a greater tendency to “shake away” from their low-energy sites for pinning [167,187].

3.8. Ag0.5CoCrCuFeNi HEA

Laktionova et al. investigated the compression behavior of the Ag0.5CoCrCuFeNi HEA at temperatures ranging from 4.2 to 300 K (from −269 to 27 °C) [296]. Here, cylindrical samples with a diameter of 2 mm and length of 4 mm were undergoing compression testing at a strain rate of 4 × 10⁻⁴ s−1. The loading of the sample was terminated when the strain reached values of ~20–30%. To perform the testing at temperatures below 77 K, samples were cooled with helium vapor, while the nitrogen vapor was used for temperatures ranging from 77 to 300 K. Figure 34 displays the stress–strain curves for the samples tested at the prescribed conditions. As can be observed, the samples exhibited the serrated flow at testing temperatures of 4.2 and 7.5 K, while serrations were not observed at any of the higher-temperature conditions. Furthermore, the strain at which the serrations commenced increased with the temperature. In particular, serrations began to appear at strains of 1.2% and 4.5% for the samples tested at 4.2 and 7.5 K, respectively. It was also reported that the stress-drop magnitude increased with an increase in the strain. For example, at 4.2 K, the magnitude increased from 20 MPa at a strain of ~2% to 67 MPa for a strain of roughly 23%.

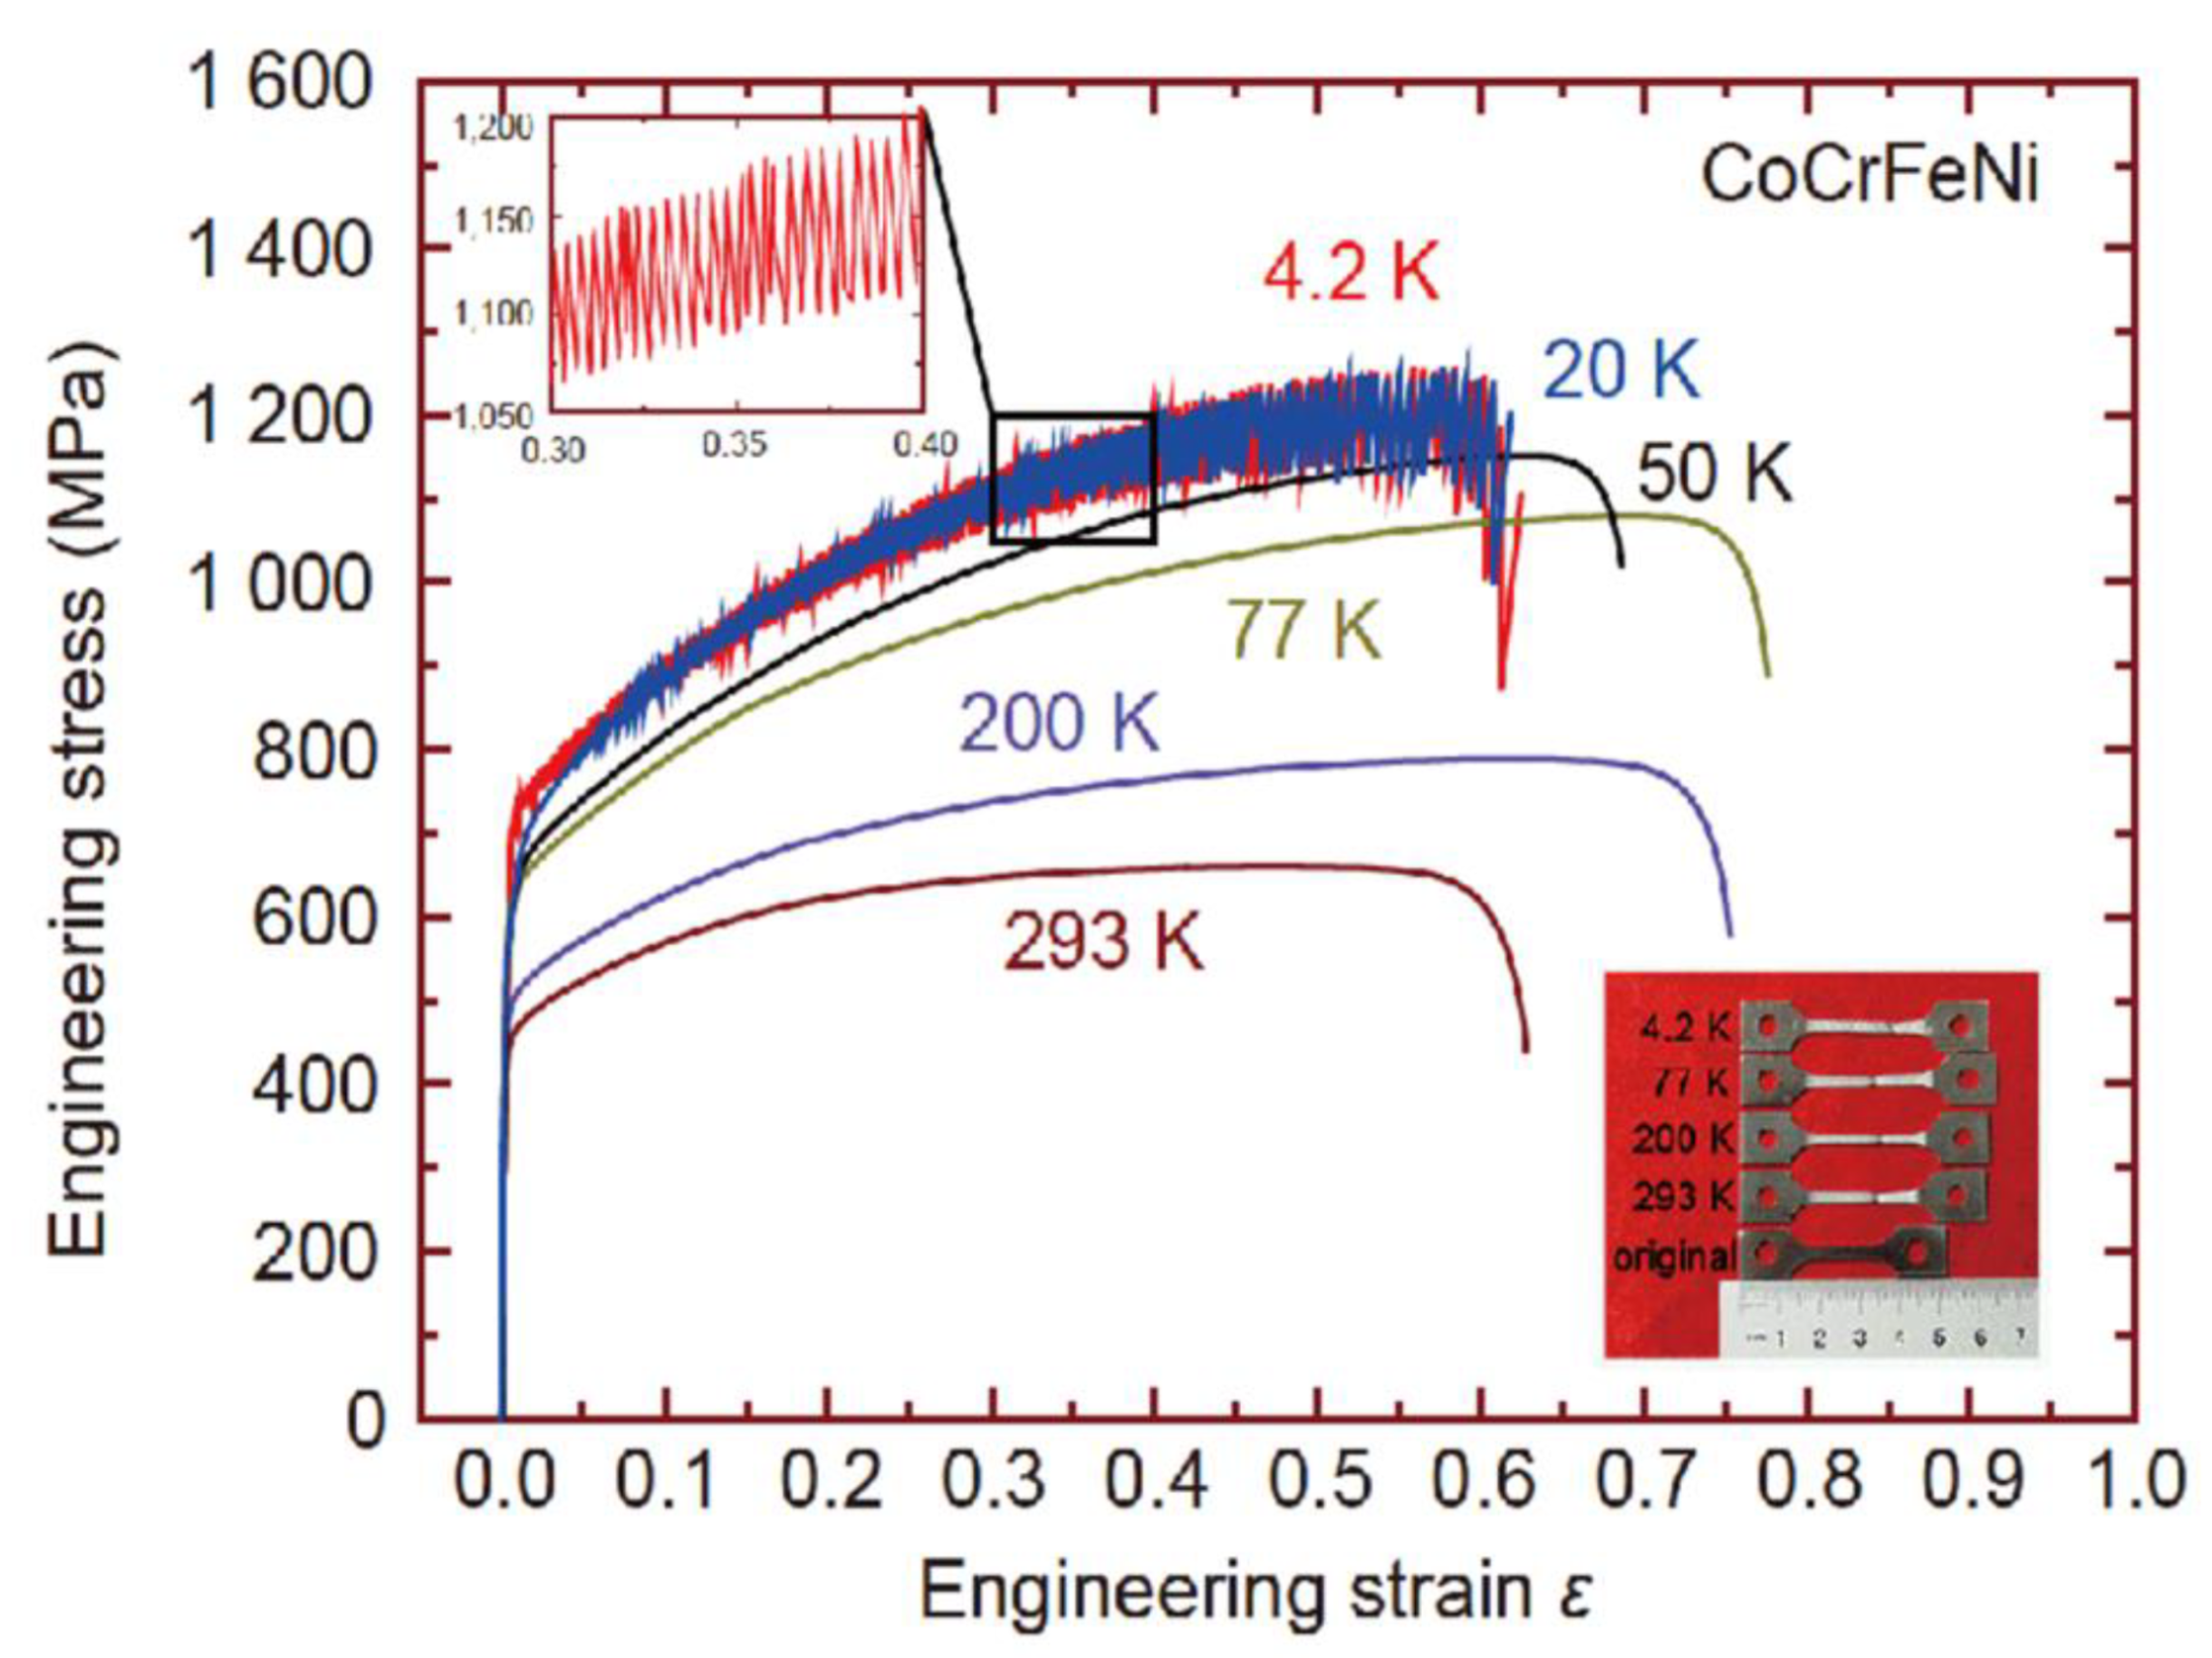
3.9. CoCrFeMnNi HEA (Cantor Alloy)

Carroll et al. examined the serration behavior in multiple alloys, including CoCrFeMnNi HEA with CoCrFeNi HEA, CoFeNi medium-entropy alloy, CoNi low-entropy alloy (LEA), and pure Ni [153]. The above samples had configurational entropies ranging from 0R for the pure Ni to 1.61R for the CoCrFeMnNi HEA. Here, the specimens underwent tension tests with strain rates and test temperatures ranging from 1 × 10⁻⁵ to 1 × 10⁻² s−1 and 300 to 700 °C, respectively. Figure 35 displays the stress–strain curves for the CoCrFeMnNi HEA tested at a strain rate of 1 × 10⁻⁴ s−1 for temperatures of 300–600 °C [181]. The observed serrated flow consisted of Type-A, Type-B, and Type-C serrations, where the serration type depended upon the temperature. Table 5 displays a summary of the serration type and the corresponding temperature for the tests performed at strain rates of 1 × 10⁻⁴ to 1 × 10⁻² s−1 and 300 to 600 °C. For the sample tested at the highest strain rate, only Type-A serrations were observed. Furthermore, the sample that was tested at 1 × 10⁻⁴ s−1 exhibited serrations that were Types A and C at the highest and lowest temperatures, respectively. For the intermediate temperatures of 400 and 500 °C, Type-B serrations were observed. It should be noted that a similar trend was observed in Al0.5CoCrCuFeNi HEA [180], as discussed previously.
It was found that, for a strain rate of 1 × 10⁻⁴ s−1, the pure Ni and CoNi alloy did not exhibit serrations at any of the prescribed temperatures. Furthermore, the temperature range for which serrations were observed increased with an increasing chemical complexity of the alloy, such that the CoCrFeMnNi HEA was had the largest range of temperatures. From here, the authors suggested that the structure of the HEA prevents thermal vibrational from destroying the pinning effect, thereby allowing mobile solute atoms to pin the moving dislocations at lower temperatures.
Fu et al. examined the deformation behavior of a CoCrFeMnNi HEA that underwent homogenization, cold-rolling, and recrystallization [163]. The samples were homogenized at 1100 °C, for 24 h, in vacuum, and then subsequently cold-rolled, which led to a reduction in thickness of 40%. After cold-rolling, the sheets were recrystallized at 900 °C for 1 h. After the samples were fabricated, they underwent tension testing at temperatures ranging from RT to 800 °C and strain rates from 1.0 × 10⁻⁵ to 5.0 × 10⁻³ s−1. The engineering stress vs. strain data for the samples tested at a strain rate of 3.0 × 10⁻⁴ s−1 and temperatures ranging from RT to 800 °C can be observed in Figure 36a,b. As can be seen in the figures, the serrations are well defined for temperatures ranging from 300 to 600 °C. Furthermore, the serration type was dependent on the test temperature (see Figure 36b). At 300 °C, Type-A serrations were observed in the graph, while Types A + B were seen in the sample tested at 400 °C. On the other hand, Type-B serrations occurred in the sample that was tested at 550 °C, while Type-C serrations were observed at 600 °C.
It was also found that the critical plastic strain for the onset of serrations was significantly affected by both the temperature and the applied strain rate. For example, at a strain rate of 3.0 × 10⁻⁴ s−1, the critical strain decreased monotonically with respect to the temperature. In contrast, the critical strain increased with an increase in the strain rate. From the critical strain, it was determined that, for the above strain rate, there were two temperature regimes for the activation energy of the serrated flow. For the first region, which corresponded to test temperatures of 300–500 °C, the activation energy was 116 kJ/mol, and the solute pinning of dislocations was controlled by pipe diffusion. As for the second region, which occurred at temperatures ranging from 500 to 600 °C, the activation energy for serrations was 296 kJ/mol. In this region, the pinning-and-unpinning process was dominated by a cooperative lattice diffusion mechanism in which Ni was the rate-controlling constituent.
It should be noted that serrations were not observed for temperatures either below 300 °C or above 600 °C. For the lower-temperature conditions, the lack of observable serrations is most likely a consequence of diffusing solute atoms that are too slow to catch and pin mobile dislocations [153]. At higher temperatures, it is thought that the thermal vibration of atoms is large enough as to prohibit the effective locking of dislocations [155,297].
Figure 37a,b displays the engineering stress vs. strain curves for the samples tested at strain rates ranging of 1.0 × 10⁻⁵–5.0 × 10⁻³ s−1 at a temperature of 500 °C. From the figures, it is apparent that the serration type is dependent on the strain rate. At the lowest strain rate, namely 1.0 × 10⁻⁵ s−1, the sample exhibited Type-B + Type-C serrations, while Type-A serrations were observed at the highest strain rate. At intermediate strain rates, the stress-drop behavior exhibited Type-A + Type-B (1.0 × 10⁻⁵) and Type-B (1.0 × 10⁻⁴) serrated flow. Table 6 features the serration type for the temperature and strain-rate conditions of the experiments.
In a later study, Fu et al. performed a similar study on the CoCrFeMnNi HEA, but this time they examined samples that had been cold rolled such that the sample thicknesses were reduced by 20%, 30%, and 40% [168]. Furthermore, the sheets were recrystallized at both 900 and 1000 °C (1 h) for each cold-rolling condition. XRD revealed that the alloy retained a simple FCC solid-solution phase after cold rolling and recrystallization. Samples undergoing quasi-static tensile tests were performed at temperatures ranging from RT to 800 °C. The fractured surfaces of the samples were examined by using SEM.
Figure 38a–c features the engineering stress vs. engineering strain for the HEA samples that were tested at temperatures ranging from RT to 800 °C and rolling conditions of 20%, 30%, and 40% reduced thicknesses. In the sample recrystallized at 900 °C for 1 h, the serrated flow was observed at the intermediate temperatures of 400 and 600 °C for all the rolling conditions. Interestingly, there was a discontinuous gap in the serrated flow for the samples tested at 600 °C. Similar to other studies involving the same alloy [153,163], the serrations appear to be of Types A and B at 400 °C, while they were characteristic of Type-C behavior at 600 °C. Moreover, for the samples tested at 600 °C, the discontinuous feature in the serrated flow was the most pronounced in the sample that had a thickness reduction of 40%. No serrations were observed in the samples tested at RT or 800 °C. The lack of observed serrations at 800 °C was attributed to the softening of the alloy at the higher temperature. As for the lack of observable serrations at RT, this trend was again due to the relatively low speed of the moving solutes, thus rendering them unable to reach and pin dislocations [163].
The SEM characterization revealed massive annular striation patterns located around the dimples on the fractured surface for the specimens tested at 400 and 600 °C. These striation patterns were attributed to a decrease in the ductility of the alloy. In contrast, no such striations were observed in the sample tested at 800 °C.
Wang et al. examined the deformation behavior of a spark-plasma-sintered CoCrFeMnNi HEA during high-strain-rate compression [166]. The results of the XRD characterization determined that the samples had a simple FCC structure. For the mechanical testing, samples were subjected to room-temperature impact tests, using a split-Hopkinson pressure bar system and strain rates ranging from 1 × 10³ to 3 × 10³ s−1. During dynamic deformation, these strain rates amounted to loading rates that varied between 1200 and 2800 s−1. Figure 39 displays the true stress vs. true strain behavior for the specimens, and as can be seen, there are observable serrations in the graph. Furthermore, these serrations appear comprise Type-A serrations. It was also determined that the serration behavior in the HEA is sensitive to changes in the applied-loading rate. Additionally, the general temperature of the sample approached values as high as 1300 K during testing. In this scenario, local hotspots in the matrix can weaken intergranular bonding, leading to the formation of cracks and microvoids in the severe-deformation zone.
From the results, the authors hypothesized the following process involved in initializing the serrated flow. During the initial stages of deformation, dislocations form and then subsequently accumulate along the grain boundaries that become elongated during compression. As the deformation continues, the grains become more elongated, leading to a further decrease in the width of the grains. Meanwhile, the generated thermal hotspots weaken the intergranular bonding and ultimately lead to an eventual collapse of the grain boundaries. Consequently, numerous microvoids form along the grain boundaries, and shear bands are generated in the specimen, resulting in the observed serrated flow.
Before moving on, it is important to note that the split Hopkinson pressure bar test depends on the one-dimensional wave propagation in the bar [298]. The relatively smooth nature of the stress fluctuations, as can be seen in Figure 39, is indicative of poor pulse shaping during the test. This result suggests that the fluctuations may be due to machine noise rather than an actual physical metallurgical phenomenon.
Tirunilai et al. compared the deformation behavior of the CoCrFeMnNi HEA and pure Cu at cryogenic temperatures [299]. Here, tensile tests were performed at RT (295 K), 77, 8, and 4.2 K. For the experiments performed at 4.2 K, the samples were placed in a liquid He bath, whereas samples were placed in a vacuum cryostat when tested at 8 K. To examine the serration behavior in the HEA, tensile tests were performed at mean plastic strain rates of 6 × 10⁻⁵, 3 × 10⁻⁴, and 1 × 10⁻³ s−1. A sample rate of 10 Hz was used for the data acquisition rate.
Figure 40a features a plot of the engineering stress–strain curve for the HEA tested at RT, 77 K, and 4.2 K and strain rate of 3 × 10⁻⁴ s−1. As can be seen, there were pronounced serrated flows at 4.2 K whereas no apparent serrations were present at temperatures of 77 K and RT. Furthermore, deformation twinning was observed in the samples tested at 4.2 and 77 K. It was also found that the ductility in the sample deformed at 4.2 K remained relatively high.
Interestingly, the authors reported that such serrated flow behavior was significantly less pronounced in pure Cu when tested at a strain rate of 3 × 10⁻⁴ s−1 at 4.2 K, as shown in Figure 40b. For instance, the serration amplitude was ~150 MPa in the HEA, whereas it was only 5 MPa in the Cu metal. The significantly more pronounced serrations observed in the HEA (as compared to the pure Cu) were attributed to the impact of the solid solution in the alloy. It was also suggested that the discrepancy in the serration behavior may be a result of the differences between the properties of the material systems, such as yield strength, ultimate tensile strength, work-hardening, thermal conductivity, and heat capacity.
Figure 41 features the stress vs. strain data for the samples that were tested at 8 K and strain rates ranging from 6 × 10⁻⁵ to 1 × 10⁻³ s−1. As can be observed, the characteristics of the serrated flow were affected by the strain rate. For example, the time between stress-drops apparently decreased with an increase in the strain rate. The insets of the figure suggest that, for strain rates of 6 × 10⁻⁵ and 3 × 10⁻⁴ s−1, the serrated flow consisted of Type-B serrations. On the other hand, the serrations were reminiscent of Type-D behavior at the highest strain rate.
Guo et al. examined the effects of carbon impurities on the deformation behavior of a CoCrFeMnNi HEA [192]. Here, the undoped and doped (0.93 atomic % C) samples were subjected to tension testing at RT and a strain rate of 1.6 × 10⁻³ s−1. Figure 42a,b compares the true stress vs. strain of the carbon-doped and undoped HEA. As can be observed, serrations are clearly present in the deformation curve for the doped sample. This result is in contrast with the undoped specimen where serrations were absent. A magnified view of the serrated-flow behavior in the doped sample is displayed in Figure 42b. Here, the serrations exhibit a stair-step type pattern. The authors reported that the serrated flow exhibited Type-A serrations, although they could have instead been Type-D serrations (see Figure 10) [182].
The occurrence of the serrated flow in the HEA was attributed to the interplay among the carbon, SFs, and moving dislocations. The sharp increase in the stress during a serration event corresponds to the alteration of the short-range order by the dislocations that is accompanied by the migration of C from octahedral sites to tetrahedral sites and SFs. Since it is energetically unfavorable for the C to remain in the SF, the C will hop back into the octahedral site. Consequently, the SF energy is decreased, thus resulting in the accelerated plastic deformation that is characterized by the plateau region between successive serrations.

3.10. CoCuFeNiTi HEA

Samal et al. examined the serrated flow in an equiatomic CoCuFeNiTi HEA [162]. Here, cylindrical samples underwent isothermal hot-compression tests at temperatures ranging from 800 to 1000 °C and strain rates between 10−3 and 10−1 s−1. Figure 43a,b presents the true stress vs. true strain for the samples compressed at strain rates of 10−1 and 10−3 s−1, respectively. For both strain rates, the amplitude of the serrations increased with strain rate (at a given temperature) and a decrease in temperature (at a given strain rate). However, for the sample compressed at a strain rate of 10−3 s−1, the serrations were only prominent for lower temperatures. The authors surmised that the decrease in the size of serrations at higher temperatures was a consequence of the increased thermal-vibration energy required to pin solute atoms. Such a hypothesis has also been discussed in a previous investigation [153]. Furthermore, they suggested that the increase in the serration amplitude at the lower strain rates was due to an increase in the time allotted for atoms to lock dislocations. Table 7 displays a summary of the serration types observed and their corresponding temperatures and strain rates. As can be seen, the serrations type was dependent on the experimental conditions. From the table, it is evident that, at the higher strain rate, the serration type evolved from Types A to A + B with temperature, whereas the serration type transitioned from Type-A + Type-B to Type-B at the lower strain rate.

3.11. CoCuFeMnNi HEA
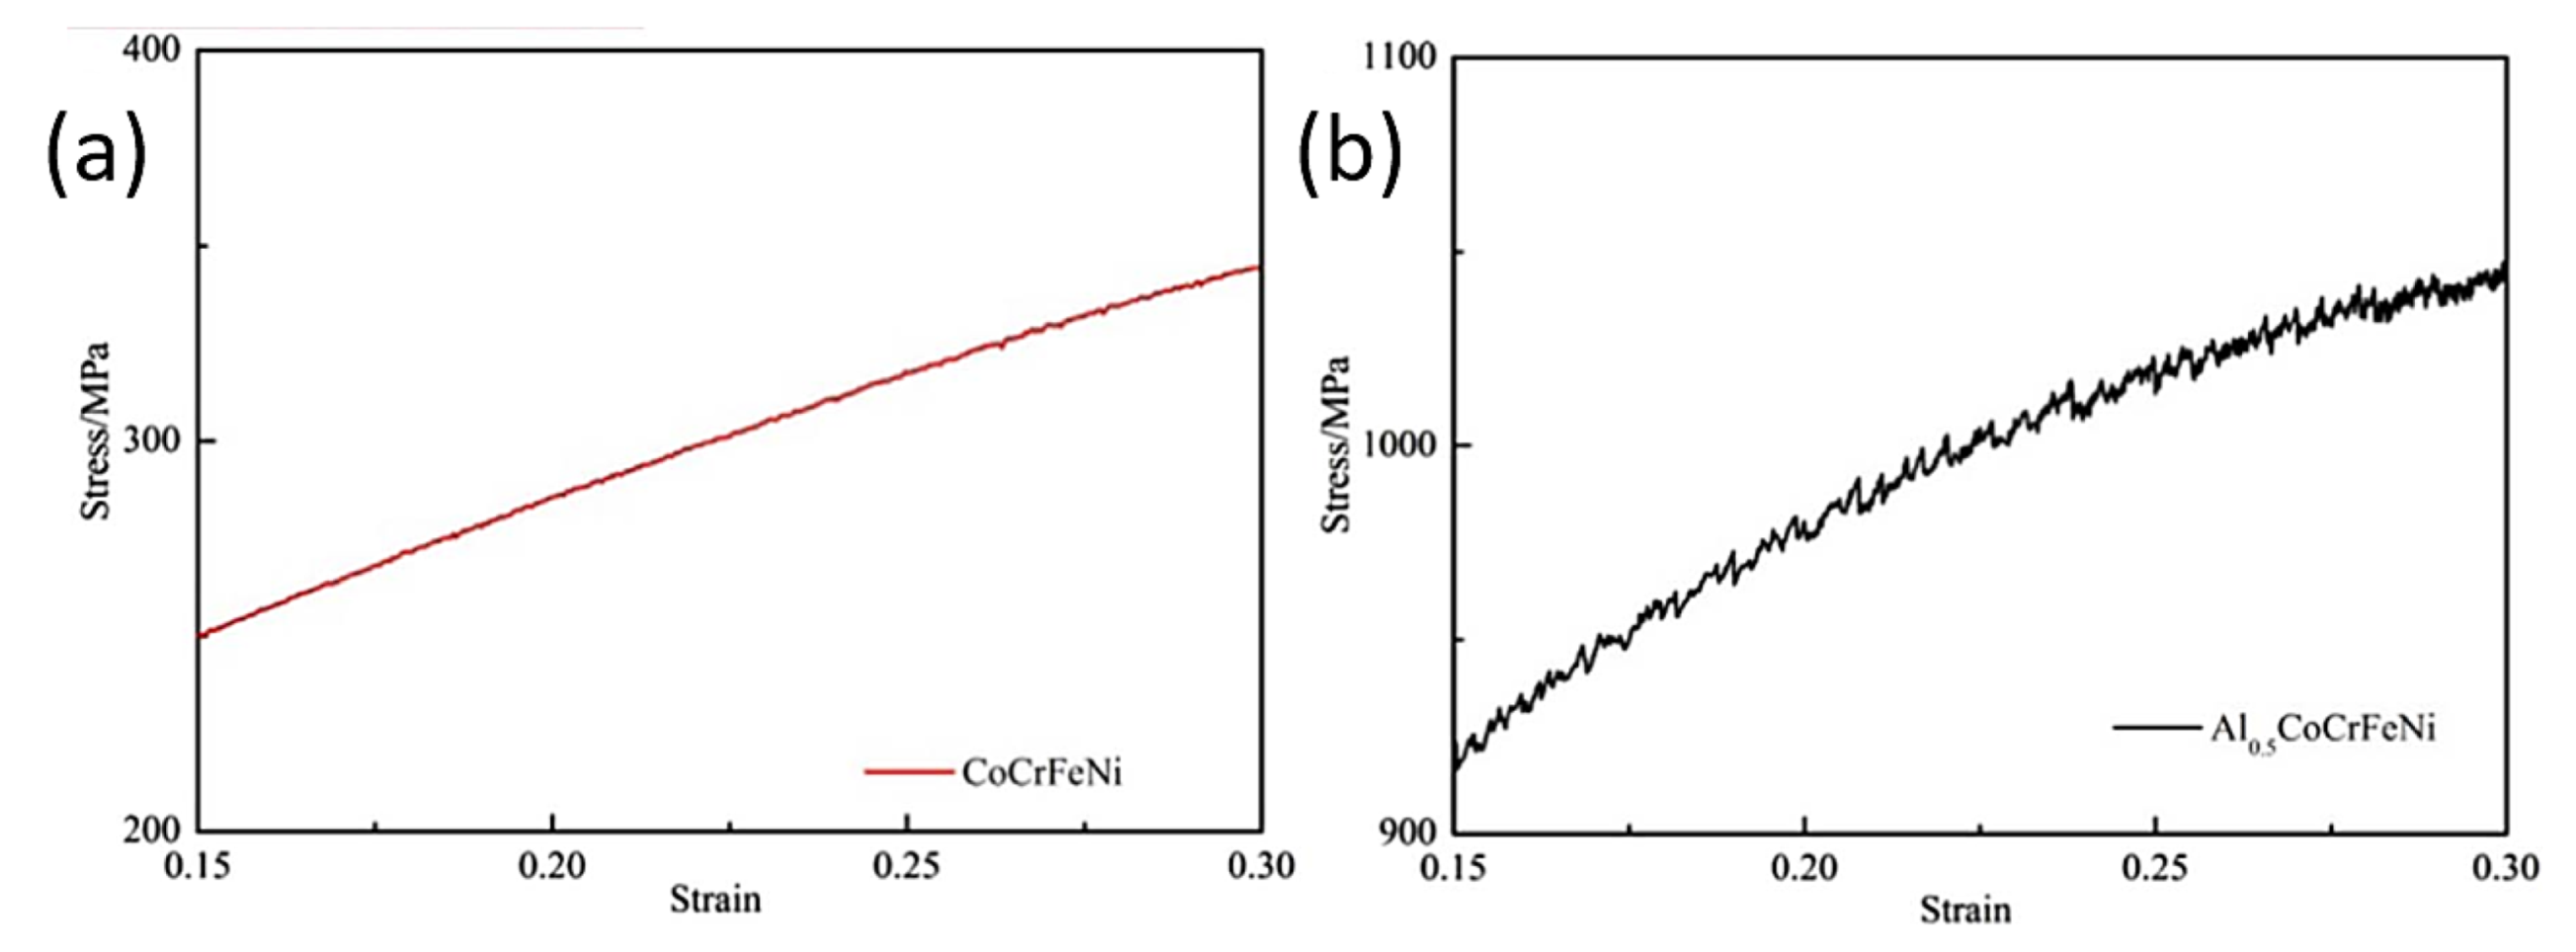
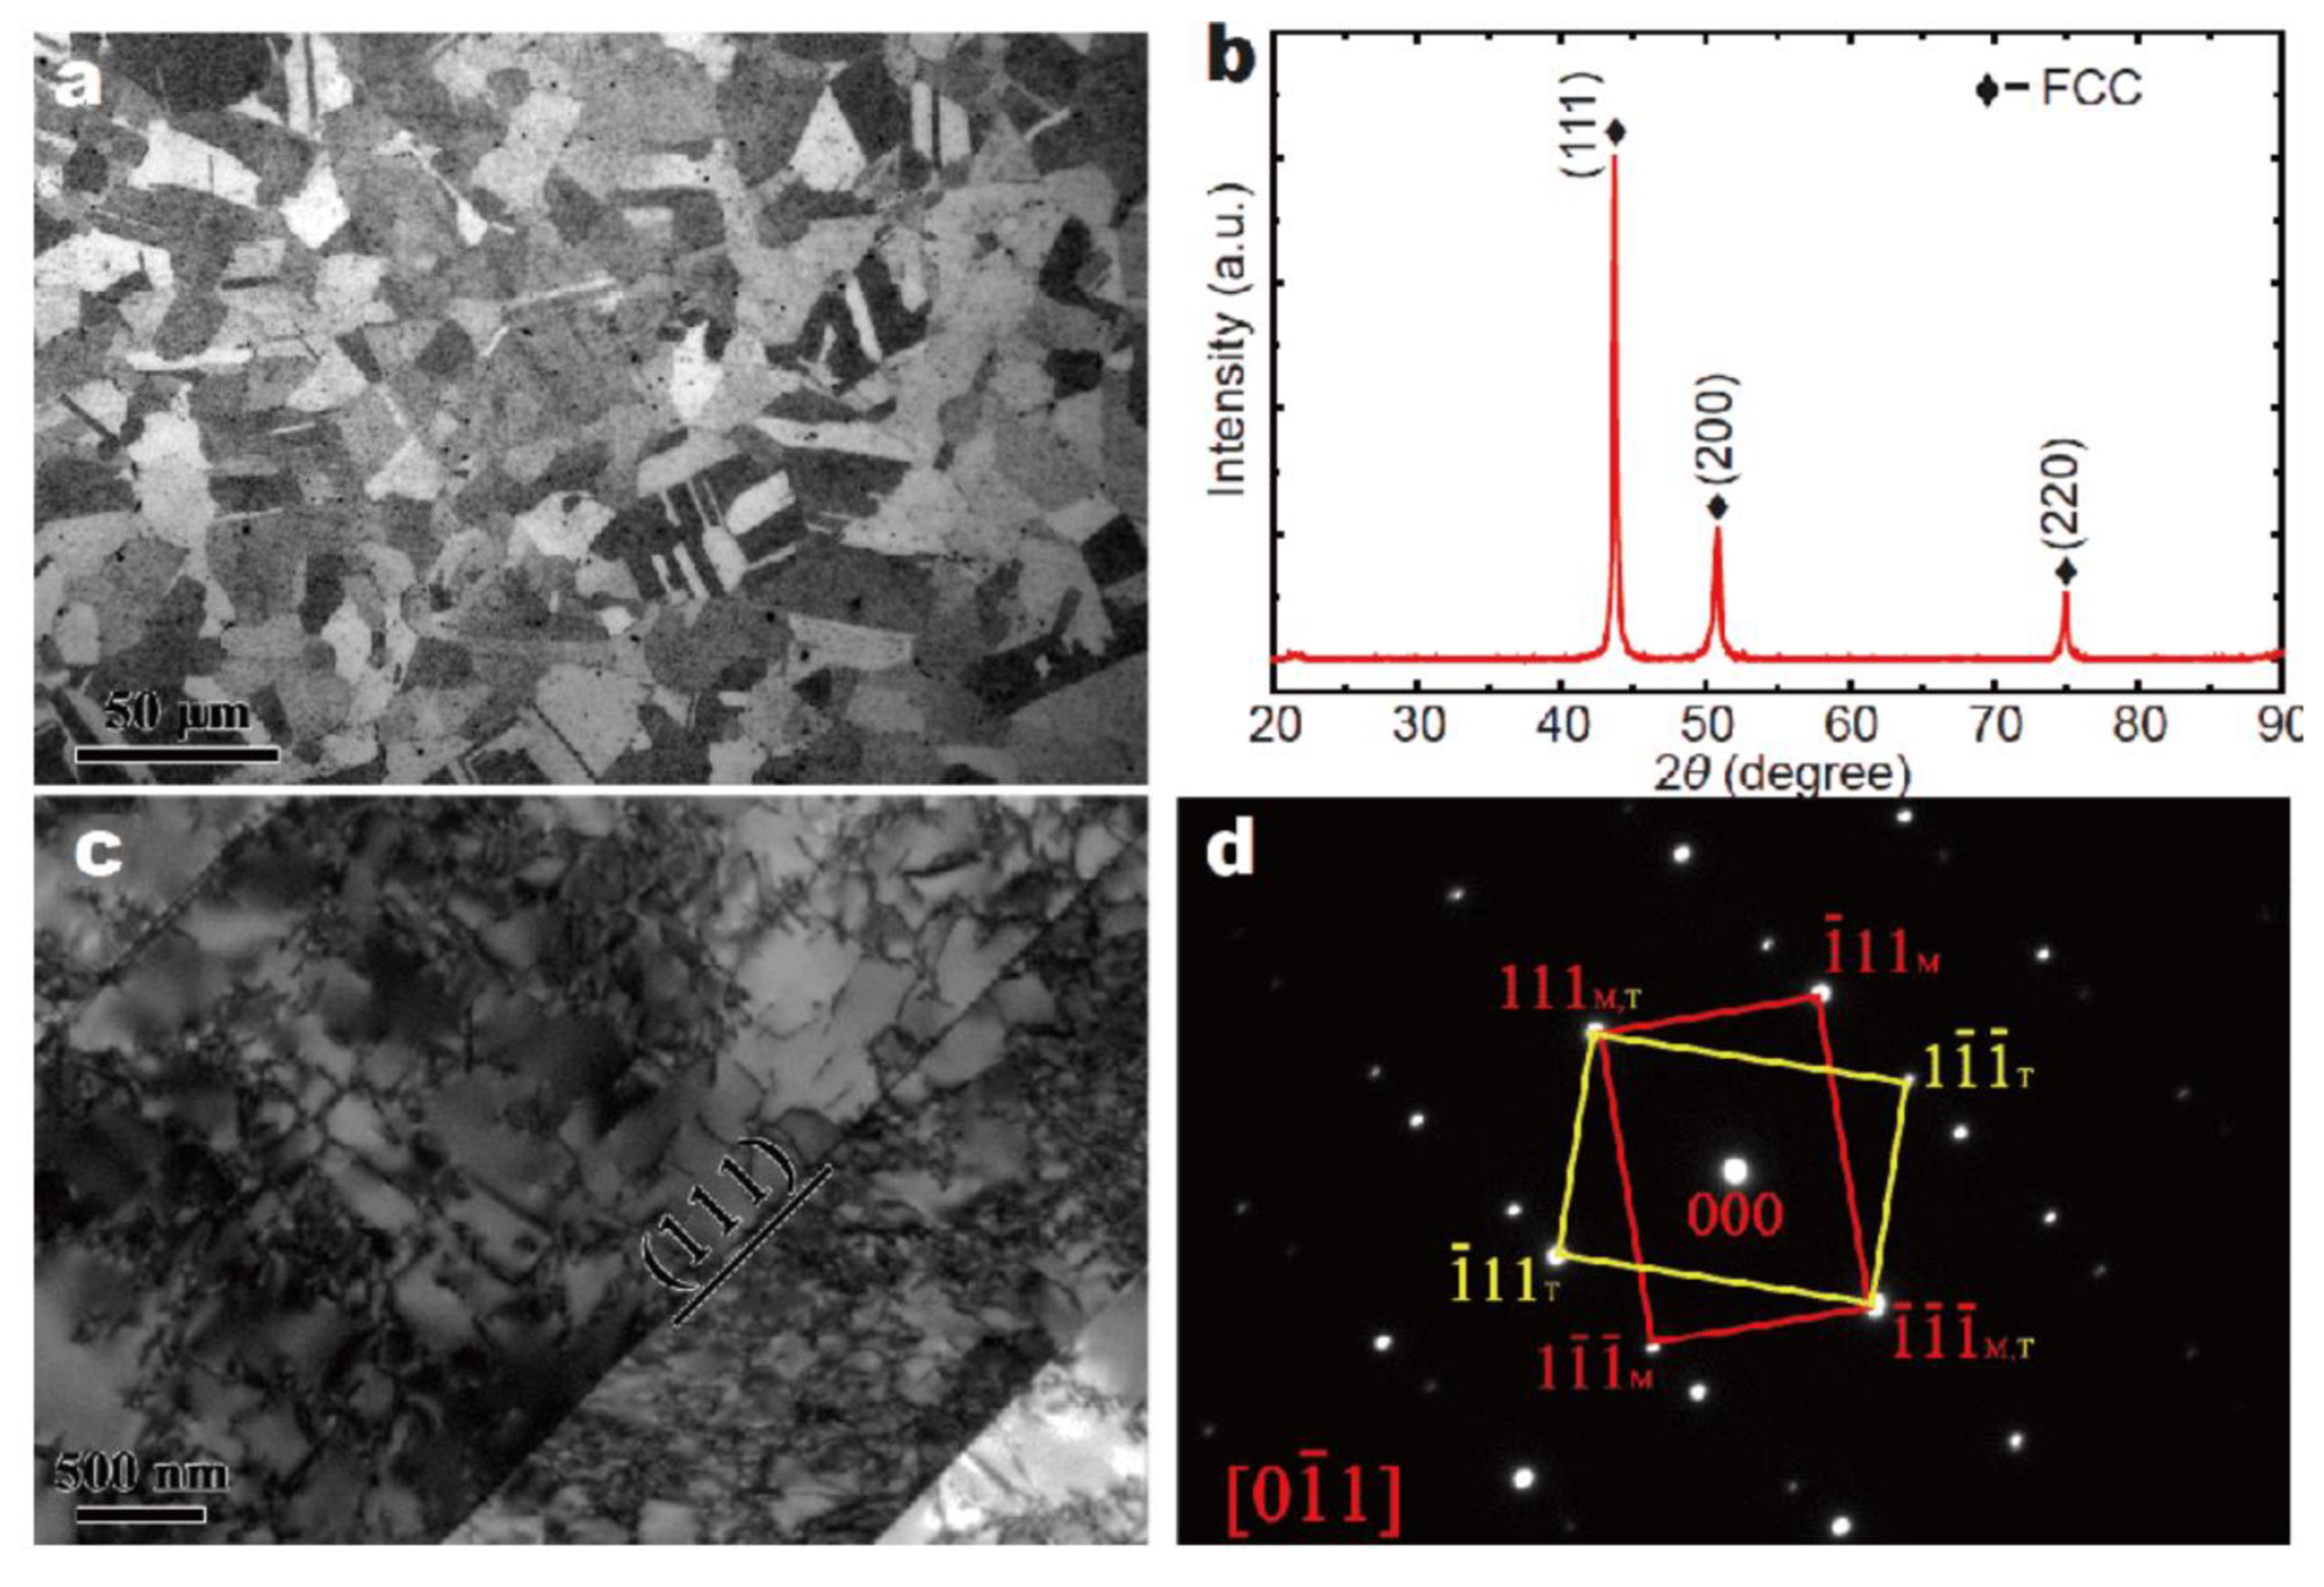
Sonkusare et al. investigated the deformation behavior of a single-phase FCC CoCuFeMnNi HEA [300]. For their experiments, the HEA samples underwent RT compression tests at strain rates of 10−3 and 3 × 10³ s−1. To achieve the higher strain rate, a gas gun (6 kg/cm2) was used to propel a 300 mm long striker bar into the sample. Figure 44 displays the true stress vs. true strain plot. From the graph it is apparent that the serrated flow occurred in the sample that was tested at the higher strain rate, while there were no observable serrations present in the deformation behavior of the sample compressed at a strain rate of 10−3 s−1. Electron backscatter diffraction (EBSD) characterization revealed some interesting results. For instance, lenticular deformation twins were observed in the sample tested at the higher strain rate, suggesting that deformation twinning was likely the mechanism responsible for the serrated flow at the higher strain rate condition. Moreover, as compared to the lower strain-rate condition (10−3 s−1), the microstructure for the sample tested at the higher strain rate consisted of relatively smaller-sized grains, a higher percentage of higher angle grain boundaries, and a smaller density of geometrically necessary dislocations.

3.12. CoCrFeNi HEA

The deformation behavior, during tension, was examined in a CoCrFeNi HEA for temperatures ranging from 4.2 to 293 K [159]. For the experiments, samples were tested at a strain rate of 10−3 s−1. To cool the samples, liquid nitrogen (77 and 200 K), and liquid helium (4.2 K) were used. Figure 45a–d shows the results of the microstructural characterization, as determined by optical microscopy, XRD, and TEM. As can be observed from Figure 45a, the as-cast sample contained nearly equiaxed grains. Subsequent analysis determined that the grains consisted of a mean size of about 13 µm. The results of the XRD characterization, as displayed in Figure 45b, indicates that the as-cast sample consisted of an FCC structure. Figure 45c,d presents the TEM results, which reveals that both dislocations and {111} twins were present in the microstructure of the as-fabricated material.
Figure 46 displays the engineering stress vs. engineering strain for the samples tested at temperatures ranging from 4.2 to 293 K for a strain rate of 10−3 s−1. It is evident from the figure that the serrated flow was only observed in the samples deformed at temperatures of 4.2 and 20 K. Upon analysis, the largest Lyapunov exponent for both conditions was found to be positive (0.05 for 4.2 K, and 0.001 for 20 K), indicating that the serration behavior was chaotic (unstable dynamics). Interestingly, TEM characterization revealed that the sample tested at 4.2 K underwent an FCC to HCP phase transformation during tension testing. Moreover, many high-density defects were present, such as nano-twinning, SFs, and the HCP stacking. From the above results, the authors concluded that the unstable behavior exhibited by the sample tested at 4.2 K was a consequence of the FCC to HCP transformation.

3.13. HfNbTaTiZr HEA

Chen et al. investigated the deformation behavior of a BCC HfNbTaTiZr HEA [301]. TEM and atomic probe tomography confirmed that the alloy did not contain any secondary phases. They performed tensile tests, under the displacement control, using a strain rate of 1 × 10⁻⁴ s−1. During testing, samples were exposed to temperatures of 77, 298, 573, and 673 K. It was observed that, similar to conventional alloys, the yield and flow stress decrease, while the ductility increases with an increase in the temperature. Figure 47 presents the engineering stress–strain curve for the HfNbTaTiZr HEA that was tested at temperatures ranging from 77 to 673 K. As indicated by the graph, visible serrations were only exhibited by the sample that was tested at 673 K. However, it was determined that strain hardening was attributed to both forest hardening and DSA hardening in the specimens tested at 573 and 673 K. The authors surmised that there were two reasons for why DSA was likely a strengthening mechanism in the sample tested at 573 K (despite there being no visible serrations). Firstly, during deformation, the sample tested at the above temperature displayed similar hardening characteristics as the sample tested at 673 K. Secondly, serrations may not always be visible during the DSA [302].

4. Summary and Future Directions

Table 8 and Figure 48a–e both display the reported serration types for different kinds of HEAs. From the results, a few trends can be observed. In terms of the experimental conditions, serrations were reported for strain rates and temperatures ranging from 1 × 10⁻⁵ s−1 to 1 × 10⁻¹ s−1 and RT to 1100 °C, respectively. The samples exhibited serration Type-A, Type-B, and Type-C serrations, as well as serration type combinations, such as Type-A + Type-B and Type-B + Type-C. On the other hand, none of the HEAs were reported to display Type-A + Type-C, Type-D, or Type-E serrations. The greatest variety of different strain rates were observed for the Type-A serrations. Of the serration types that were observed, Type-B serrations were the most common serration displayed by the HEAs.
The data also reveal some important aspects about the serrated-flow phenomena in HEAs. For instance, out of all the alloys featured in Figure 48a–e and Table 8, the CoCrFeMnNi HEA was the only material to have exhibited all the reported serration types. Furthermore, the carbon-doped CoCrFeMnNi HEA was the only alloy reported to display serrations at RT. This effect of additives was also observed in [94], where Al was found to play a substantial role in the serration behavior of an Al0.5CoCrFeNi HEA. These findings, therefore, highlight the significance of additives to the serrated-flow process in HEAs.
Figure 49a,b displays a hypothetical schematic for the extent of serrations in HEAs as a function of the temperature and strain rate, as based on the reviewed literature. As can be seen in Figure 49a, there are two major temperature ranges where the serrated flow is observed. The first region, which corresponds to temperatures ranging from 4.2 to 77 K (cryogenic), represents the serrations that occur primarily due to twinning mechanisms. The findings from previous investigations suggest that the extent of the serrations may increase with a decrease in the temperature, which is due to an increase in the twinning mechanisms [166]. As for temperatures below 4.2 K, the authors are unaware of any investigations which have observed the serrated flow in this range, and this should therefore be the subject of future work. However, for temperatures between 77 K and RT serrations do not occur. The absence of serrations in this temperature regime is likely due to the absence of both twinning and dislocation pinning [153]. Serrated flow returns at temperatures between RT and 1100 and is primarily caused by the solute pinning of dislocations [152,180,192,303]. The extent of the serrations initially increases due to an increase in the migration speed of the solute atoms, which is accompanied by an acceleration in the rate of dislocation pinning [152]. However, after a certain temperature is exceeded, the enhanced thermal vibration of the solute atoms reduces their ability to pin dislocations, thereby decreasing the extent of serrations. Once the temperature rises above a certain value (1100 °C in the case of the reported HEAs), the thermal vibrations completely overcome the effect of solute atom pinning of dislocations, and therefore no serrated flow is observed [153].
A similar graph depicting the extent of serrations as a function of the strain rate is presented in Figure 49b. For the lower strain rate regime (10−5–1 s−1), dislocation pinning is the primary mechanism underlying the serrated flow. For this regime, the extent of the serrations decreases with an increase in the strain rate, which is perhaps due to the increased propagation speed of dislocations [153]. Once the strain rate exceeds 1 s−1, the dislocation velocity is such that no solute atmosphere can be formed [305] and no serrations occur. At strain rates greater than 103 s−1, twinning appears to be the primary mechanism [166]. Based on the above study, the extent of the serrations appears to increase with strain rate due to the increase in the twinning. Between these two strain rate regions no, serrations have been reported to occur. The lack of observable serrations during plastic deformation is due to the absence of both twinning and dislocation pinning. It should be noted that, for strain rates less than 10−5 s−1 and above 103 s−1, there is little available in the literature as to whether the serrated flow will occur in these ranges, and this should therefore be the subject of future investigations.
Based on the literature reviewed for the present work, the following important points can be summarized about the serrated-flow phenomenon in HEAs:
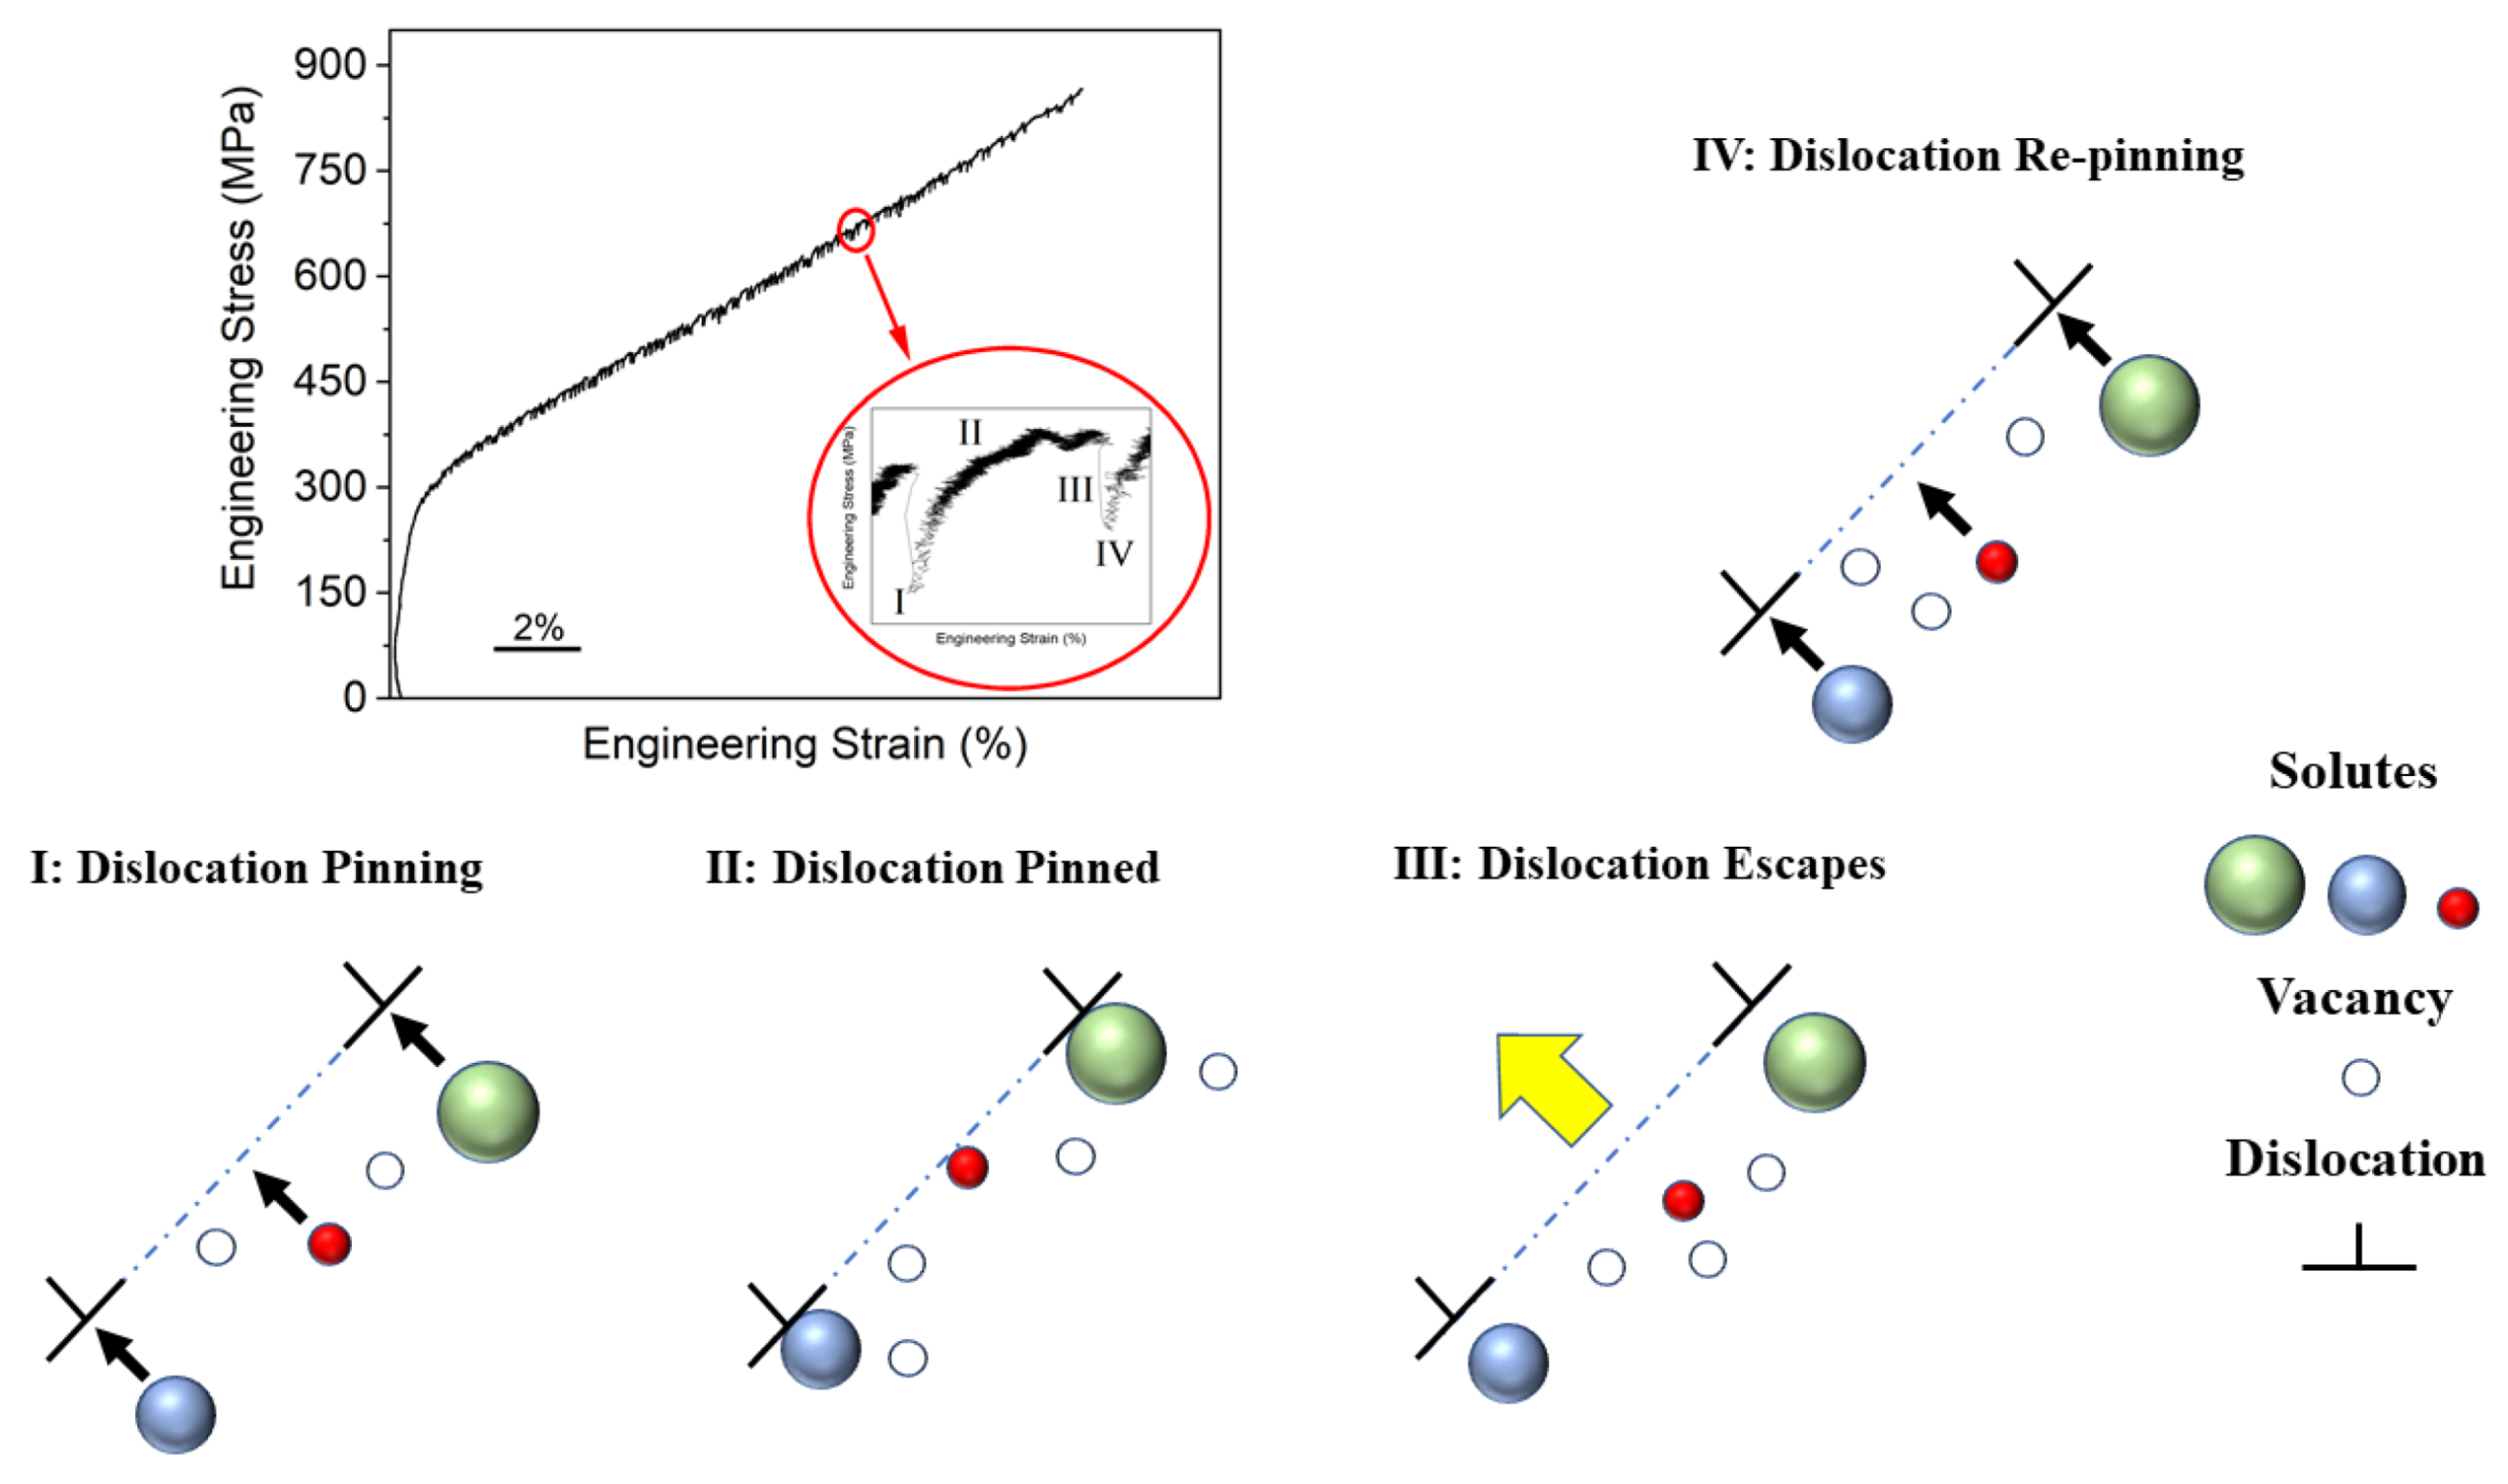
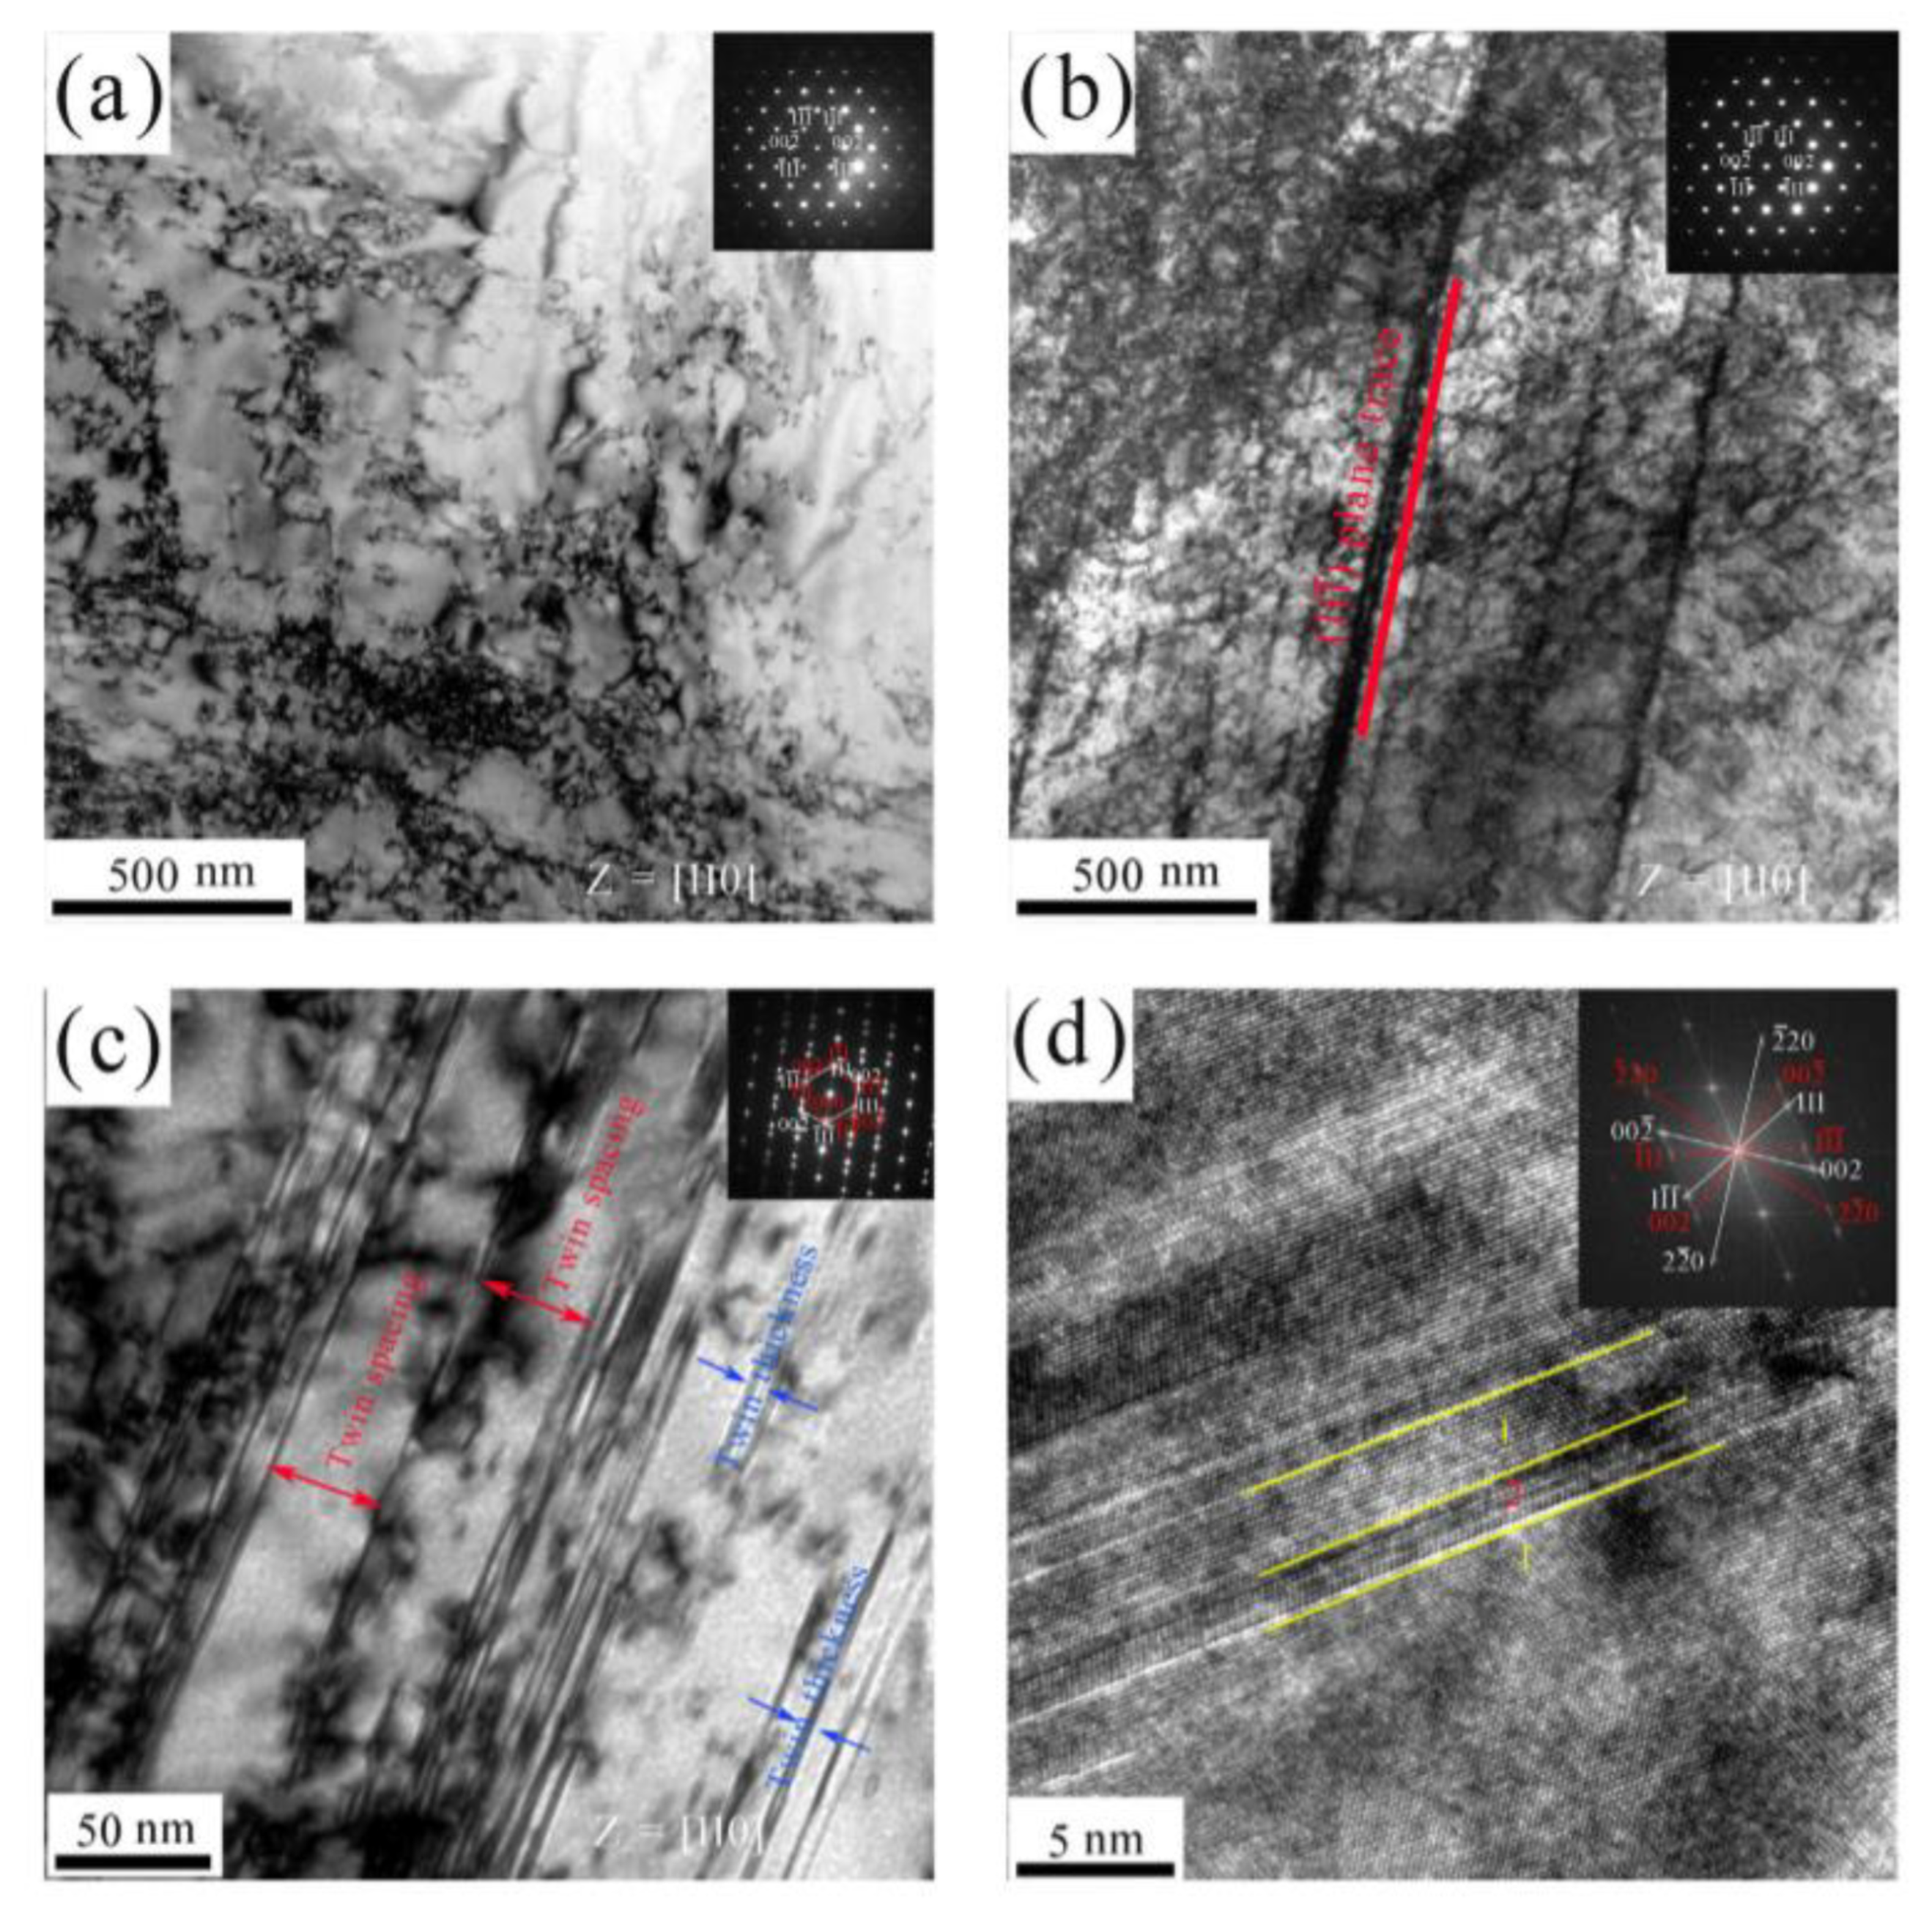
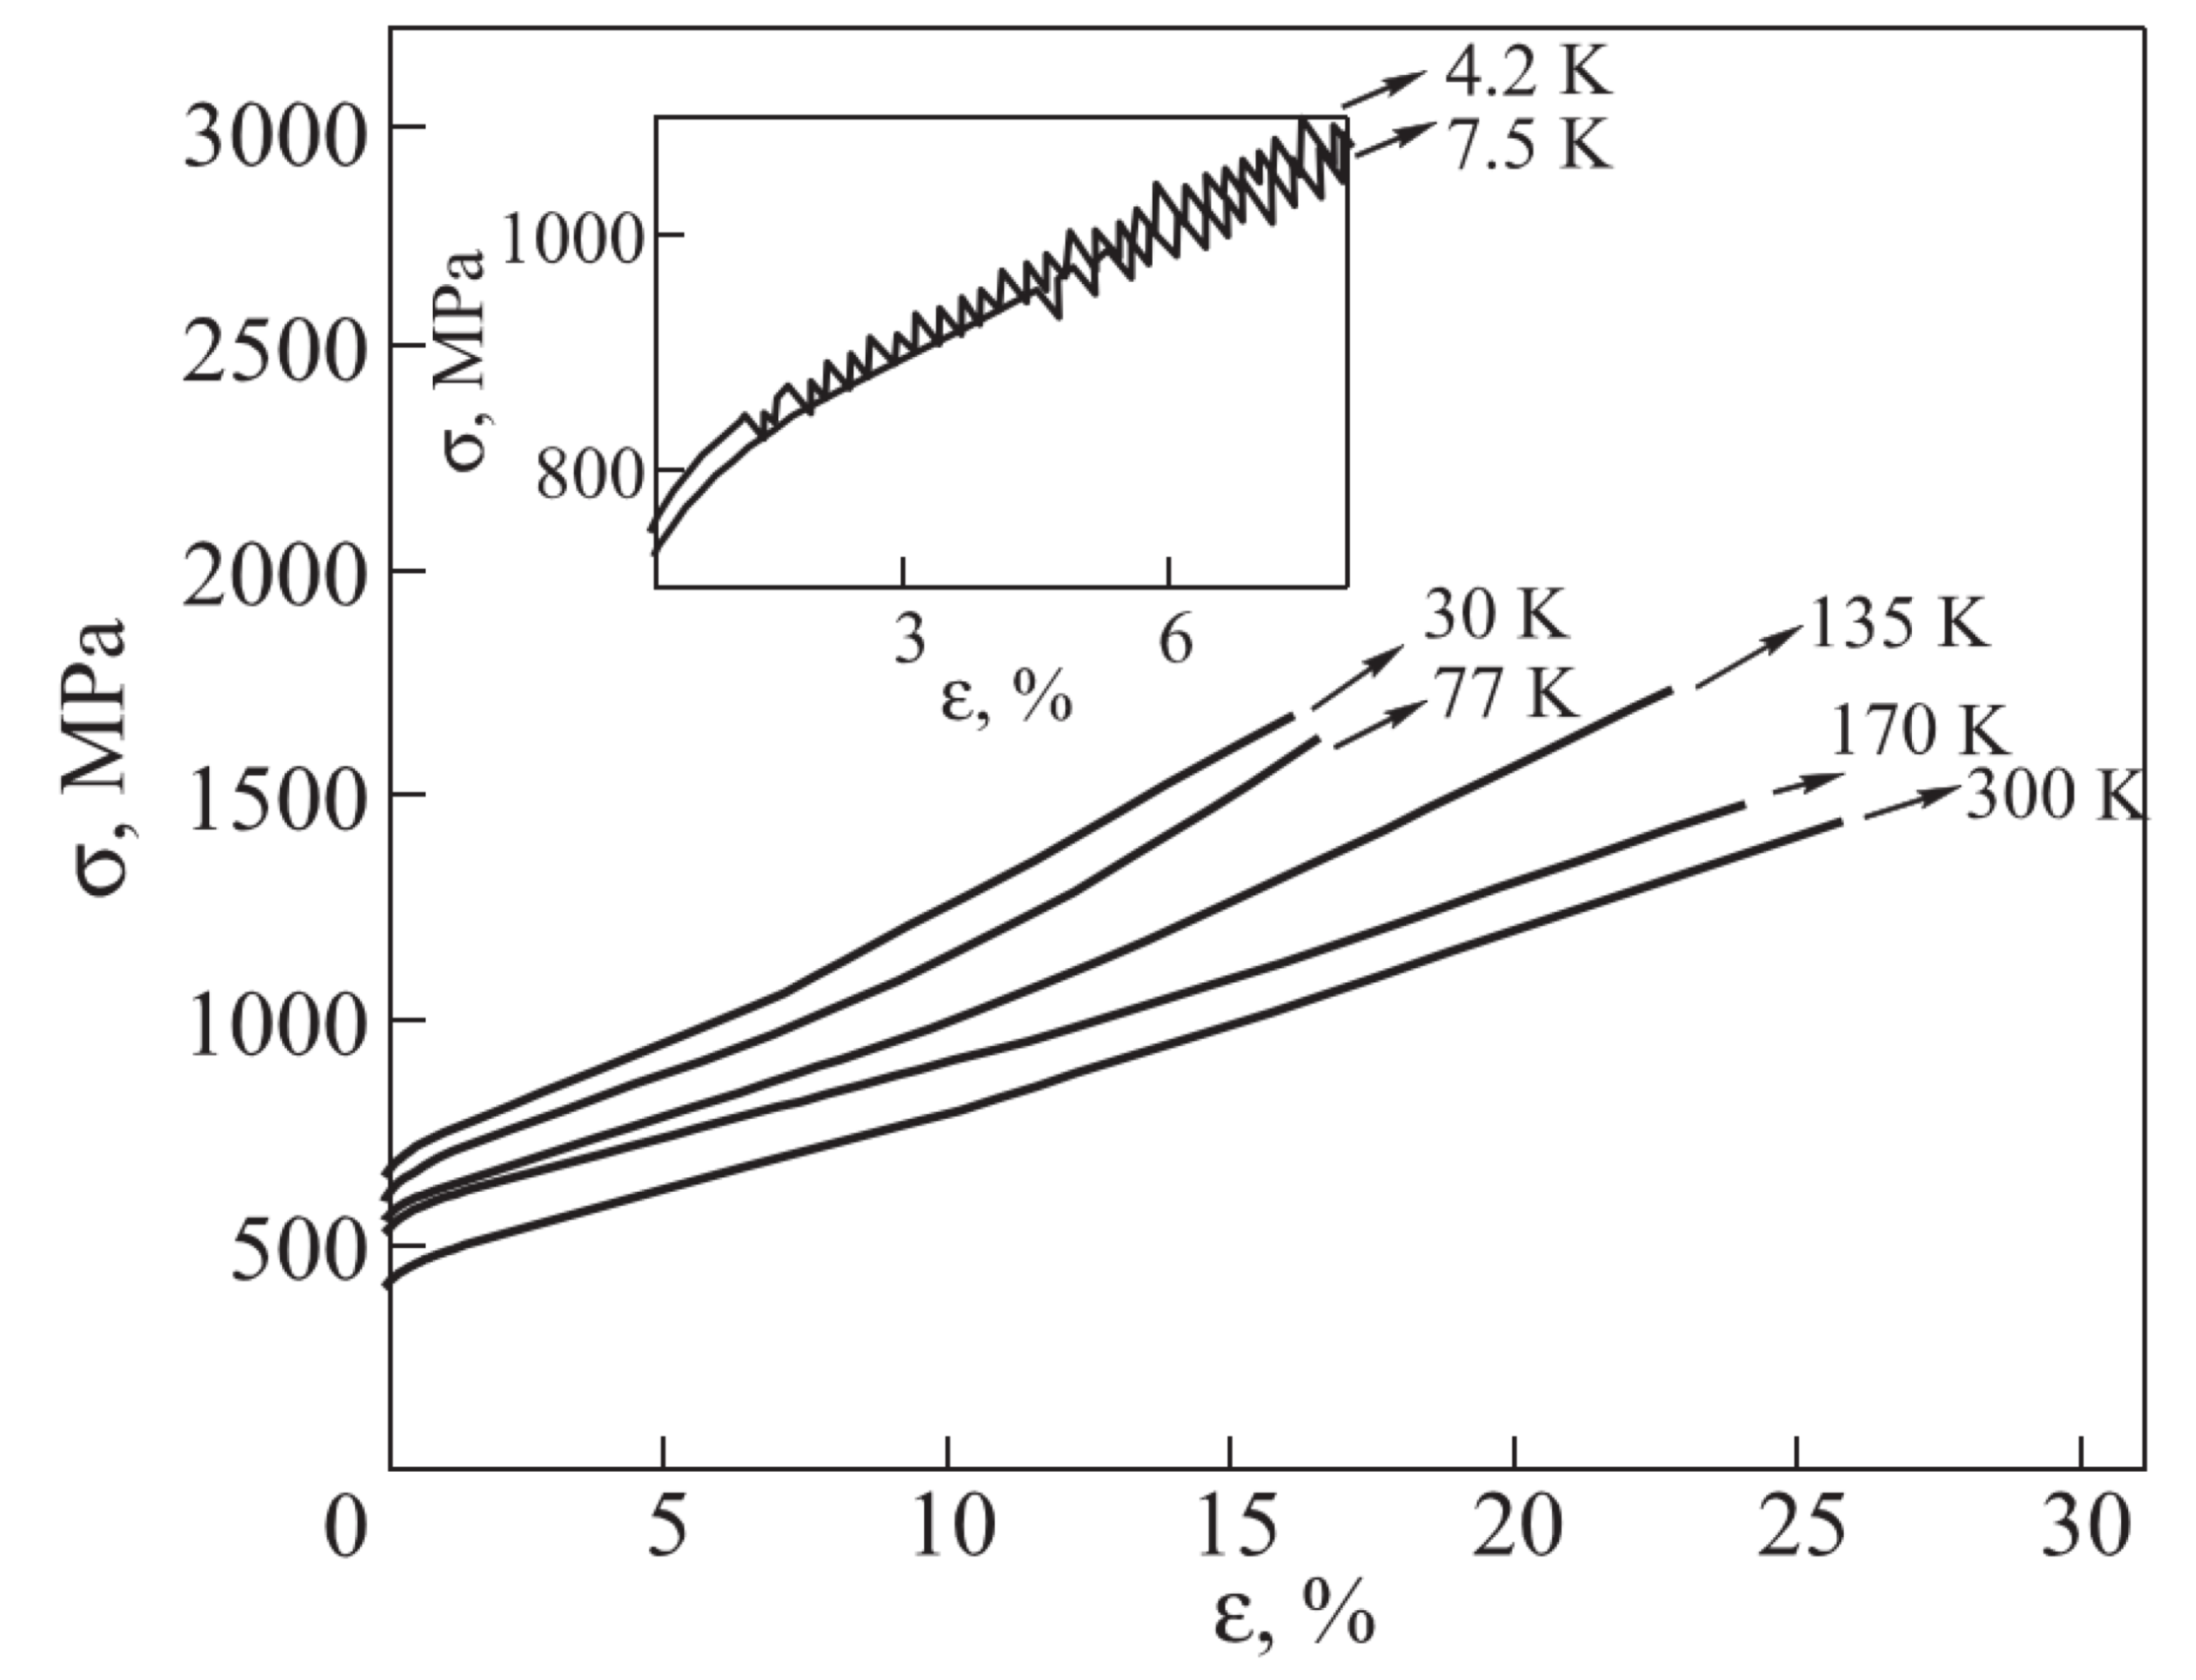
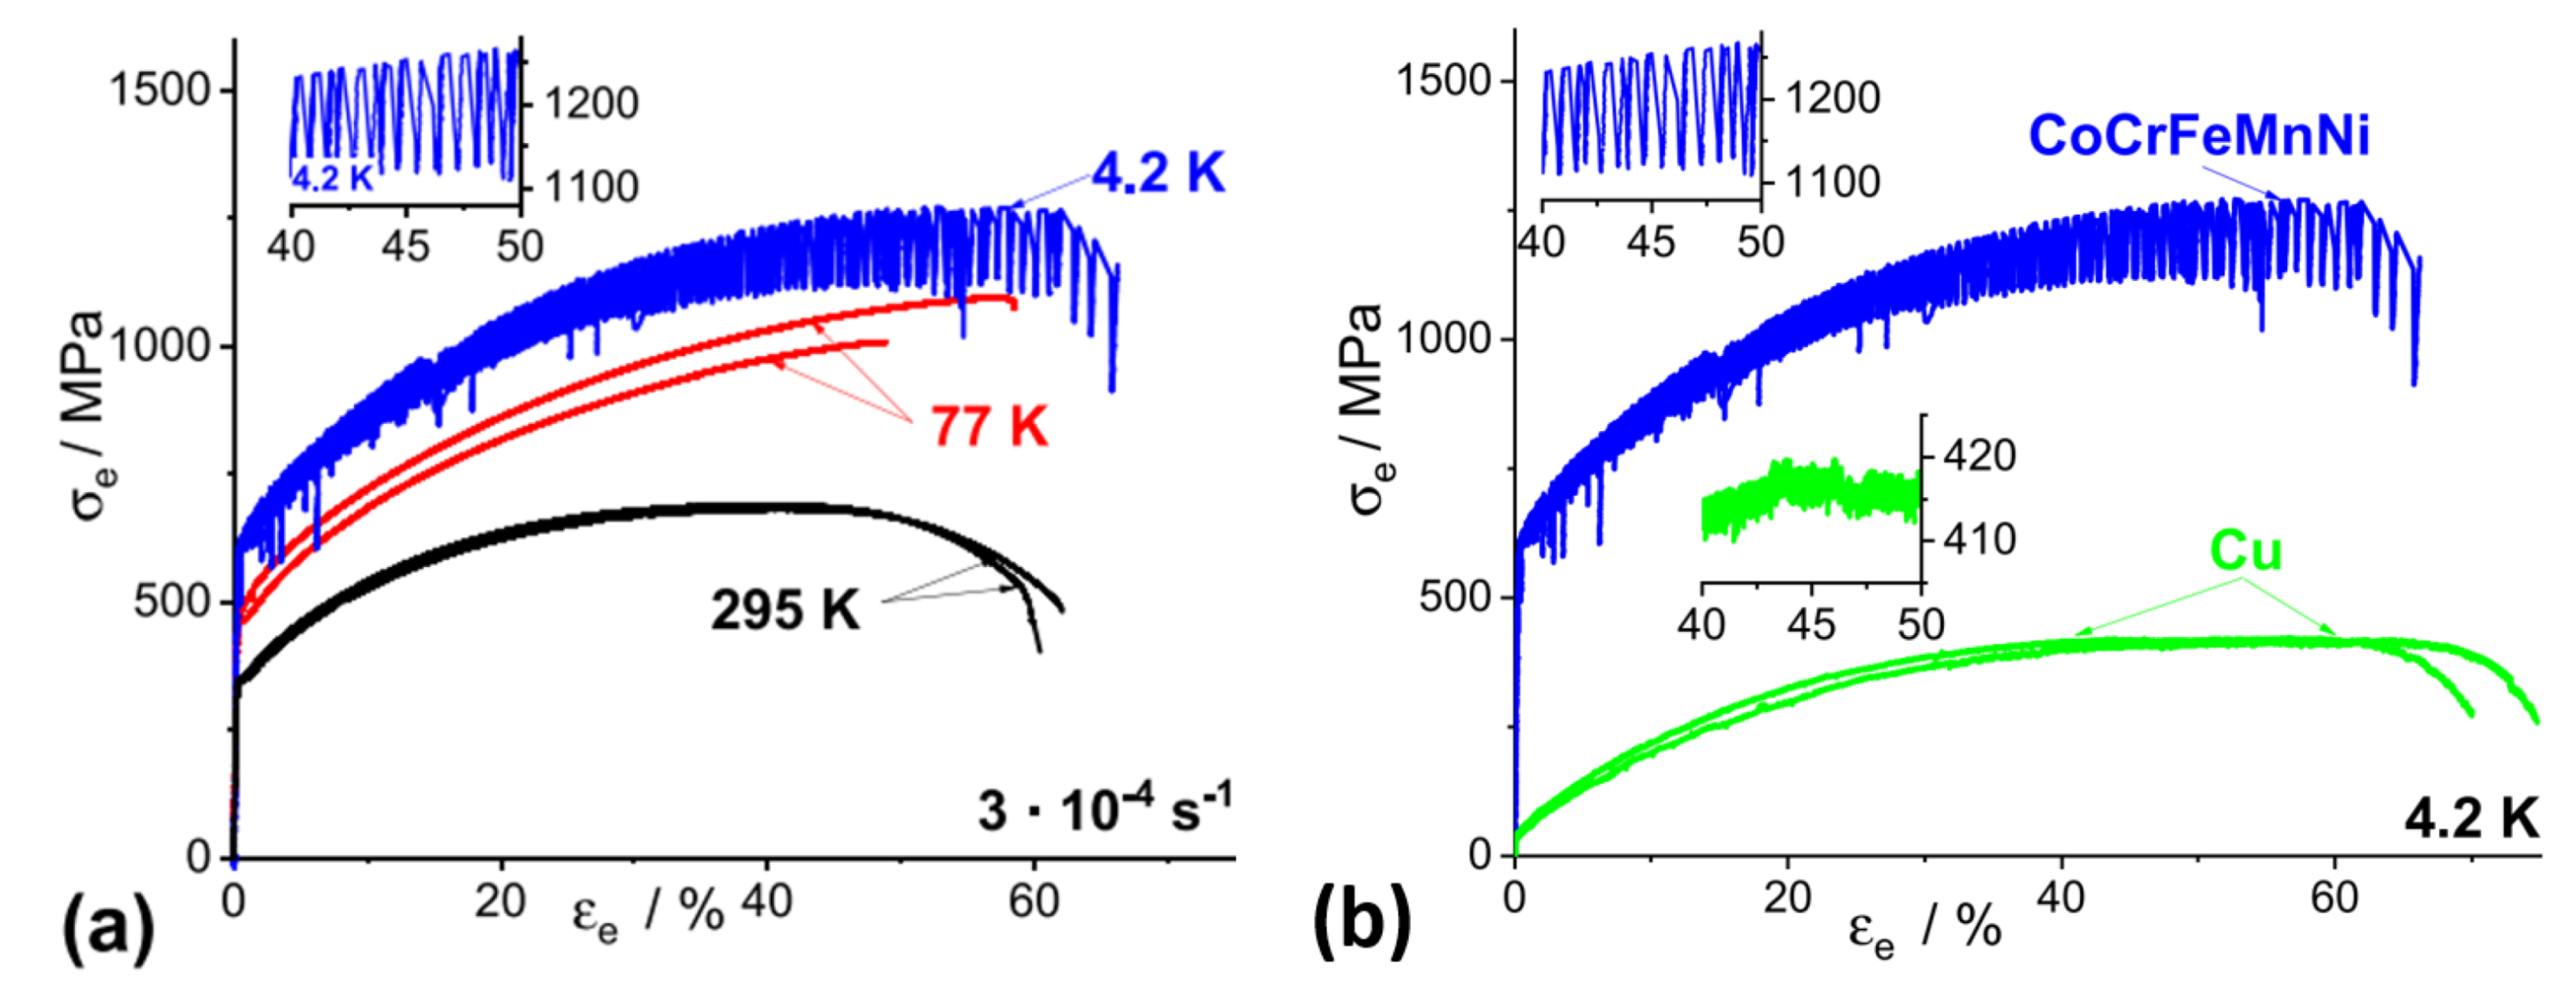
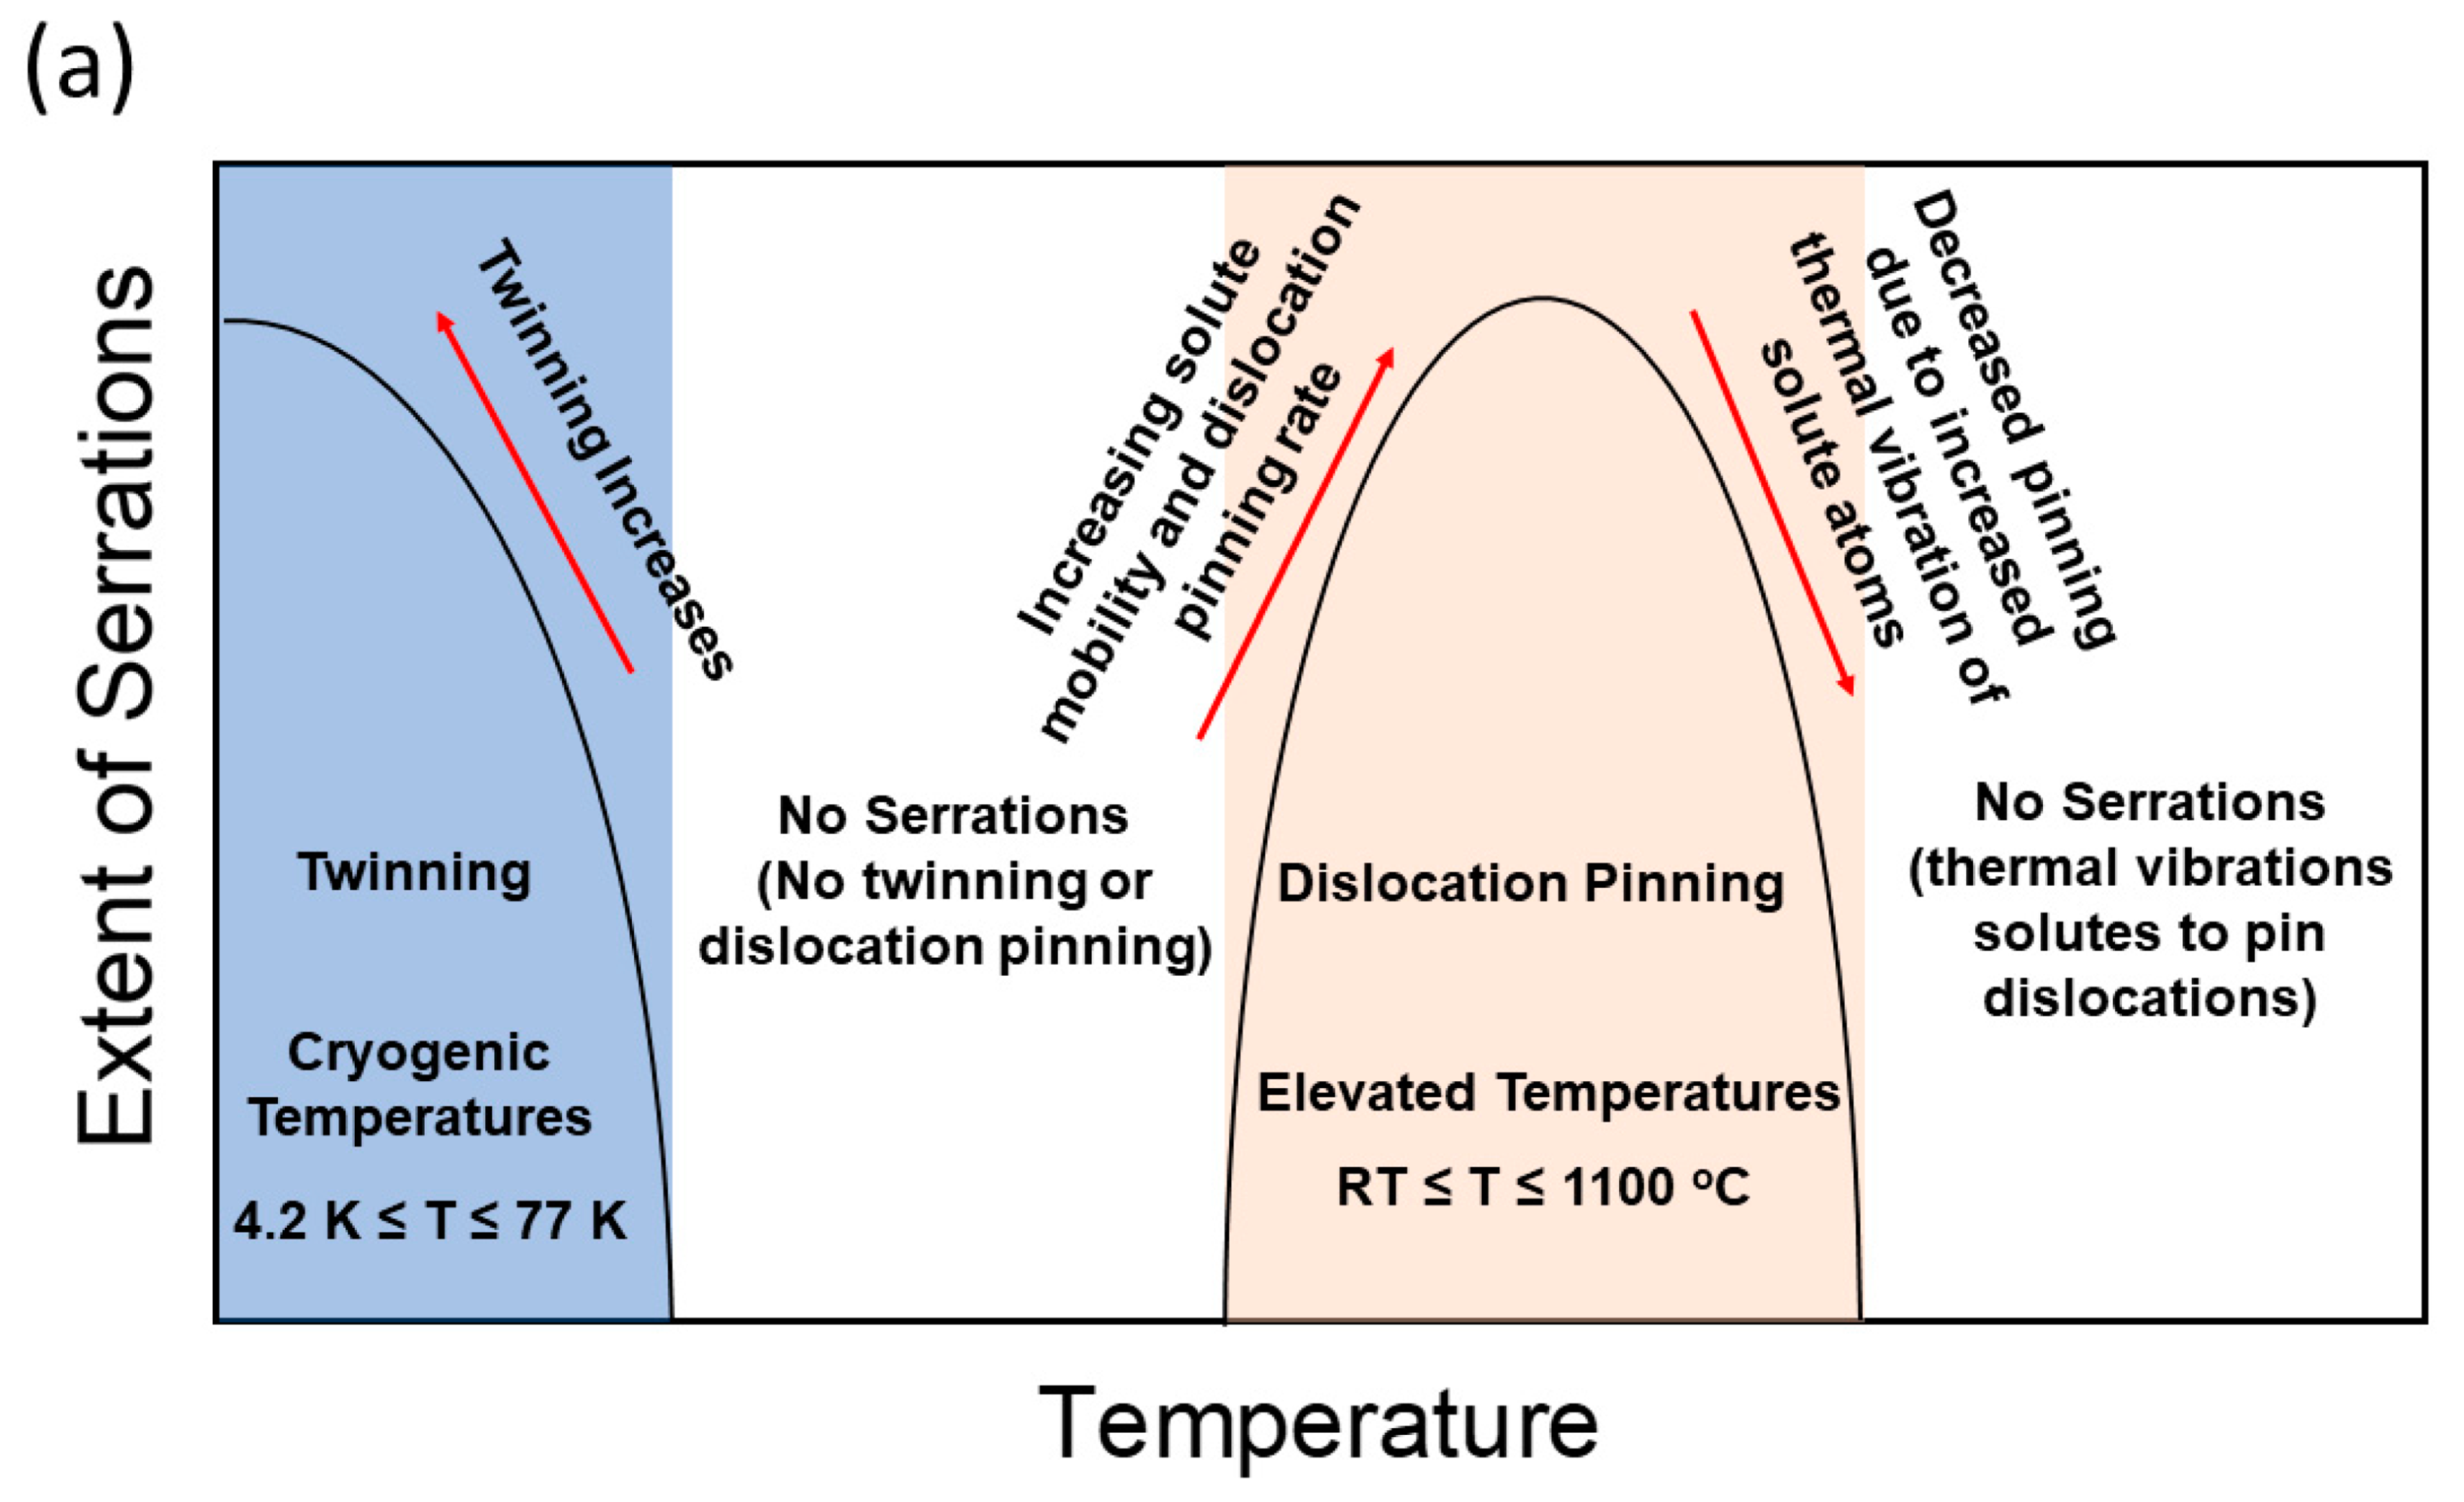
  • At cryogenic temperatures (4.2–77 K, or from –269 to 196 °C), twinning is the primary mechanism of the serrated flow by hindering dislocation motion at twin boundaries.
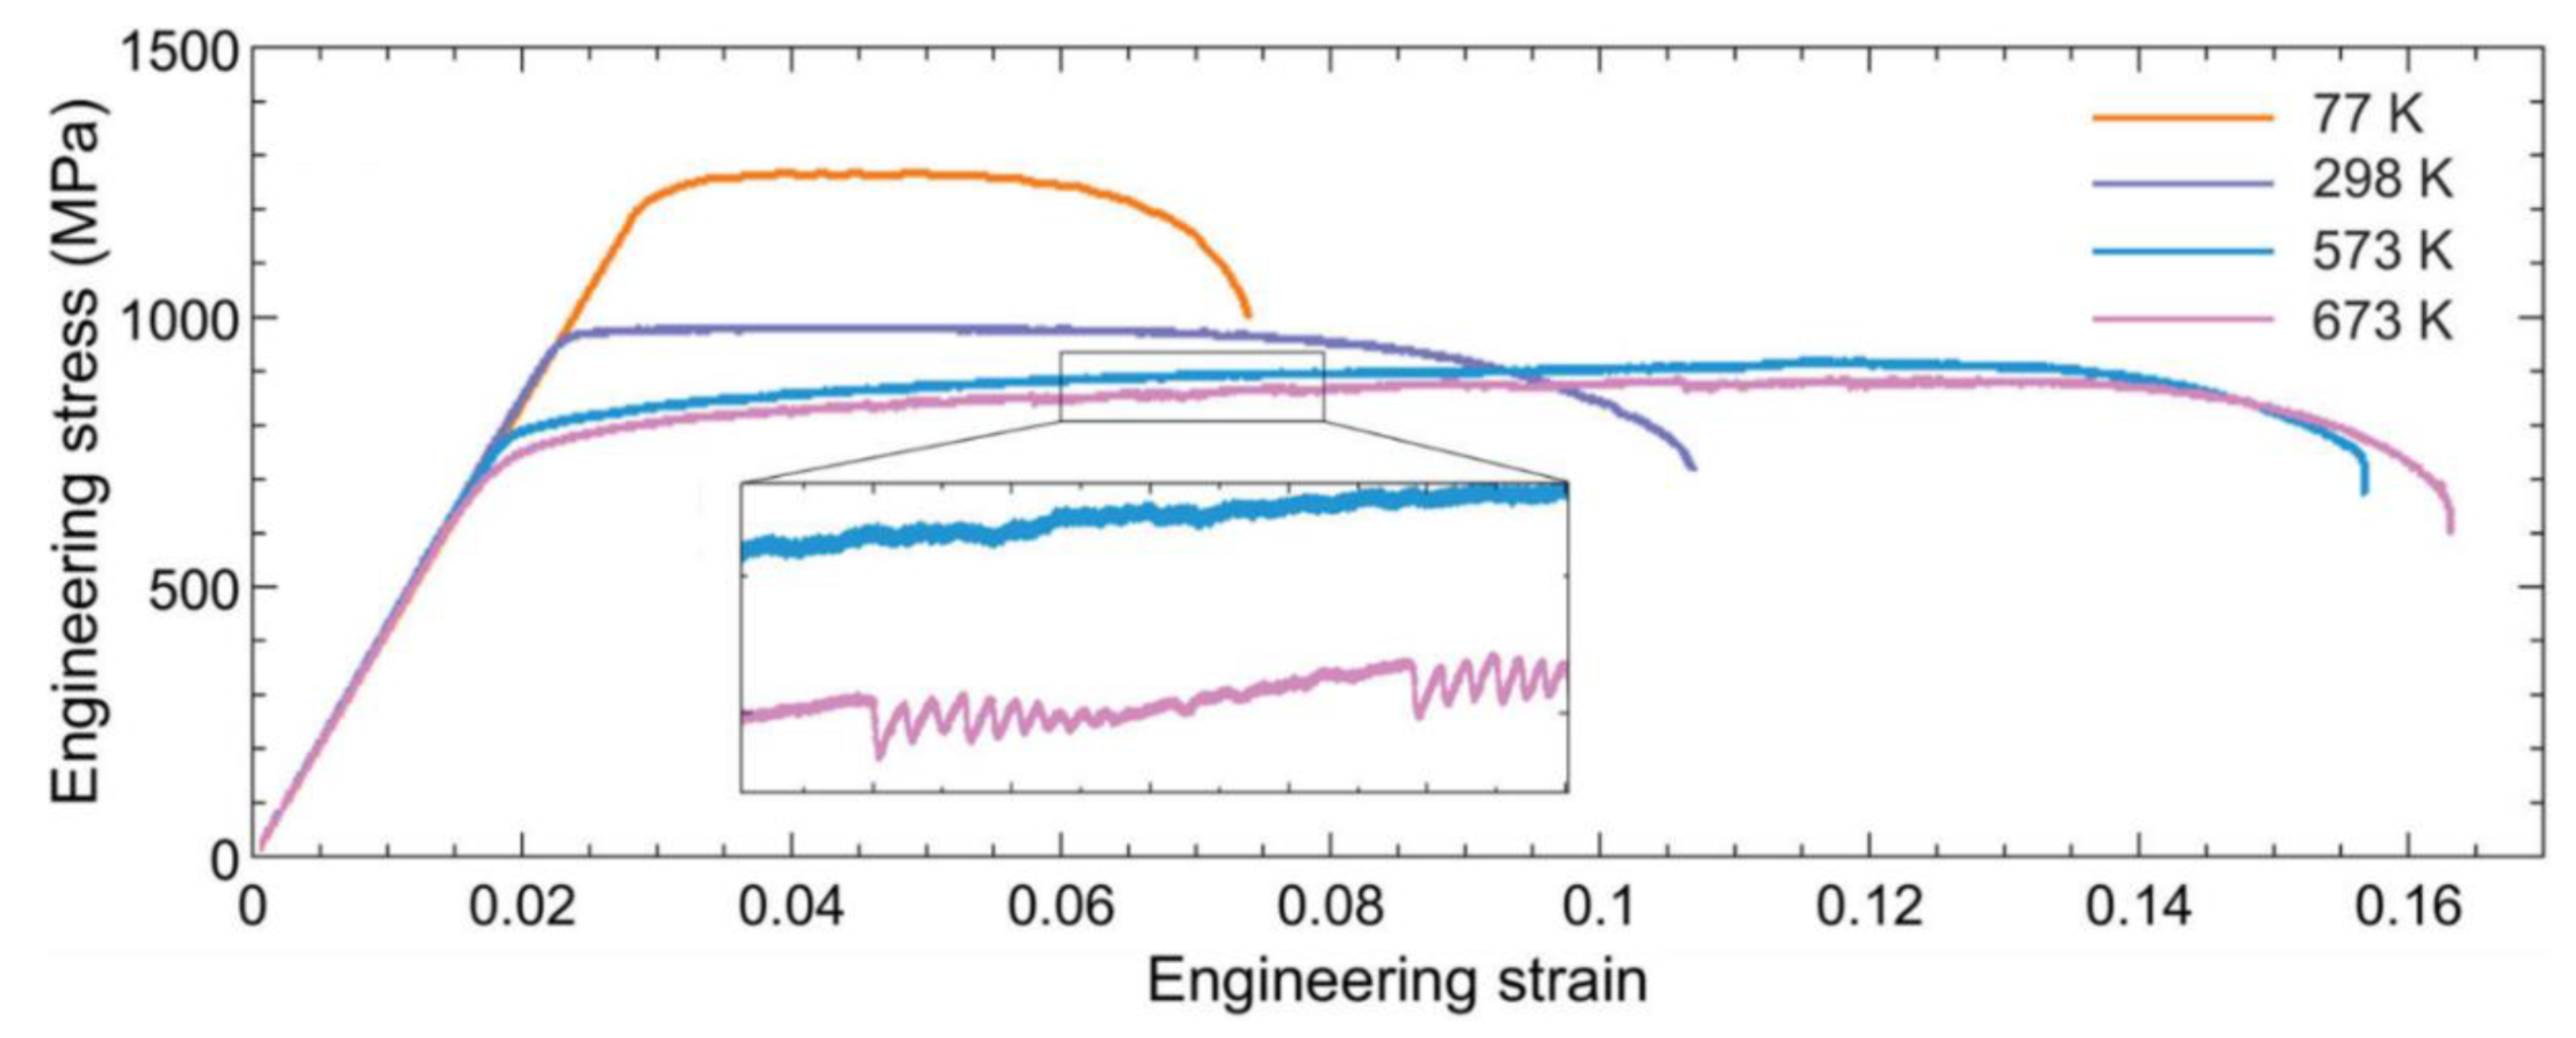
  • In most cases, serrations have been reported to occur at temperatures ranging from RT to 1100 °C and are a consequence of the pinning and unpinning of dislocations by solute atoms.
  • The extent of the serrations in this temperature regime (RT to 1100 °C) initially increases with temperature due to the increased migration speed of pinning solutes until it reaches a maximum. After reaching the maximum, the extent of serrations decreases with temperature due to the increasing thermal vibration of solutes that reduces their ability to pin dislocations.
  • At temperatures between the cryogenic regime and RT, serrated flows have not been observed. In this temperature range, solute atoms are not mobile enough to catch and pin moving dislocations, thus resulting in a lack of observable serrations during plastic deformation.
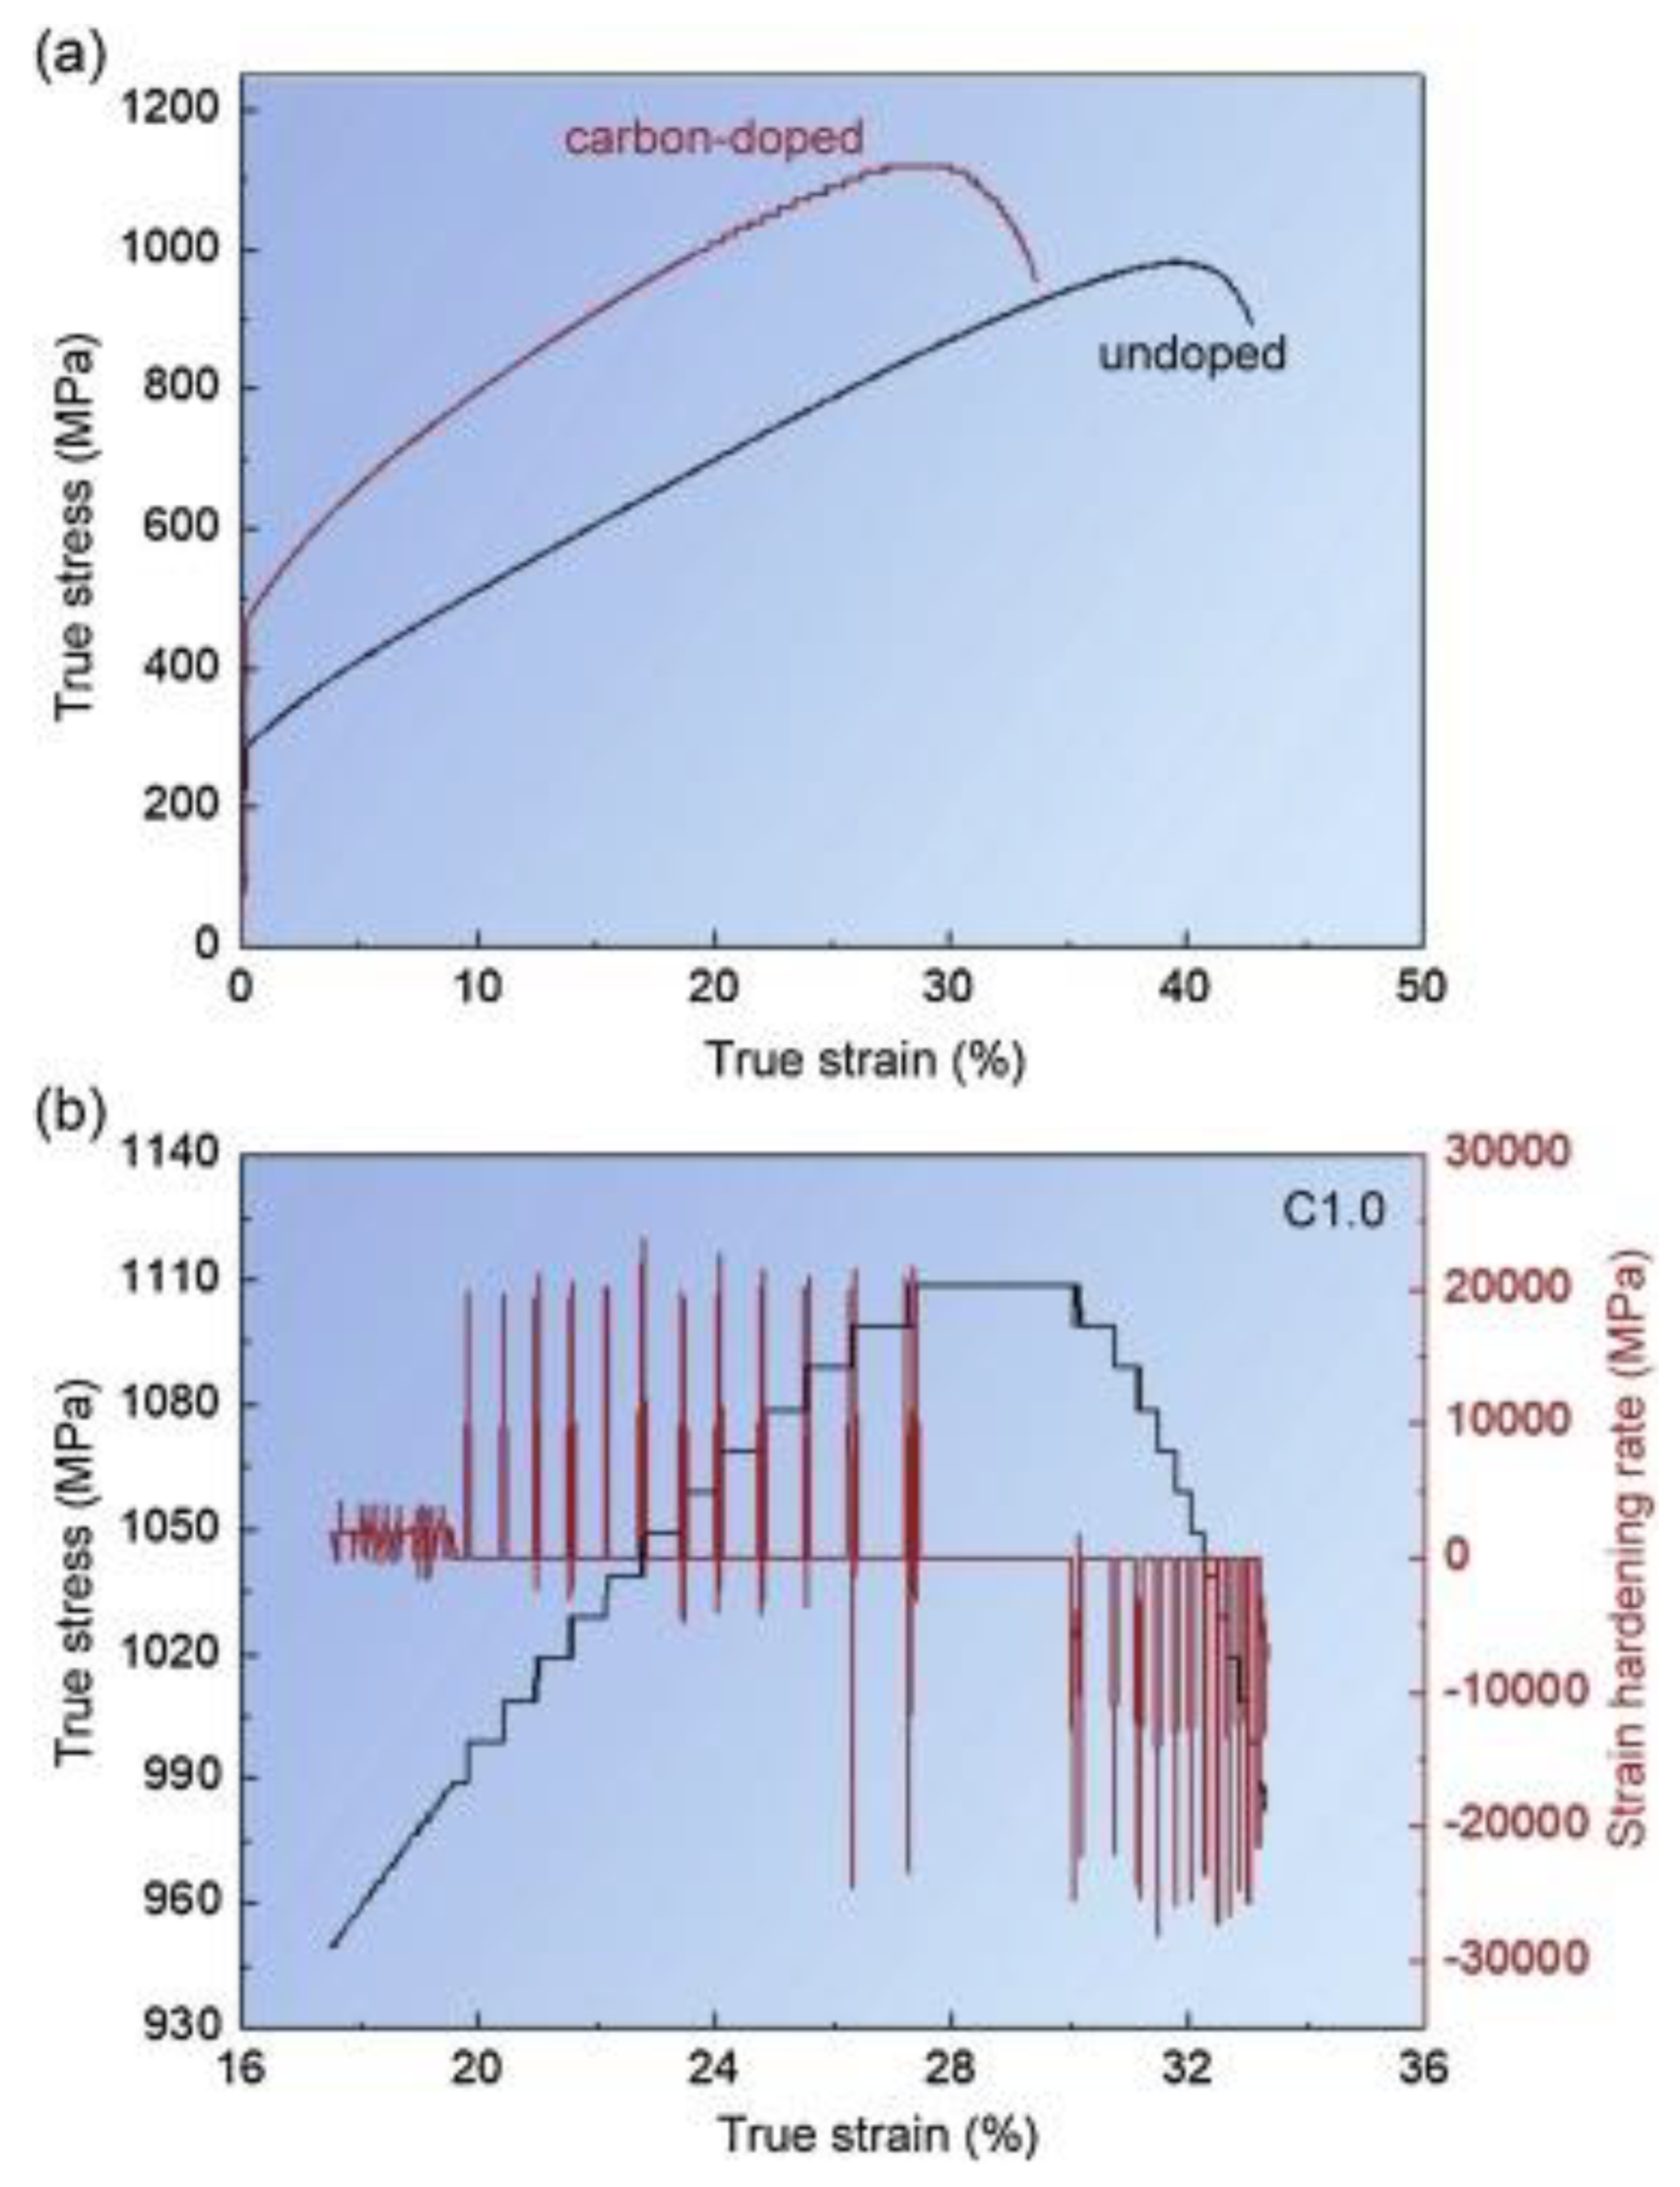
  • Additive solutes, such as C and Al, play an important role in the serrated flow behavior in HEAs.
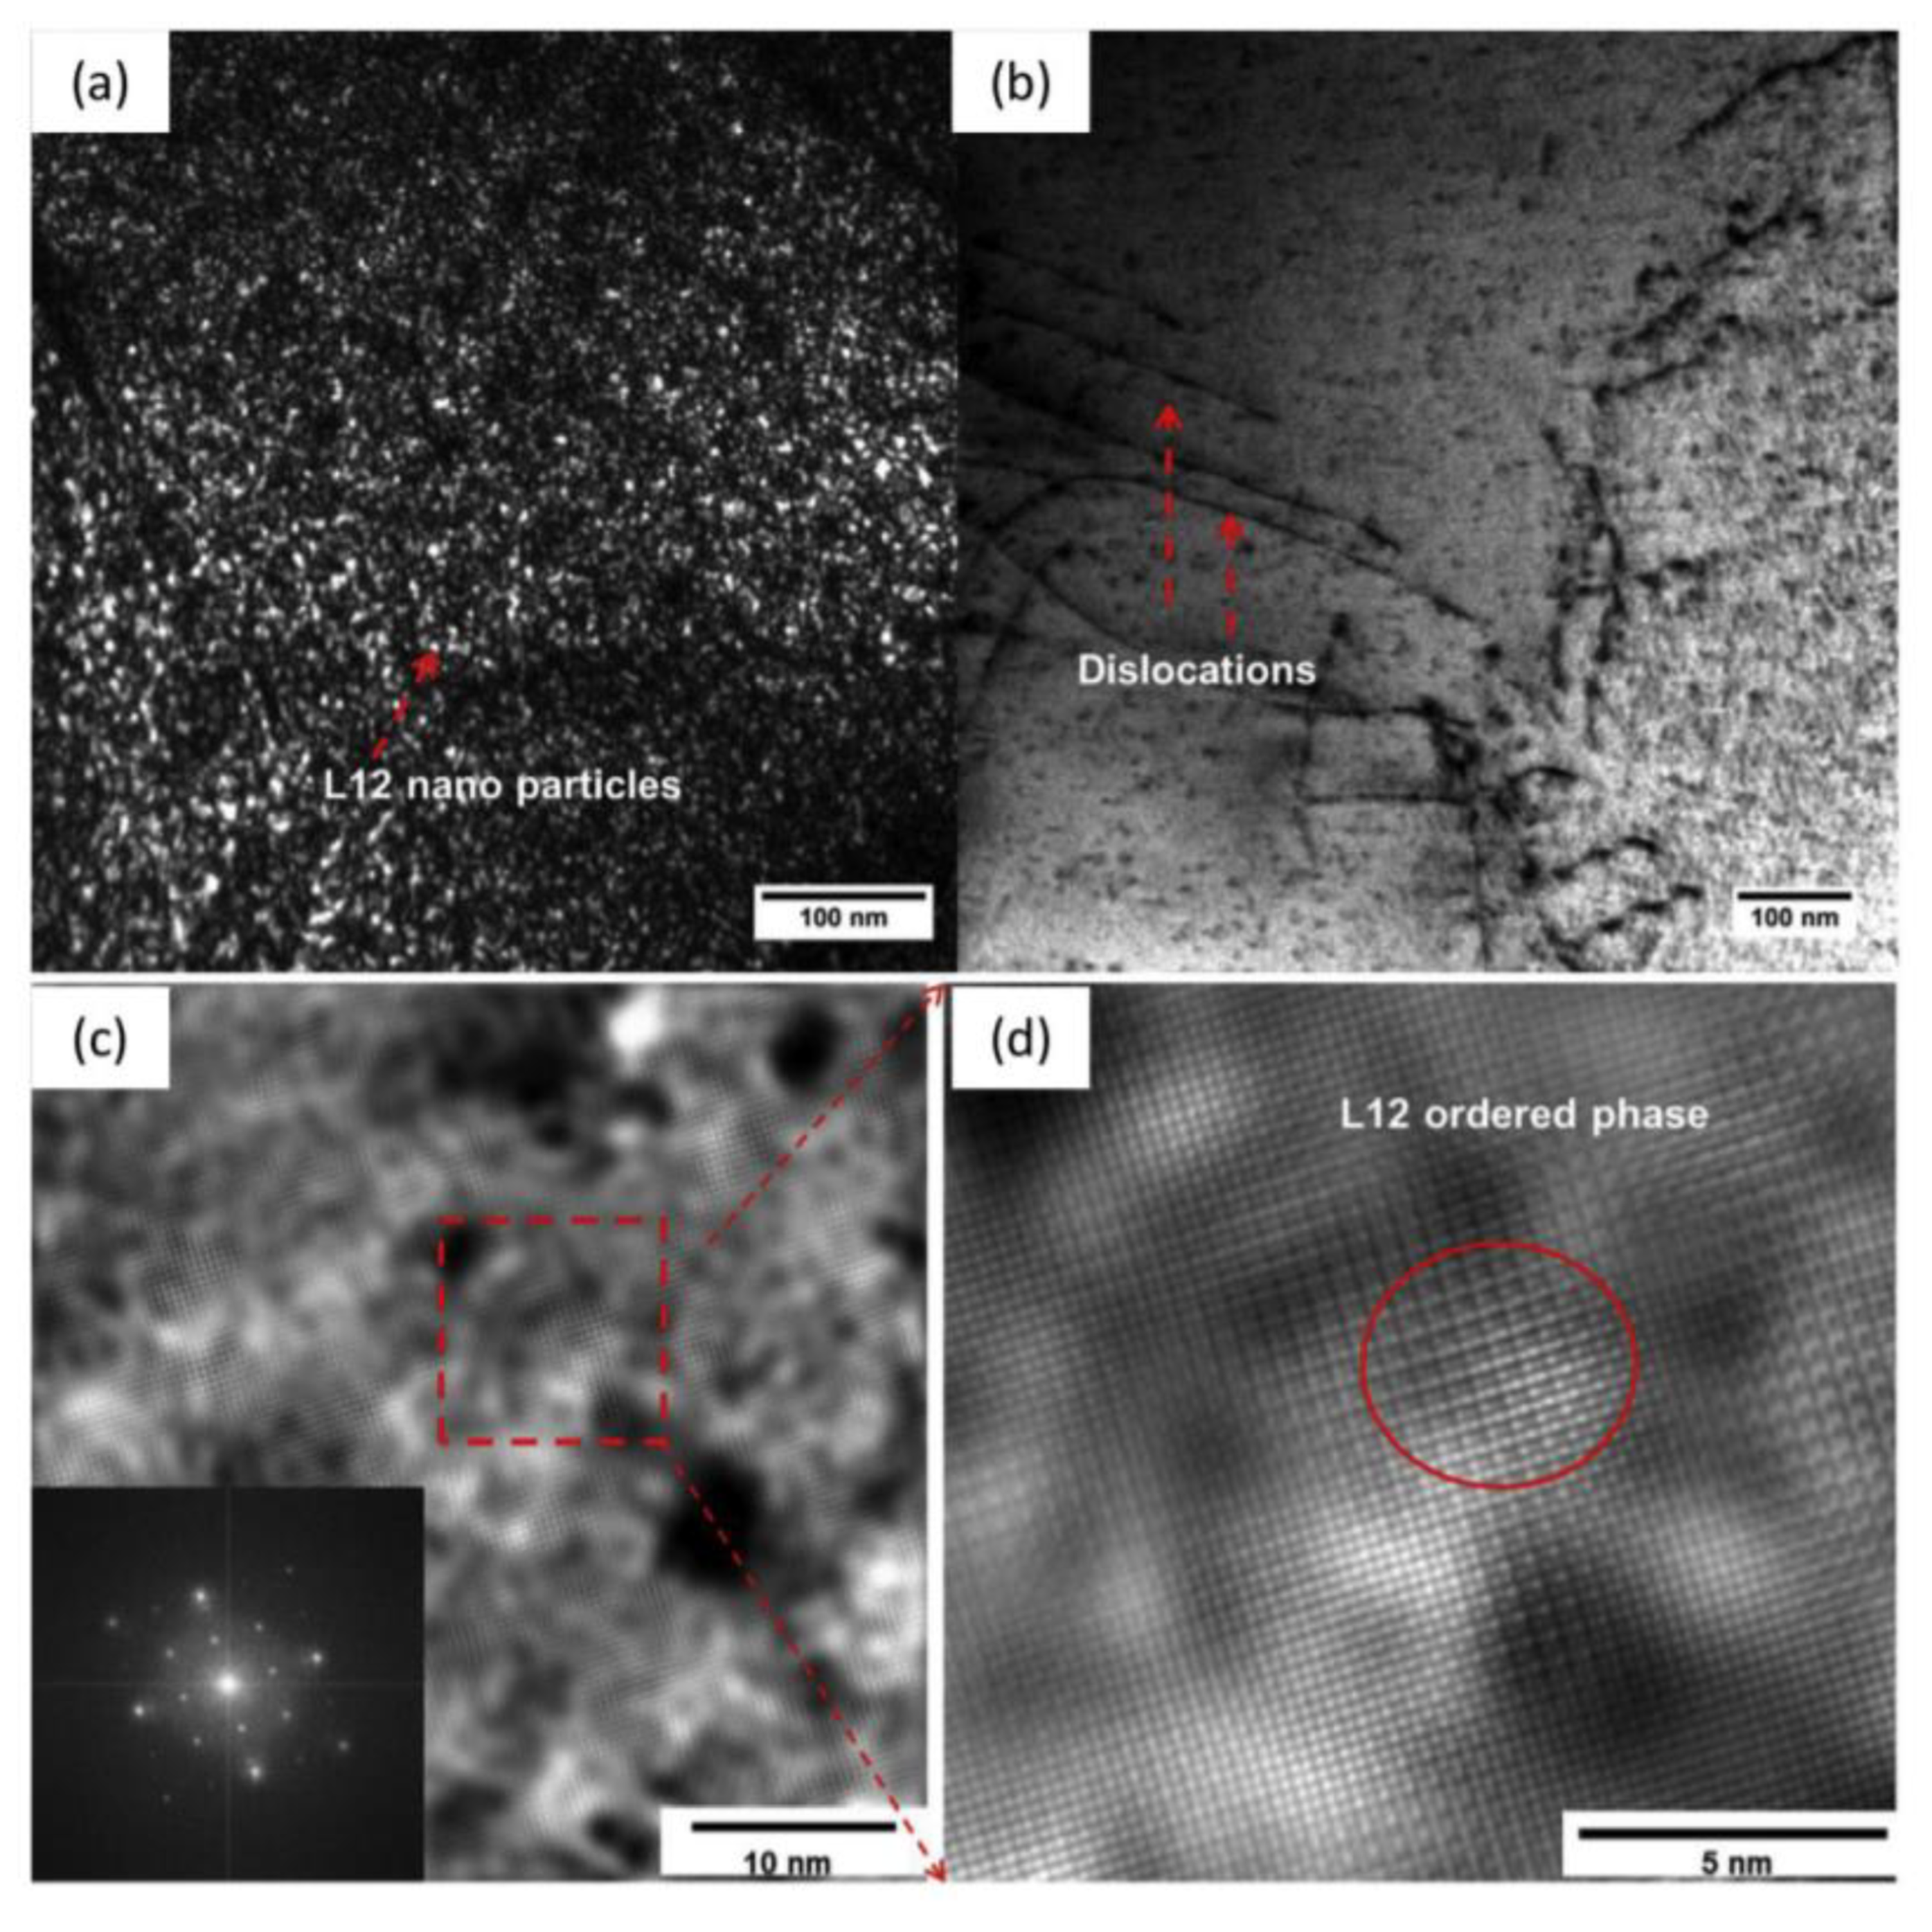
  • The phase structure as well as the presence of nanoparticles (such as L12) in the matrix may play a role in the serration behavior.
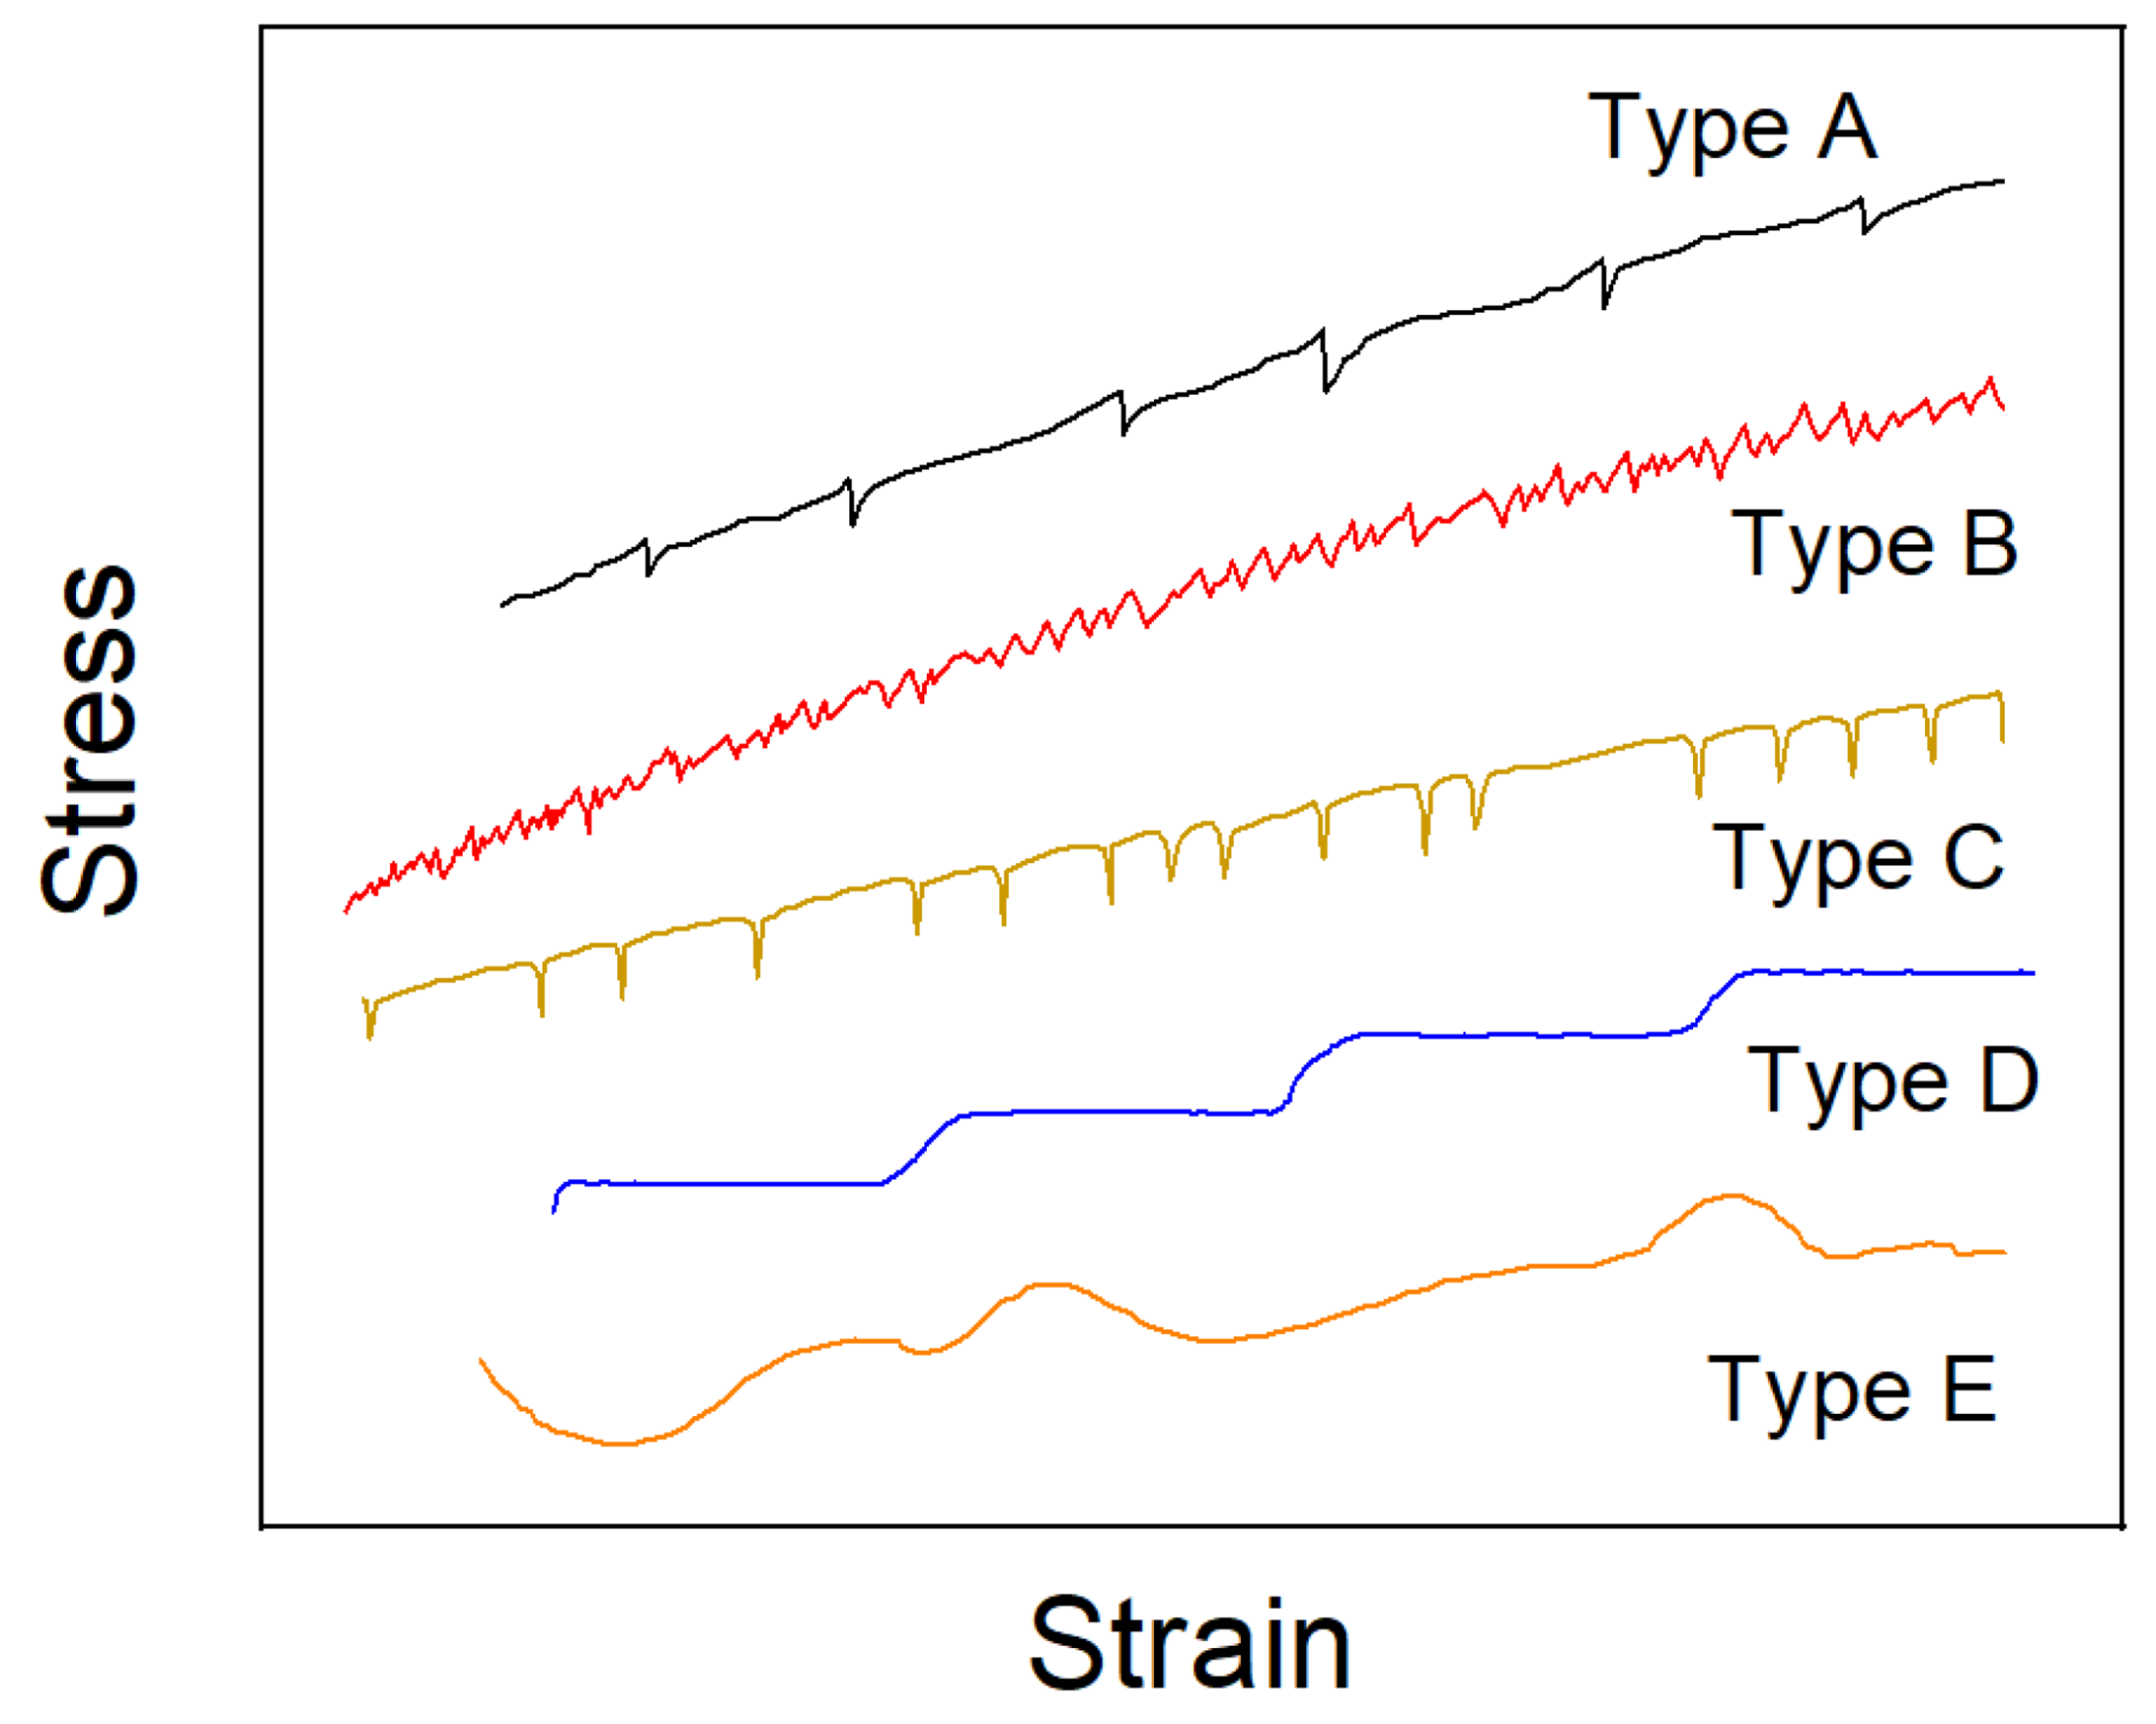
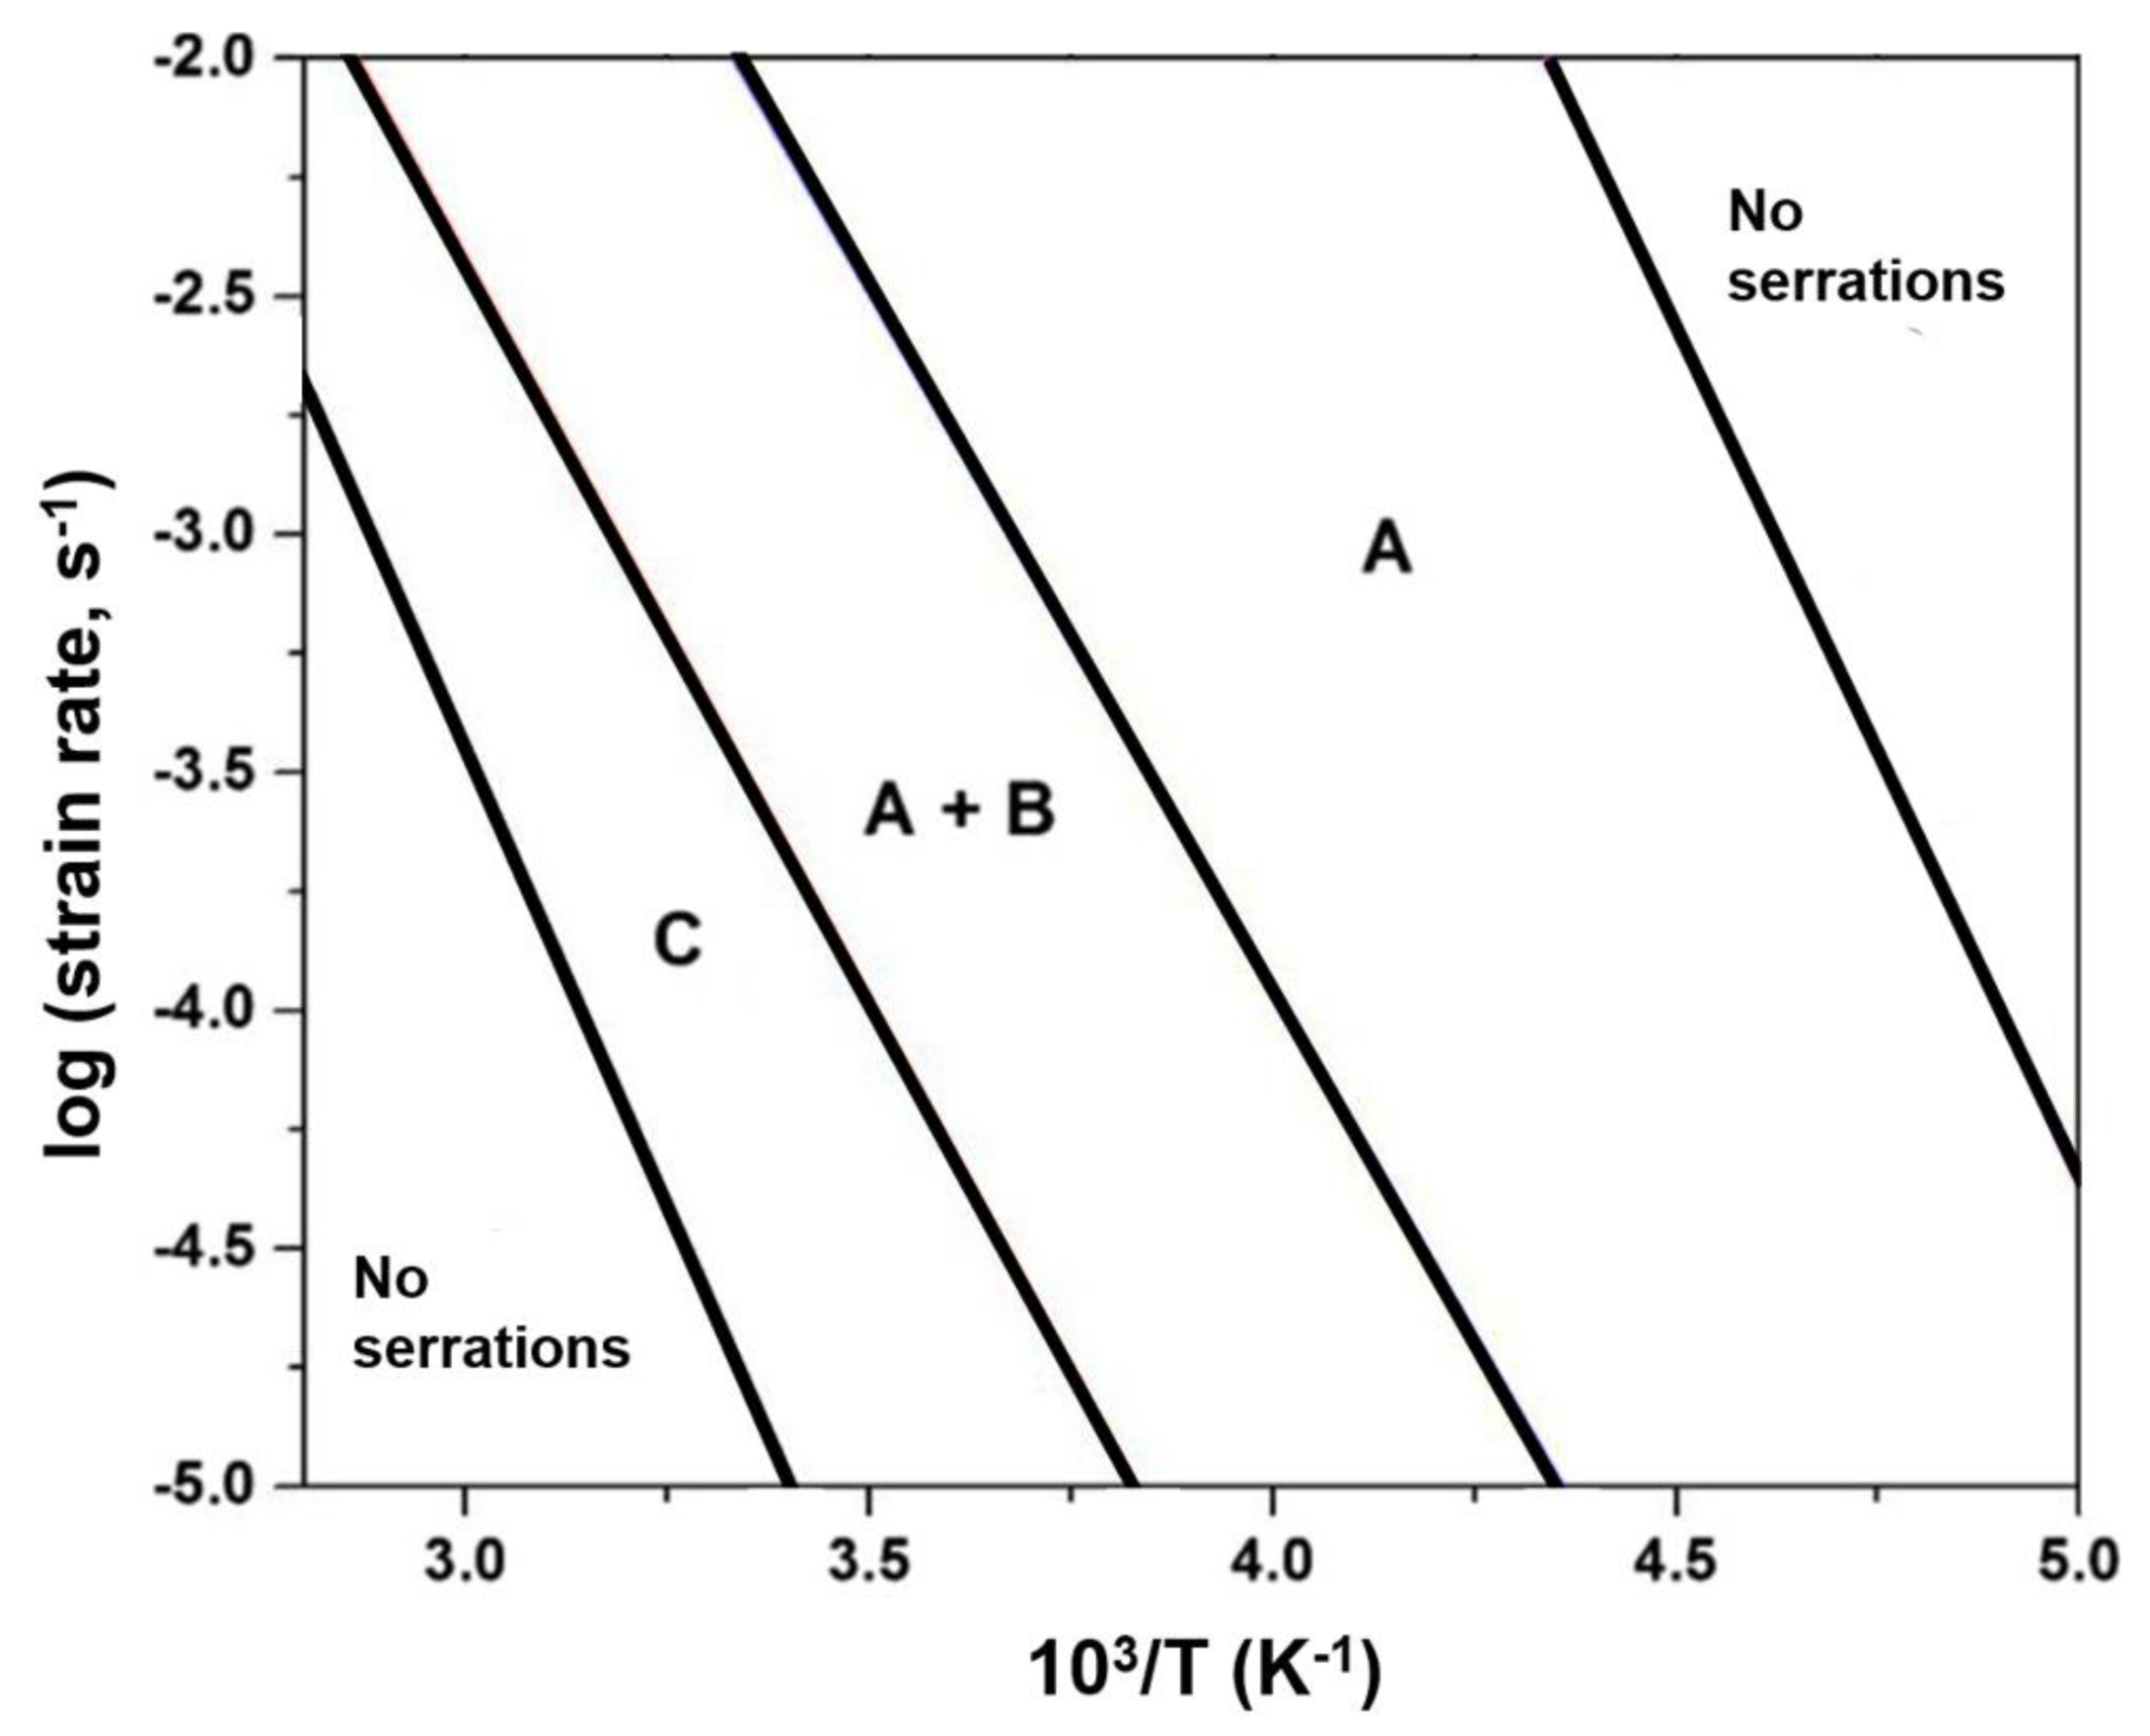
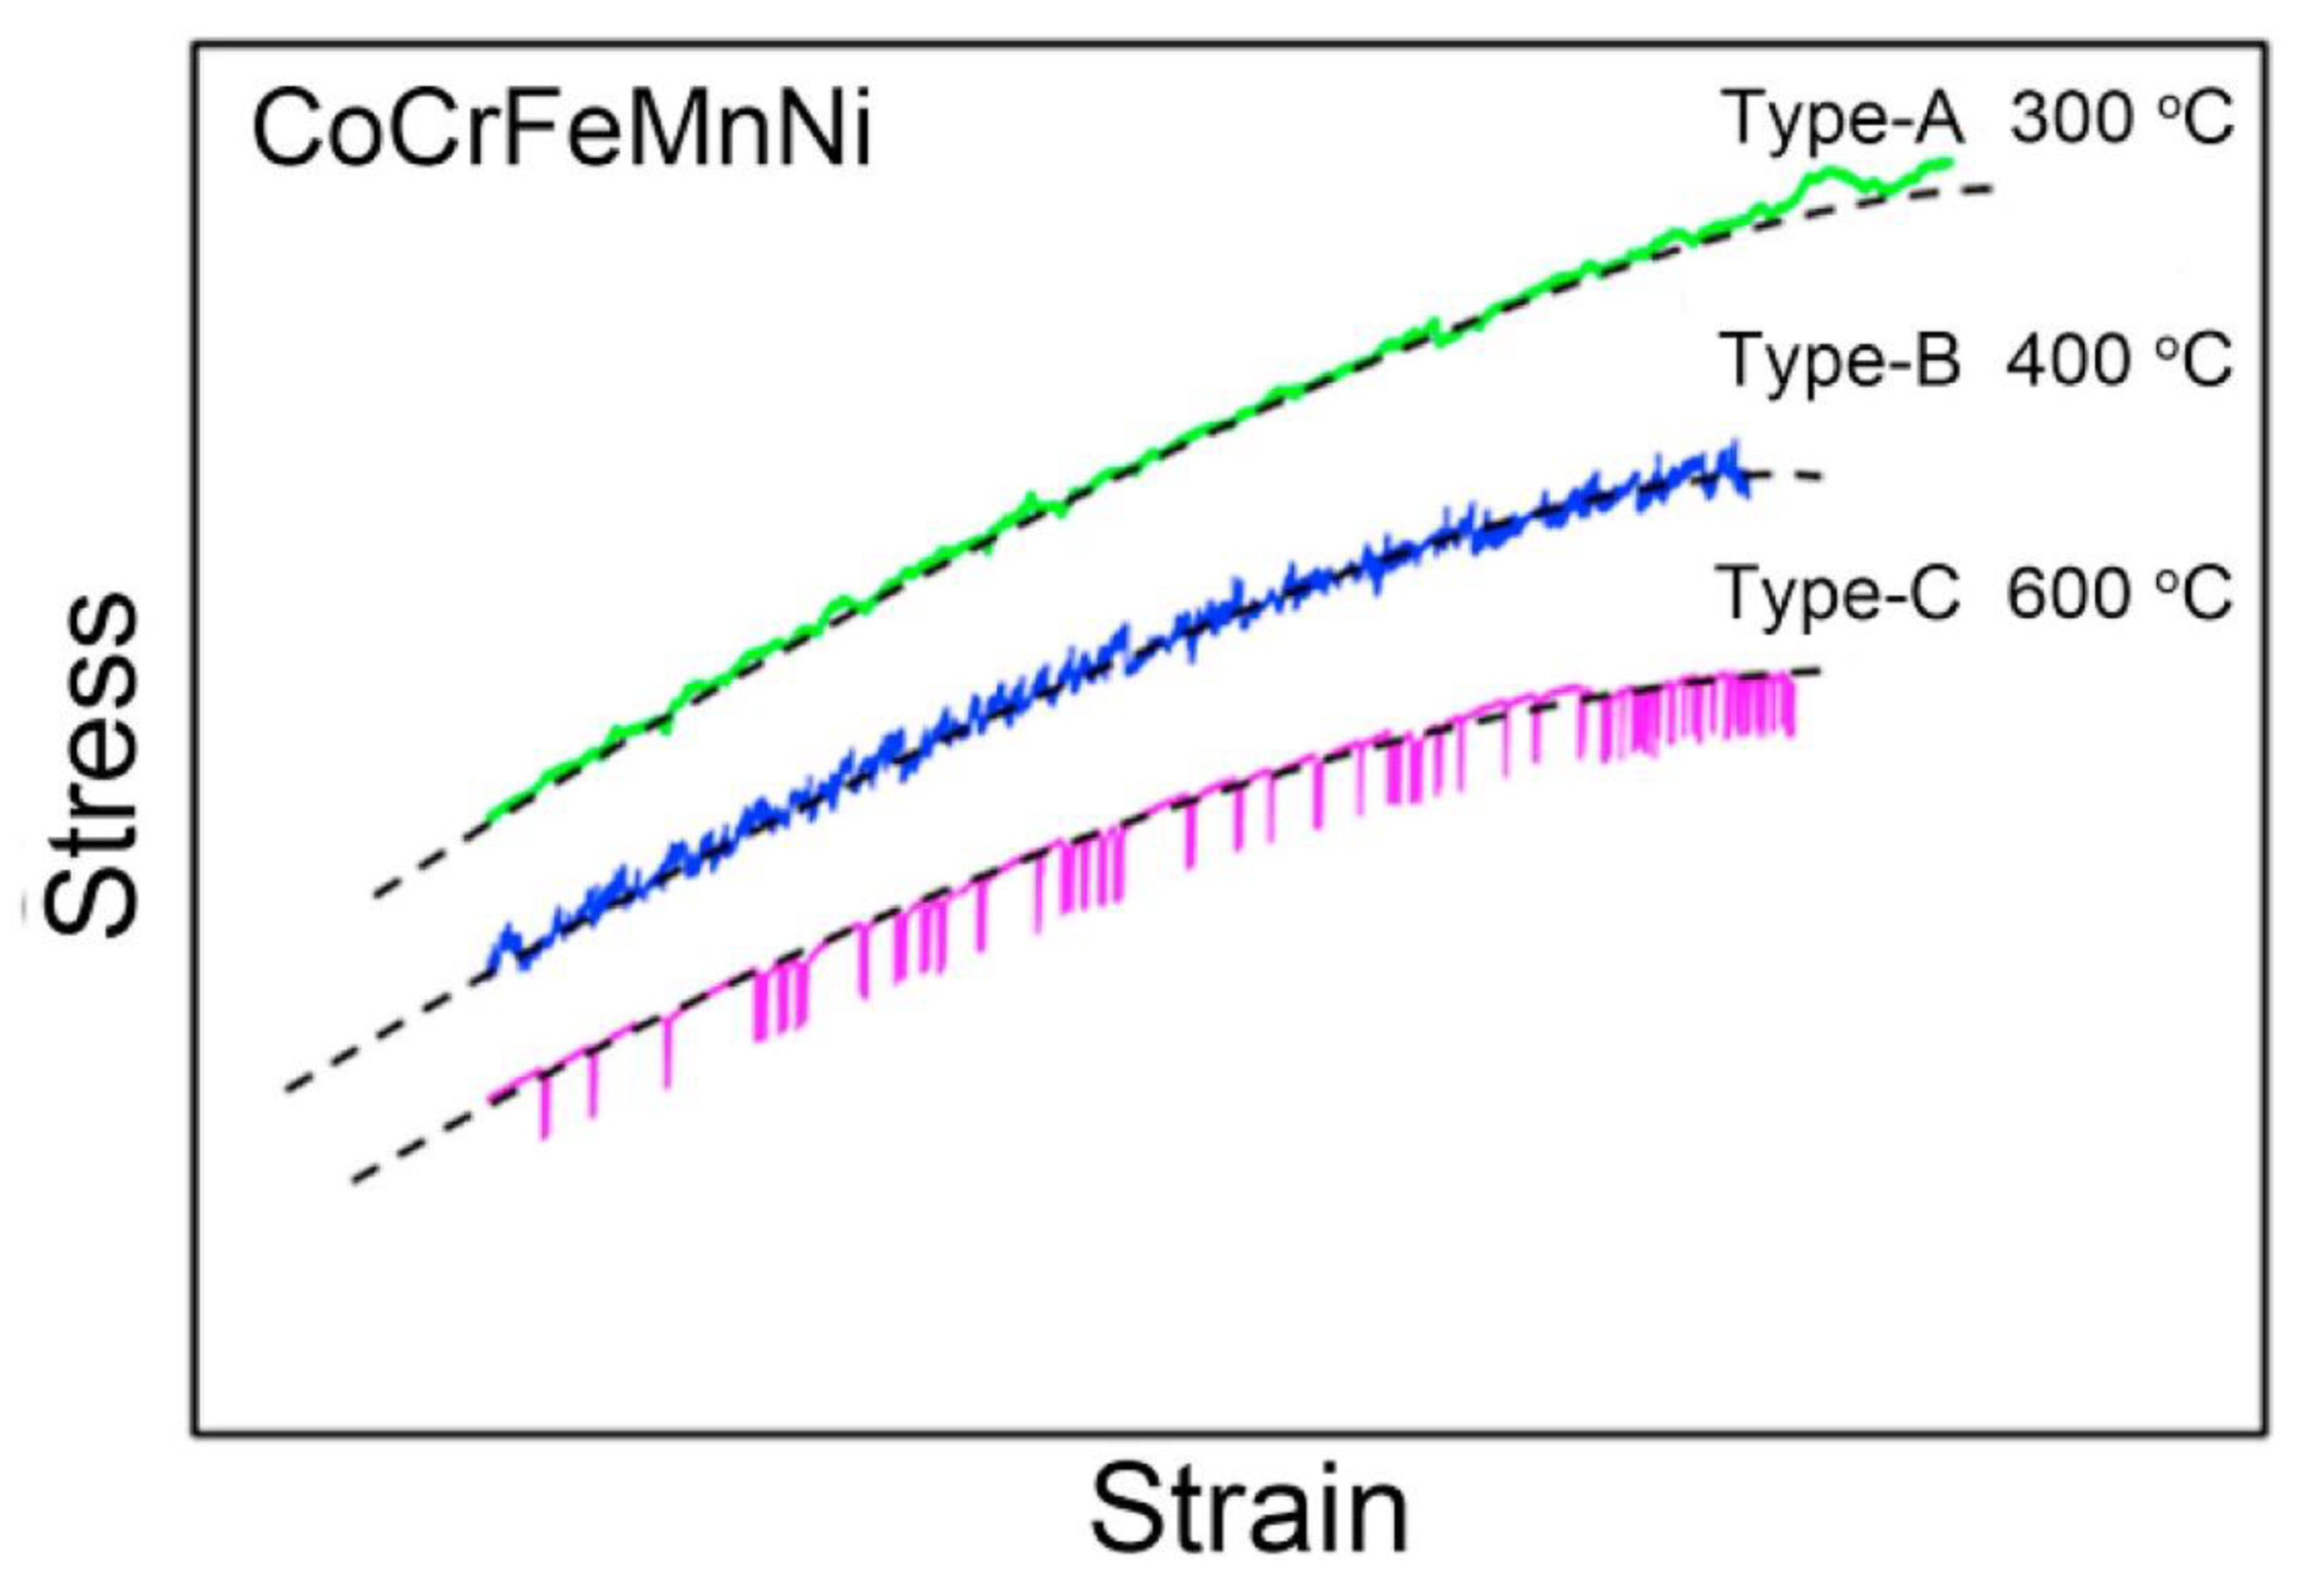
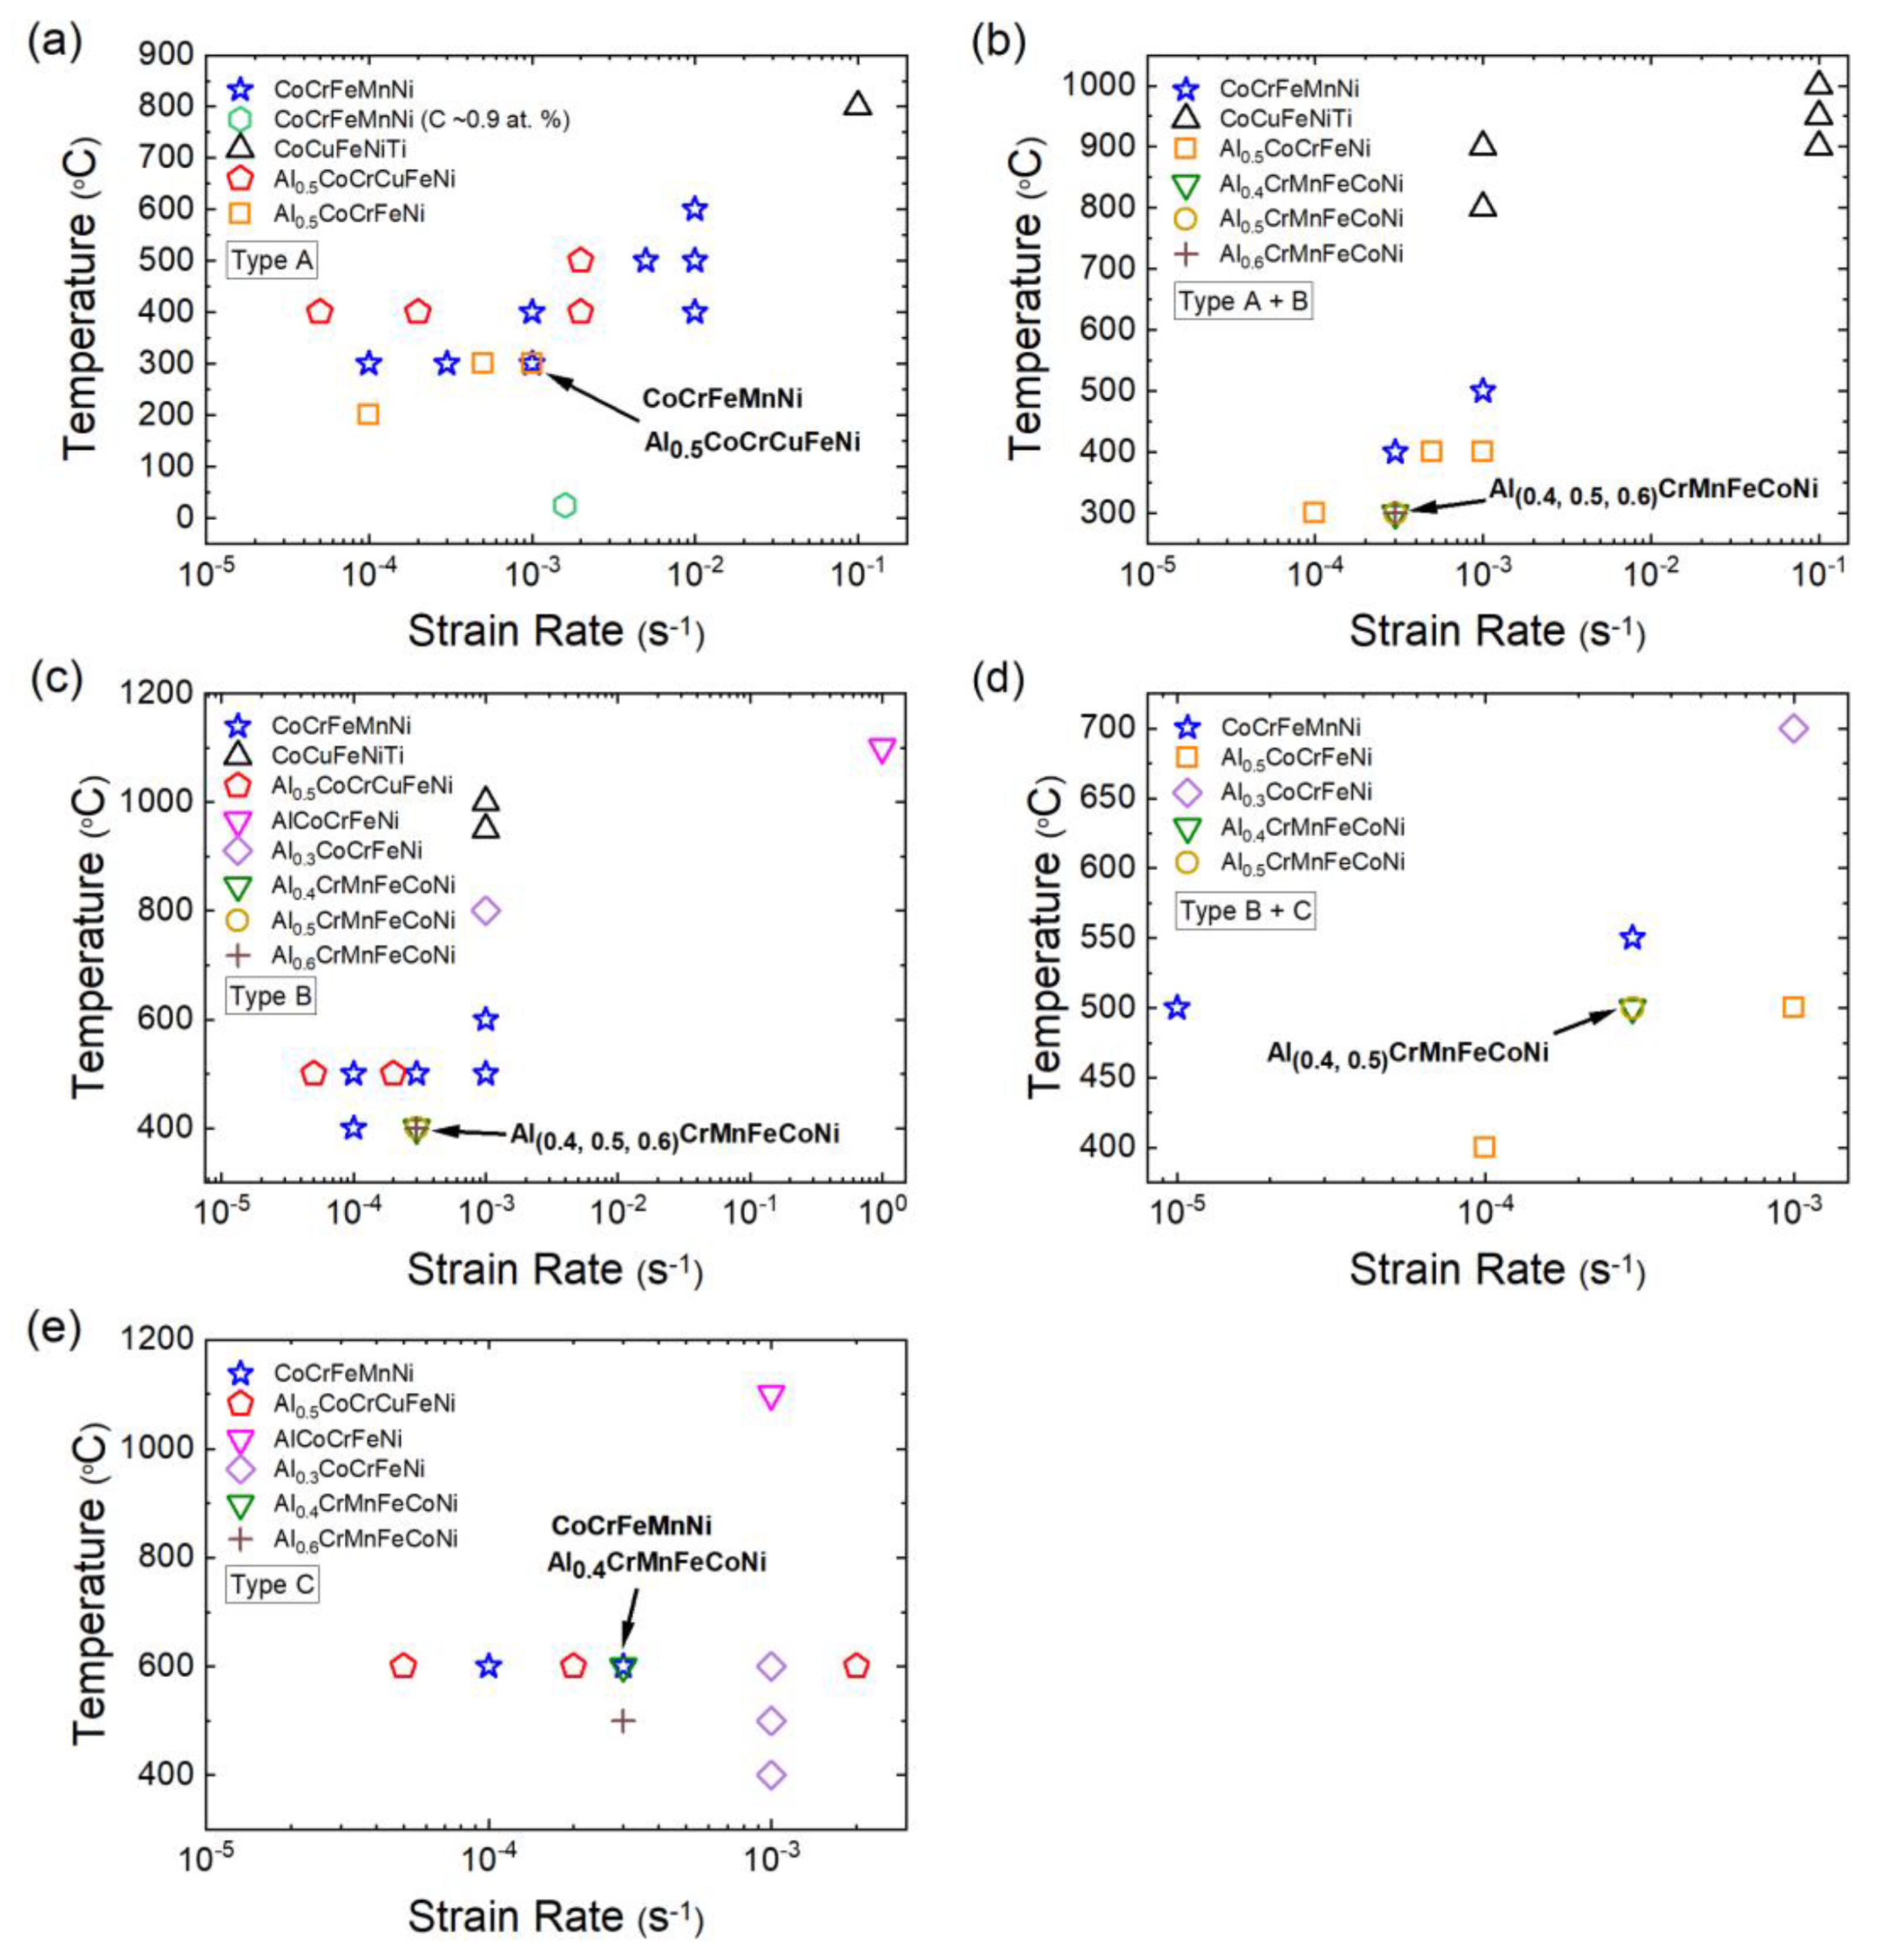
  • The serration types reported include Types A, B, C, A + B, and B + C.
  • The serration type depends on temperature. For example, Type-A serrations generally occur at lower temperatures, as compared to Type-B and Type-C serrations.
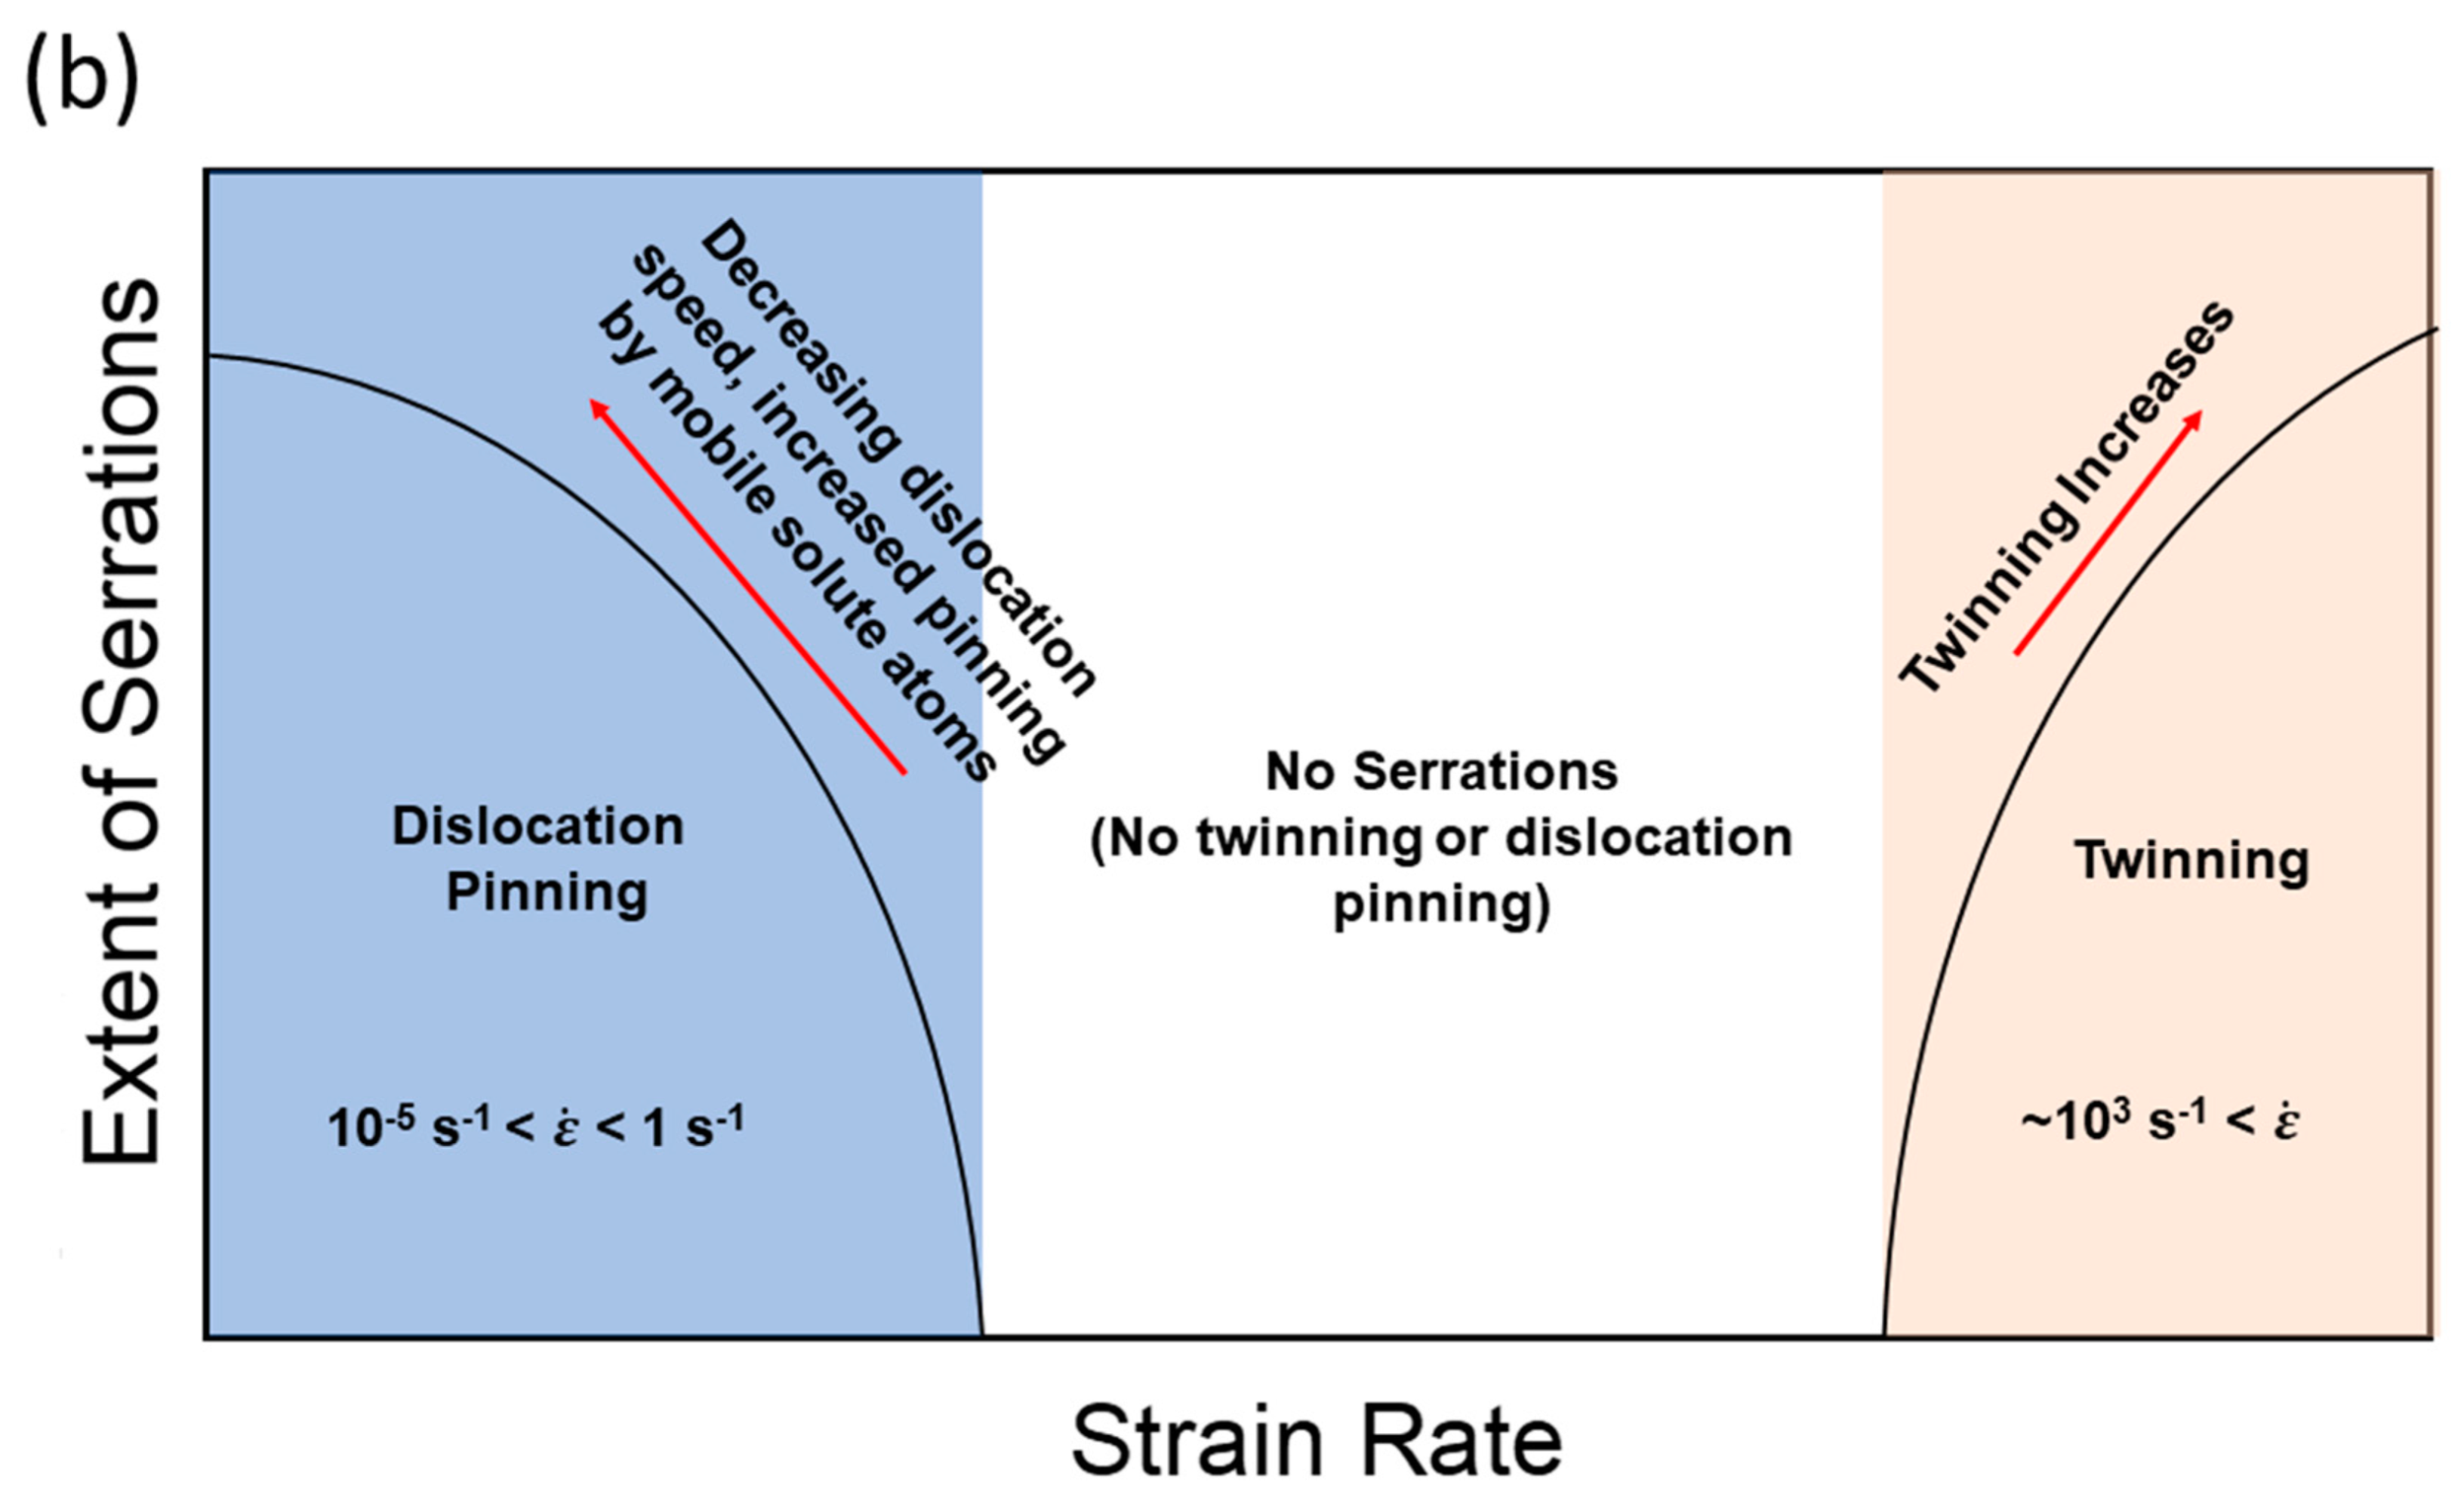
  • The serration type also depends on strain rate. Typically, Type-C serrations are observed at lower strain rates while Types A and B are seen at relatively higher strain rates.
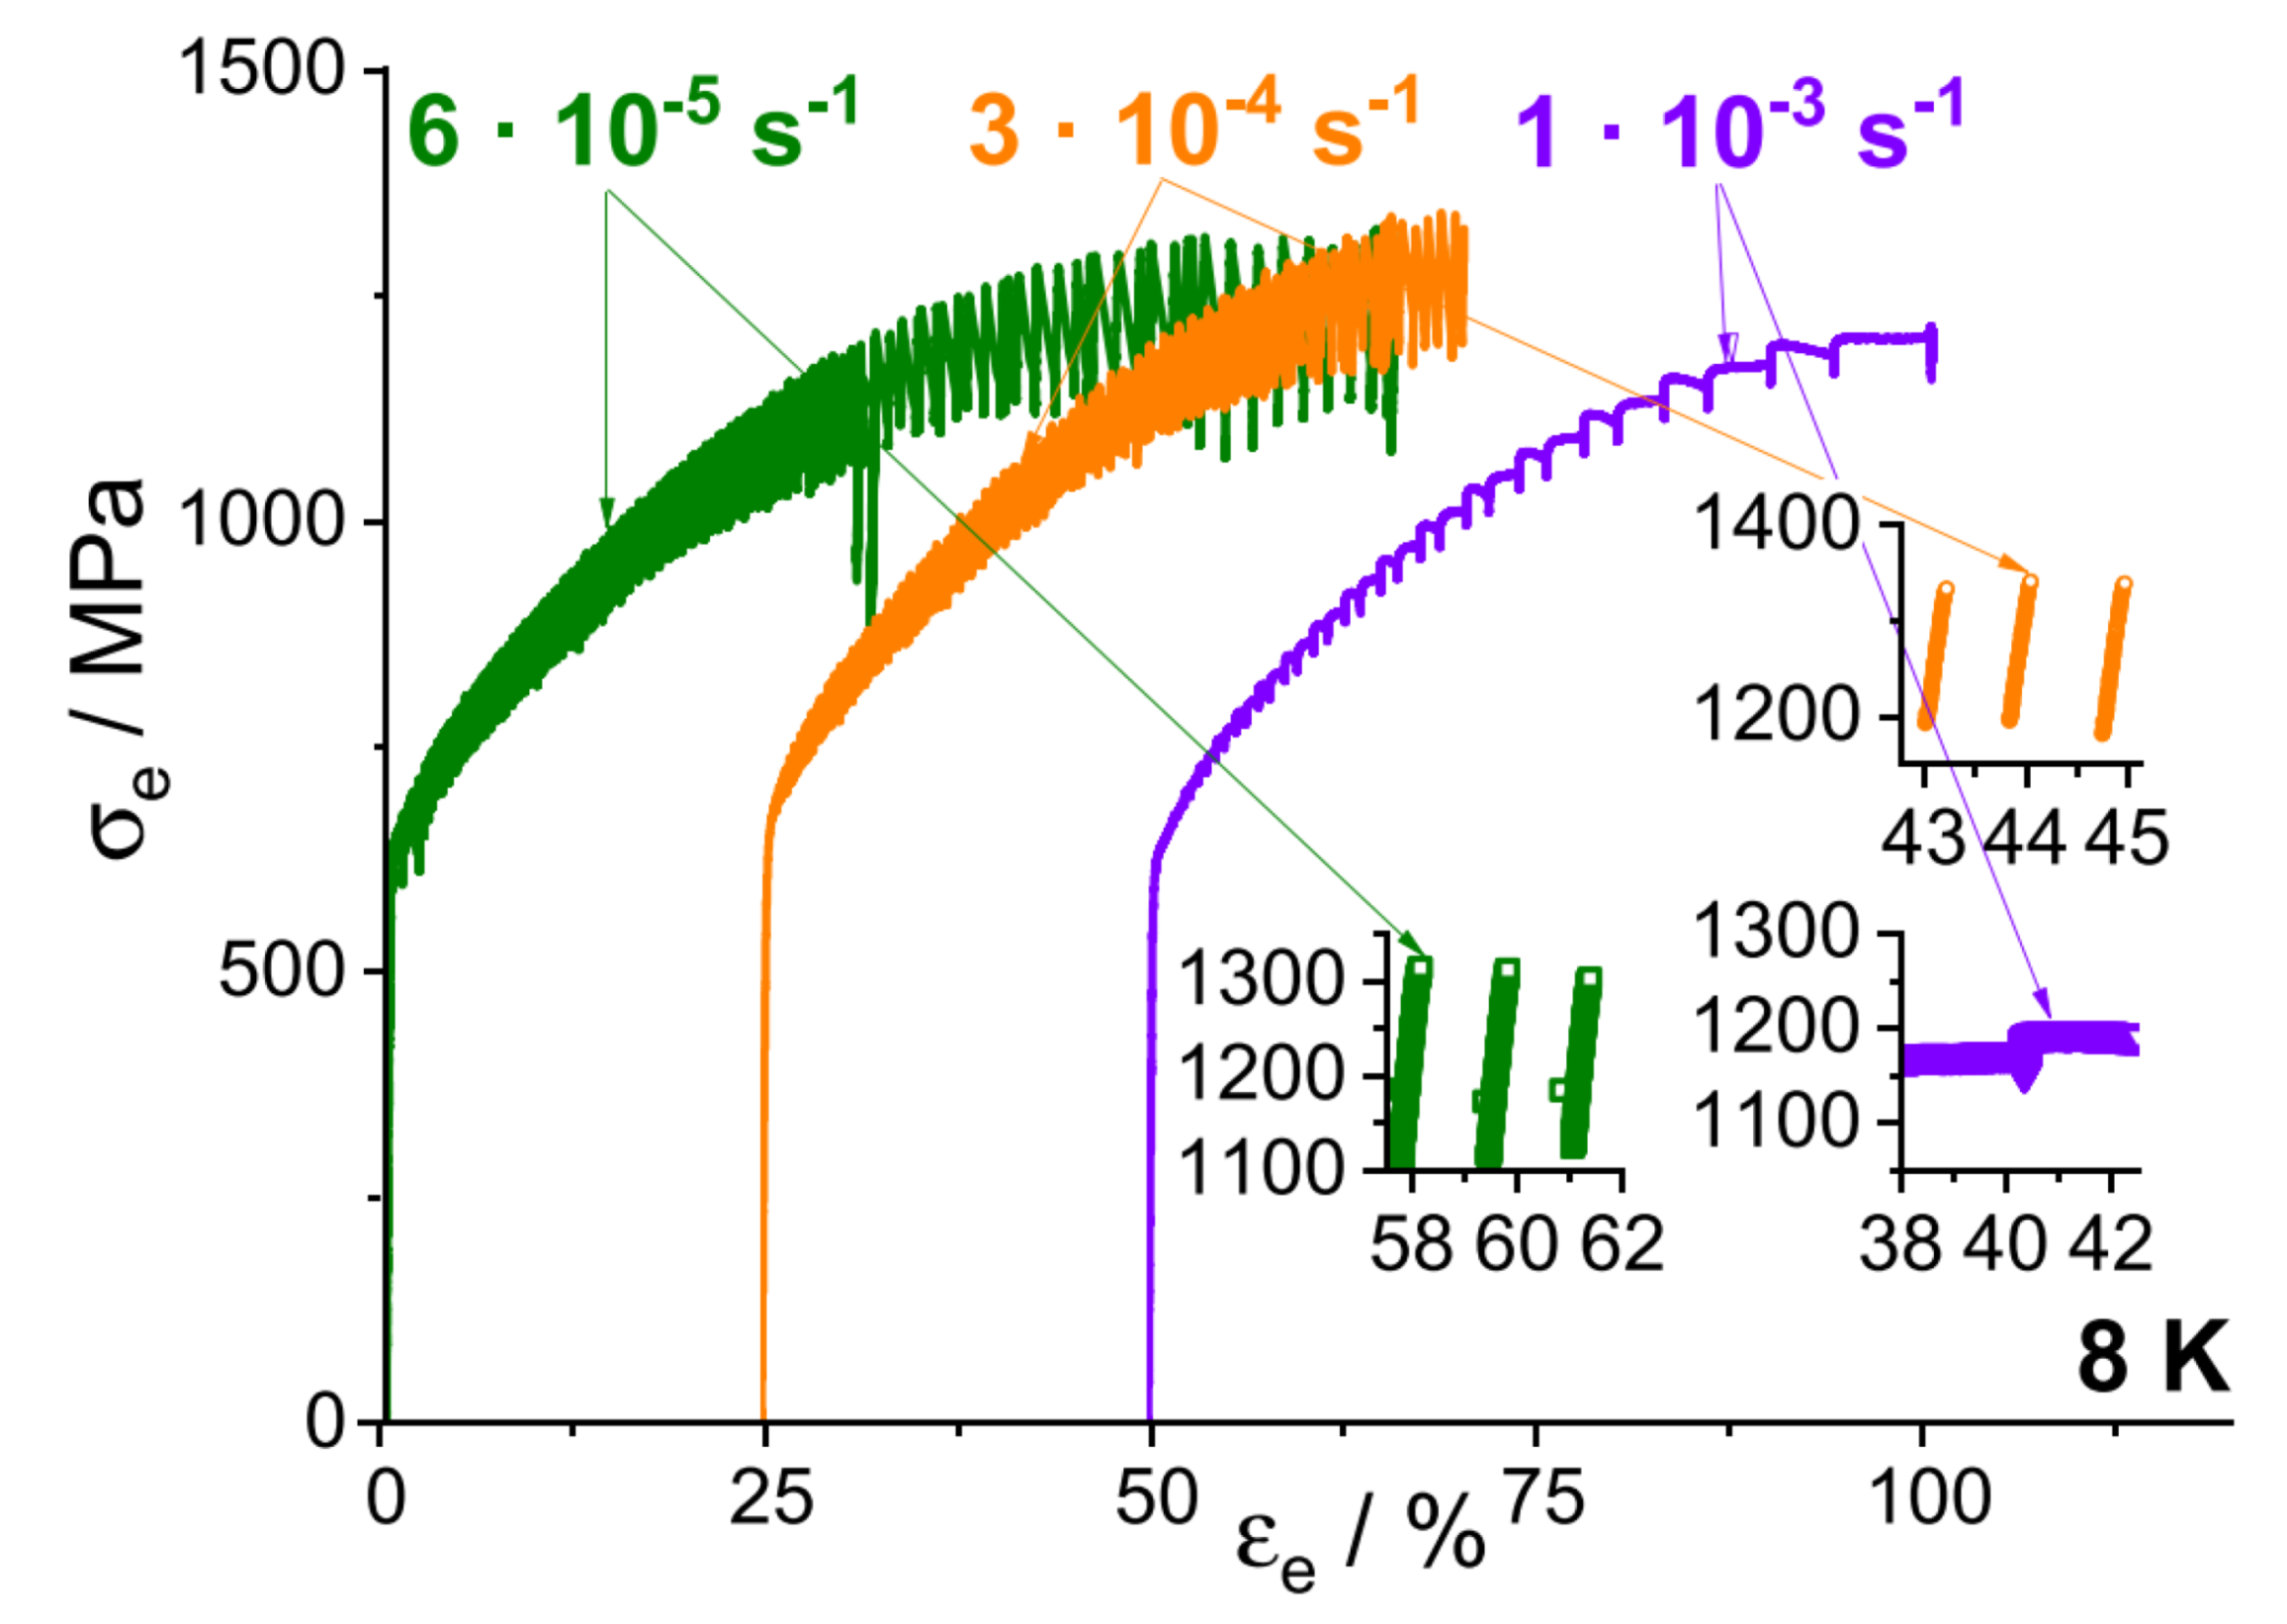
  • For strain rates less than 1 s−1, the extent of serrations in HEAs increases with decreasing strain rate. This increase is due to the slowing down of dislocations, thus allowing solute atoms to more easily catch and pin dislocations.
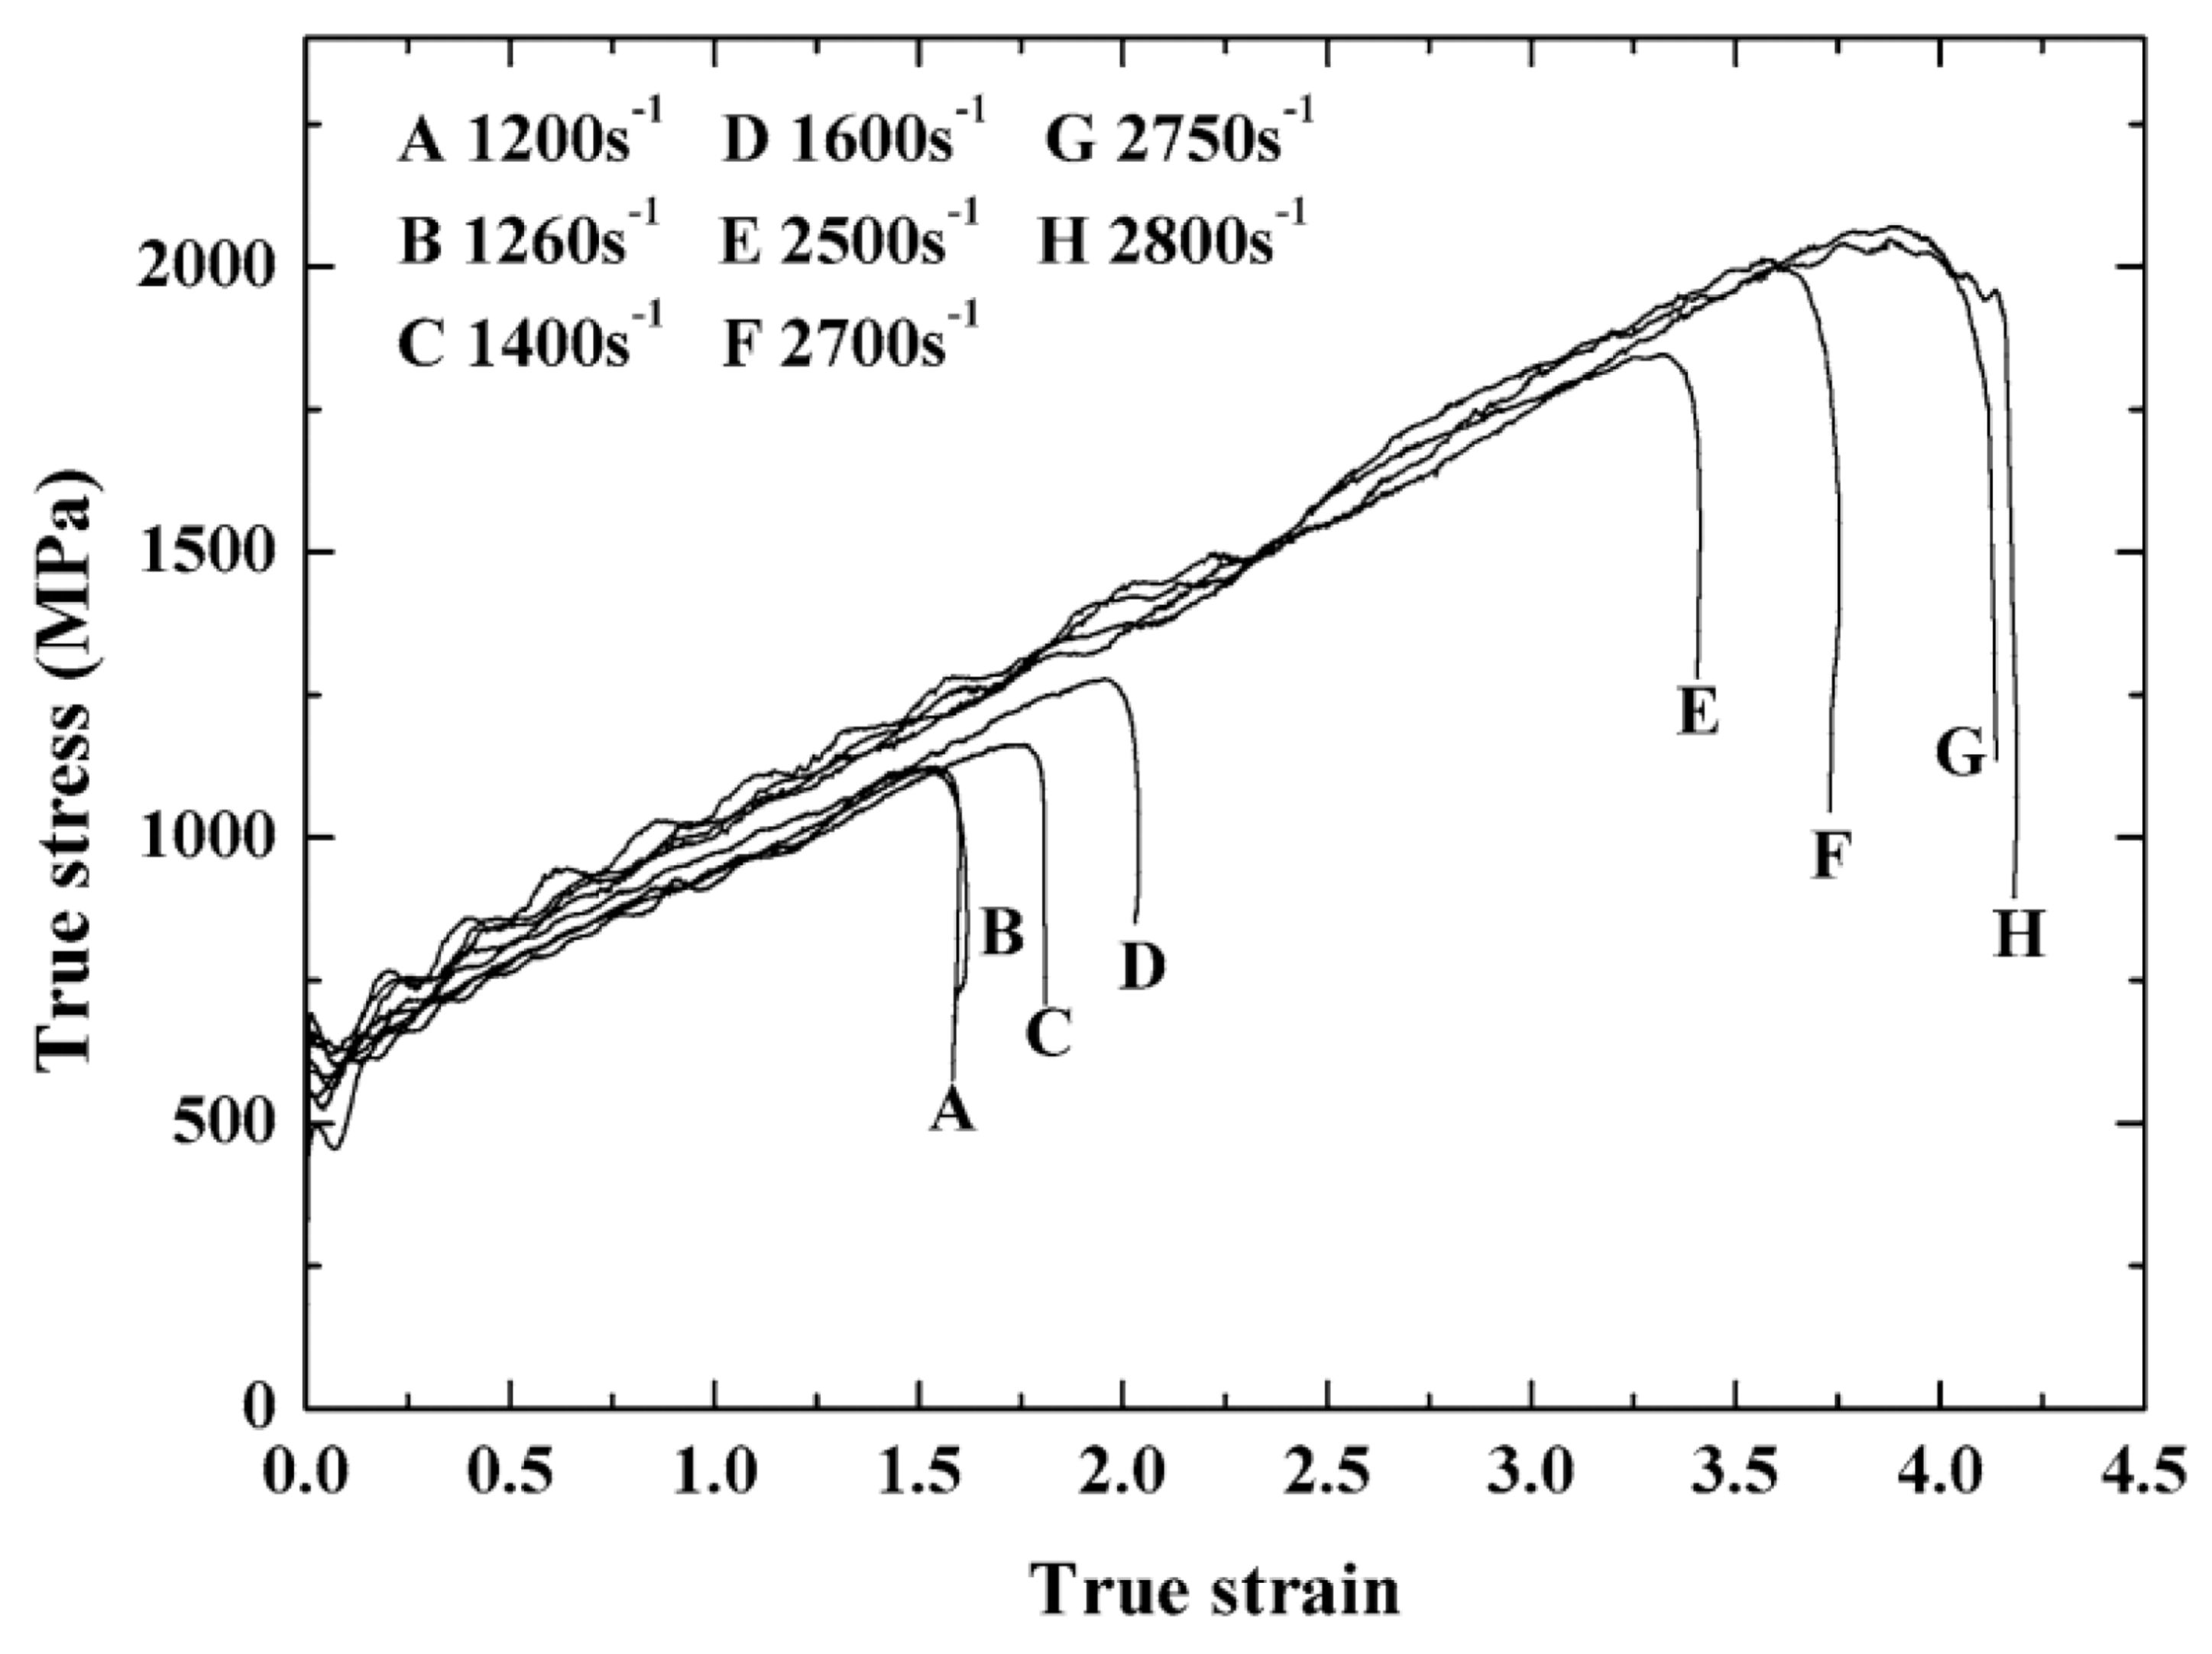
  • For strain rates greater than 103 s−1, the extent of serrations increases with an increase strain rate due to the increase in twinning mechanisms.
  • Multiple techniques, including complexity analysis, multifractal analysis, mean-field theory analysis, and chaos analysis, have been successfully employed to analyze and model the serrated flow behavior in HEAs.
Although much has been accomplished regarding the study of the serrated flow phenomena in HEAs, there is still considerable work to be done. Future work could investigate phenomena such as the effects of irradiation displacement damage on the deformation behavior of HEAs. Currently, there are not many investigations that have thoroughly examined how particle irradiation affects the serration behavior in HEAs. One example of such future studies could examine how neutron irradiation and thermal annealing influence the serrated flow in HEAs during either tension or compression. This study would be significant, since it would explore how irradiation-induced changes in the microstructure, such as the introduction of dislocation loops or precipitates into the matrix during particle bombardment, could affect the serrated-flow dynamics. Another important experiment could involve the micropillar compression or nanoindentation testing of samples irradiated by ions at a variety of temperatures and irradiation doses. Here, the avalanche statistics of the as-cast and irradiated specimens could be modeled and analyzed according to the MFT formalism for different compression rates or irradiation conditions. It is expected that such studies would provide the substantial insight into the effects of irradiation on the plastic-deformation behavior of HEAs.
Future investigations could also involve a more comprehensive study on the effects of additives, such as C and Al, as well as the presence of nanoparticles, on the serrated flow in HEAs. For these studies, the effects of additive concentration on the serration behavior in a wide array of HEAs would be investigated. Importantly, these studies would examine how the concentration of impurities would affect such factors as the temperature range or strain rate at which serrations would occur. Furthermore, perhaps it will be determined whether there exists a minimum required concentration for the serrated flow to occur. Machine-learning methods could also be employed to elucidate the relationship among the additive concentration, microstructure (such as dislocation dynamics), and serrated-flow behavior [306,307,308,309,310]. Consequently, a greater understanding of solute atom-dislocation pinning dynamics in HEAs would be achieved.
Additionally, more work is needed to better examine the twinning-induced serration phenomena in HEAs. These experiments could involve mechanically testing (compression and/or tension) HEA specimens at temperatures ranging from cryogenic to elevated temperatures and strain rates of greater than 103 s−1. It would also be important to examine whether there is a minimum temperature or maximum strain rate at which the serrations would occur. For these experiments, the microstructure could be characterized by using techniques such as TEM and EBSD, while the serrated flow behavior could be analyzed and modeled by using different analytical techniques. The results of such experiments would provide fundamental insight on the relation between twinning and the serration behavior in HEAs.
Finally, there should be more studies that would model and analyze the serrated-flow behavior in HEAs (during tension and compression), using alternative methods, such as the complexity-analysis, multifractal-analysis, and the chaos-analysis techniques. Moreover, theoretical models covering a wide range of scales, including first principles, molecular dynamics, dislocation dynamics, finite-element methods, and crystal plasticity, could be used to quantify, predict, and simulate the effects of composition, temperature, strain rate, additive, irradiation, and environment on serrated flows of HEAs. The results of these types of analyses and modeling would be paired with advanced microstructural-characterization techniques, such as in situ TEM, XRD, and neutron diffraction. The combination of the microstructural and analytical/modeling results would likely yield unexpected and illuminating findings regarding the link between the microstructural behavior and the dynamics of plastic deformation during the serrated flow.

5. Conclusions

In this review, a clear summary of the serrated flow phenomenon, as it occurs in HEAs, was provided. Importantly, this review includes several key findings as revealed by the literature. For instance, additives, such as C and Al, can lead to the occurrence of the serrated flows in HEAs. In terms of the microstructure, serrations typically occur due to either twinning mechanisms (at cryogenic temperatures) or dislocation pinning by solute atoms at temperatures of RT and above. Interestingly, such behavior is not typically seen in conventional crystalline alloys. It has also been found that the serrated flow is significantly affected by experimental conditions, such as the strain rate and test temperature. In HEAs, several different serration types have been observed, including A, B, C, or combinations of serrations, such as A + B and B + C. It is interesting to note that the serration Type-A + Type-C, Type-D, and Type-E has not been reported to occur in this alloy system. Several different types of analytical methods, including the mean-field theory formalism and the complexity-analysis technique, have been successfully applied to examine the serrated flow in HEAs. The results of the analyses indicated that the serrated flow in HEAs consist of complex dynamical behavior. For example, serrations have exhibited chaotic fluctuations that were attributed to a phase transformation (FCC to HCP phases) at cryogenic temperatures. Lastly, further exploratory work is needed to gain a more fundamental perspective on the serrated-flow phenomenon in HEAs. Some areas in need of additional or more comprehensive research to analyze the serrated flow in HEAs have been identified as the analysis of irradiation effects, additives, such as C and Al, the presence of nanoparticles, twinning, and the use of alternate experimental methods, such as in situ TEM.

Author Contributions

Conceptualization, J.B. and S.C.; investigation, J.B., X.X., D.H., B.S., and C.L.; methodology, J.B., X.X., and C.F.; project administration, P.K.L.; supervision, J.B. and P.K.L.; validation, Y.S., A.M.C., and R.F.; resources, J.B.; writing—original draft, all authors; review and editing, C.F., E.I., F.G.M., P.D., R.J.S., and H.S. All authors have read and agreed to the published version of the manuscript.

Funding

S.C., C.L., R.F., X.X., and P.K.L. very much appreciate the supports of (1) the US National Science Foundation (DMR1611180 and 1809640) and (2) the US Army Research Office (W911NF-13-1-0438 and W911NF-19-2-0049), with J. Yang, G. Shiflet, D. Farkas, M. P. Bakas, D. M. Stepp, and S. Mathaudhu as program managers.

Conflicts of Interest

The authors declare no conflict of interest.

References

  1. Yeh, J.W.; Chen, S.K.; Gan, J.Y.; Lin, S.J.; Chin, T.S.; Shun, T.T.; Tsau, C.H.; Chang, S.Y. Formation of simple crystal structures in Cu-Co-Ni-Cr-Al-Fe-Ti-V alloys with multiprincipal metallic elements. Metall. Mater. Trans. A Phys. Metall. Mater. Sci. 2004, 35, 2533–2536. [Google Scholar] [CrossRef]
  2. Yeh, J.W.; Chen, S.K.; Lin, S.J.; Gan, J.Y.; Chin, T.S.; Shun, T.T.; Tsau, C.H.; Chang, S.Y. Nanostructured high-entropy alloys with multiple principal elements: Novel alloy design concepts and outcomes. Adv. Eng. Mater. 2004, 6, 299–303. [Google Scholar] [CrossRef]
  3. Chen, T.K.; Shun, T.T.; Yeh, J.W.; Wong, M.S. Nanostructured nitride films of multi-element high-entropy alloys by reactive DC sputtering. Surf. Coat. Technol. 2004, 188–189, 193–200. [Google Scholar] [CrossRef]
  4. Hsu, C.-Y.; Yeh, J.-W.; Chen, S.-K.; Shun, T.-T. Wear resistance and high-temperature compression strength of Fcc CuCoNiCrAl0.5Fe alloy with boron addition. Metall. Mater. Trans. A 2004, 35, 1465–1469. [Google Scholar] [CrossRef]
  5. Huang, P.-K.; Yeh, J.-W.; Shun, T.-T.; Chen, S.-K. Multi-principal-element alloys with improved oxidation and wear resistance for thermal spray coating. Adv. Eng. Mater. 2004, 6, 74–78. [Google Scholar] [CrossRef]
  6. Miracle, D.B. High-entropy alloys: A current evaluation of founding ideas and core effects and exploring “nonlinear alloys”. JOM 2017, 69, 2130–2136. [Google Scholar] [CrossRef] [Green Version]
  7. Hsu, C.Y.; Wang, W.R.; Tang, W.Y.; Chen, S.K.; Yeh, J.W. Microstructure and mechanical properties of new AlCoxCrFeMo0.5Ni high-entropy alloys. Adv. Eng. Mater. 2010, 12, 44–49. [Google Scholar] [CrossRef]
  8. Zhang, Y.; Liu, J.P.; Chen, S.Y.; Xie, X.; Liaw, P.K.; Dahmen, K.A.; Qiao, J.W.; Wang, Y.L. Serration and noise behaviors in materials. Prog. Mater. Sci. 2017, 90, 358–460. [Google Scholar] [CrossRef]
  9. Zhang, Y.; Zuo, T.T.; Tang, Z.; Gao, M.C.; Dahmen, K.A.; Liaw, P.K.; Lua, Z.P. Microstructures and properties of high-entropy alloys. Prog. Mater. Sci. 2014, 61, 1–93. [Google Scholar] [CrossRef]
  10. Cantor, B.; Chang, I.T.H.; Knight, P.; Vincent, A.J.B. Microstructural development in equiatomic multicomponent alloys. Mater. Sci. Eng. A Struct. Mater. Prop. Microstruct. Process. 2004, 375, 213–218. [Google Scholar] [CrossRef]
  11. Gao, M.C.; Carney, C.S.; Doğan, Ö.N.; Jablonksi, P.D.; Hawk, J.A.; Alman, D.E. Design of refractory high-entropy alloys. JOM 2015, 67, 2653–2669. [Google Scholar] [CrossRef]
  12. Haas, S.; Mosbacher, M.; Senkov, O.N.; Feuerbacher, M.; Freudenberger, J.; Gezgin, S.; Völkl, R.; Glatzel, U. Entropy determination of single-phase high entropy alloys with different crystal structures over a wide temperature range. Entropy 2018, 20, 654. [Google Scholar] [CrossRef] [Green Version]
  13. Yeh, J.-W. Alloy design strategies and future trends in high-entropy alloys. JOM 2013, 65, 1759–1771. [Google Scholar] [CrossRef]
  14. Eißmann, N.; Klöden, B.; Weißgärber, T.; Kieback, B. High-entropy alloy CoCrFeMnNi produced by powder metallurgy. Powder Metall. 2017, 60, 184–197. [Google Scholar] [CrossRef]
  15. Ruiz-Yi, B.; Bunn, J.K.; Stasak, D.; Mehta, A.; Besser, M.; Kramer, M.J.; Takeuchi, I.; Hattrick-Simpers, J. The different roles of entropy and solubility in high entropy alloy stability. ACS Comb. Sci. 2016, 18, 596–603. [Google Scholar] [CrossRef]
  16. Cantor, B. Multicomponent and high entropy alloys. Entropy 2014, 16, 4749–4768. [Google Scholar] [CrossRef] [Green Version]
  17. Lee, C.; Song, G.; Gao, M.C.; Feng, R.; Chen, P.; Brechtl, J.; Chen, Y.; An, K.; Guo, W.; Poplawsky, J.D.; et al. Lattice distortion in a strong and ductile refractory high-entropy alloy. Acta Mater. 2018, 160, 158–172. [Google Scholar] [CrossRef]
  18. Miracle, D.B.; Senkov, O.N. A critical review of high entropy alloys and related concepts. Acta Mater. 2017, 122, 448–511. [Google Scholar] [CrossRef] [Green Version]
  19. Tsai, K.Y.; Tsai, M.H.; Yeh, J.W. Sluggish diffusion in Co-Cr-Fe-Mn-Ni high-entropy alloys. Acta Mater. 2013, 61, 4887–4897. [Google Scholar] [CrossRef]
  20. Tsai, M.-H.; Wang, C.-W.; Tsai, C.-W.; Shen, W.-J.; Yeh, J.-W.; Gan, J.-Y.; Wu, W.-W. Thermal stability and performance of NbSiTaTiZr high-entropy alloy barrier for copper metallization. J. Electrochem. Soc. 2011, 158, H1161. [Google Scholar] [CrossRef]
  21. Hsu, C.-Y.; Juan, C.-C.; Wang, W.-R.; Sheu, T.-S.; Yeh, J.-W.; Chen, S.-K. On the superior hot hardness and softening resistance of AlCoCrxFeMo0.5Ni high-entropy alloys. Mater. Sci. Eng. A 2011, 528, 3581–3588. [Google Scholar] [CrossRef]
  22. Paul, A. Comments on “Sluggish diffusion in Co-Cr-Fe-Mn-Ni high-entropy alloys” by KY Tsai, MH Tsai and JW Yeh, Acta Materialia 61 (2013) 4887–4897. Scr. Mater. 2017, 135, 153–157. [Google Scholar] [CrossRef]
  23. Tsai, K.Y.; Tsai, M.H.; Yeh, J.W. Reply to comments on “Sluggish diffusion in Co-Cr-Fe-Mn-Ni high-entropy alloys” by KY Tsai, MH Tsai and JW Yeh, Acta Materialia 61 (2013) 4887–4897. Scr. Mater. 2017, 135, 158–159. [Google Scholar] [CrossRef]
  24. Beke, D.L.; Erdélyi, G. On the diffusion in high-entropy alloys. Mater. Lett. 2016, 164, 111–113. [Google Scholar] [CrossRef]
  25. Zhang, C.; Zhang, F.; Jin, K.; Bei, H.B.; Chen, S.L.; Cao, W.S.; Zhu, J.; Lv, D.C. Understanding of the elemental diffusion behavior in concentrated solid solution alloys. J. Phase Equilibria Diffus. 2017, 38, 434–444. [Google Scholar] [CrossRef] [Green Version]
  26. Pickering, E.J.; Jones, N.G. High-entropy alloys: A critical assessment of their founding principles and future prospects. Int. Mater. Rev. 2016, 61, 183–202. [Google Scholar] [CrossRef] [Green Version]
  27. Murty, B.S.; Yeh, J.W.; Ranganathan, S.; Bhattacharjee, P.P. High-Entropy Alloys; Elsevier Science: Amsterdam, The Netherlands, 2019. [Google Scholar]
  28. Yeh, J.-W. Physical metallurgy of high-entropy alloys. JOM 2015, 67, 2254–2261. [Google Scholar] [CrossRef]
  29. Zhang, Y.; Zuo, T.; Cheng, Y.; Liaw, P.K. High-entropy alloys with high saturation magnetization, electrical resistivity and malleability. Sci. Rep. 2013, 3, 1455. [Google Scholar] [CrossRef] [Green Version]
  30. Chou, Y.L.; Wang, Y.C.; Yeh, J.W.; Shih, H.C. The effect of molybdenum on the corrosion behaviour of the high-entropy alloys Co1.5CrFeNi1.5Ti0.5Mox in aqueous environments. Corros. Sci. 2010, 52, 1026–1034. [Google Scholar] [CrossRef]
  31. Kao, Y.F.; Lee, T.D.; Chen, S.K.; Chang, Y.S. Electrochemical passive properties of AlxCoCrFeNi (x = 0, 0.25, 0.50, 1.00) alloys in sulfuric acids. Corros. Sci. 2017, 52, 1026–1034. [Google Scholar] [CrossRef]
  32. Shi, Y.; Yang, B.; Xie, X.; Brechtl, J.; Dahmen, K.A.; Liaw, P.K. Corrosion of AlxCoCrFeNi high-entropy alloys: Al-content and potential scan-rate dependent pitting behavior. Corros. Sci. 2017, 119, 33–45. [Google Scholar] [CrossRef]
  33. Tang, Z.; Huang, L.; He, W.; Liaw, P.K. Alloying and processing effects on the aqueous corrosion behavior of high-entropy alloys. Entropy 2014, 16, 895–911. [Google Scholar] [CrossRef]
  34. Nair, R.B.; Arora, H.S.; Mukherjee, S.; Singh, S.; Singh, H.; Grewel, H.S. Exceptionally high cavitation erosion and corrosion resistance of a high entropy alloy. Ultrason. Sonochem. 2018, 41, 252–260. [Google Scholar] [CrossRef]
  35. Shi, Y.Z.; Yang, B.; Liaw, P.K. Corrosion-resistant high-entropy alloys: A review. Metals 2017, 7, 43. [Google Scholar] [CrossRef] [Green Version]
  36. Hemphill, M.A.; Yuan, T.; Wang, G.Y.; Yeh, J.W.; Tsai, C.W.; Chuang, A.; Liaw, P.K. Fatigue behavior of Al0.5CoCrCuFeNi high entropy alloys. Acta Mater. 2012, 60, 5723–5734. [Google Scholar] [CrossRef]
  37. Seifi, M.; Li, D.Y.; Yong, Z.; Liaw, P.K.; Lewandowski, J.J. Fracture toughness and fatigue crack growth behavior of as-cast high-entropy alloys. JOM 2015, 67, 2288–2295. [Google Scholar] [CrossRef]
  38. Thurston, K.V.S.; Gludovatz, B.; Hohenwarter, A.; Laplanche, G.; George, E.P.; Ritchie, R.O. Effect of temperature on the fatigue-crack growth behavior of the high-entropy alloy CrMnFeCoNi. Intermetallics 2017, 88, 65–72. [Google Scholar] [CrossRef]
  39. Tang, Z.; Yuan, T.; Tsai, C.W.; Yeh, J.W.; Lundin, C.D.; Liaw, P.K. Fatigue behavior of a wrought Al0.5CoCrCuFeNi two-phase high-entropy alloy. Acta Mater. 2015, 99, 247–258. [Google Scholar] [CrossRef]
  40. Chen, P.Y.; Lee, C.; Wang, S.Y.; Seifi, M.; Lewandowski, J.J.; Dahmen, K.A.; Jia, H.L.; Xie, X.; Chen, B.L.; Yeh, J.W.; et al. Fatigue behavior of high-entropy alloys: A review. Sci. China Technol. Sci. 2018, 61, 168–178. [Google Scholar] [CrossRef]
  41. Liu, K.M.; Komarasamy, M.; Gwalani, B.; Shukla, S.; Mishra, R.S. Fatigue behavior of ultrafine grained triplex Al0.3CoCrFeNi high entropy alloy. Scr. Mater. 2019, 158, 116–120. [Google Scholar] [CrossRef]
  42. Gao, X.; Lu, Y.; Zhang, B.; Liang, N.; Wu, G.; Sha, G.; Liu, J.; Zhao, Y. Microstructural origins of high strength and high ductility in an AlCoCrFeNi2.1 eutectic high-entropy alloy. Acta Mater. 2017, 141, 59–66. [Google Scholar] [CrossRef]
  43. Koch, C.C. Nanocrystalline high-entropy alloys. J. Mater. Res. 2017, 32, 3435–3444. [Google Scholar] [CrossRef] [Green Version]
  44. Lilensten, L.; Couzinie, J.-P.; Perriere, L.; Hocini, A.; Keller, C.; Dirras, G.; Guillot, I. Study of a BCC multi-principal element alloy: Tensile and simple shear properties and underlying deformation mechanisms. Acta Mater. 2018, 142, 131–141. [Google Scholar] [CrossRef]
  45. Cai, B.; Liu, B.; Kabra, S.; Wang, Y.; Yan, K.; Lee, P.K.; Liu, Y. Deformation mechanisms of Mo alloyed FeCoCrNi high entropy alloy: In situ neutron diffraction. Acta Mater. 2017, 127, 471–480. [Google Scholar] [CrossRef] [Green Version]
  46. Gludovatz, B.; Hohenwarter, A.; Catoor, D.; Chang, E.H.; George, E.P.; Ritchie, R.O. A fracture-resistant high-entropy alloy for cryogenic applications. Science 2014, 345, 1153–1158. [Google Scholar] [CrossRef] [Green Version]
  47. George, E.P.; Raabe, D.; Ritchie, R.O. High-entropy alloys. Nat. Rev. Mater. 2019, 4, 515–534. [Google Scholar] [CrossRef]
  48. Li, Z.; Zhao, S.; Diao, H.; Liaw, P.K.; Meyers, M.A. High-velocity deformation of Al0.3CoCrFeNi high-entropy alloy: Remarkable resistance to shear failure. Sci. Rep. 2017, 7, 42742. [Google Scholar] [CrossRef]
  49. Egami, T.; Guo, W.; Rack, P.D.; Nagase, T. Irradiation resistance of multicomponent alloys. Metall. Mater. Trans. A 2014, 45A, 180–183. [Google Scholar] [CrossRef]
  50. Xia, S.Q.; Yang, X.; Yang, T.F.; Liu, S.; Zhang, Y. Irradiation resistance in AlxCoCrFeNi high entropy alloys. JOM 2015, 67, 2340–2344. [Google Scholar] [CrossRef]
  51. Xia, S.; Gao, M.C.; Yang, T.; Liaw, P.K.; Zhang, Y. Phase stability and microstructures of high entropy alloys ion irradiated to high doses. J. Nucl. Mater. 2016, 480, 100–108. [Google Scholar] [CrossRef] [Green Version]
  52. Kumar, N.A.P.K.; Li, C.; Leonard, K.J.; Bei, H.; Zinkle, S.J. Microstructural stability and mechanical behavior of FeNiMnCr high entropy alloy under ion irradiation. Acta Mater. 2016, 113, 230–244. [Google Scholar] [CrossRef] [Green Version]
  53. Yang, T.; Xia, S.; Liu, S.; Wang, C.; Liu, S.; Fang, Y.; Zhang, Y.; Xue, J.; Yan, S.; Wang, Y. Precipitation behavior of AlxCoCrFeNi high entropy alloys under ion irradiation. Sci. Rep. 2016, 6, 32146. [Google Scholar] [CrossRef] [PubMed]
  54. Xia, S.-Q.; Wang, Z.; Yang, T.-F.; Zhang, Y. Irradiation behavior in high entropy alloys. J. Iron Steel Res. 2015, 22, 879–884. [Google Scholar] [CrossRef]
  55. He, M.-R.; Wang, S.; Jin, K.; Bei, H.; Yasuda, K.; Matsumura, S.; Higashida, K.; Robertson, I.M. Enhanced damage resistance and novel defect structure of CrFeCoNi under in situ electron irradiation. Scr. Mater. 2016, 125, 5–9. [Google Scholar] [CrossRef] [Green Version]
  56. Yang, T.; Xia, S.; Guo, W.; Hu, R.; Poplawsky, J.D.; Sha, G.; Fang, Y.; Yan, Z.; Wang, C.; Li, C.; et al. Effects of temperature on the irradiation responses of Al0.1CoCrFeNi high entropy alloy. Scr. Mater. 2018, 144, 31–35. [Google Scholar] [CrossRef]
  57. Zhang, Y.; Stocks, G.M.; Jin, K.; Lu, C.; Bei, H.; Sales, B.C.; Wang, L.; Béland, L.K.; Stoller, R.E.; Samolyuk, G.D.; et al. Influence of chemical disorder on energy dissipation and defect evolution in concentrated solid solution alloys. Nat. Commun. 2015, 6, 8736. [Google Scholar] [CrossRef] [Green Version]
  58. Yang, T.; Li, C.; Zinkle, S.J.; Zhao, S.; Bei, H.; Zhang, Y. Irradiation responses and defect behavior of single-phase concentrated solid solution alloys. J. Mater. Res. 2018, 33, 3077–3091. [Google Scholar] [CrossRef] [Green Version]
  59. Ching, W.-Y.; San, S.; Brechtl, J.; Sakidja, R.; Zhang, M.; Liaw, P.K. Fundamental electronic structure and multiatomic bonding in 13 biocompatible high-entropy alloys. NPJ Comput. Mater. 2020, 6, 45. [Google Scholar] [CrossRef]
  60. Todai, M.; Nagase, T.; Hori, T.; Matsugaki, A.; Sekita, A.; Nakano, T. Novel TiNbTaZrMo high-entropy alloys for metallic biomaterials. Scr. Mater. 2017, 129, 65–68. [Google Scholar] [CrossRef] [Green Version]
  61. Yang, W.; Liu, Y.; Pang, S.; Liaw, P.K.; Zhang, T. Bio-corrosion behavior and in vitro biocompatibility of equimolar TiZrHfNbTa high-entropy alloy. Intermetallics 2020, 124, 106845. [Google Scholar] [CrossRef]
  62. Jo, Y.H.; Jung, S.; Choi, W.M.; Sohn, S.S.; Kim, H.S.; Lee, B.J.; Kim, N.J.; Lee, S. Cryogenic strength improvement by utilizing room-temperature deformation twinning in a partially recrystallized VCrMnFeCoNi high-entropy alloy. Nat. Commun. 2017, 8, 15719. [Google Scholar] [CrossRef] [PubMed]
  63. Li, D.; Li, C.X.; Feng, T.; Zhang, Y.D.; Sha, G.; Lewandowski, J.J.; Liaw, P.K.; Zhang, Y. High-entropy Al0.3CoCrFeNi alloy fibers with high tensile strength and ductility at ambient and cryogenic temperatures. Acta Mater. 2017, 123, 285–294. [Google Scholar] [CrossRef] [Green Version]
  64. Qiao, J.W.; Ma, S.G.; Huang, E.W.; Chuang, C.P.; Liaw, P.K.; Zhang, Y. Microstructural characteristics and mechanical behaviors of AlCoCrFeNi high-entropy alloys at ambient and cryogenic temperatures. In Nano-Scale and Amourphous Materials; Wang, R.M., Wu, Y., Wu, X.F., Eds.; Trans Tech Publications Ltd.: Durnten-Zurich, Switzerland, 2011; Volume 688, pp. 419–425. [Google Scholar]
  65. Lyu, Z.; Fan, X.; Lee, C.; Wang, S.-Y.; Feng, R.; Liaw, P.K. Fundamental understanding of mechanical behavior of high-entropy alloys at low temperatures: A review. J. Mater. Res. 2018, 33, 2998–3010. [Google Scholar] [CrossRef] [Green Version]
  66. Chuang, M.-H.; Tsai, M.H.; Wang, W.R.; Lin, S.J.; Yeh, J.W. Microstructure and wear behavior of AlxCo1.5CrFeNi1.5Tiy high-entropy alloys. Acta Mater. 2011, 59, 6308–6317. [Google Scholar] [CrossRef]
  67. Chuang, M.-H.; Tsai, M.-H.; Tsai, C.-W.; Yang, N.-H.; Chang, S.-Y.; Yeh, J.-W.; Chen, S.-K.; Lin, S.-J. Intrinsic surface hardening and precipitation kinetics of Al0.3CrFe1.5MnNi0.5 multi-component alloy. J. Alloys Compd. 2013, 551, 12–18. [Google Scholar] [CrossRef]
  68. Diao, H.Y.; Feng, R.; Dahmen, K.A.; Liaw, P.K. Fundamental deformation behavior in high-entropy alloys: An overview. Curr. Opin. Solid State Mater. Sci. 2017, 21, 252–266. [Google Scholar] [CrossRef]
  69. Stevenson, A.; Waite, M. Concise Oxford English Dictionary: Luxury Edition; OUP Oxford: New York, NY, USA, 2011. [Google Scholar]
  70. Moyer, J.K.; Bemis, W.E. Shark teeth as edged weapons: Serrated teeth of three species of selachians. Zoology 2017, 120, 101–109. [Google Scholar] [CrossRef]
  71. Stefanita, C.G. From Bulk to Nano: The Many Sides of Magnetism; Springer: Berlin/Heidelberg, Germany, 2008. [Google Scholar]
  72. Mascarenas, D.; Lockhart, M.; Lienert, T. Barkhausen noise as an intrinsic fingerprint for ferromagnetic components. Smart Mater. Struct. 2019, 28, 17. [Google Scholar] [CrossRef]
  73. Bohn, F.; Durin, G.; Correa, M.A.; Machado, N.R.; Della Pace, R.D.; Chesman, C.; Sommer, R.L. Playing with universality classes of Barkhausen avalanches. Sci. Rep. 2018, 8, 12. [Google Scholar] [CrossRef] [Green Version]
  74. Travesset, A.; White, R.A.; Dahmen, K.A. Crackling noise, power spectra, and disorder-induced critical scaling. Phys. Rev. B 2002, 66, 11. [Google Scholar] [CrossRef] [Green Version]
  75. Varotsos, P.A.; Sarlis, N.V.; Skordas, E.S.; Lazaridou-Varotsos, M.S. MW9 tohoku earthquake in 2011 in Japan: Precursors uncovered by natural time analysis. Earthq. Sci. 2017, 30, 183–191. [Google Scholar] [CrossRef] [Green Version]
  76. Uhl, J.T.; Pathak, S.; Schorlemmer, D.; Liu, X.; Swindeman, R.; Brinkman, B.A.W.; LeBlanc, M.; Tsekenis, G.; Friedman, N.; Behringer, R.; et al. Universal quake statistics: From compressed nanocrystals to earthquakes. Sci. Rep. 2015, 5, 16493. [Google Scholar] [CrossRef] [PubMed] [Green Version]
  77. Sethna, J.P.; Dahmen, K.A.; Myers, C.R. Crackling noise. Nature 2001, 410, 242–250. [Google Scholar] [CrossRef] [Green Version]
  78. Kurata, M.; Li, X.; Fujita, K.; Yamaguchi, M. Piezoelectric dynamic strain monitoring for detecting local seismic damage in steel buildings. Smart Mater. Struct. 2013, 22, 115002. [Google Scholar] [CrossRef]
  79. Da Silva, A.C.; Maganini, N.D.; de Almeida, E.F. Multifractal analysis of Bitcoin market. Phys. A Stat. Mech. Its Appl. 2018, 512, 954–967. [Google Scholar] [CrossRef]
  80. Ferreira, P. Assessing the relationship between dependence and volume in stock markets: A dynamic analysis. Phys. A Stat. Mech. Its Appl. 2019, 516, 90–97. [Google Scholar] [CrossRef]
  81. Xing, Y.N.; Wang, J. Statistical volatility duration and complexity of financial dynamics on Sierpinski gasket lattice percolation. Phys. A Stat. Mech. Its Appl. 2019, 513, 234–247. [Google Scholar] [CrossRef]
  82. Bashir, U.; Zebende, G.F.; Yu, Y.G.; Hussain, M.; Ali, A.; Abbas, G. Differential market reactions to pre and post Brexit referendum. Phys. A Stat. Mech. Its Appl. 2019, 515, 151–158. [Google Scholar] [CrossRef]
  83. Begusic, S.; Kostanjcar, Z.; Stanley, H.E.; Podobnik, B. Scaling properties of extreme price fluctuations in Bitcoin markets. Phys. A Stat. Mech. Its Appl. 2018, 510, 400–406. [Google Scholar] [CrossRef] [Green Version]
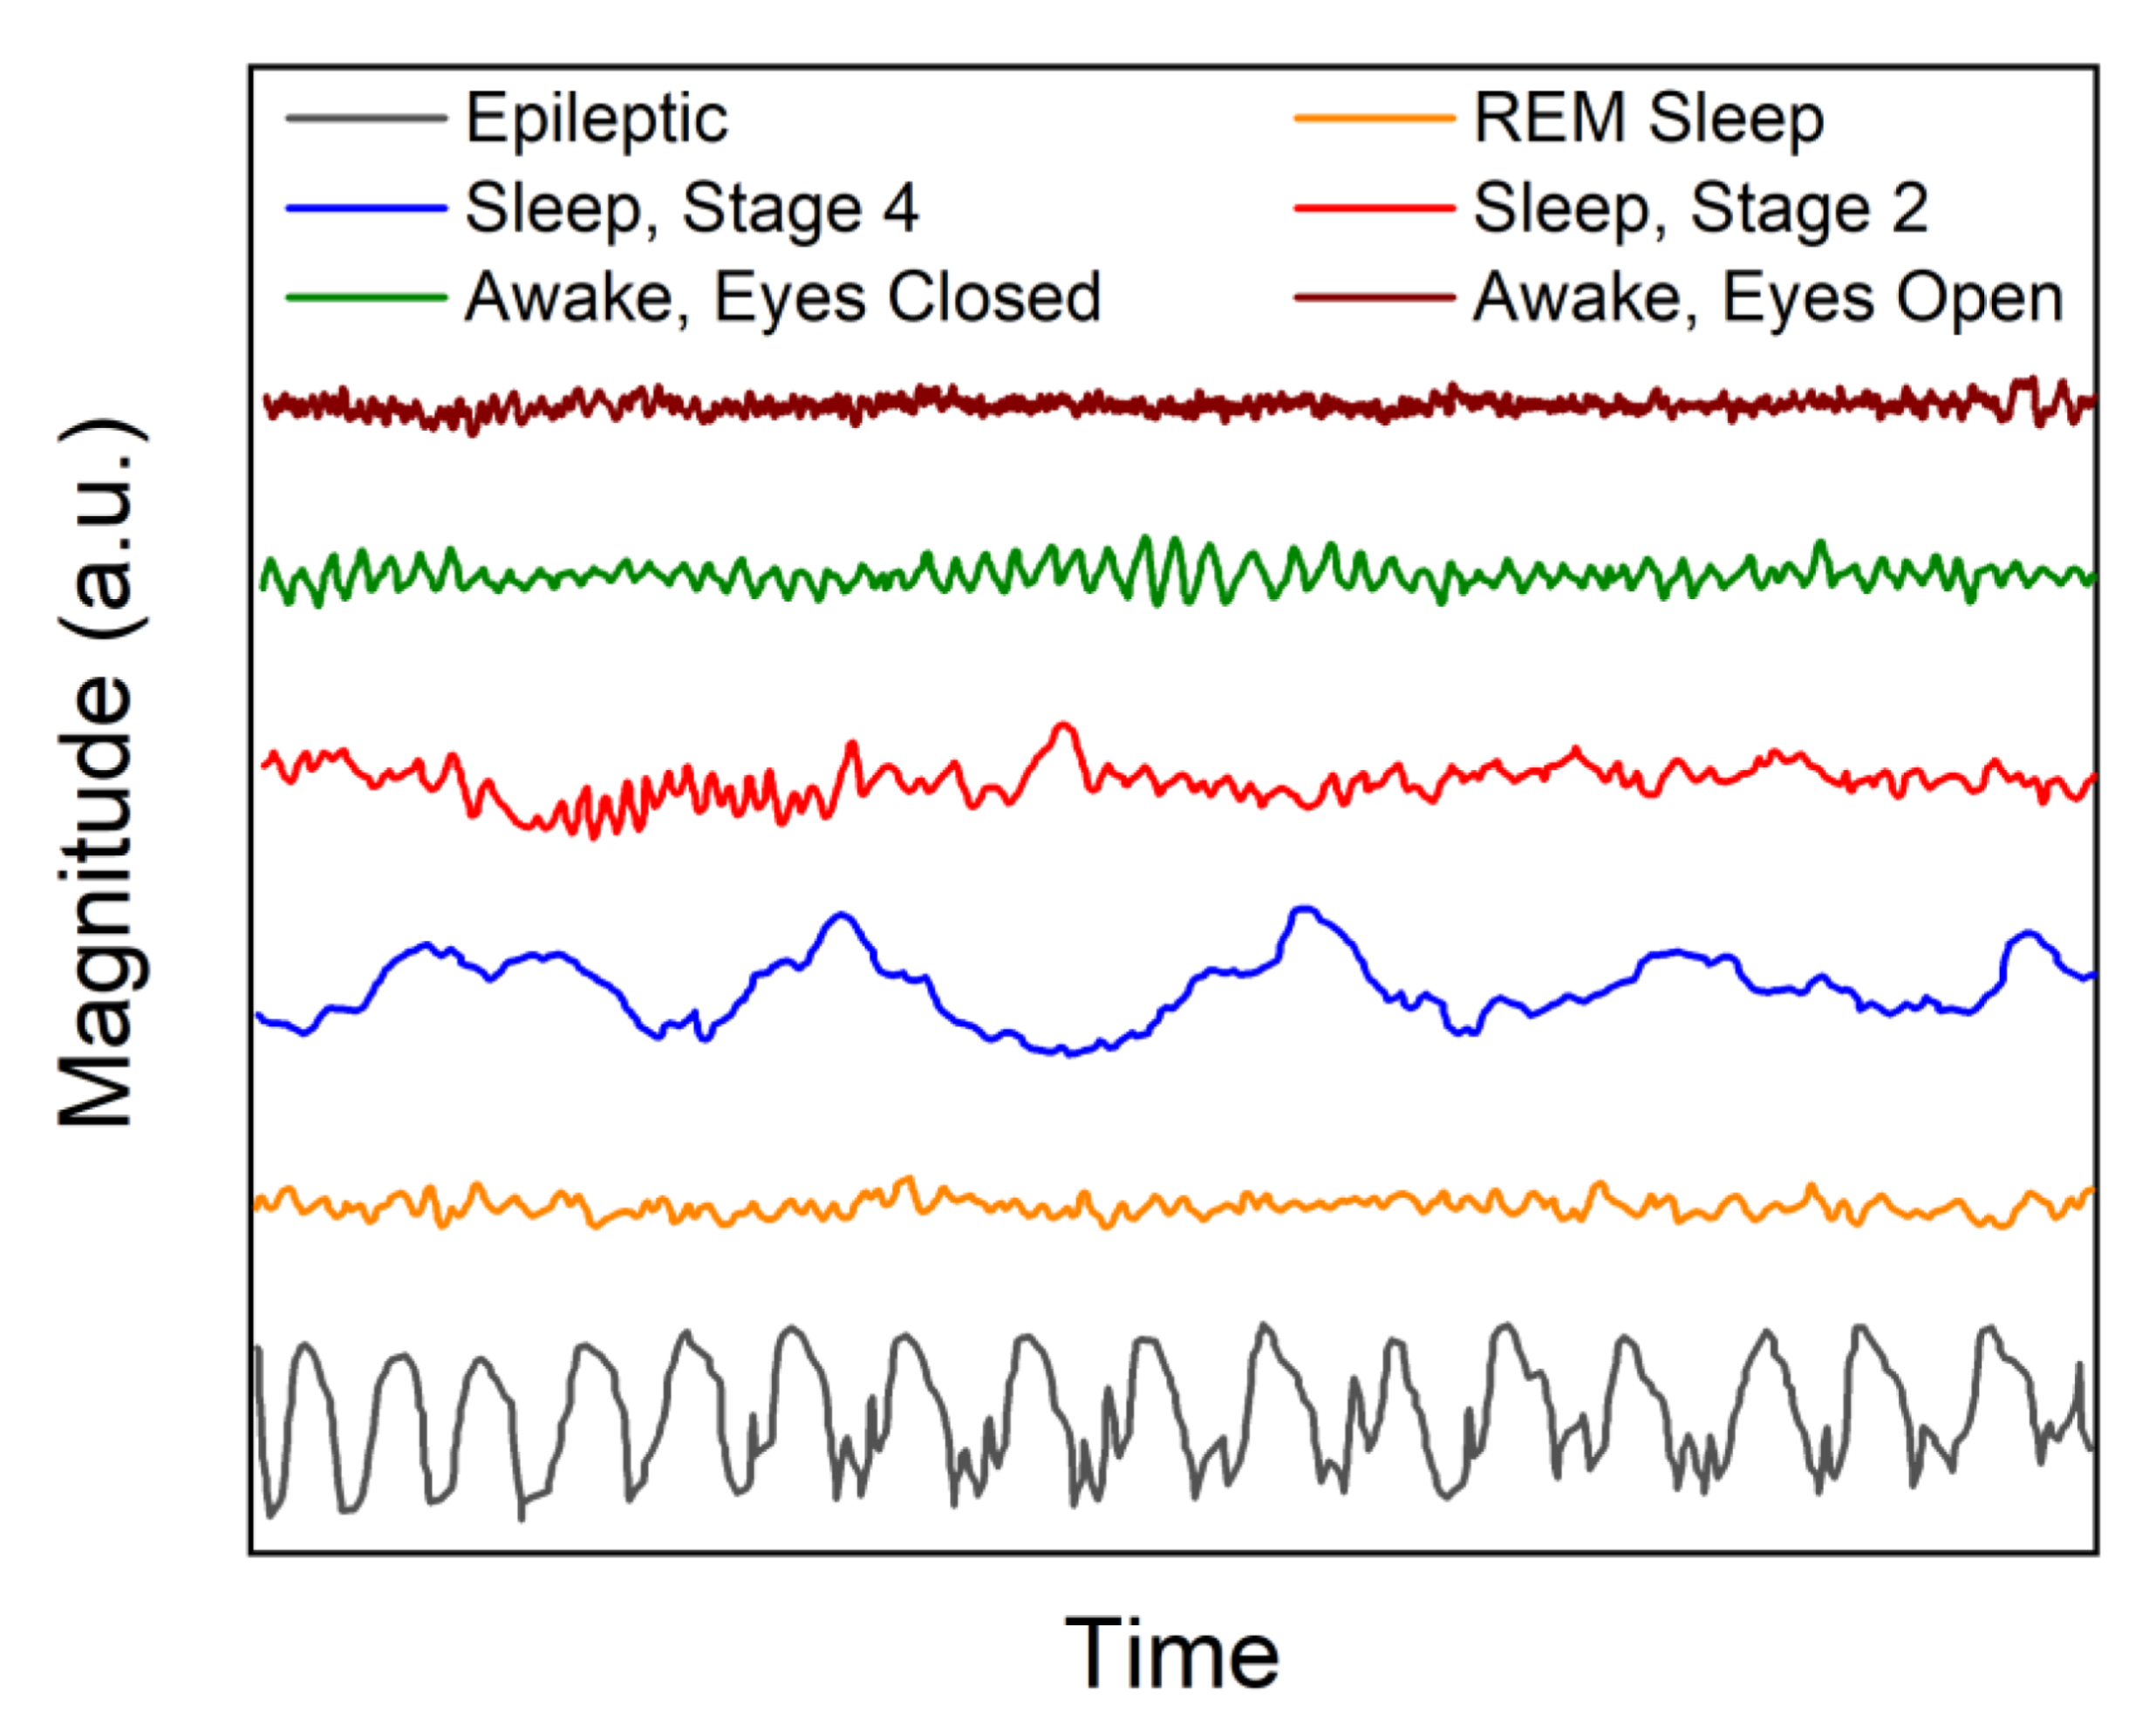
  84. Thiagarajan, T. Interpreting electrical signals from the brain. Acta Phys. Pol. B 2018, 49, 2095–2125. [Google Scholar] [CrossRef]
  85. Scarpetta, S.; Apicella, I.; Minati, L.; de Candia, A. Hysteresis, neural avalanches, and critical behavior near a first-order transition of a spiking neural network. Phys. Rev. E 2018, 97, 13. [Google Scholar] [CrossRef] [PubMed] [Green Version]
  86. Martinello, M.; Hidalgo, J.; Maritan, A.; Di Santo, S.; Plenz, D.; Munoz, M.A. Neutral theory and scale-free neural dynamics. Phys. Rev. X 2017, 7, 11. [Google Scholar] [CrossRef] [Green Version]
  87. Cocchi, L.; Gollo, L.L.; Zalesky, A.; Breakspear, M. Criticality in the brain: A synthesis of neurobiology, models and cognition. Prog. Neurobiol. 2017, 158, 132–152. [Google Scholar] [CrossRef] [PubMed] [Green Version]
  88. Karimipanah, Y.; Ma, Z.Y.; Miller, J.E.K.; Yuste, R.; Wessel, R. Neocortical activity is stimulus- and scale-invariant. PLoS ONE 2017, 12, e0177396. [Google Scholar] [CrossRef]
  89. Bellay, T.; Klaus, A.; Seshadri, S.; Plenz, D. Irregular spiking of pyramidal neurons organizes as scale-invariant neuronal avalanches in the awake state. Elife 2015, 4, 25. [Google Scholar] [CrossRef]
  90. Steriade, M.; McCormick, D.A.; Sejnowski, T.J. Thalamocortical oscillations in the sleeping and aroused brain. Science 1993, 262, 679–685. [Google Scholar] [CrossRef]
  91. Destexhe, A.; Contreras, D. The fine structure of slow-wave sleep oscillations: From single neurons to large networks. In Sleep and Anesthesia: Neural Correlates in Theory and Experiment; Hutt, A., Ed.; Springer: New York, NY, USA, 2011; pp. 69–105. [Google Scholar] [CrossRef]
  92. Destexhe, A. Nonlinear Dynamics of the Rhythmical Activity of the Brain (Aspects Non Linéaires de l’Activité Rythmique du Cerveau); Université Libre de Bruxelles: Brussels, Belgium, 1992. [Google Scholar]
  93. Neuhauser, H. Collective microshear processes and plastic instabilities in crystalline and amorphous structures. Int. J. Plast. 1993, 9, 421–435. [Google Scholar] [CrossRef]
  94. Niu, S.Z.; Kou, H.C.; Zhang, Y.; Wang, J.; Li, J.S. The characteristics of serration in Al0.5CoCrFeNi high entropy alloy. Mater. Sci. Eng. A Struct. Mater. Prop. Microstruct. Process. 2017, 702, 96–103. [Google Scholar] [CrossRef]
  95. Abbadi, M.; Hahner, P.; Zeghloul, A. On the characteristics of Portevin-Le Chatelier bands in aluminum alloy 5182 under stress-controlled and strain-controlled tensile testing. Mater. Sci. Eng. A Struct. Mater. Prop. Microstruct. Process. 2002, 337, 194–201. [Google Scholar] [CrossRef]
  96. Reed, J.M.; Walter, M.E. Observations of serration characteristics and acoustic emission during serrated flow of an Al–Mg alloy. Mater. Sci. Eng. A 2003, 359, 1–10. [Google Scholar] [CrossRef]
  97. Golovin, Y.I.; Ivolgin, V.I.; Khonik, V.A.; Kitagawa, K.; Tyurin, A.I. Serrated plastic flow during nanoindentation of a bulk metallic glass. Scr. Mater. 2001, 45, 947–952. [Google Scholar] [CrossRef]
  98. François, D.; Pineau, A.; Zaoui, A. Mechanical Behaviour of Materials: Volume 1: Micro- and Macroscopic Constitutive Behaviour; Springer: Dordrecht, The Netherlands, 2012. [Google Scholar]
  99. Pustovalov, V.V. Serrated deformation of metals and alloys at low temperatures (Review). Low Temp. Phys. 2008, 34, 683–723. [Google Scholar] [CrossRef]
  100. Gindin, I.; Khotkevich, V.; Starodubov, Y.A. Ductile characteristics of aluminum at low temperatures. Fiz. Met. Metalloved 1959, 7–10, 794. [Google Scholar]
  101. Blewitt, T.H.; Coltman, R.R.; Redman, J.K. Low-temperature deformation of copper single crystals. J. Appl. Phys. 1957, 28, 651–660. [Google Scholar] [CrossRef]
  102. Lebedev, V.P.; Krylovskiy, V.S.; Lebedev, S.V. Low-temperature jump-like strains on different scales in the normal state of Pb-(4−49) at. % In alloys. Low Temp. Phys. 2012, 38, 248–254. [Google Scholar] [CrossRef]
  103. Kuzmenko, I.; Lubenets, S.; Pustovalov, V.; Fomenko, L. Vliyanie sverkhprovodyashchego perekhoda na skolzhenie i dvoynikovanie indiya i ego splavov [Effect of the superconducting transition on slip and twinning in indium and its alloys]. Sov. J. Low Temp. Phys. 1983, 9, 450–453. [Google Scholar]
  104. Sarkar, A.; Barat, P.; Mukherjee, P. Multiscale entropy analysis of the Portevin-Le Chatelier effect in an Al-2.5%Mg alloy. Fractals 2010, 18, 319–325. [Google Scholar] [CrossRef] [Green Version]
  105. Chatterjee, A.; Sarkar, A.; Barat, P.; Mukherjee, P.; Gayathri, N. Character of the deformation bands in the (A + B) regime of the Portevin-Le Chatelier effect in Al-2.5%Mg alloy. Mater. Sci. Eng. A 2009, 508, 156–160. [Google Scholar] [CrossRef]
  106. Valdes-Tabernero, M.A.; Sancho-Cadenas, R.; Sabirov, I.; Murashkin, M.Y.; Ovid‘ko, I.A.; Galvez, F. Effect of SPD processing on mechanical behavior and dynamic strain aging of an Al-Mg alloy in various deformation modes and wide strain rate range. Mater. Sci. Eng. A 2017, 696, 348–359. [Google Scholar] [CrossRef]
  107. Chibane, N.; Ait-Amokhtar, H.; Fressengeas, C. On the strain rate dependence of the critical strain for plastic instabilities in Al-Mg alloys. Scr. Mater. 2017, 130, 252–255. [Google Scholar] [CrossRef]
  108. Yuzbekova, D.; Mogucheva, A.; Zhemchuzhnikova, D.; Lebedkina, T.; Lebyodkin, M.; Kaibyshev, R. Effect of microstructure on continuous propagation of the Portevin-Le Chatelier deformation bands. Int. J. Plast. 2017, 96, 210–226. [Google Scholar] [CrossRef]
  109. Jobba, M.; Mishra, R.K.; Niewczas, M. Flow stress and work-hardening behaviour of Al-Mg binary alloys. Int. J. Plast. 2015, 65, 43–60. [Google Scholar] [CrossRef]
  110. Shibkov, A.A.; Gasanov, M.F.; Zheltov, M.A.; Zolotov, A.E.; Ivolgin, V.I. Intermittent plasticity associated with the spatio-temporal dynamics of deformation bands during creep tests in an AlMg polycrystal. Int. J. Plast. 2016, 86, 37–55. [Google Scholar] [CrossRef]
  111. Chihab, K. On the apparent strain rate sensitivity of Portevin—Le Chatelier effect. Ann. Chim. Sci. Des. Mater. 2004, 29, 15–23. [Google Scholar] [CrossRef]
  112. Park, D.; Morris, J.G. The tensile deformation-behavior of AA-3004 aluminum-alloy. Metall. Mater. Trans. A Phys. Metall. Mater. Sci. 1994, 25, 357–364. [Google Scholar] [CrossRef]
  113. Tian, B.; Paris, O.; Prem, M.; Pink, E.; Fratzl, P. Serrated flow and related microstructures in an Al-8.4 at.% Li alloy. J. Mater. Sci. 2002, 37, 1355–1361. [Google Scholar] [CrossRef]
  114. Tian, B.H. Comparing characteristics of serrations in Al-Li and Al-Mg alloys. Mater. Sci. Eng. A Struct. Mater. Prop. Microstruct. Process. 2003, 360, 330–338. [Google Scholar] [CrossRef]
  115. Thomas, G.; Srinivasan, N.K. Effect of quenching temperature on nature of serrations in an aluminum-alloy. Scr. Metall. 1974, 8, 1163–1166. [Google Scholar] [CrossRef]
  116. Ananthakrishna, G.; Fressengeas, C.; Grosbras, M.; Vergnol, J.; Engelke, C.; Plessing, J.; Neuhäuser, H.; Bouchaud, E.; Planès, J.; Kubin, L.P. On the existence of chaos in jerky flow. Scr. Metall. Mater. 1995, 32, 1731–1737. [Google Scholar] [CrossRef]
  117. Rowcliffe, A.F.; Zinkle, S.J.; Hoelzer, D.T. Effect of strain rate on the tensile properties of unirradiated and irradiated V-4Cr-4Ti. J. Nucl. Mater. 2000, 283, 508–512. [Google Scholar] [CrossRef]
  118. Koyama, M.; Fukumoto, K.; Matsui, H. Effects of purity on high temperature mechanical properties of vanadium alloys. J. Nucl. Mater. 2004, 329, 442–446. [Google Scholar] [CrossRef]
  119. Sarkar, A.; Maloy, S.A.; Murty, K.L. Investigation of Portevin-LeChatelier effect in HT-9 steel. Mater. Sci. Eng. A 2015, 631, 120–125. [Google Scholar] [CrossRef]
  120. Field, D.M.; Aken, D.C.V. Dynamic strain aging phenomena and tensile response of medium-Mn TRIP steel. Metall. Mater. Trans. A 2018, 49, 1152–1166. [Google Scholar] [CrossRef] [Green Version]
  121. Lan, P.; Zhang, J.Q. Serrated flow and dynamic strain aging in Fe-Mn-C TWIP steel. Metall. Mater. Trans. A Phys. Metall. Mater. Sci. 2018, 49, 147–161. [Google Scholar] [CrossRef]
  122. Zavattieri, P.D.; Savic, V.; Hector, L.G.; Fekete, J.R.; Tong, W.; Xuan, Y. Spatio-temporal characteristics of the Portevin-Le Chatelier effect in austenitic steel with twinning induced plasticity. Int. J. Plast. 2009, 25, 2298–2330. [Google Scholar] [CrossRef]
  123. Madivala, M.; Schwedt, A.; Wong, S.L.; Roters, F.; Prahl, U.; Bleck, W. Temperature dependent strain hardening and fracture behavior of TWIP steel. Int. J. Plast. 2018, 104, 80–103. [Google Scholar] [CrossRef]
  124. Yang, F.; Luo, H.W.; Pu, E.X.; Zhang, S.L.; Dong, H. On the characteristics of Portevin-Le Chatelier bands in cold-rolled 7Mn steel showing transformation induced plasticity. Int. J. Plast. 2018, 103, 188–202. [Google Scholar] [CrossRef]
  125. Alomari, A.S.; Kumar, N.; Murty, K.L. Enhanced ductility in dynamic strain aging regime in a Fe-25Ni-20Cr austenitic stainless steel. Mater. Sci. Eng. A Struct. Mater. Prop. Microstruct. Process. 2018, 729, 157–160. [Google Scholar] [CrossRef]
  126. Hong, Y.Y.; Li, S.L.; Li, H.J.; Li, J.; Sun, G.G.; Wang, Y.D. Development of intergranular residual stress and its implication to mechanical behaviors at elevated temperatures in AL6XN austenitic stainless steel. Metall. Mater. Trans. A Phys. Metall. Mater. Sci. 2018, 49, 3237–3246. [Google Scholar] [CrossRef]
  127. Li, Q.S.; Shen, Y.Z.; Han, P.C. Serrated flow behavior of Aisi 316l austenitic stainless steel for nuclear reactors. In 3rd Annual International Workshop on Materials Science and Engineering; IOP Publishing Ltd.: Bristol, UK, 2017; Volume 250. [Google Scholar]
  128. Ferrero, C.; Monforte, R.; Marinari, C.; Martino, E. Correlation between serration effect and temperature. Cryogenics 1994, 34, 473–476. [Google Scholar] [CrossRef]
  129. Kim, D.W.; Ryu, W.S.; Hong, J.H.; Choi, S.K. Effect of nitrogen on the dynamic strain ageing behaviour of type 316L stainless steel. J. Mater. Sci. 1998, 33, 675–679. [Google Scholar] [CrossRef]
  130. Koyama, M.; Sawaguchi, T.; Tsuzaki, K. Overview of dynamic strain aging and associated phenomena in Fe–Mn–C austenitic steels. ISIJ Int. 2018, 58, 1383–1395. [Google Scholar] [CrossRef] [Green Version]
  131. Brechtl, J.; Chen, B.; Xie, X.; Ren, Y.; Venable, J.D.; Liaw, P.K.; Zinkle, S.J. Entropy modeling on serrated flows in carburized steels. Mater. Sci. Eng. A 2019, 753, 135–145. [Google Scholar] [CrossRef]
  132. Denisov, D.V.; Lőrincz, K.A.; Wright, W.J.; Hufnagel, T.C.; Nawano, A.; Gu, X.; Uhl, J.T.; Dahmen, K.A.; Schall, P. Universal slip dynamics in metallic glasses and granular matter–linking frictional weakening with inertial effects. Sci. Rep. 2017, 7, 43376. [Google Scholar] [CrossRef] [PubMed] [Green Version]
  133. Antonaglia, J.; Xie, X.; Schwarz, G.; Wraith, M.; Qiao, J.; Zhang, Y.; Liaw, P.K.; Uhl, J.T.; Dahmen, K.A. Tuned critical avalanche scaling in bulk metallic glasses. Sci. Rep. 2014, 4, 4382. [Google Scholar] [CrossRef] [Green Version]
  134. Antonaglia, J.; Wright, W.J.; Gu, X.; Byer, R.R.; Hufnagel, T.C.; LeBlanc, M.; Uhl, J.T.; Dahmen, K.A. Bulk metallic glasses deform via slip avalanches. Phys. Rev. Lett. 2014, 112, 1–5. [Google Scholar] [CrossRef] [PubMed]
  135. Li, J.J.; Wang, Z.; Qiao, J.W. Power-law scaling between mean stress drops and strain rates in bulk metallic glasses. Mater. Des. 2016, 99, 427–432. [Google Scholar] [CrossRef]
  136. Torre, F.H.D.; Klaumünzer, D.; Maaß, R.; Löffler, J.F. Stick–slip behavior of serrated flow during inhomogeneous deformation of bulk metallic glasses. Acta Mater. 2010, 58, 3742–3750. [Google Scholar] [CrossRef]
  137. Maaß, R.; Klaumünzer, D.; Löffler, J.F. Propagation dynamics of individual shear bands during inhomogeneous flow in a Zr-based bulk metallic glass. Acta Mater. 2011, 59, 3205–3213. [Google Scholar] [CrossRef]
  138. Shi, B.; Luan, S.; Jin, P. Crossover from free propagation to cooperative motions of shear bands and its effect on serrated flow in metallic glass. J. Non-Cryst. Solids 2018, 482, 126–131. [Google Scholar] [CrossRef]
  139. Jiang, W.H.; Fan, G.J.; Liu, F.X.; Wang, G.Y.; Choo, H.; Liaw, P.K. Spatiotemporally inhomogeneous plastic flow of a bulk-metallic glass. Int. J. Plast. 2008, 24, 1–16. [Google Scholar] [CrossRef]
  140. Xie, X.; Lo, Y.-C.; Tong, Y.; Qiao, J.; Wang, G.; Ogata, S.; Qi, H.; Dahmen, K.A.; Gao, Y.; Liaw, P.K. Origin of serrated flow in bulk metallic glasses. J. Mech. Phys. Solids 2019, 124, 634–642. [Google Scholar] [CrossRef]
  141. Schuh, C.A.; Nieh, T.G. A nanoindentation study of serrated flow in bulk metallic glasses. Acta Mater. 2003, 51, 87–99. [Google Scholar] [CrossRef]
  142. Wei, B.C.; Zhang, T.H.; Li, W.H.; Sun, Y.F.; Yu, Y.; Wang, Y.R. Serrated plastic flow during nanoindentation in Nd-based bulk metallic glasses. Intermetallics 2004, 12, 1239–1243. [Google Scholar] [CrossRef]
  143. Liu, L.; Chan, K.C. Plastic deformation of Zr-based bulk metallic glasses under nanoindentation. Mater. Lett. 2005, 59, 3090–3094. [Google Scholar] [CrossRef]
  144. Li, W.H.; Wei, B.C.; Zhang, T.H.; Xing, D.M.; Zhang, L.C.; Wang, Y.R. Study of serrated flow and plastic deformation in metallic glasses through instrumented indentation. Intermetallics 2007, 15, 706–710. [Google Scholar] [CrossRef]
  145. Jiang, W.H.; Jiang, F.; Liu, F.X.; Choo, H.; Liaw, P.K. Temperature dependence of serrated flows in compression in a bulk-metallic glass. Appl. Phys. Lett. 2006, 89. [Google Scholar] [CrossRef]
  146. Georgarakis, K.; Aljerf, M.; Li, Y.; LeMoulec, A.; Charlot, F.; Yavari, A.R.; Chornokhvostenko, K.; Tabachnikova, E.; Evangelakis, G.A.; Miracle, D.B.; et al. Shear band melting and serrated flow in metallic glasses. Appl. Phys. Lett. 2008, 93, 3. [Google Scholar] [CrossRef]
  147. Tang, C.G.; Li, Y.; Zeng, K.Y. Effect of residual shear bands on serrated flow in a metallic glass. Mater. Lett. 2005, 59, 3325–3329. [Google Scholar] [CrossRef]
  148. Yu, G.S.; Lin, J.G.; Li, W.; Lin, Z.W. Structural relaxation and serrated flow due to annealing treatments in Zr-based metallic glasses. J. Alloys Compd. 2010, 489, 558–561. [Google Scholar] [CrossRef]
  149. Kuo, C.N.; Chen, H.M.; Du, X.H.; Huang, J.C. Flow serrations and fracture morphologies of Cu-based bulk metallic glasses in energy release perspective. Intermetallics 2010, 18, 1648–1652. [Google Scholar] [CrossRef]
  150. Brechtl, J.; Wang, Z.; Xie, X.; Qiao, J.-W.; Liaw, P.K. Relation between the defect interactions and the serration dynamics in a zr-based bulk metallic glass. Appl. Sci. 2020, 10, 3892. [Google Scholar] [CrossRef]
  151. Brechtl, J.; Xie, X.; Wang, Z.; Qiao, J.; Liaw, P.K. Complexity analysis of serrated flows in a bulk metallic glass under constrained and unconstrained conditions. Mater. Sci. Eng. A 2020, 771, 138585. [Google Scholar] [CrossRef]
  152. Chen, S.; Xie, X.; Chen, B.L.; Qiao, J.W.; Zhang, Y.; Ren, Y.; Dahmen, K.A.; Liaw, P.K. Effects of temperature on serrated flows of Al0.5CoCrCuFeNi high-entropy alloy. JOM 2015, 67, 2314–2320. [Google Scholar] [CrossRef]
  153. Carroll, R.; Lee, C.; Tsai, C.-W.; Yeh, J.-W.; Antonaglia, J.; Brinkman, B.A.W.; LeBlanc, M.; Xie, X.; Chen, S.; Liaw, P.K.; et al. Experiments and model for serration statistics in low-entropy, medium-entropy, and high-entropy alloys. Sci. Rep. 2015, 5, 16997. [Google Scholar] [CrossRef] [PubMed] [Green Version]
  154. Chen, S.; Yu, L.; Ren, J.; Xie, X.; Li, X.; Xu, Y.; Zhao, G.; Li, P.; Yang, F.; Ren, Y.; et al. Self-similar random process and chaotic behavior in serrated flow of high entropy alloys. Sci. Rep. 2016, 6, 29798. [Google Scholar] [CrossRef] [Green Version]
  155. Chen, S.; Xie, X.; Li, W.; Feng, R.; Chen, B.; Qiao, J.; Ren, Y.; Zhang, Y.; Dahmen, K.A.; Liaw, P.K. Temperature effects on the serrated behavior of an Al0.5CoCrCuFeNi high-entropy alloy. Mater. Chem. Phys. 2018, 210, 20–28. [Google Scholar] [CrossRef]
  156. Komarasamy, M.; Kumar, N.; Mishra, R.S.; Liaw, P.K. Anomalies in the deformation mechanism and kinetics of coarse-grained high entropy alloy. Mater. Sci. Eng. A 2016, 654, 256–263. [Google Scholar] [CrossRef]
  157. Chen, S.; Li, W.; Xie, X.; Brechtl, J.; Chen, B.; Li, P.; Zhao, G.; Yang, F.; Qiao, J.; Dahmen, K.A.; et al. Nanoscale serration and creep characteristics of Al0.5CoCrCuFeNi high-entropy alloys. J. Alloys Compd. 2018, 752, 464–475. [Google Scholar] [CrossRef]
  158. Tong, C.J.; Chen, M.R.; Chen, S.K.; Yeh, J.W.; Shun, T.T.; Lin, S.J.; Chang, S.Y. Mechanical performance of the AlxCoCrCuFeNi high-entropy alloy system with multiprincipal elements. Metall. Mater. Trans. A Phys. Metall. Mater. Sci. 2005, 36A, 1263–1271. [Google Scholar] [CrossRef]
  159. Liu, J.; Guo, X.; Lin, Q.; Zhanbing, H.; An, X.; Li, L.; Liaw, P.K.; Liao, X.; Yu, L.; Lin, J.; et al. Excellent ductility and serration feature of metastable CoCrFeNi high-entropy alloy at extremely low temperatures. Sci. China Mater. 2019, in press. [Google Scholar] [CrossRef] [Green Version]
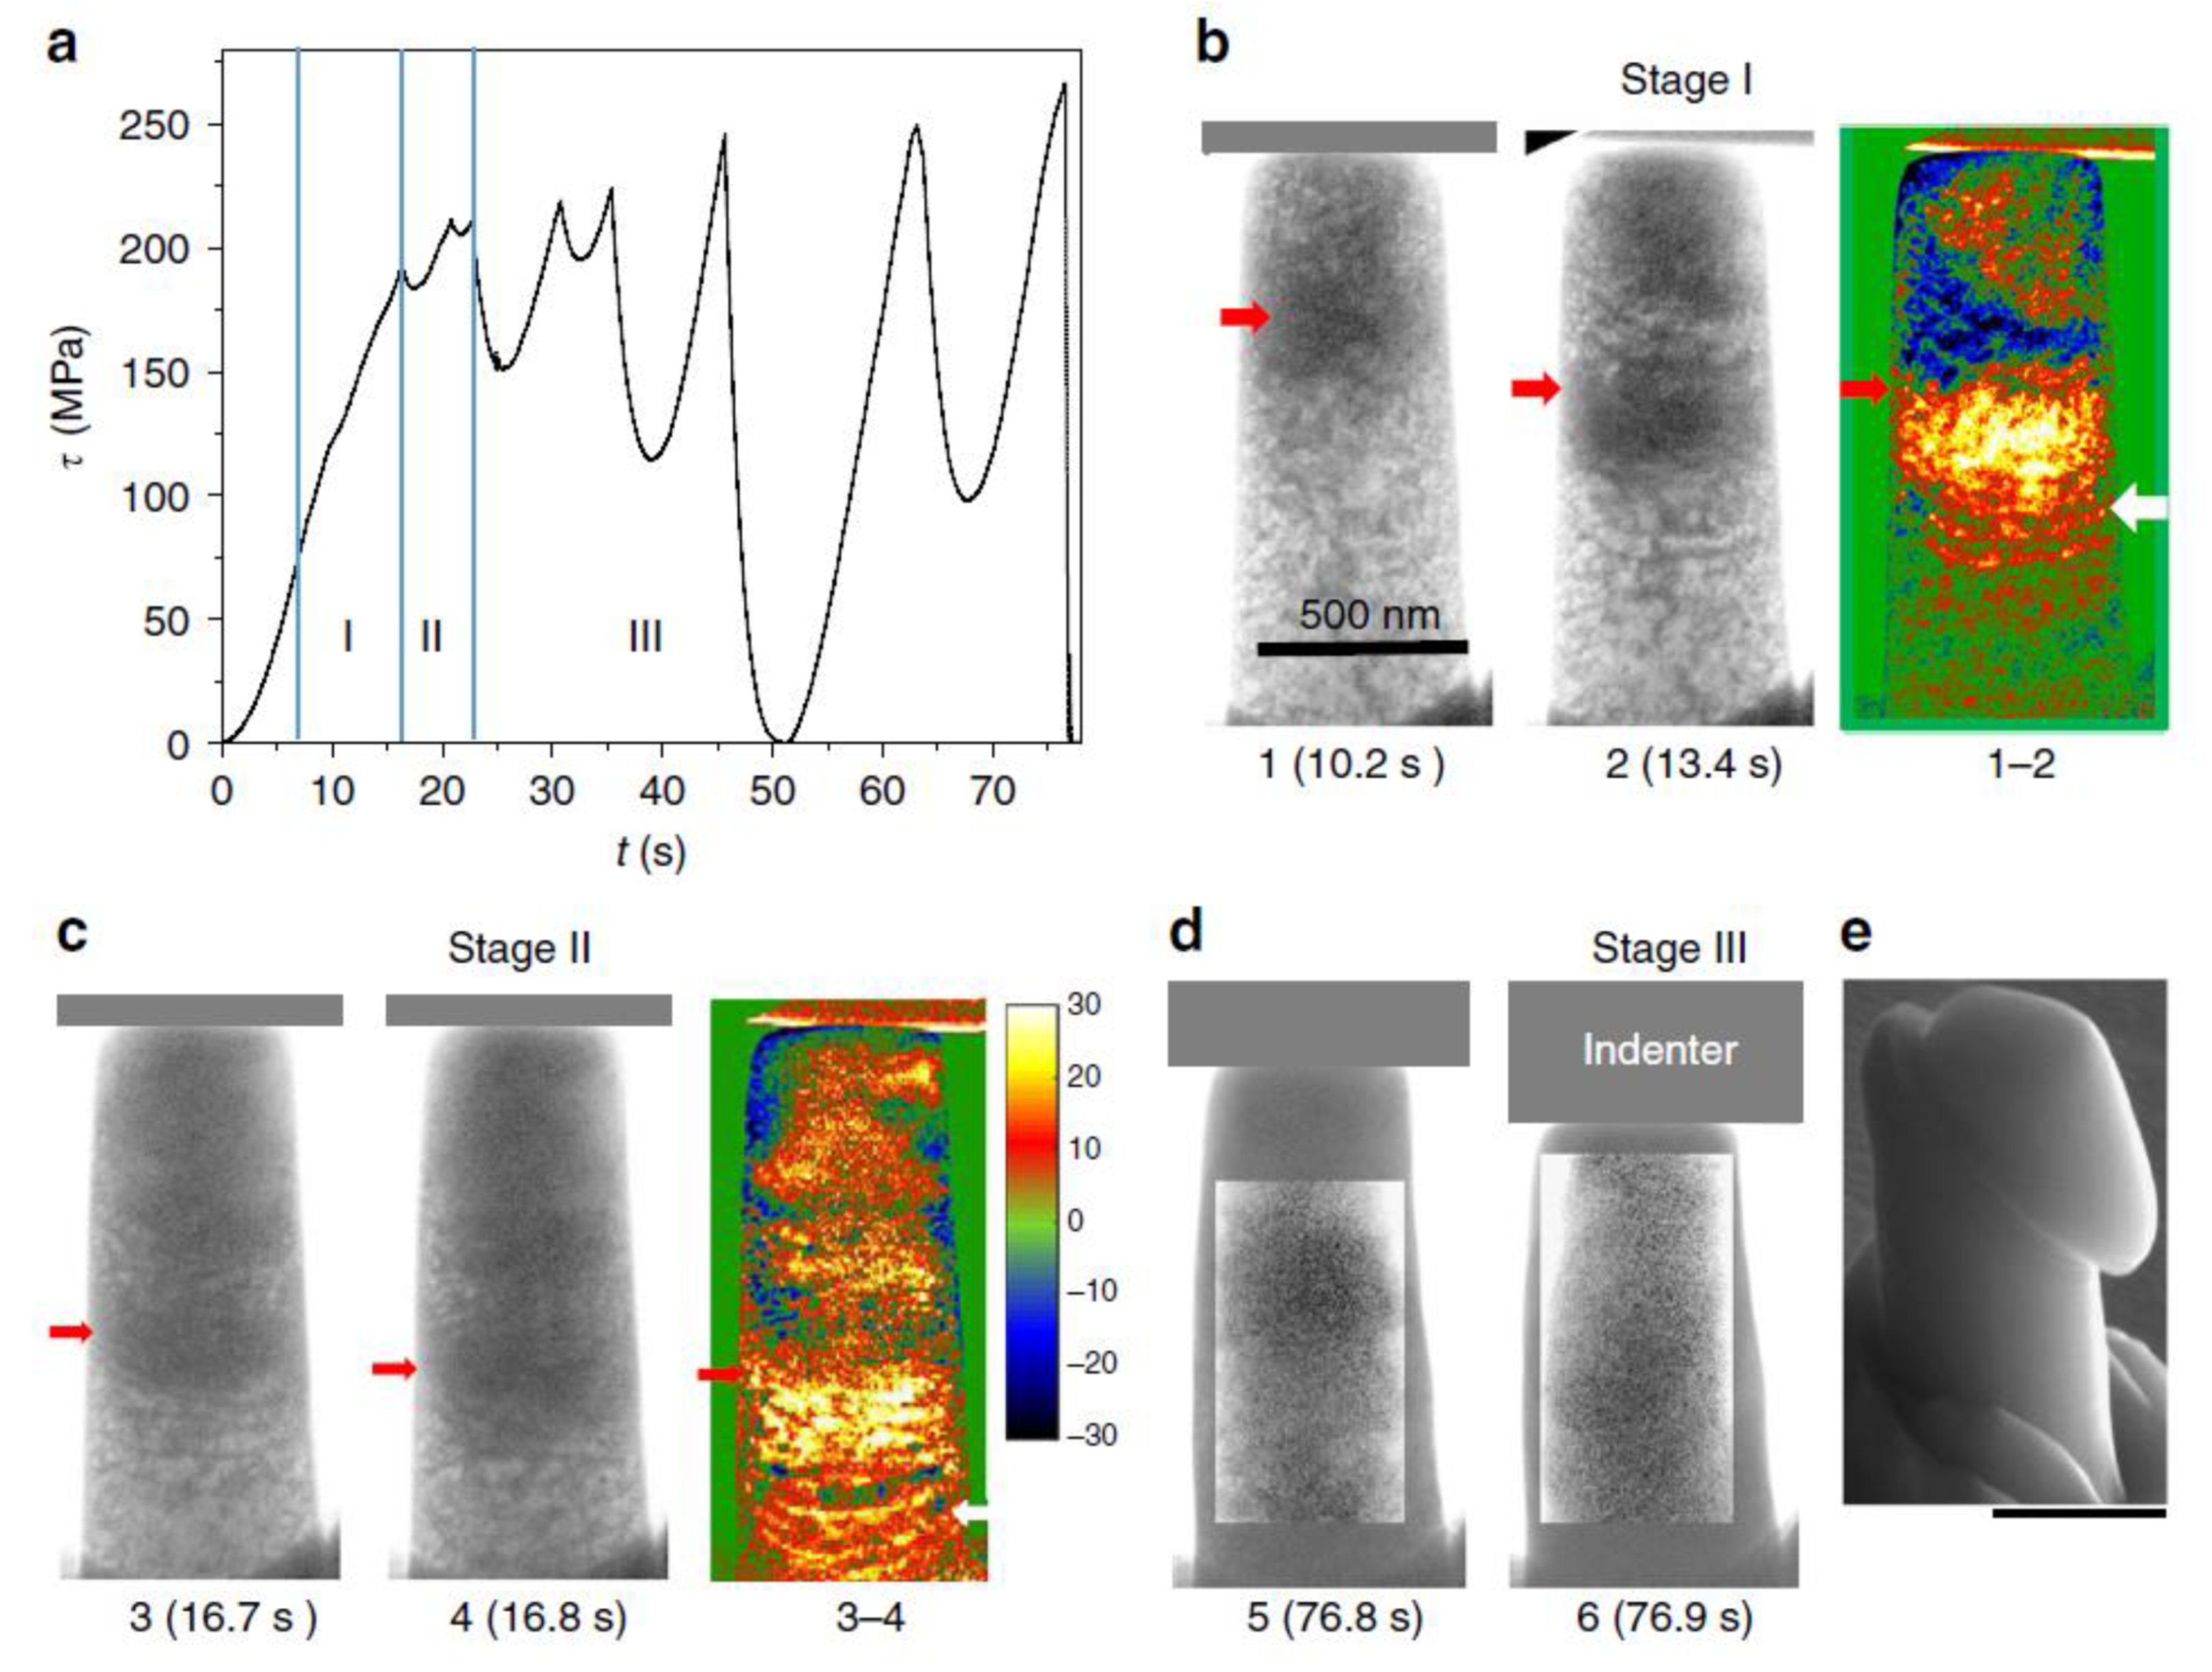
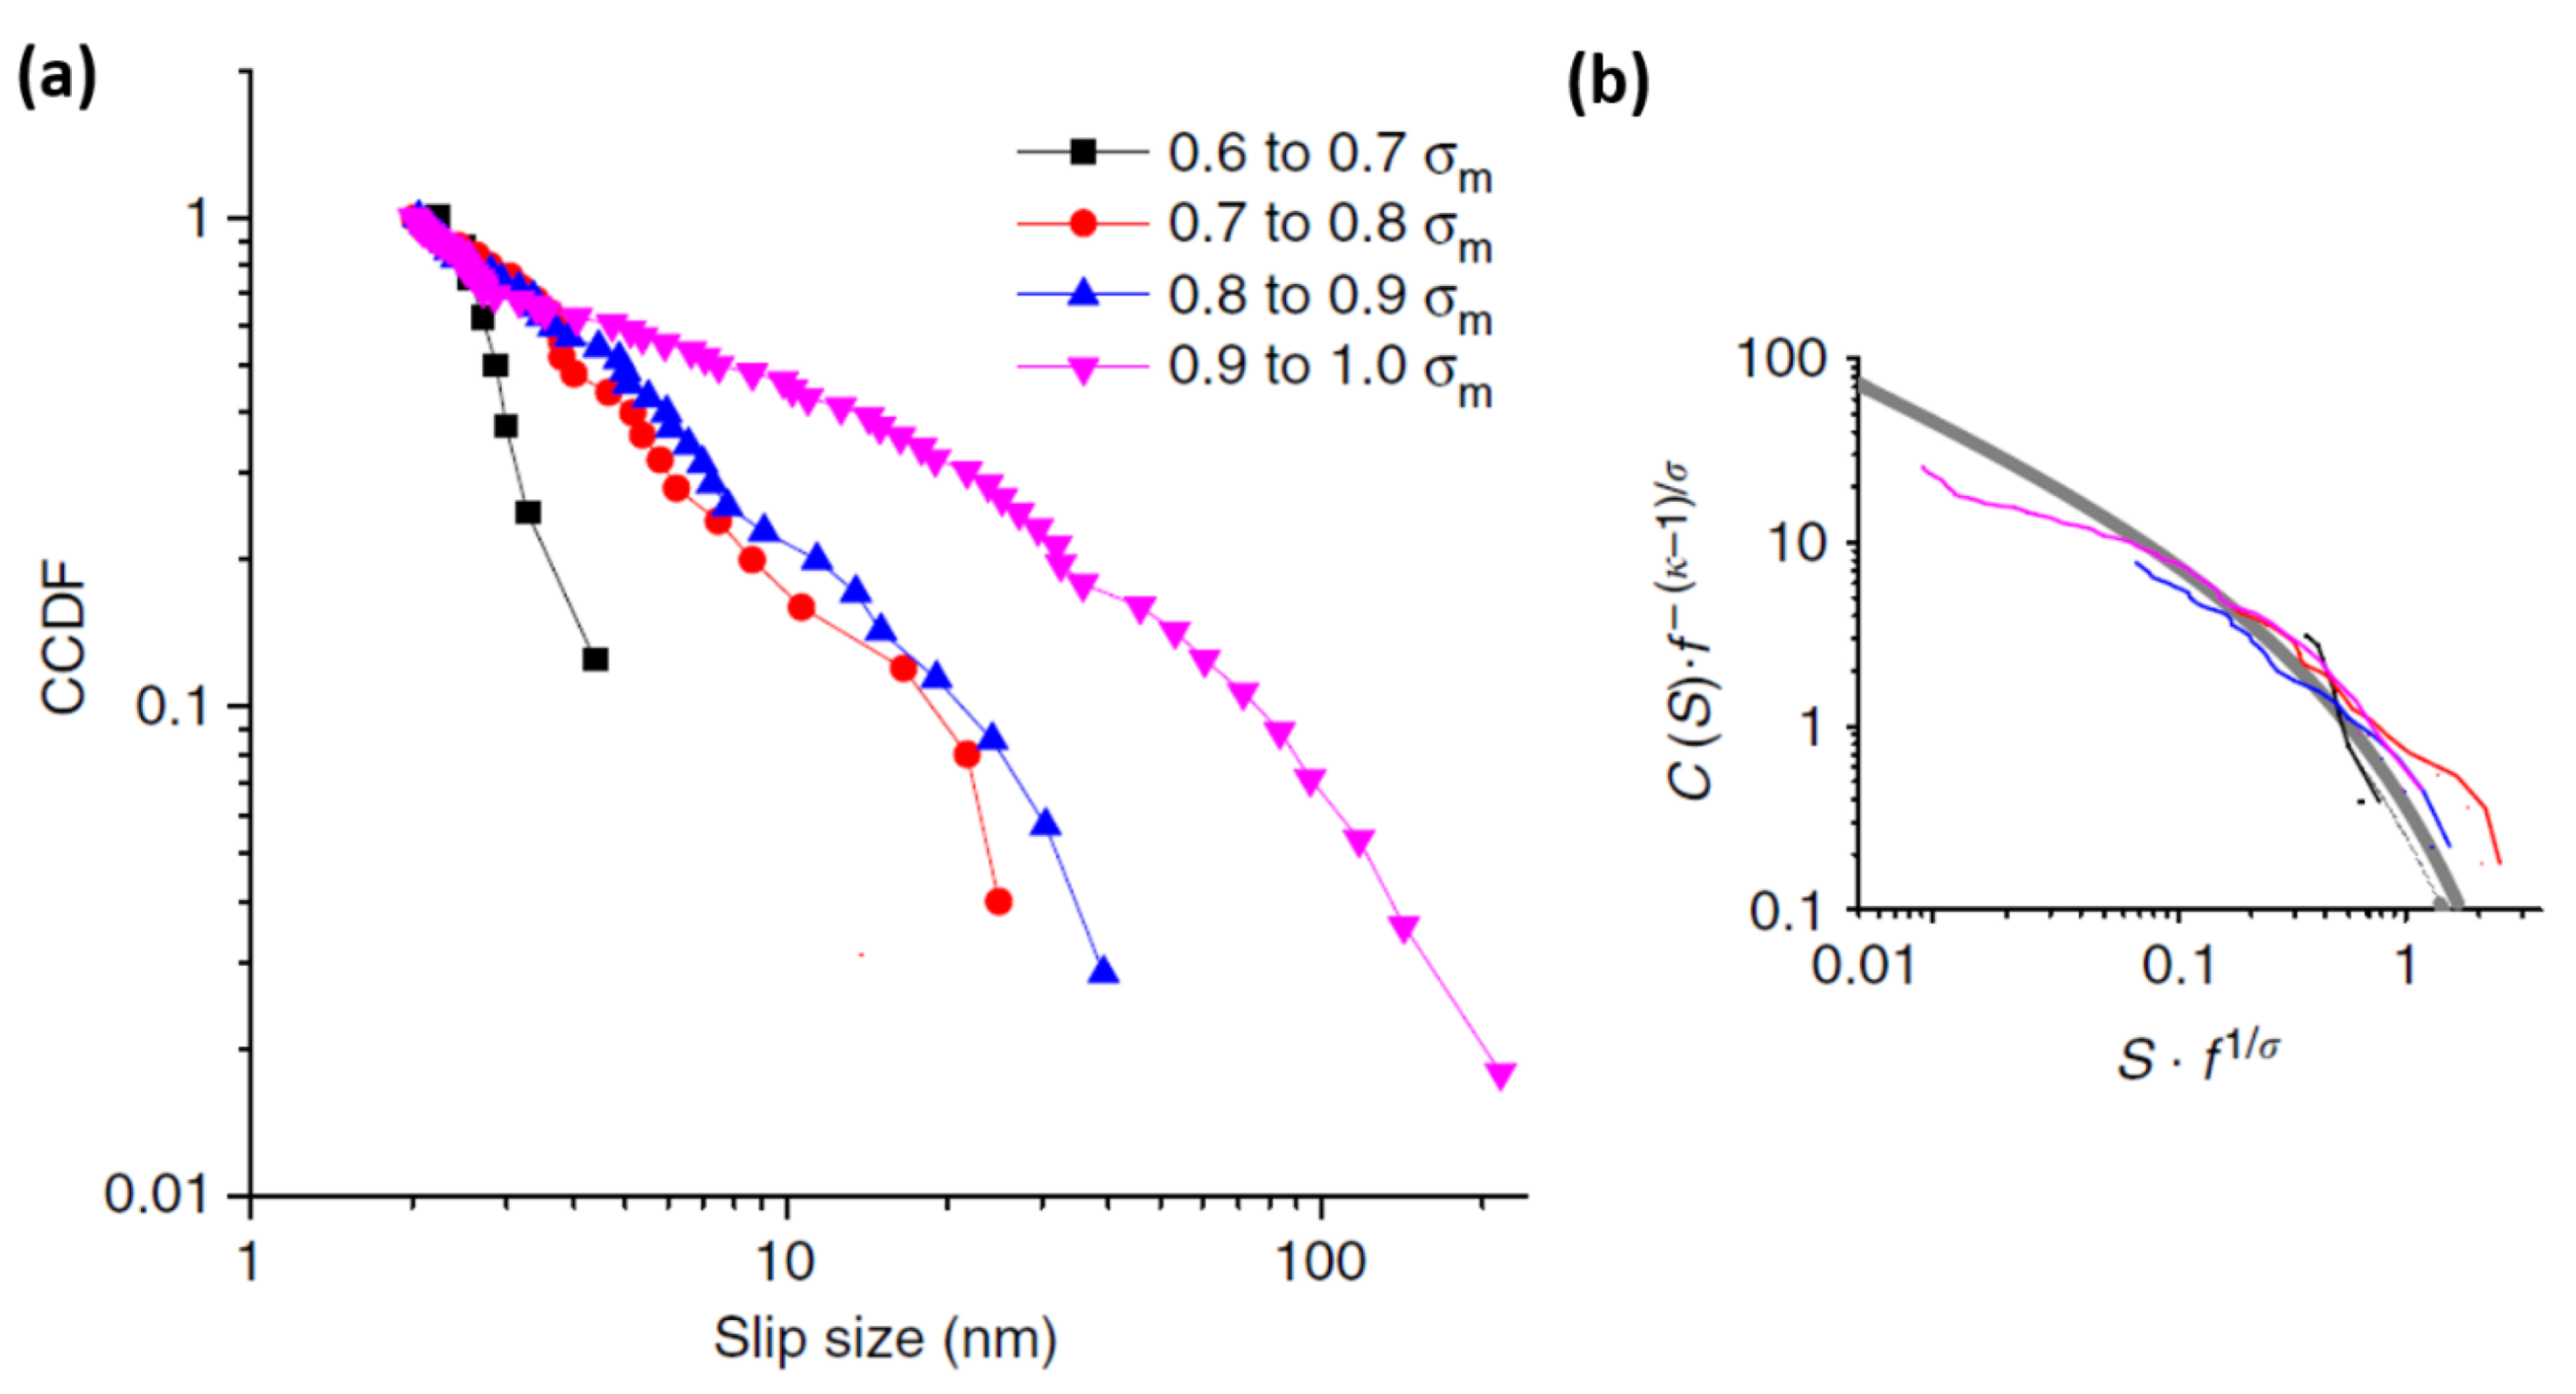
  160. Hu, Y.; Shu, L.; Yang, Q.; Guo, W.; Liaw, P.K.; Dahmen, K.A.; Zuo, J.M. Dislocation avalanche mechanism in slowly compressed high entropy alloy nanopillars. Commun. Phys. 2018, 1, 8. [Google Scholar] [CrossRef]
  161. Jiao, Z.M.; Chu, M.Y.; Yang, H.J.; Wang, Z.H.; Qiao, J.W. Nanoindentation characterised plastic deformation of a Al0.5CoCrFeNi high entropy alloy. Mater. Sci. Technol. 2015, 31, 1244–1249. [Google Scholar] [CrossRef]
  162. Samal, S.; Rahul, M.R.; Kottada, R.S.; Phanikumar, G. Hot deformation behaviour and processing map of Co-Cu-Fe-Ni-Ti eutectic high entropy alloy. Mater. Sci. Eng. A Struct. Mater. Prop. Microstruct. Process. 2016, 664, 227–235. [Google Scholar] [CrossRef]
  163. Fu, J.X.; Cao, C.M.; Tong, W.; Hao, Y.X.; Peng, L.M. The tensile properties and serrated flow behavior of a thermomechanically treated CoCrFeNiMn high-entropy alloy. Mater. Sci. Eng. A Struct. Mater. Prop. Microstruct. Process. 2017, 690, 418–426. [Google Scholar] [CrossRef]
  164. Komarasamy, M.; Alagarsamy, K.; Mishra, R.S. Serration behavior and negative strain rate sensitivity of Al0.1CoCrFeNi high entropy alloy. Intermetallics 2017, 84, 20–24. [Google Scholar] [CrossRef]
  165. Guo, X.X.; Xie, X.; Ren, J.L.; Laktionova, M.; Tabachnikova, E.; Yu, L.P.; Cheung, W.-S.; Dahmen, K.A.; Liaw, P.K. Plastic dynamics of the Al0.5CoCrCuFeNi high entropy alloy at cryogenic temperatures: Jerky flow, stair-like fluctuation, scaling behavior, and non-chaotic state. Appl. Phys. Lett. 2017, 111. [Google Scholar] [CrossRef] [Green Version]
  166. Wang, B.F.; Fu, A.; Huang, X.X.; Liu, B.; Liu, Y.; Li, Z.Z.; Zan, X. Mechanical properties and microstructure of the CoCrFeMnNi high entropy alloy under high strain rate compression. J. Mater. Eng. Perform. 2016, 25, 2985–2992. [Google Scholar] [CrossRef]
  167. Antonaglia, J.; Xie, X.; Tang, Z.; Tsai, C.-W.; Qiao, J.W.; Zhang, Y.; Laktionova, M.O.; Tabachnikova, E.D.; Yeh, J.W.; Senkov, O.N.; et al. Temperature effects on deformation and serration behavior of high-entropy alloys (HEAs). JOM 2014, 66, 2002–2008. [Google Scholar] [CrossRef]
  168. Fu, J.X.; Cao, C.M.; Tong, W.; Peng, L.M. Effect of thermomechanical processing on microstructure and mechanical properties of CoCrFeNiMn high entropy alloy. Trans. Nonferrous Met. Soc. China 2018, 28, 931–938. [Google Scholar] [CrossRef]
  169. Zhang, Y.; Li, J.S.; Wang, J.; Wang, W.Y.; Kou, H.C.; Beaugnon, E. Temperature dependent deformation mechanisms of Al0.3CoCrFeNi high-entropy alloy, starting from serrated flow behavior. J. Alloys Compd. 2018, 757, 39–43. [Google Scholar] [CrossRef]
  170. Wang, B.F.; Yao, X.R.; Wang, C.; Zhang, X.Y.; Huang, X.X. Mechanical properties and microstructure of a nicrfecomn high-entropy alloy deformed at high strain rates. Entropy 2018, 20, 892. [Google Scholar] [CrossRef] [Green Version]
  171. Zhang, H.T.; Siu, K.W.; Liao, W.B.; Wang, Q.; Yang, Y.; Lu, Y. In situ mechanical characterization of CoCrCuFeNi high-entropy alloy micro/nano-pillars for their size-dependent mechanical behavior. Mater. Res. Express 2016, 3, 8. [Google Scholar] [CrossRef]
  172. Zhang, L.J.; Yu, P.F.; Cheng, H.; Zhang, H.; Diao, H.Y.; Shi, Y.Z.; Chen, B.L.; Chen, P.Y.; Feng, R.; Bai, J.; et al. Nanoindentation creep behavior of an Al0.3CoCrFeNi high-entropy alloy. Metall. Mater. Trans. A Phys. Metall. Mater. Sci. 2016, 47, 5871–5875. [Google Scholar] [CrossRef]
  173. Ge, S.F.; Fu, H.M.; Zhang, L.; Mao, H.H.; Li, H.; Wang, A.M.; Li, W.R.; Zhang, H.F. Effects of Al addition on the microstructures and properties of MoNbTaTiV refractory high entropy alloy. Mater. Sci. Eng. A Struct. Mater. Prop. Microstruct. Process. 2020, 784, 9. [Google Scholar] [CrossRef]
  174. Chen, W.Y.; Liu, X.; Chen, Y.R.; Yeh, J.W.; Tseng, K.K.; Natesan, K. Irradiation effects in high entropy alloys and 316H stainless steel at 300 degrees C. J. Nucl. Mater. 2018, 510, 421–430. [Google Scholar] [CrossRef]
  175. Kang, M.; Lim, K.R.; Won, J.W.; Na, Y.S. Effect of Co content on the mechanical properties of A2 and B2 phases in AlCoxCrFeNi high-entropy alloys. J. Alloys Compd. 2018, 769, 808–812. [Google Scholar] [CrossRef]
  176. Chen, M.; Liu, Y.; Li, Y.X.; Chen, X. Microstructure and mechanical properties of AlTiFeNiCuCrx high-entropy alloy with multi-principal elements. Acta Metall. Sin. 2007, 43, 1020–1024. [Google Scholar]
  177. Yu, L.P.; Chen, S.Y.; Ren, J.L.; Ren, Y.; Yang, F.Q.; Dahmen, K.A.; Liaw, P.K. Plasticity performance of Al0.5CoCrCuFeNi high-entropy alloys under nanoindentation. J. Iron Steel Res. Int. 2017, 24, 390–396. [Google Scholar] [CrossRef] [Green Version]
  178. Zhang, B.; Liaw, P.K.; Brechtl, J.; Ren, J.; Guo, X.; Zhang, Y. Effects of Cu and Zn on microstructures and mechanical behavior of the medium-entropy aluminum alloy. J. Alloy. Compd. 2020, 820, 153092. [Google Scholar] [CrossRef]
  179. Chen, S.Y.; Yang, X.; Dahmen, K.A.; Liaw, P.K.; Zhang, Y. Microstructures and crackling noise of AlxNbTiMoV high entropy alloys. Entropy 2014, 16, 870–884. [Google Scholar] [CrossRef] [Green Version]
  180. Brechtl, J.; Chen, S.Y.; Xie, X.; Ren, Y.; Qiao, J.W.; Liaw, P.K.; Zinkle, S.J. Towards a greater understanding of serrated flows in an Al-containing high-entropy-based alloy. Int. J. Plast. 2019, 115, 71–92. [Google Scholar] [CrossRef]
  181. Tsai, C.-W.; Lee, C.; Lin, P.-T.; Xie, X.; Chen, S.; Carroll, R.; LeBlanc, M.; Brinkman, B.A.W.; Liaw, P.K.; Dahmen, K.A.; et al. Portevin-Le Chatelier mechanism in face-centered-cubic metallic alloys from low to high entropy. Int. J. Plast. 2019, 122, 212–224. [Google Scholar] [CrossRef]
  182. Rodriguez, P. Serrated plastic flow. Bull. Mater. Sci. 1984, 6, 653–663. [Google Scholar] [CrossRef]
  183. Weertman, J. Theory of infinitesimal dislocations distributed on a plane applied to discontinuous yield phenomena. Can. J. Phys. 1967, 45, 797–807. [Google Scholar] [CrossRef]
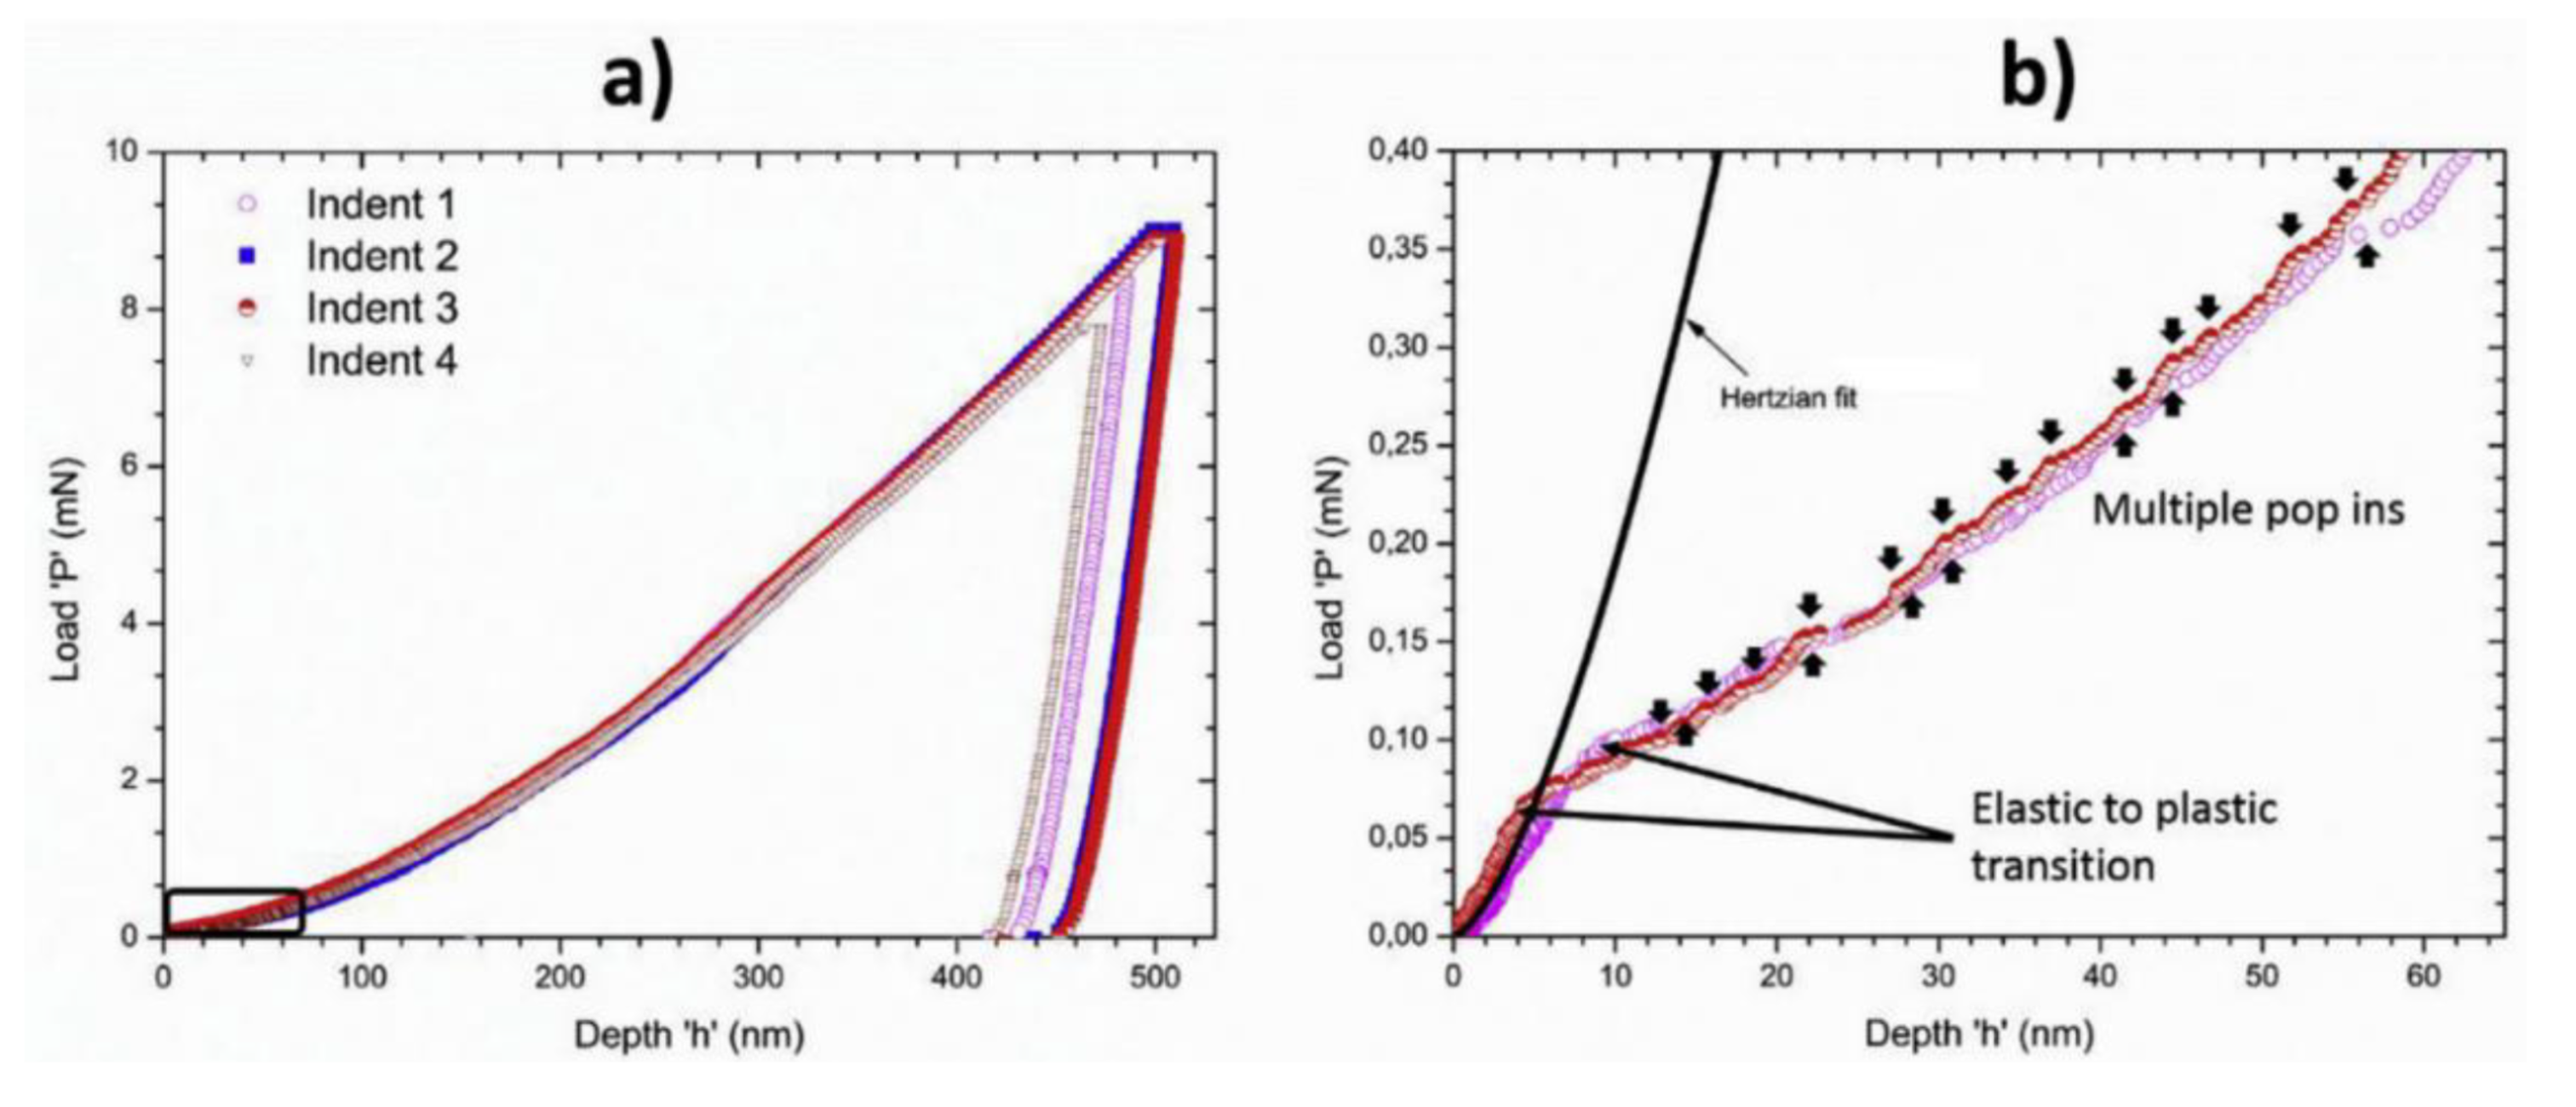
  184. Pöhl, F. Pop-in behavior and elastic-to-plastic transition of polycrystalline pure iron during sharp nanoindentation. Sci. Rep. 2019, 9, 15350. [Google Scholar] [CrossRef] [Green Version]
  185. Samuel, K.G.; Rodriguez, P. Age-Softening and Yield Points in Beta Brass. Trans. Indian Inst. Metals. 1980, 33, 285–295. [Google Scholar]
  186. Soboyejo, W. Mechanical Properties of Engineered Materials; CRC Press: Boca Raton, FL, USA, 2002. [Google Scholar]
  187. Cottrell, A.H.; Bilby, B.A. Dislocation theory of yielding and strain ageing of iron. Proc. Phys. Soc. Sect. A 1949, 62, 49–62. [Google Scholar] [CrossRef]
  188. Herman, H. Treatise on Materials Science and Technology; Elsevier Science: London, UK, 2017; Volume 4. [Google Scholar]
  189. Agrawal, B.K. Introduction to Engineering Materials; Tata McGraw-Hill: New Delhi, India, 1988. [Google Scholar]
  190. Kozłowska, A.; Grzegorczyk, B.; Morawiec, M.; Grajcar, A. Explanation of the PLC effect in advanced high-strength medium-mn steels. a review. Materials 2019, 12, 4175. [Google Scholar] [CrossRef] [Green Version]
  191. Yasuda, H.Y.; Shigeno, K.; Nagase, T. Dynamic strain aging of Al0.3CoCrFeNi high entropy alloy single crystals. Scr. Mater. 2015, 108, 80–83. [Google Scholar] [CrossRef]
  192. Guo, L.; Gu, J.; Gong, X.; Li, K.; Ni, S.; Liu, Y.; Song, M. Short-range ordering induced serrated flow in a carbon contained FeCoCrNiMn high entropy alloy. Micron 2019, 126, 102739. [Google Scholar] [CrossRef] [PubMed]
  193. Tabachnikova, E.D.; Podolskiy, A.V.; Laktionova, M.O.; Bereznaia, N.A.; Tikhonovsky, M.A.; Tortika, A.S. Mechanical properties of the CoCrFeNiMnVx high entropy alloys in temperature range 4.2–300 K. J. Alloys Compd. 2017, 698, 501–509. [Google Scholar] [CrossRef]
  194. Salishchev, G.A.; Tikhonovsky, M.A.; Shaysultanov, D.G.; Stepanov, N.D.; Kuznetsov, A.V.; Kolodiy, I.V.; Tortika, A.S.; Senkov, O.N. Effect of Mn and V on structure and mechanical properties of high-entropy alloys based on CoCrFeNi system. J. Alloys Compd. 2014, 591, 11–21. [Google Scholar] [CrossRef]
  195. Bazlov, A.I.; Churyumov, A.Y.; Louzguine-Luzgin, D.V. Investigation of the structure and properties of the Fe-Ni-Co-Cu-V multiprincipal element alloys. Metall. Mater. Trans. A 2018, 49, 5646–5652. [Google Scholar] [CrossRef]
  196. Churyumov, A.Y.; Pozdniakov, A.V.; Bazlov, A.I.; Mao, H.; Polkin, V.I.; Louzguine-Luzgin, D.V. Effect of Nb addition on microstructure and thermal and mechanical properties of Fe-Co-Ni-Cu-Cr multiprincipal-element (high-entropy) alloys in As-Cast and heat-treated state. JOM 2019, 71, 3481–3489. [Google Scholar] [CrossRef]
  197. Liu, L.H.; Liu, Z.Y.; Huan, Y.; Wu, X.Y.; Lou, Y.; Huang, X.S.; He, L.J.; Li, P.J.; Zhang, L.C. Effect of structural heterogeneity on serrated flow behavior of Zr-based metallic glass. J. Alloys Compd. 2018, 766, 908–917. [Google Scholar] [CrossRef] [Green Version]
  198. Liu, Z.Y.; Yang, Y.; Liu, C.T. Yielding and shear banding of metallic glasses. Acta Mater. 2013, 61, 5928–5936. [Google Scholar] [CrossRef]
  199. Suryanarayana, C.; Inoue, A. Bulk Metallic Glasses, 2nd ed.; CRC Press: New York, NY, USA, 2017. [Google Scholar]
  200. Bulk Metallic Glasses: An Overview; Miller, M.; Liaw, P.K. (Eds.) Springer: New York, NY, USA, 2008. [Google Scholar]
  201. Maaß, R.; Löffler, J.F. Shear-band dynamics in metallic glasses. Adv. Funct. Mater. 2015, 25, 2353–2368. [Google Scholar] [CrossRef]
  202. Zhao, L.Z.; Xue, R.J.; Zhu, Z.G.; Lu, Z.; Axinte, E.; Wang, W.H.; Bai, H.Y. Evaluation of flow units and free volumes in metallic glasses. J. Appl. Phys. 2014, 116, 103516. [Google Scholar] [CrossRef]
  203. Alrasheedi, N.H.; Yousfi, M.A.; Hajlaoui, K.; Mahfoudh, B.J.; Tourki, Z.; Yavari, A.R. On the modelling of the transient flow behavior of metallic glasses: Analogy with portevin-Le chatelier effect. Metals 2016, 6, 48. [Google Scholar] [CrossRef]
  204. Pink, E.; Grinberg, A. Serrated flow in a ferritic stainless steel. Mater. Sci. Eng. 1981, 51, 1–8. [Google Scholar] [CrossRef]
  205. Cai, Y.L.; Tian, C.G.; Fu, S.H.; Han, G.M.; Cui, C.Y.; Zhang, Q.C. Influence of gamma′ precipitates on Portevin-Le chatelier effect of Ni-based superalloys. Mater. Sci. Eng. A Struct. Mater. Prop. Microstruct. Process. 2015, 638, 314–321. [Google Scholar] [CrossRef]
  206. Chandravathi, K.S.; Laha, K.; Parameswaran, P.; Mathew, M.D. Effect of microstructure on the critical strain to onset of serrated flow in modified 9Cr–1Mo steel. Int. J. Press. Vessel. Pip. 2012, 89, 162–169. [Google Scholar] [CrossRef]
  207. Bayramin, B.; Şimşir, C.; Efe, M. Dynamic strain aging in DP steels at forming relevant strain rates and temperatures. Mater. Sci. Eng. A 2017, 704, 164–172. [Google Scholar] [CrossRef]
  208. Calcagnotto, M.; Ponge, D.; Demir, E.; Raabe, D. Orientation gradients and geometrically necessary dislocations in ultrafine grained dual-phase steels studied by 2D and 3D EBSD. Mater. Sci. Eng. A 2010, 527, 2738–2746. [Google Scholar] [CrossRef]
  209. Sarosiek, A.M.; Owen, W.S. The work hardening of dual-phase steels at small plastic strains. Mater. Sci. Eng. 1984, 66, 13–34. [Google Scholar] [CrossRef]
  210. Gopinath, K.; Gogia, A.K.; Kamat, S.V.; Ramamurty, U. Dynamic strain ageing in Ni-base superalloy 720Li. Acta Mater. 2009, 57, 1243–1253. [Google Scholar] [CrossRef]
  211. Sakthivel, T.; Laha, K.; Nandagopal, M.; Chandravathi, K.S.; Parameswaran, P.; Panneer Selvi, S.; Mathew, M.D.; Mannan, S.K. Effect of temperature and strain rate on serrated flow behaviour of Hastelloy X. Mater. Sci. Eng. A 2012, 534, 580–587. [Google Scholar] [CrossRef]
  212. Robinson, J.M.; Shaw, M.P. Microstructural and mechanical influences on dynamic strain aging phenomena. Int. Mater. Rev. 1994, 39, 113–122. [Google Scholar] [CrossRef]
  213. Choudhary, B.K. Influence of strain rate and temperature on serrated flow in 9Cr–1Mo ferritic steel. Mater. Sci. Eng. A 2013, 564, 303–309. [Google Scholar] [CrossRef]
  214. Worthington, P.J.; Brindley, B.J. Serrated yielding in substitutional alloys. Philos. Mag. A J. Theor. Exp. Appl. Phys. 1969, 19, 1175–1178. [Google Scholar] [CrossRef]
  215. Fu, S.; Zhang, Q.; Hu, Q.; Gong, M.; Cao, P.; Liu, H. The influence of temperature on the PLC effect in Al-Mg alloy. Sci. China Technol. Sci. 2011, 54, 1389. [Google Scholar] [CrossRef]
  216. Bharathi, M.S.; Lebyodkin, M.; Ananthakrishna, G.; Fressengeas, C.; Kubin, L.P. Multifractal burst in the spatiotemporal dynamics of jerky flow. Phys. Rev. Lett. 2001, 87, 4. [Google Scholar] [CrossRef] [Green Version]
  217. Fu, S.-H.; Cai, Y.-L.; Yang, S.-L.; Zhang, Q.-C.; Wu, X.-P. The mechanism of critical strain of serrated yielding in strain rate domain. Chin. Phys. Lett. 2016, 33, 026201. [Google Scholar]
  218. Yuan, B.; Li, J.-J.; Qiao, J.-W. Statistical analysis on strain-rate effects during serrations in a Zr-based bulk metallic glass. J. Iron Steel Res. Int. 2017, 24, 455–461. [Google Scholar] [CrossRef]
  219. Brechtl, J.; Wang, H.; Kumar, N.A.P.K.; Yang, T.; Lin, Y.R.; Bei, H.; Neuefeind, J.; Dmowski, W.; Zinkle, S.J. Investigation of the thermal and neutron irradiation response of BAM-11 bulk metallic glass. J. Nucl. Mater. 2019, 526, 151771. [Google Scholar] [CrossRef]
  220. Li, W.; Bei, H.; Tong, Y.; Dmowski, W.; Gao, Y.F. Structural heterogeneity induced plasticity in bulk metallic glasses: From well-relaxed fragile glass to metal-like behavior. Appl. Phys. Lett. 2013, 103, 171910. [Google Scholar] [CrossRef]
  221. Lebedkina, T.A.; Lebyodkin, M.A. Effect of deformation geometry on the intermittent plastic flow associated with the Portevin–Le Chatelier effect. Acta Mater. 2008, 56, 5567–5574. [Google Scholar] [CrossRef]
  222. Friedman, N.; Jennings, A.T.; Tsekenis, G.; Kim, J.-Y.; Tao, M.; Uhl, J.T.; Greer, J.R.; Dahmen, K.A. Statistics of dislocation slip avalanches in nanosized single crystals show tuned critical behavior predicted by a simple mean field model. Phys. Rev. Lett. 2012, 109, 1–5. [Google Scholar] [CrossRef]
  223. Lebedkina, T.A.; Lebyodkin, M.A.; Lamark, T.T.; Janeček, M.; Estrin, Y. Effect of equal channel angular pressing on the Portevin–Le Chatelier effect in an Al3Mg alloy. Mater. Sci. Eng. A 2014, 615, 7–13. [Google Scholar] [CrossRef]
  224. Lebyodkin, M.A.; Lebedkina, T.A. Multifractality and randomness in the unstable plastic flow near the lower strain-rate boundary of instability. Phys. Rev. E 2008, 77, 8. [Google Scholar] [CrossRef] [PubMed]
  225. Sarkar, A.; Chatterjee, A.; Barat, P.; Mukherjee, P. Comparative study of the Portevin-Le Chatelier effect in interstitial and substitutional alloy. Mater. Sci. Eng. A Struct. Mater. Prop. Microstruct. Process. 2007, 459, 361–365. [Google Scholar] [CrossRef] [Green Version]
  226. Costa, M.; Goldberger, A.L.; Peng, C.K. Multiscale entropy analysis of complex physiologic time series. Phys. Rev. Lett. 2002, 89, 068102. [Google Scholar] [CrossRef] [PubMed] [Green Version]
  227. Costa, M.; Goldberger, A.L.; Peng, C.K. Multiscale entropy analysis of biological signals. Phys. Rev. E 2005, 71, 021906. [Google Scholar] [CrossRef] [Green Version]
  228. Xia, J.A.; Shang, P.J. Multiscale entropy analysis of financial time series. Fluct. Noise Lett. 2012, 11, 12. [Google Scholar] [CrossRef]
  229. Costa, M.D.; Henriques, T.; Munshi, M.N.; Segal, A.R.; Goldberger, A.L. Dynamical glucometry: Use of multiscale entropy analysis in diabetes. Chaos 2014, 24, 5. [Google Scholar] [CrossRef] [Green Version]
  230. Pincus, S.M. Approximate entropy as a measure of system complexity. Proc. Natl. Acad. Sci. USA 1991, 88, 2297–2301. [Google Scholar] [CrossRef] [Green Version]
  231. Weinstein, M.; Hermalin, A.I.; Stoto, M.A. Population Health and Aging: Strengthening the Dialogue between Epidemiology and Demography; New York Academy of Sciences: New York, NY, USA, 2001. [Google Scholar]
  232. Yentes, J.M.; Hunt, N.; Schmid, K.K.; Kaipust, J.P.; McGrath, D.; Stergiou, N. The appropriate use of approximate entropy and sample entropy with short data sets. Ann. Biomed. Eng. 2013, 41, 349–365. [Google Scholar] [CrossRef]
  233. Volos, C.; Jafari, S.; Kengne, J.; Munoz-Pacheco, J.M.; Rajagopal, K. Nonlinear Dynamics and Entropy of Complex Systems with Hidden and Self-Excited Attractors; MDPI AG: Basel, Switzerland, 2019. [Google Scholar]
  234. Wu, S.-D.; Wu, C.-W.; Lin, S.-G.; Wang, C.-C.; Lee, K.-Y. Time series analysis using composite multiscale entropy. Entropy 2013, 15, 1069–1084. [Google Scholar] [CrossRef] [Green Version]
  235. Wu, S.-D.; Wu, C.-W.; Lin, S.-G.; Lee, K.-Y.; Peng, C.-K. Analysis of complex time series using refined composite multiscale entropy. Phys. Lett. A 2014, 378, 1369–1374. [Google Scholar] [CrossRef]
  236. Brechtl, J.; Xie, X.; Liaw, P.K.; Zinkle, S.J. Complexity modeling and analysis of chaos and other fluctuating phenomena. Chaos Solitons Fractals 2018, 116, 166–175. [Google Scholar] [CrossRef]
  237. Blons, E.; Arsac, L.M.; Gilfriche, P.; Deschodt-Arsac, V. Multiscale entropy of cardiac and postural control reflects a flexible adaptation to a cognitive task. Entropy 2019, 21, 1024. [Google Scholar] [CrossRef] [Green Version]
  238. Iliopoulos, A.C.; Nikolaidis, N.S.; Aifantis, E.C. Analysis of serrations and shear bands fractality in UFGs. J. Mech. Behav. Mater. 2015, 24, 1–9. [Google Scholar] [CrossRef]
  239. Heister, T.; Rebholz, L.G. Scientific Computing: For. Scientists and Engineers; De Gruyter: Berlin, Germany, 2015. [Google Scholar]
  240. Costa, M.D.; Goldberger, A.L. Generalized multiscale entropy analysis: Application to quantifying the complex volatility of human heartbeat time series. Entropy 2015, 17, 1197–1203. [Google Scholar] [CrossRef] [PubMed]
  241. Ihlen, E. Introduction to multifractal detrended fluctuation analysis in matlab. Front. Physiol. 2012, 3. [Google Scholar] [CrossRef] [PubMed] [Green Version]
  242. Lebyodkin, M.A.; Estrin, Y. Multifractal analysis of the Portevin-Le Chatelier effect: General approach and application to AlMg and AlMg/Al2O3 alloys. Acta Mater. 2005, 53, 3403–3413. [Google Scholar] [CrossRef]
  243. Lebyodkin, M.A.; Kobelev, N.P.; Bougherira, Y.; Entemeyer, D.; Fressengeas, C.; Lebedkina, T.A.; Shashkov, I.V. On the similarity of plastic flow processes during smooth and jerky flow in dilute alloys. Acta Mater. 2012, 60, 844–850. [Google Scholar] [CrossRef]
  244. Lebyodkin, M.A.; Lebedkina, T.A.; Jacques, A. Multifractal Analysis of Unstable Plastic Flow; Nova Science Publishers, Inc.: New York, NY, USA, 2009. [Google Scholar]
  245. Lebyodkin, M.A.; Lebedkina, T.A. Multifractal analysis of evolving noise associated with unstable plastic flow. Phys. Rev. E 2006, 73, 8. [Google Scholar] [CrossRef]
  246. Ren, J.L.; Chen, C.; Liu, Z.Y.; Li, R.; Wang, G. Plastic dynamics transition between chaotic and self-organized critical states in a glassy metal via a multifractal intermediate. Phys. Rev. B 2012, 86, 134303. [Google Scholar] [CrossRef] [Green Version]
  247. Aifantis, E.C. Chapter one—Internal Length Gradient (ILG) material mechanics across scales and disciplines. In Advances in Applied Mechanics; Bordas, S.P.A., Balint, D.S., Eds.; Elsevier: Amsterdam, The Netherlands, 2016; Volume 49, pp. 1–110. [Google Scholar]
  248. Salat, H.; Murcio, R.; Arcaute, E. Multifractal methodology. Physica A 2017, 473, 467–487. [Google Scholar] [CrossRef]
  249. Dahmen, K.A.; Uhl, J.T.; Wright, W.J. Why the crackling deformations of single crystals, metallic glasses, rock, granular materials, and the earth’s crust are so surprisingly similar. Front. Phys. 2019, 7. [Google Scholar] [CrossRef]
  250. Long, A.A.; Denisov, D.V.; Schall, P.; Hufnagel, T.C.; Gu, X.; Wright, W.J.; Dahmen, K.A. From critical behavior to catastrophic runaways: Comparing sheared granular materials with bulk metallic glasses. Granul. Matter 2019, 21, 99. [Google Scholar] [CrossRef] [Green Version]
  251. Denisov, D.V.; Lörincz, K.A.; Uhl, J.T.; Dahmen, K.A.; Schall, P. Universality of slip avalanches in flowing granular matter. Nat. Commun. 2016, 7, 10641. [Google Scholar] [CrossRef]
  252. Dahmen, K.A.; Ben-Zion, Y.; Uhl, J.T. A simple analytic theory for the statistics of avalanches in sheared granular materials. Nat. Phys. 2011, 7, 554–557. [Google Scholar] [CrossRef] [Green Version]
  253. Salje, E.K.H.; Saxena, A.; Planes, A. Avalanches in Functional Materials and Geophysics; Springer International Publishing: Berlin/Heidelberg, Germany, 2016. [Google Scholar]
  254. Egami, T.; Ojha, M.; Khorgolkhuu, O.; Nicholson, D.M.; Stocks, G.M. Local electronic effects and irradiation resistance in high-entropy alloys. JOM 2015, 67, 2345–2349. [Google Scholar] [CrossRef]
  255. Falk, M.L.; Langer, J.S. Deformation and failure of amorphous, solidlike materials. Annu. Rev. Condens. Matter Phys. 2011, 2, 353–373. [Google Scholar] [CrossRef] [Green Version]
  256. Dahmen, K.A.; Ben-Zion, Y.; Uhl, J.T. Micromechanical model for deformation in solids with universal predictions for stress-strain curves and slip avalanches. Phys. Rev. Lett. 2009, 102, 175501. [Google Scholar] [CrossRef] [Green Version]
  257. Bian, X.L.; Wang, G.; Chan, K.C.; Ren, J.L.; Gao, Y.L.; Zhai, Q.J. Shear avalanches in metallic glasses under nanoindentation: Deformation units and rate dependent strain burst cut-off. Appl. Phys. Lett. 2013, 103, 101907. [Google Scholar] [CrossRef]
  258. Toker, D.; Sommer, F.T.; D’Esposito, M. A simple method for detecting chaos in nature. Commun. Biol. 2020, 3, 11. [Google Scholar] [CrossRef] [Green Version]
  259. Xu, T.; Scaffidi, T.; Cao, X. Does scrambling equal chaos? Phys. Rev. Lett. 2020, 124, 140602. [Google Scholar] [CrossRef] [Green Version]
  260. Brechtl, J.; Xie, X.; Liaw, P.K. Investigation of chaos and memory effects in the Bonhoeffer-van der Pol oscillator with a non-ideal capacitor. Commun. Nonlinear Sci. Numer. Simul. 2019, 73, 195–216. [Google Scholar] [CrossRef] [Green Version]
  261. Sekikawa, M.; Shimizu, K.; Inaba, N.; Kita, H.; Endo, T.; Fujimoto, K.; Yoshinaga, T.; Aihara, K. Sudden change from chaos to oscillation death in the Bonhoeffer-van der Pol oscillator under weak periodic perturbation. Phys. Rev. E 2011, 84, 8. [Google Scholar] [CrossRef] [PubMed]
  262. Kousaka, T.; Ogura, Y.; Shimizu, K.; Asahara, H.; Inaba, N. Analysis of mixed-mode oscillation-incrementing bifurcations generated in a nonautonomous constrained Bonhoeffer-van der Pol oscillator. Phys. D Nonlinear Phenom. 2017, 353, 48–57. [Google Scholar] [CrossRef]
  263. Krishnamurthy, V. Predictability of weather and climate. Earth Space Sci. 2019, 6, 1043–1056. [Google Scholar] [CrossRef] [PubMed] [Green Version]
  264. Selvam, A. Chaotic Climate Dynamics; Luniver Press: London, UK, 2007. [Google Scholar]
  265. Buizza, R. Chaos and weather prediction a review of recent advances in numerical weather prediction Ensemble forecasting and adaptive observation targeting. Nuovo Cim. C 2001, 24, 273–301. [Google Scholar]
  266. Korn, H.; Faure, P. Is there chaos in the brain? II. Experimental evidence and related models. C. R. Biol. 2003, 326, 787–840. [Google Scholar] [CrossRef]
  267. Destexhe, A. Oscillations, complex spatiotemporal behavior, and information transport in networks of excitatory and inhibitory neurons. Phys. Rev. E 1994, 50, 1594–1606. [Google Scholar] [CrossRef]
  268. Tavares, B.S.; de Paula Vidigal, G.; Garner, D.M.; Raimundo, R.D.; de Abreu, L.C.; Valenti, V.E. Effects of guided breath exercise on complex behaviour of heart rate dynamics. Clin. Physiol. Funct. Imaging 2017, 37, 622–629. [Google Scholar] [CrossRef]
  269. Kaizoji, T. Intermittent chaos in a model of financial markets with heterogeneous agents. Chaos Solitons Fractals 2004, 20, 323–327. [Google Scholar] [CrossRef] [Green Version]
  270. Tiwari, A.K.; Gupta, R. Chaos in G7 stock markets using over one century of data: A note. Res. Int. Bus. Financ. 2019, 47, 304–310. [Google Scholar] [CrossRef]
  271. Tsionas, M.G.; Michaelides, P.G. Neglected chaos in international stock markets: Bayesian analysis of the joint return–volatility dynamical system. Phys. A Stat. Mech. Its Appl. 2017, 482, 95–107. [Google Scholar] [CrossRef]
  272. Nepomuceno, E.G.; Perc, M. Computational chaos in complex networks. J. Complex Netw. 2019, 8. [Google Scholar] [CrossRef]
  273. Bharathi, M.S.; Lebyodkin, M.; Ananthakrishna, G.; Fressengeas, C.; Kubin, L.P. The hidden order behind jerky flow. Acta Mater. 2002, 50, 2813–2824. [Google Scholar] [CrossRef] [Green Version]
  274. Panday, P.; Samanta, S.; Pal, N.; Chattopadhyay, J. Delay induced multiple stability switch and chaos in a predator–prey model with fear effect. Math. Comput. Simul. 2020, 172, 134–158. [Google Scholar] [CrossRef]
  275. Ruxton, G.D. Chaos in a three-species food chain with a lower bound on the bottom population. Ecology 1996, 77, 317–319. [Google Scholar] [CrossRef]
  276. Telesh, I.V.; Schubert, H.; Joehnk, K.D.; Heerkloss, R.; Schumann, R.; Feike, M.; Schoor, A.; Skarlato, S.O. Chaos theory discloses triggers and drivers of plankton dynamics in stable environment. Sci. Rep. 2019, 9, 20351. [Google Scholar] [CrossRef] [Green Version]
  277. Ananthakrishna, G.; Valsakumar, M.C. Chaotic flow in a model for repeated yielding. Phys. Lett. A 1983, 95, 69–71. [Google Scholar] [CrossRef]
  278. Lorenz, E.N. Deterministic nonperiodic flow. J. Atmos. Sci. 1963, 20, 130–141. [Google Scholar] [CrossRef] [Green Version]
  279. Barreira, L. Lyapunov Exponents; Springer: Berlin/Heidelberg, Germany, 2017. [Google Scholar]
  280. Wolf, A.; Swift, J.B.; Swinney, H.L.; Vastano, J.A. Determining lyapunov exponents from a time series. Phys. D Nonlinear Phenom. 1985, 16, 285–317. [Google Scholar] [CrossRef] [Green Version]
  281. Oliver, W.C.; Pharr, G.M. Nanoindentation in materials research: Past, present, and future. MRS Bull. 2010, 35, 897–907. [Google Scholar] [CrossRef]
  282. Schuh, C.A. Nanoindentation studies of materials. Mater. Today 2006, 9, 32–40. [Google Scholar] [CrossRef]
  283. Qiao, J.W.; Zhang, Y.; Liaw, P.K. Serrated flow kinetics in a Zr-based bulk metallic glass. Intermetallics 2010, 18, 2057–2064. [Google Scholar] [CrossRef]
  284. Chan, P.Y.; Tsekenis, G.; Dantzig, J.; Dahmen, K.A.; Goldenfeld, N. Plasticity and dislocation dynamics in a phase field crystal model. Phys. Rev. Lett. 2010, 105, 015502. [Google Scholar] [CrossRef] [PubMed]
  285. Xia, S.Q.; Zhang, Y. Deformation mechanisms of Al0.1CoCrFeNi high entropy alloy at ambient and cryogenic temperatures. Mater. Sci. Eng. A Struct. Mater. Prop. Microstruct. Process. 2018, 733, 408–413. [Google Scholar] [CrossRef]
  286. Gerold, V.; Karnthaler, H.P. On the origin of planar slip in f.c.c. alloys. Acta Metall. 1989, 37, 2177–2183. [Google Scholar] [CrossRef]
  287. Qiang, J.; Tsuchiya, K.; Diao, H.Y.; Liaw, P.K. Vanishing of room-temperature slip avalanches in a face-centered-cubic high-entropy alloy by ultrafine grain formation. Scr. Mater. 2018, 155, 99–103. [Google Scholar] [CrossRef]
  288. Zhang, L.; Ohmura, T. Plasticity initiation and evolution during nanoindentation of an iron--3% silicon crystal. Phys. Rev. Lett. 2014, 112, 145504. [Google Scholar] [CrossRef]
  289. Wang, L.; Bei, H.; Li, T.L.; Gao, Y.F.; George, E.P.; Nieh, T.G. Determining the activation energies and slip systems for dislocation nucleation in body-centered cubic Mo and face-centered cubic Ni single crystals. Scr. Mater. 2011, 65, 179–182. [Google Scholar] [CrossRef]
  290. Daoud, H.M.; Manzoni, A.M.; Wanderka, N.; Glatzel, U. High-temperature tensile strength of Al10Co25Cr8Fe15Ni36Ti6 compositionally complex alloy (high-entropy alloy). JOM 2015, 67, 2271–2277. [Google Scholar] [CrossRef]
  291. Lu, Y.; Dong, Y.; Guo, S.; Jiang, L.; Kang, H.; Wang, T.; Wen, B.; Wang, Z.; Jie, J.; Cao, Z.; et al. A promising new class of high-temperature alloys: Eutectic high-entropy alloys. Sci. Rep. 2014, 4, 6200. [Google Scholar] [CrossRef]
  292. Basu, I.; Ocelik, V.; De Hosson, J.T.M. Size dependent plasticity and damage response in multiphase body centered cubic high entropy alloys. Acta Mater. 2018, 150, 104–116. [Google Scholar] [CrossRef]
  293. Fischer-Cripps, A.C. Nanoindentation; Springer: New York, NY, USA, 2013. [Google Scholar]
  294. Cottrell, A.H. LXXXVI. A note on the Portevin-Le chatelier effect. Lond. Edinb. Dublin Philos. Mag. J. Sci. 1953, 44, 829–832. [Google Scholar] [CrossRef]
  295. Yang, Y.; Ma, L.; Gan, G.-Y.; Wang, W.; Tang, B.-Y. Investigation of thermodynamic properties of high entropy (TaNbHfTiZr)C and (TaNbHfTiZr)N. J. Alloy. Compd. 2019, 788, 1076–1083. [Google Scholar] [CrossRef]
  296. Laktionova, M.A.; Tabchnikova, E.D.; Tang, Z.; Liaw, P.K. Mechanical properties of the high-entropy alloy Ag0.5CoCrCuFeNi at temperatures of 4.2–300 K. Low Temp. Phys. 2013, 39, 630–632. [Google Scholar] [CrossRef]
  297. Mohamed, F.A.; Murty, K.L.; Langdon, T.G. The portevin-le chatelier effect in Cu3Au. Acta Metall. 1974, 22, 325–332. [Google Scholar] [CrossRef]
  298. Sridharan, S. Delamination Behaviour of Composites; Elsevier Science: Cambridge, UK, 2008. [Google Scholar]
  299. Tirunilai, A.S.; Sas, J.; Weiss, K.-P.; Chen, H.; Szabó, D.V.; Schlabach, S.; Haas, S.; Geissler, D.; Freudenberger, J.; Heilmaier, M.; et al. Peculiarities of deformation of CoCrFeMnNi at cryogenic temperatures. J. Mater. Res. 2018, 33, 3287–3300. [Google Scholar] [CrossRef] [Green Version]
  300. Sonkusare, R.; Jain, R.; Biswas, K.; Parameswaran, V.; Gurao, N.P. High strain rate compression behaviour of single phase CoCuFeMnNi high entropy alloy. J. Alloy. Compd. 2020, 823, 153763. [Google Scholar] [CrossRef]
  301. Chen, S.Y.; Wang, L.; Li, W.D.; Tong, Y.; Tseng, K.K.; Tsai, C.W.; Yeh, J.W.; Ren, Y.; Guo, W.; Poplawsky, J.D.; et al. Peierls barrier characteristic and anomalous strain hardening provoked by dynamic-strain-aging strengthening in a body-centered-cubic high-entropy alloy. Mater. Res. Lett. 2019, 7, 475–481. [Google Scholar] [CrossRef]
  302. Hähner, P. On the physics of the Portevin-Le Châtelier effect part 1: The statistics of dynamic strain ageing. Mater. Sci. Eng. A 1996, 207, 208–215. [Google Scholar] [CrossRef]
  303. Tian, Q.; Zhang, G.; Yin, K.; Wang, L.; Wang, W.; Cheng, W.; Wang, Y.; Huang, J.C. High temperature deformation mechanism and microstructural evolution of relatively lightweight AlCoCrFeNi high entropy alloy. Intermetallics 2020, 119, 106707. [Google Scholar] [CrossRef]
  304. Xu, J.; Cao, C.-m.; Gu, P.; Peng, L.-m. Microstructures, tensile properties and serrated flow of AlxCrMnFeCoNi high entropy alloys. Trans. Nonferrous Met. Soc. China 2020, 30, 746–755. [Google Scholar] [CrossRef]
  305. Suzuki, T.; Takeuchi, S.; Yoshinaga, H. Dislocation Dynamics and Plasticity; Springer: Berlin/Heidelberg, Germany, 2013. [Google Scholar]
  306. Isayev, O.; Tropsha, A.; Curtarolo, S. Materials Informatics: Methods, Tools, and Applications; Wiley: Berlin, Germany, 2019. [Google Scholar]
  307. Pagan, D.C.; Phan, T.Q.; Weaver, J.S.; Benson, A.R.; Beaudoin, A.J. Unsupervised learning of dislocation motion. Acta Mater. 2019, 181, 510–518. [Google Scholar] [CrossRef]
  308. Shen, C.; Wang, C.; Wei, X.; Li, Y.; van der Zwaag, S.; Xu, W. Physical metallurgy-guided machine learning and artificial intelligent design of ultrahigh-strength stainless steel. Acta Mater. 2019, 179, 201–214. [Google Scholar] [CrossRef]
  309. Morand, L.; Helm, D. A mixture of experts approach to handle ambiguities in parameter identification problems in material modeling. Comput. Mater. Sci. 2019, 167, 85–91. [Google Scholar] [CrossRef]
  310. Salmenjoki, H.; Alava, M.J.; Laurson, L. Machine learning plastic deformation of crystals. Nat. Commun. 2018, 9, 5307. [Google Scholar] [CrossRef] [PubMed]
Figure 1. An illustration of the lattice distortion in an element, a conventional alloy, and a high-entropy alloy (adapted from Reference [14]).
Metals 10 01101 g001
Figure 2. An Ashby plot that compares the fracture toughness and yield strength of HEAs with several other materials and bulk metallic glasses (reproduced from Reference [46] with permission).
Metals 10 01101 g002
Figure 3. Endurance limits of the Al0.5CoCrCuFeNi HEA as a function of the ultimate tensile strength, compared with other structural materials and bulk metallic glasses (BMGs) (reproduced from Reference [68] with permission).
Metals 10 01101 g003
Figure 4. High-magnification light micrographs of the (a) primary and secondary serrations of the distal heel of the Galeocerdo cuvier shark tooth (scale bar of 2 mm), and (b) the primary serrations of the cutting edge of the Prionace glauca shark tooth (scale bar of 2 mm) (reproduced from Reference [70] with permission).
Metals 10 01101 g004
Figure 5. Magnetic Barkhausen noise, as illustrated by irreversible discontinuities in the magnetization, M, as the alternative current magnetic field, H, is varied (adapted from Reference [71]).
Metals 10 01101 g005
Figure 6. Electroencephalographic recordings during different brain states in humans, which include awake with eyes open, awake with eyes closed, sleep stage 2, sleep stage 4, rapid eye movement (REM) sleep state, and epileptic seizure (adapted from Reference [92]).
Metals 10 01101 g006
Figure 7. The number of publications that discuss the serrated-flow phenomenon in high-entropy alloys for years ranging from 2011 to July 2020, as determined from the Web of Science publication database.
Metals 10 01101 g007
Figure 8. An illustration of the serration process that occurs due to the pinning and unpinning of solute atoms by dislocations. Each numbered section corresponds to the different interactions between the solutes and dislocations during the serration event as follows: (I) the solute atoms pin a moving dislocation, which corresponds to the onset of the serration; (II) the dislocation remains pinned as the stress increases; (III) enough stress builds up, and the dislocation escapes; and (IV) the solute atoms catch and re-pin the dislocation (adapted from Reference [152]).
Metals 10 01101 g008
Figure 9. An illustration of the serration process that occurs due to the flow defect accumulation in a BMG during compression. Each numbered section corresponds to the evolution of the flow unit and glassy matrix during the serration event as follows: (I) activation of flow units in liquid-like regions under an applied stress, (II) growth and coalescence of the liquid-like cites with adjacent cites with an increase in stress, (III) initiation of a shear band when a critical stress is reached, and (IV) a drop in the stress that is accompanied by shear-band arrest and subsequent restoration of the glassy matrix in the shear plane (adapted from Reference [197]).
Metals 10 01101 g009
Figure 10. The five types of serrations that can occur during mechanical testing (adapted from References [180,182].
Metals 10 01101 g010
Figure 11. (a) Tensile curves for the unirradiated annealed V-4Cr-4Ti at a strain rate of 10−3 s−1 and (b) tensile curves for V-4Cr-4Ti irradiated to 0.5 dpa at 110–420 °C and to 0.1 dpa at 505 °C. The curves were offset on the strain axis for clarity (reproduced from Reference [117] with permission).
Metals 10 01101 g011
Figure 12. Temperature and strain rate dependence of the serrated flow in the Al-5Mg (at.%) alloy that occurs during Lüders-band formation (reproduced with permission from Reference [8,212].
Metals 10 01101 g012
Figure 13. Mean sample entropy of the colored noise data and 1 ≤ τ ≤ 30 plotted with the colored noise plots for brown (β = 2), pink (or 1/f with β = 1), and white (β = 0) (adapted from Reference [131]).
Metals 10 01101 g013
Figure 14. Stress vs. strain graph for the Al0.5CoCrCuFeNi HEA samples tested at strain rates of (a) 2 × 10⁻³ s−1, (b) 2 × 10⁻⁴ s−1, and (c) 5 × 10⁻⁵ s−1 and temperatures of 400–600 °C (reproduced from Reference [180] with permission).
Metals 10 01101 g014
Figure 15. Sample entropy vs. scale factor for the Al0.5CoCrCuFeNi HEA samples tested at strain rates of (a) 2 × 10⁻³ s−1, (b) 2 × 10⁻⁴ s−1, and (c) 5 × 10⁻⁵ s−1 and temperatures of 400–600 °C, where the sample entropy was plotted for scale factors ranging from 1 to 20 (reproduced from Reference [180] with permission).
Metals 10 01101 g015
Figure 16. The multifractal spectra (f(α) vs. α) for the Al0.5CoCrCuFeNi HEA samples tested at strain rates of (a) 2 × 10⁻³ s−1, (b) 2 × 10⁻⁴ s−1, and (c) 5 × 10⁻⁵ s−1 and temperatures of 400–600 °C, where the sample entropy was plotted for scale factors ranging from 1 to 20. (Results reproduced from Reference [180] with permission.)
Metals 10 01101 g016
Figure 17. (a,b) The dark and bright field TEM image of the Al0.5CoCrCuFeNi HEA deformed at 600 °C. (c,d) The high-resolution TEM (HRTEM) images orientating in the (001) zone axis and the corresponding electron-diffraction pattern. Zoom-in images show the structure of the ordered L12 phase (reproduced from Reference [155] with permission).
Metals 10 01101 g017
Figure 18. Nanoindentation pop-in behavior of the Al0.5CoCrCuFeNi HEA tested at room temperature (RT) and 200 °C (reproduced from Reference [157] with permission).
Metals 10 01101 g018
Figure 19. Depth-time curves for the nanoindentation of the Al0.5CoCrCuFeNi HEA with the holding times of 5, 10, and 20 s at RT and 200 °C (from Reference [154]).
Metals 10 01101 g019
Figure 20. The largest Lyapunov exponent, λ1, and approximate entropy, ApEn, for the holding times of 5, 10, and 20 s at RT and 200 °C (reproduced from Reference [154]).
Metals 10 01101 g020
Figure 21. (a) Compressive stress–strain curves for the Al0.5CoCrCuFeNi HEA at temperatures ranging from 7 to 9 K, at a strain rate of 4 × 10⁻⁴ s−1, and (b) the CCDF for the Al0.5CoCrCuFeNi HEA (reproduced from Reference [167] with permission).
Metals 10 01101 g021
Figure 22. TEM bright field images of the Al0.1CoCrFeNi alloy tested at (a) 25 °C (298 K), which indicates that there is a tendency toward the dislocation-cell formation when the strain reaches 50%, (b) −73 °C (200 K), with the (111)-type slip plane, (c) −196 °C (77 K), which displays nanotwins, and (d) the corresponding high-resolution TEM image for (c) that displays the region where two deformation twins with a thickness of about 2 nm are located. The selected area electron diffraction patterns and fast Fourier transform (zone axis (110)) are also displayed (reproduced from Reference [285] with permission).
Metals 10 01101 g022
Figure 23. The stress vs. strain curve for the in situ TEM nanopillar compression tests for the Al0.1CoCrFeNi HEA (reproduced from Reference [160]).
Metals 10 01101 g023
Figure 24. The in situ nanomechanical indentation and TEM results for the Al0.1CoCrFeNi HEA in terms of the (a) stress vs. time data (stages I, II, and III labeled in the figure), the TEM imaging results for the serrations that occurred during (b) stage I, (c) stage II, and (d) stage III (with color-coded deformation stages), and (e) the SEM image of the deformed nanopillar that confirms that large crystal-slip ensued during the experiment (reproduced from Reference [160]).
Metals 10 01101 g024
Figure 25. (a) The plots of the stress-binned CCDF of slip sizes as a function of the stress level over the maximum stress samples with diameters ranging from ~512 to 655 nm, compressed at a strain rate of 1 × 10⁻³ s−1 and with similar load–displacement characteristic. (b) The scaling collapse of the same data with the predicted scaling function (reproduced from Reference [160]).
Metals 10 01101 g025
Figure 26. Stress vs. strain curves for the Al0.3CoCrFeNi and CoCrFeNi single crystals that were compressed at temperatures ranging from 93 to 1273 K (from −180 to 1000 °C) (reproduced from Reference [191] with permission).
Metals 10 01101 g026
Figure 27. (a) True stress–strain curves of the Al0.3CoCrFeNi HEA tested at temperatures ranging from 400 to 900 °C and a strain rate of 10−3 s−1, and the magnified regions of the serrations at temperatures of (b) 600 °C, (c) 700 °C, and (d) 800 °C (reproduced from Reference [169] with permission).
Metals 10 01101 g027
Figure 28. (a) Depth change of each pop-in event (Δh) as a function of indentation depth (h) and (b) the cumulative-probability distribution of the strain-burst size of the as-cast Al0.3CrCoFeNi HEA (reproduced from Reference [287] with permission).
Metals 10 01101 g028
Figure 29. The tensile true stress–strain curves for the Al0.5CoCrFeNi HEA tested at temperatures of 200–500 °C and strain rates of (a) 10−3 s−1 where selected regions of the corresponding dynamic strain aging (DSA) curve are in (a1), (a2), and (b) 5 × 10⁻⁴ s−1 where selected regions of the corresponding DSA curve are in (b1), and (c) 10−4 s−1 where selected regions of the corresponding DSA curve are in (c1) and (c2) (reproduced from Reference [94] with permission).
Metals 10 01101 g029
Figure 30. The engineering stress–strain curves for the (a) CoCrFeNi and (b) Al0.5CoCrFeNi HEAs during compression at a strain rate 10−3 s−1 and temperature of 400 °C (reproduced from Reference [94] with permission).
Metals 10 01101 g030
Figure 31. The (a) load vs. displacement curves for four different indents that were made inside the body-centered-cubic (BCC) grain in the HEA over indentation depths of 0 to 500 nm, and the (b) highlighted region, which shows the data for two randomly selected indent curves. Here, the graph features the elastic to plastic transition and contains multiple pop-ins (reproduced from Reference [292] with permission).
Metals 10 01101 g031
Figure 32. The engineering stress vs. engineering strain for the AlxNbTiMoV (x = 0, 0.2, 0.5, 0.75, 1, and 1.5) HEAs (reproduced from Reference [179]).
Metals 10 01101 g032
Figure 33. (a) Stress vs. displacement curves for the Al5Cr12Fe35Mn28Ni20 HEA tension tested at temperatures of 573 and 673 K, at a strain rate of 1 × 10⁻⁴ s−1 and (b) the results of the CCDF analysis for the serration events for the Al5Cr12Fe35Mn28Ni20 HEA in tension experiments under a constant strain rate of 1 × 10⁻⁴ s-1 (reproduced from Reference [167] with permission).
Metals 10 01101 g033
Figure 34. The stress–strain curves for the Ag0.5CoCrCuFeNi HEA that was undergoing tension testing at temperatures ranging from 4.2 to 300 K, at a strain rate of 4 × 10⁻⁴ s−1. The inset displays a close-up of the serrated flow that occurred in the specimens tested at 4.2 and 7.5 K. (Reproduced from Reference [296] with permission).
Metals 10 01101 g034
Figure 35. Stress vs. strain curves for the CoCrFeMnNi HEA tension tested at a strain rate of 1 × 10⁻⁴ s−1 and temperatures of 300–600 °C (reproduced from Reference [181]).
Metals 10 01101 g035
Figure 36. (a) Engineering stress–strain curves for the CoCrFeMnNi HEA performed at temperatures ranging from RT to 800 °C and a strain rate of 3 × 10⁻⁴ s−1 and (b) the partially enlarged segments for the curves that exhibited serrations (reproduced from Reference [163] with permission).
Metals 10 01101 g036
Figure 37. (a) The engineering stress vs. engineering strain curves for the sample tested at strain rates ranging from 1.0 × 10⁻⁵ to 5.0 × 10⁻³ s−1, at a temperature of 500 °C. (b) The enlarged regions of (a) for engineering strain values ranging from 0.34 to 0.38 (reproduced from Reference [163] with permission).
Metals 10 01101 g037
Figure 38. Graphs of the engineering stress–strain behavior for the recrystallized (900 °C, 1 h) and cold-rolled CoCrFeMnNi HEA with a rolling ratio of (a) 40%, (b) 30%, and (c) 20% (reproduced from Reference [168] with permission).
Metals 10 01101 g038
Figure 39. Compressive true stress–strain curves of the CoCrFeMnNi HEA at loading rates that varied from 1200 to 2800 s−1 (reproduced from Reference [166] with permission).
Metals 10 01101 g039
Figure 40. The stress–strain curves for the (a) CoCrFeMnNi HEA under tensile load at RT, 77, and 4.2 K. (b) CoCrFeMnNi HEA and pure Cu at 4.2 K (reproduced from Reference [299] with permission).
Metals 10 01101 g040
Figure 41. The engineering stress vs. strain curves for the CoCrFeMnNi HEA compressed at strain rates ranging from 6 × 10⁻⁵ to 1 × 10⁻³ s−1 at 8 K (reproduced from Reference [299] with permission).
Metals 10 01101 g041
Figure 42. (a) True stress–true strain curves for CoCrFeMnNi HEA tested with and without carbon doping. The (b) enlarged image of the true stress–true strain curve and strain hardening rate–true strain curve in the strain range of 17.5–33.5% for the carbon-doped HEA. (Reproduced from Reference [192] with permission.)
Metals 10 01101 g042
Figure 43. True stress–true strain plots at different temperatures and strain rates of (a) 10−1 and (b) 10−3 s−1 (reproduced from Reference [162] with permission).
Metals 10 01101 g043
Figure 44. The true stress vs. true strain for the CoCuFeMnNi HEA compression tested at strain rates of 10−3 s−1 and 3 × 10³ s−1 (reproduced from Reference [300] with permission).
Metals 10 01101 g044
Figure 45. The results of the (a) optical microscopy imaging, (b) XRD characterization, (c) TEM image, and (d) selected area electron diffraction results for the CoCrFeNi HEA (reproduced from Reference [159] with permission).
Metals 10 01101 g045
Figure 46. The engineering stress vs. engineering strain curves for the CoCrFeNi HEA tested at temperatures ranging from 4.2 to 293 K and a strain rate of 10−3 s−1. The inset displays a magnification of the serrated flow behavior from the specimen tested at 4.2 K. The inset at the bottom-right portion of the figure displays a photograph of the dog-bone-shaped samples, before and after tensile tests. (Reproduced from [159] with permission.)
Metals 10 01101 g046
Figure 47. The engineering stress vs. engineering strain for the BCC HfNbTaTiZr HEA that was tested at temperatures ranging from 77 to 673 K, at a strain rate of 1 × 10⁻⁴ s−1 (reproduced from Reference [301] with permission).
Metals 10 01101 g047
Figure 48. A graphical representation of the reported results that are listed in Table 8 for serration Types (a) A, (b) B, (c) C, (d) A + B, and (e) B + C.
Metals 10 01101 g048
Figure 49. Basic schematics of the extent of serrations as a function of (a) temperature and (b) strain rate.
Metals 10 01101 g049aMetals 10 01101 g049b
Table 1. Some of the underlying mechanisms of the serrated flow in crystalline and amorphous alloys.
Material SystemSerration Mechanism
Crystalline Alloys
(including HEAs)
Dislocation pinning by solute atoms or nanoparticles, mechanical twinning, order–disorder transformations, phase transformations, yielding across fracture surfaces.
Amorphous Alloys (BMGs)Excess free volume generation, flow defect and liquid-like site agglomeration, shear band initiation and propagation.
Table 2. Strain rates, test temperatures, and serration types for the Al0.5CoCrCuFeNi HEA that underwent compression testing (from Reference [180]).
Strain Rate (s−1)Temperature (°C)Serration Type
5 × 10−5400A
500B
600C
2 × 10−4400A
500B
600C
2 × 10−3400A
500A
600C
Table 3. Summary of the serration type exhibited by the Al0.3CoCrFeNi HEA during tension at a strain rate of 1 × 10⁻³ s−1 and temperatures of 400–800 °C (from Reference [169]).
Strain Rate (s−1)Temperature (°C)Serration Type
1 × 10−3400C
500C
600C
700B + C
800B
Table 4. Strain rates, test temperatures, and serration types for the Al0.5CoCrCuFeNi HEA during tension testing (from Reference [94]).
Strain Rate (s−1)Temperature (°C)Serration Type
1 × 10−4200A
300A + B
400B + C
5 × 10−4300A
400A + B
1 × 10−3300A
400A + B
500B + C
Table 5. Summary of the serration type exhibited by the CoCrFeMnNi HEA during tension at strain rates from 1 × 10⁻⁴ to 1 × 10⁻² s−1 and temperatures of 300–600 °C (from Reference [153]).
Strain Rate (s−1)Temperature (°C)Serration Type
1 × 10−4300A
400B
500B
600C
1 × 10−3300A
400A
500B
600B
1 × 10−2400A
500A
600A
Table 6. Summary of the serration type exhibited by the CoCrFeMnNi HEA during tension at strain rates of 1 × 10⁻⁵ s−1–5 × 10⁻³ s−1 and temperatures of 300–600 °C (from Reference [163]).
Strain Rate (s−1)Temperature (°C)Serration Type
1 × 10−5500B + C
1 × 10⁻⁴B
3 × 10−4300A
400A + B
500B
550B + C
600C
1 × 10−3500A + B
5 × 10⁻³A
Table 7. Summary of the serration type exhibited by the CoCuFeNiTi HEA during compression at strain rates of 1 × 10⁻³ s−1–5 × 10⁻¹ s−1 and temperatures of 800–1000 °C (from Reference [162]).
Strain Rate (s−1)Temperature (°C)Serration Type
1 × 10−3800A + B
900A + B
950B
1000B
1 × 10−1800A
900A + B
950A + B
1000A + B
Table 8. Reported serration type, as found from the literature, for Type-A, Type-B, Type-C, Type-A + Type-B, and Type-B + Type-C for different HEAs tested in a range of strain rates and temperatures. RT: room temperature.
AlloyTest TypeStrain Rate (s−1)Temperature (°C)Serration TypeSource
CoCrFeMnNiTension1 × 10−4300A[153]
400B
500B
600C
1 × 10−3300A
400A
500B
600B
1 × 10−2400A
500A
600A
CoCrFeMnNiTension1 × 10−5500B + C[163]
1 × 10⁻⁴B
3 × 10−4300A
400A + B
500B
550B + C
600C
1 × 10−3500A + B
5 × 10⁻³A
CoCrFeMnNi
(C ~0.9 at.%)
Tension1.6 × 10−3RTA[192]
CoCuFeNiTiCompression1 × 10−3800A + B[162]
900A + B
950B
1000B
1 × 10−1800A
900A + B
950A + B
1000A + B
Al0.5CoCrCuFeNiCompression5 × 10−5400A[180]
500B
600C
2 × 10−4400A
500B
600C
2 × 10−3400A
500A
600C
Al0.3CoCrFeNiCompression1 × 10−3400C[169]
500C
600C
700B + C
800B
Al0.5CoCrFeNiTension1 × 10−4200A[94]
300A + B
400B + C
5 × 10−4300A
400A + B
1 × 10−3300A
400A + B
500B + C
AlCoCrFeNiCompression1 × 10−31100C[303]
1B
Al0.4CrMnFeCoNiTension3 × 10−4300A + B[304]
400B
500B + C
600C
Al0.5CrMnFeCoNiTension3 × 10−4300A + B[304]
400B
500B + C
Al0.6CrMnFeCoNiTension3 × 10−4300A + B[304]
400B
500C

