Article

Fatigue Life Assessment of Revised Cope-Hole Details in Steel Truss Bridges

1
School of Civil Engineering, Putian University, Putian 351100, China
2
Faculty of Civil Engineering and Mechanics, Kunming University of Science and Technology, Kunming 650500, China
3
Earthquake Engineering Research Center of Yunnan, Kunming 650500, China
4
College of Civil Engineering, Taiyuan University of Technology, Taiyuan 030024, China
*
Authors to whom correspondence should be addressed.
Metals 2020, 10(8), 1092; https://doi.org/10.3390/met10081092
Submission received: 10 July 2020 / Revised: 4 August 2020 / Accepted: 11 August 2020 / Published: 12 August 2020
(This article belongs to the Special Issue Fatigue Life Assessment under Random Loadings)

Abstract

:
In recent years, various welded details with complex local structure, ambiguous fatigue performance have appeared in fully welded steel truss bridges, however, they are not covered in the current design specifications. In order to study the fatigue performance of revised cope-hole details, fatigue performance experiments were designed and carried out on three specimens of revised detail with the same dimensions but subjected to different stress amplitude. Local finite element model of the revised cope-hole detail was established for further stress analysis. The results of finite element analysis were basically consistent with the static test results at majority of measurement points. Based on the existing fatigue test data and fatigue strength of cope-hole details defined in Eurocode and JSSC design code, the fatigue performance of revised cope-hole details was evaluated. The S-N fitting curve with the failure probability of 2.3% was obtained from the fatigue experiment results. The fatigue stress amplitude was 59.5 MPa when fatigue loading cycle was 2 × 10⁶. It can be concluded that the fatigue performance of revised cope-hole detail was better than that of previous welded detail, which indicated that the revised detail had a significant improvement.

1. Introduction

Steel bridge has been widely used in bridge construction because its significant advantages of superior spanning capacity, light weight, lower construction cost, fast construction speed, and less maintenance, etc. Because of the rolling capacity of steel manufacturing process, long H-beams for steel truss girder are obtained from short steel plates using butt weld. However, the butt weld of flange and web plates may appear intersection welds during this process. For the non-continuous welding, there are some arc extinguishing points, which can easily cause the local stress concentration. In addition, the fatigue crack initiates at these points, it leads to significant reduction in the fatigue resistance of welded details [1]. To avoid the intersection welds of web and flange in the H-beams and minimize the stress concentration, cope-hole details have been exactingly used in the web, as shown in Figure 1.
To study the fatigue performance of previous cope-hole welded details, a lot of theoretical and experimental studies have been done [2,3,4,5,6,7,8,9,10,11]. Fatigue strength and local stresses for cope-hole details were investigated in the literature [12,13,14]. The weld ends modeling of welded details with cope-hole was studied in the literature [15]. Fatigue performance experiments of three sets of specimens were carried out to evaluate the fatigue performance of existing welded detail [6,7]. Their testing results indicated that the S-N fitting curve equation was lgN = 11.55−3lgΔσ, with the failure probability of 2.3% [16]. The fatigue stress amplitude corresponding to cyclic number of N = 2 × 10⁶ was 54.1 MPa. However, the fatigue design provisions of revised cope-hole detail (as depicted in Figure 2) are not covered in the current fatigue design codes of steel structure. In terms of the geometry structure (there are some similar welded details that can be found in the Eurocode3 [17]) and fatigue specification of the International Institute of welding [18] material properties of steel, welding technology, environmental conditions, local structure, and the loading mode of these weld details are somehow different from the revised cope-hole details. Therefore, the relevant provisions of anti-fatigue design in the current design codes for these welded details cannot be directly used.
To further improve the fatigue performance of previous welded details, an optimization scheme has been presented. The semicircle arc plate is used to fill the cope hole after the welding of the member, which is called revised cope-hole detail, as shown in Figure 2. However, the fatigue performance of such revised cope-hole detail has been rarely reported. In the study, fatigue experiments of revised cope-hole detail subjected to different stress amplitude were carried out. Three specimens were prepared with the same dimensions and materials. The fatigue S-N curve equation was obtained based on the fatigue testing results. In addition, theoretical analysis and numerical simulation were performed to study the fatigue performance, fatigue failure mechanism, and fatigue resistance design parameters for revised cope-hole details. Moreover, the fatigue experiment results of revised cope-hole details were also compared with those of previous welded details.

2. Fatigue Experiment of Revised Cope-Hole Details

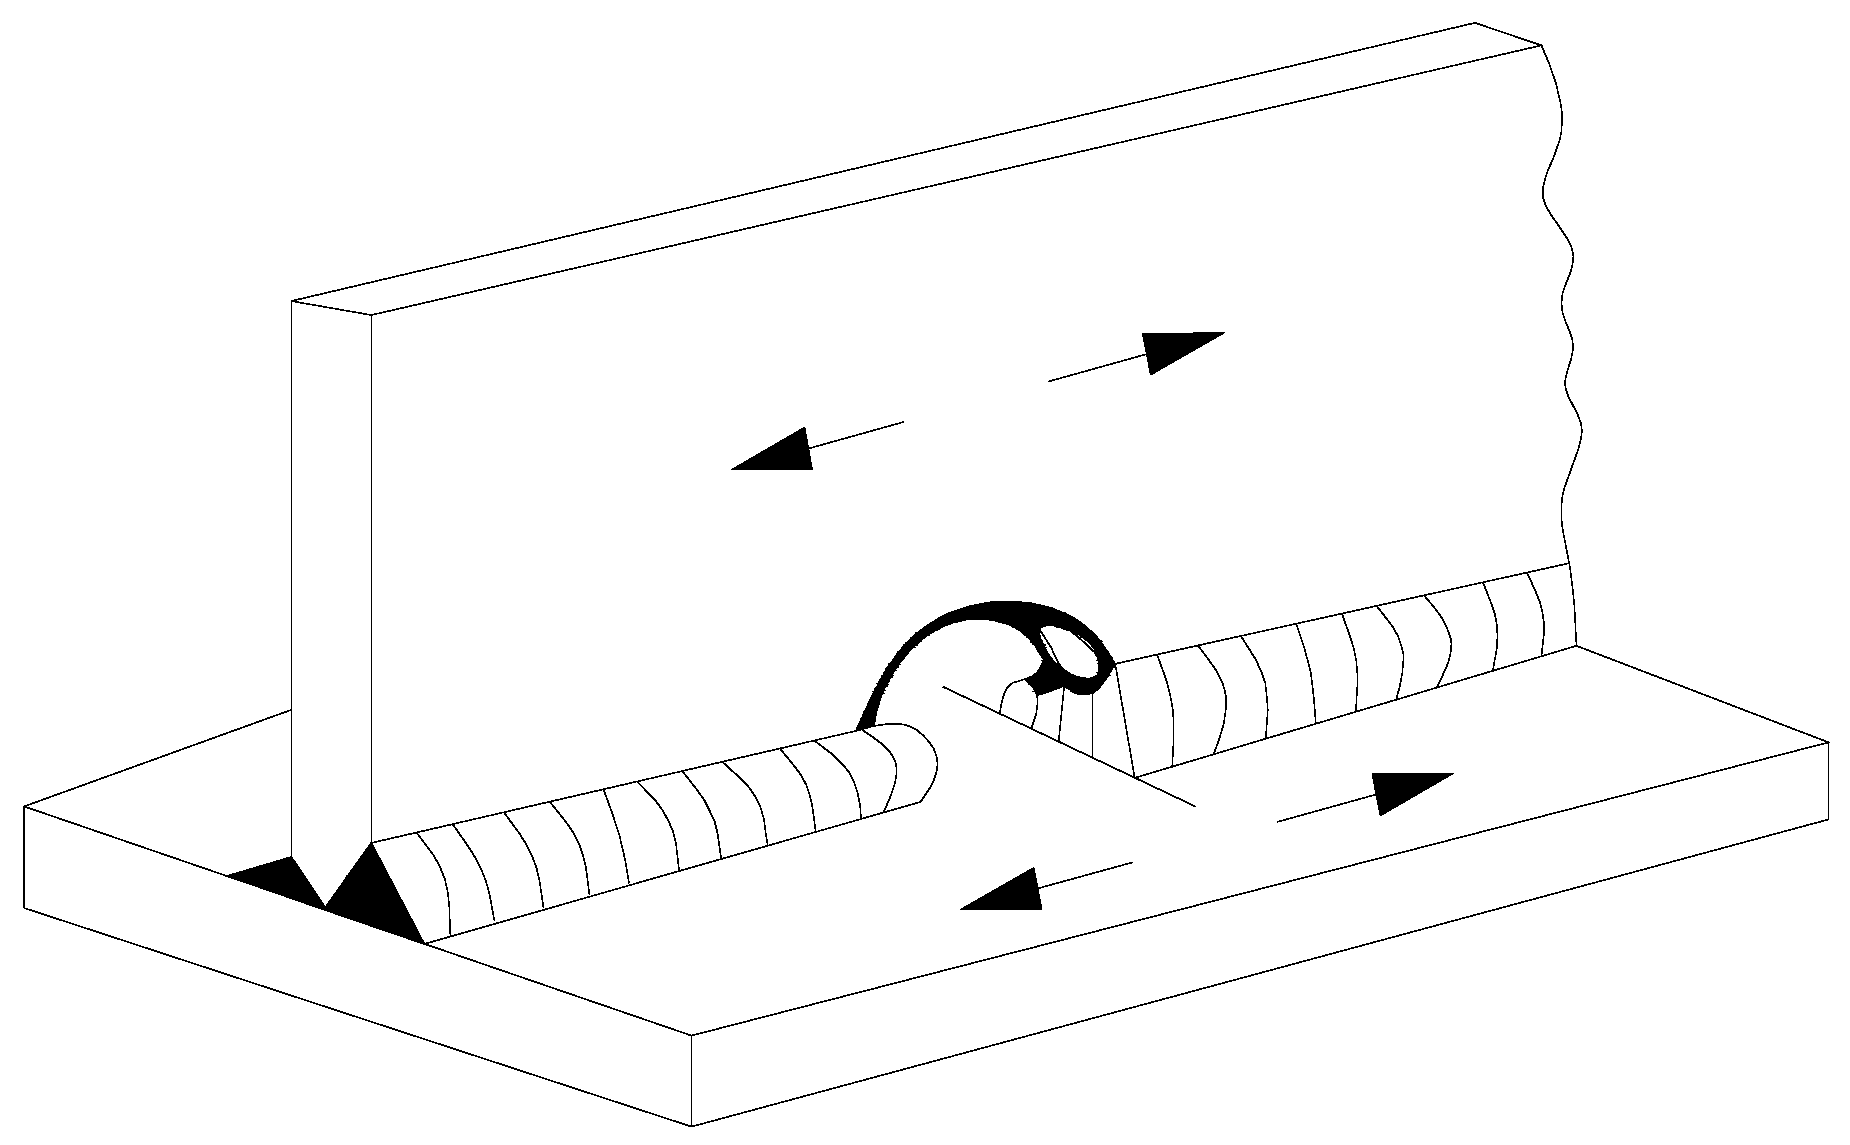
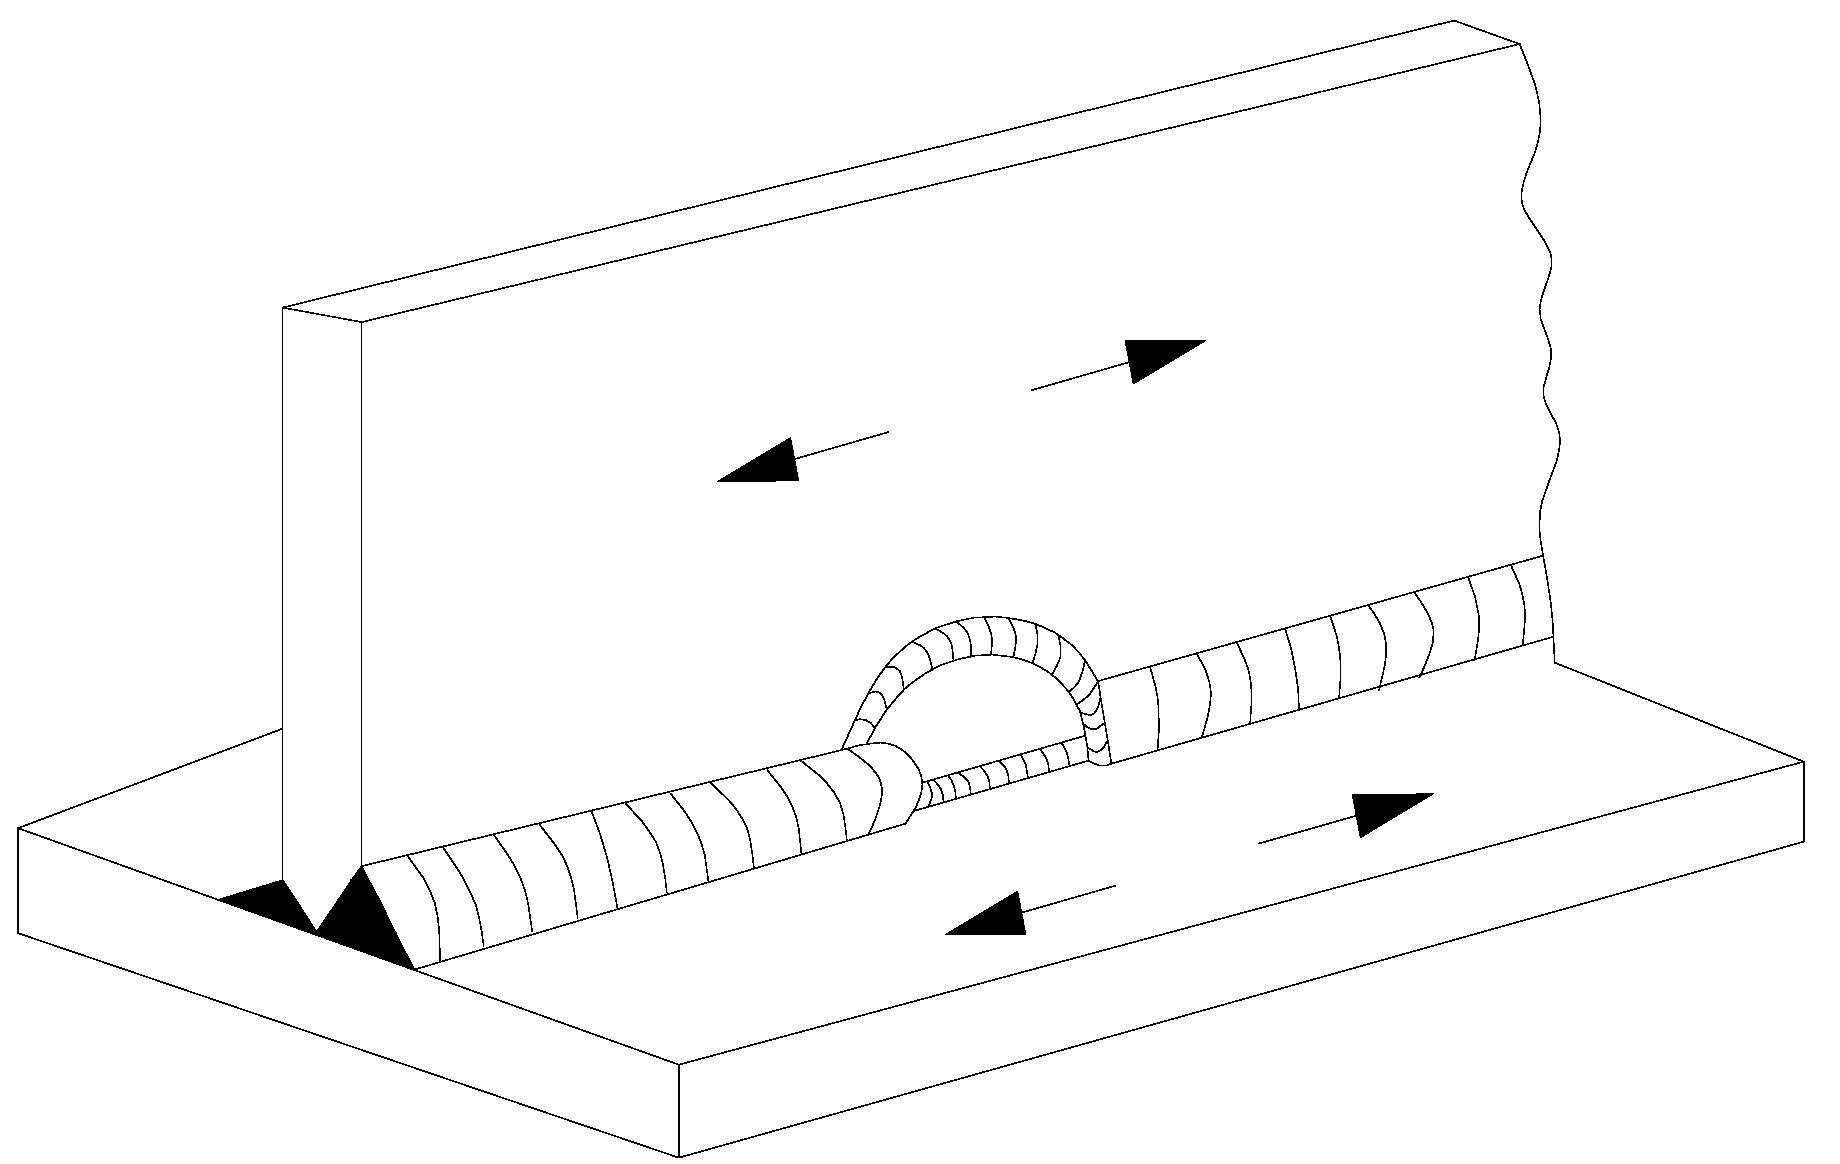
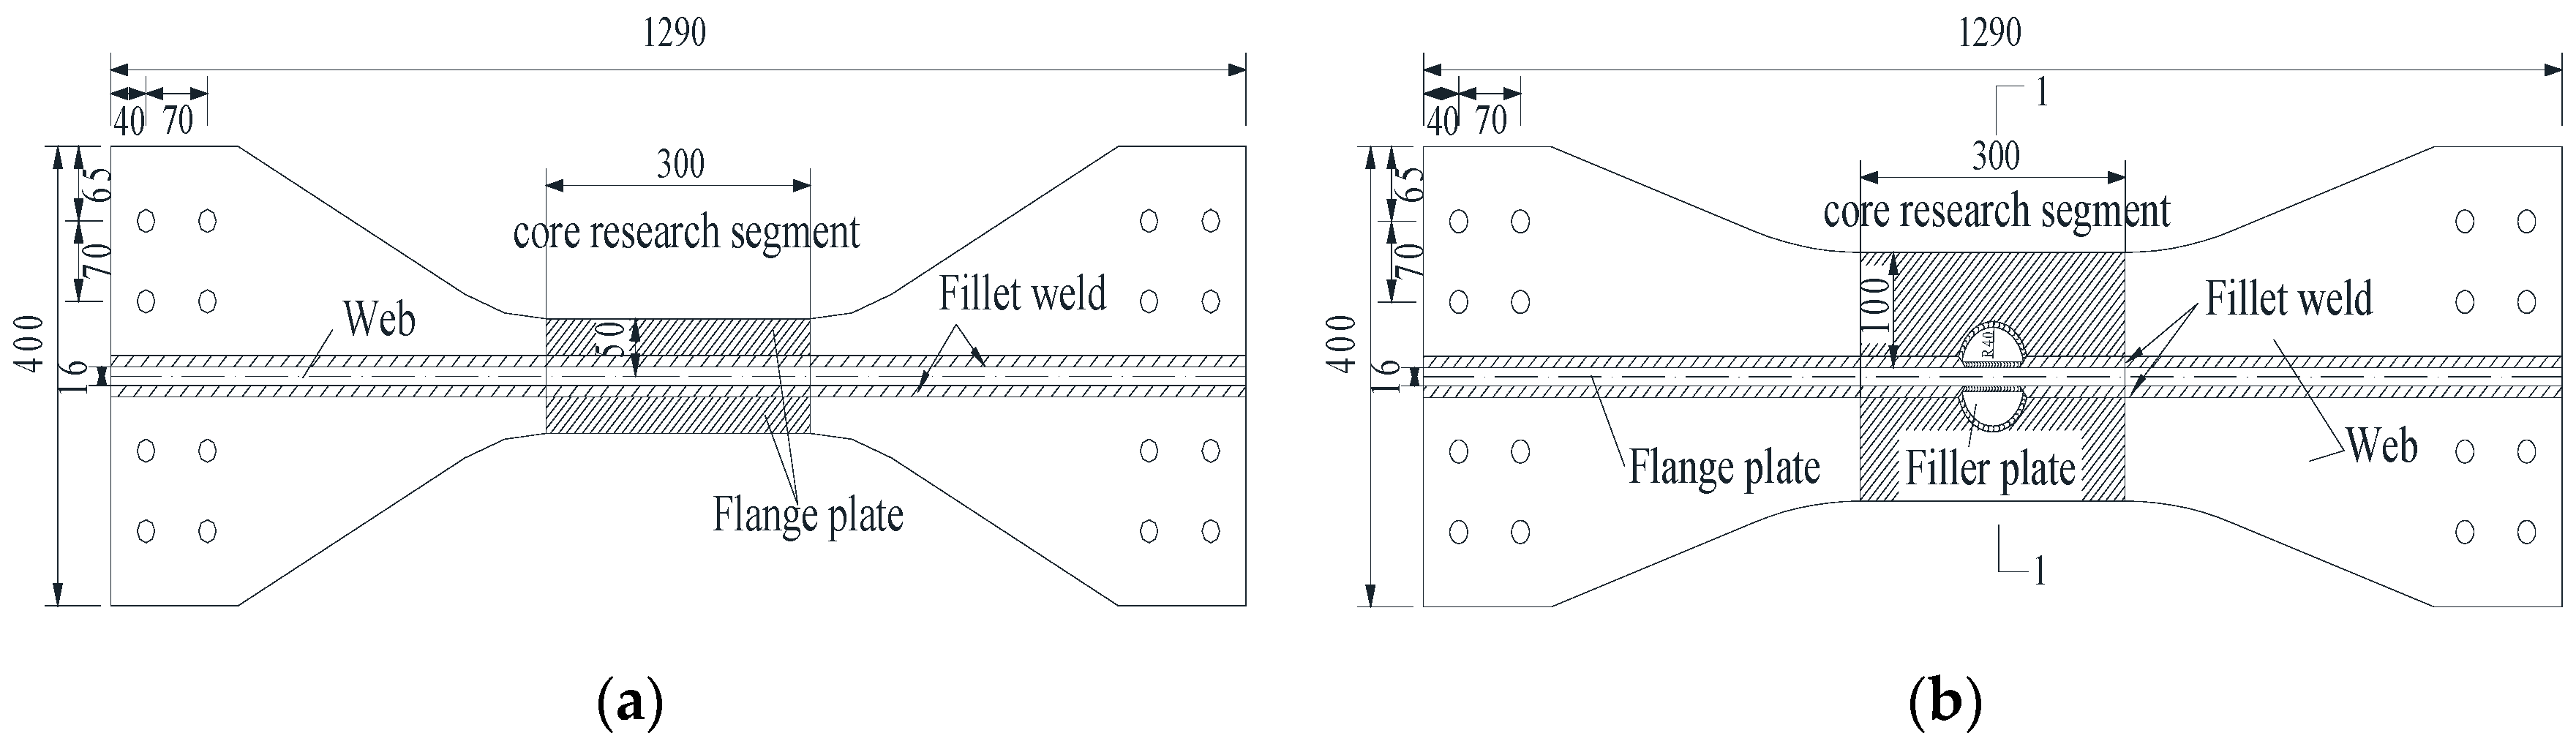
2.1. Specimen Details

In the study, the dimensions of previous welded detail (Weld Detail 1) is referred to [6]. The revised cope-hole detail has the same dimensions of the weld detail 1, except that the cope holes are filled with semicircle arc plate with thickness of 10 mm. Thickness of flange and web plates is 16 mm. The dimensions for revised cope-hole detail are shown in Figure 3. The three fatigue specimens are designed and fabricated from Q345C steel plate [19]. The mechanical properties of steel are given in Table 1.

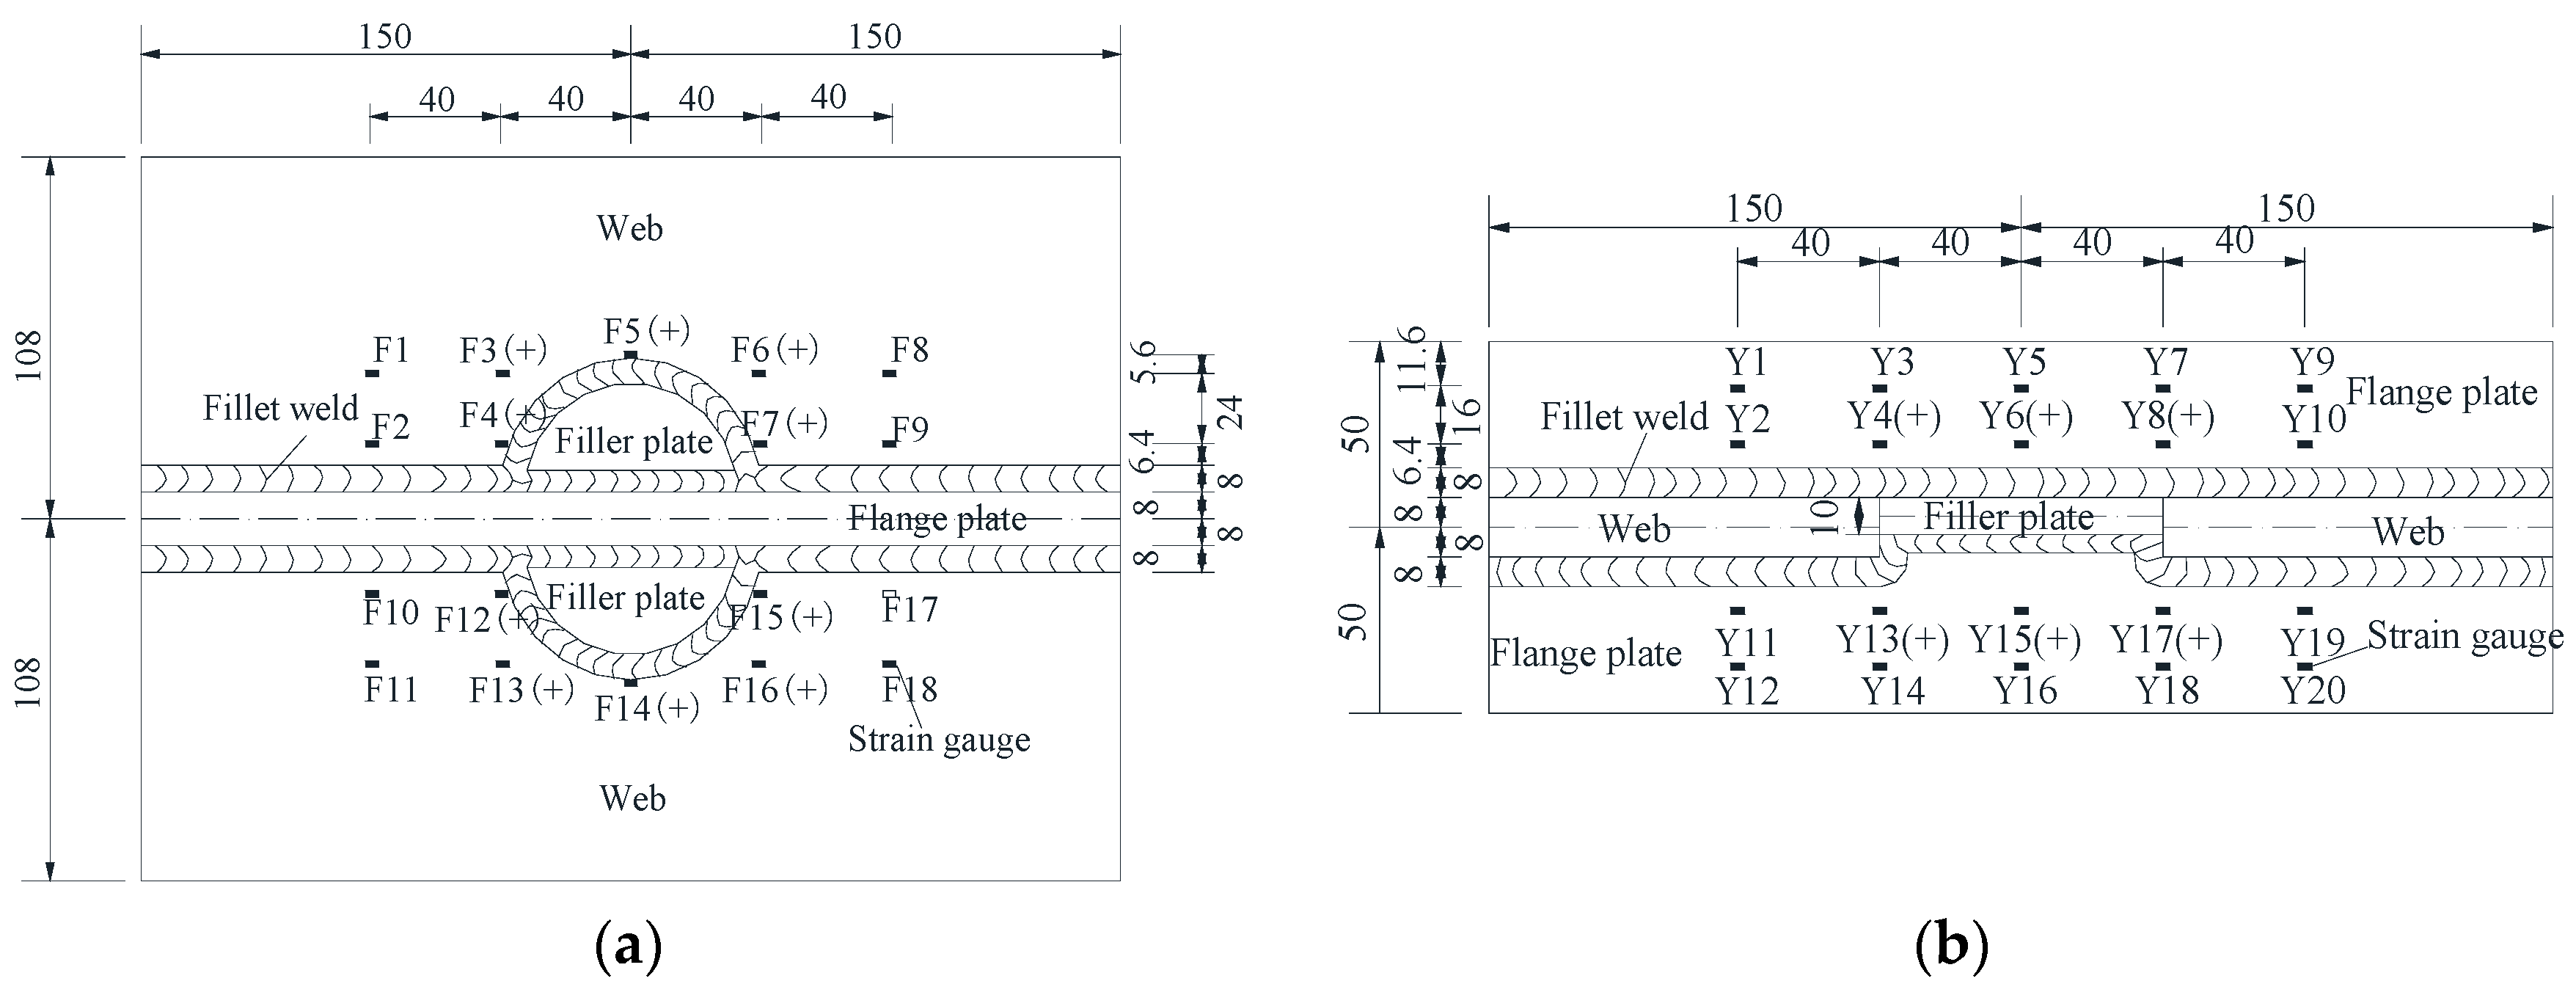
2.2. Installation of Strain Gauges

The resistance strain gauges are used to measure the strain during the fatigue test. The TMR200 dynamic data acquisition instrument is used to collect strain data, and the influence of temperature strain is eliminated in the test. Strain measurements should be capable of revealing the local stress distribution characteristics of welded details and the stress concentration part and stress distribution. Because of the large stress gradient near the cope hole, dense strain gauges are mounted near the arc edges of the cope hole, while other locations are rarely installed. At six typical locations, i.e., F4, F5, F7, F12, F14, and F15 in Figure 4, other strain gauges are glued nearby the cope hole to be as a comparative reference. Strain gauges with dimensions of 3 mm × 5 mm, electrical resistance of 120 Ω, and the range of 2 × 10⁴ microstrains are used to determine the strain along with the longitudinal direction of the specimens under the uniaxial fatigue load. The strain gauge number with “(+)” in Figure 4 indicates that strain gauges are installed in both surfaces of the plate. The corresponding number of strain gauge number on the other side of the plate is listed in Table 2.

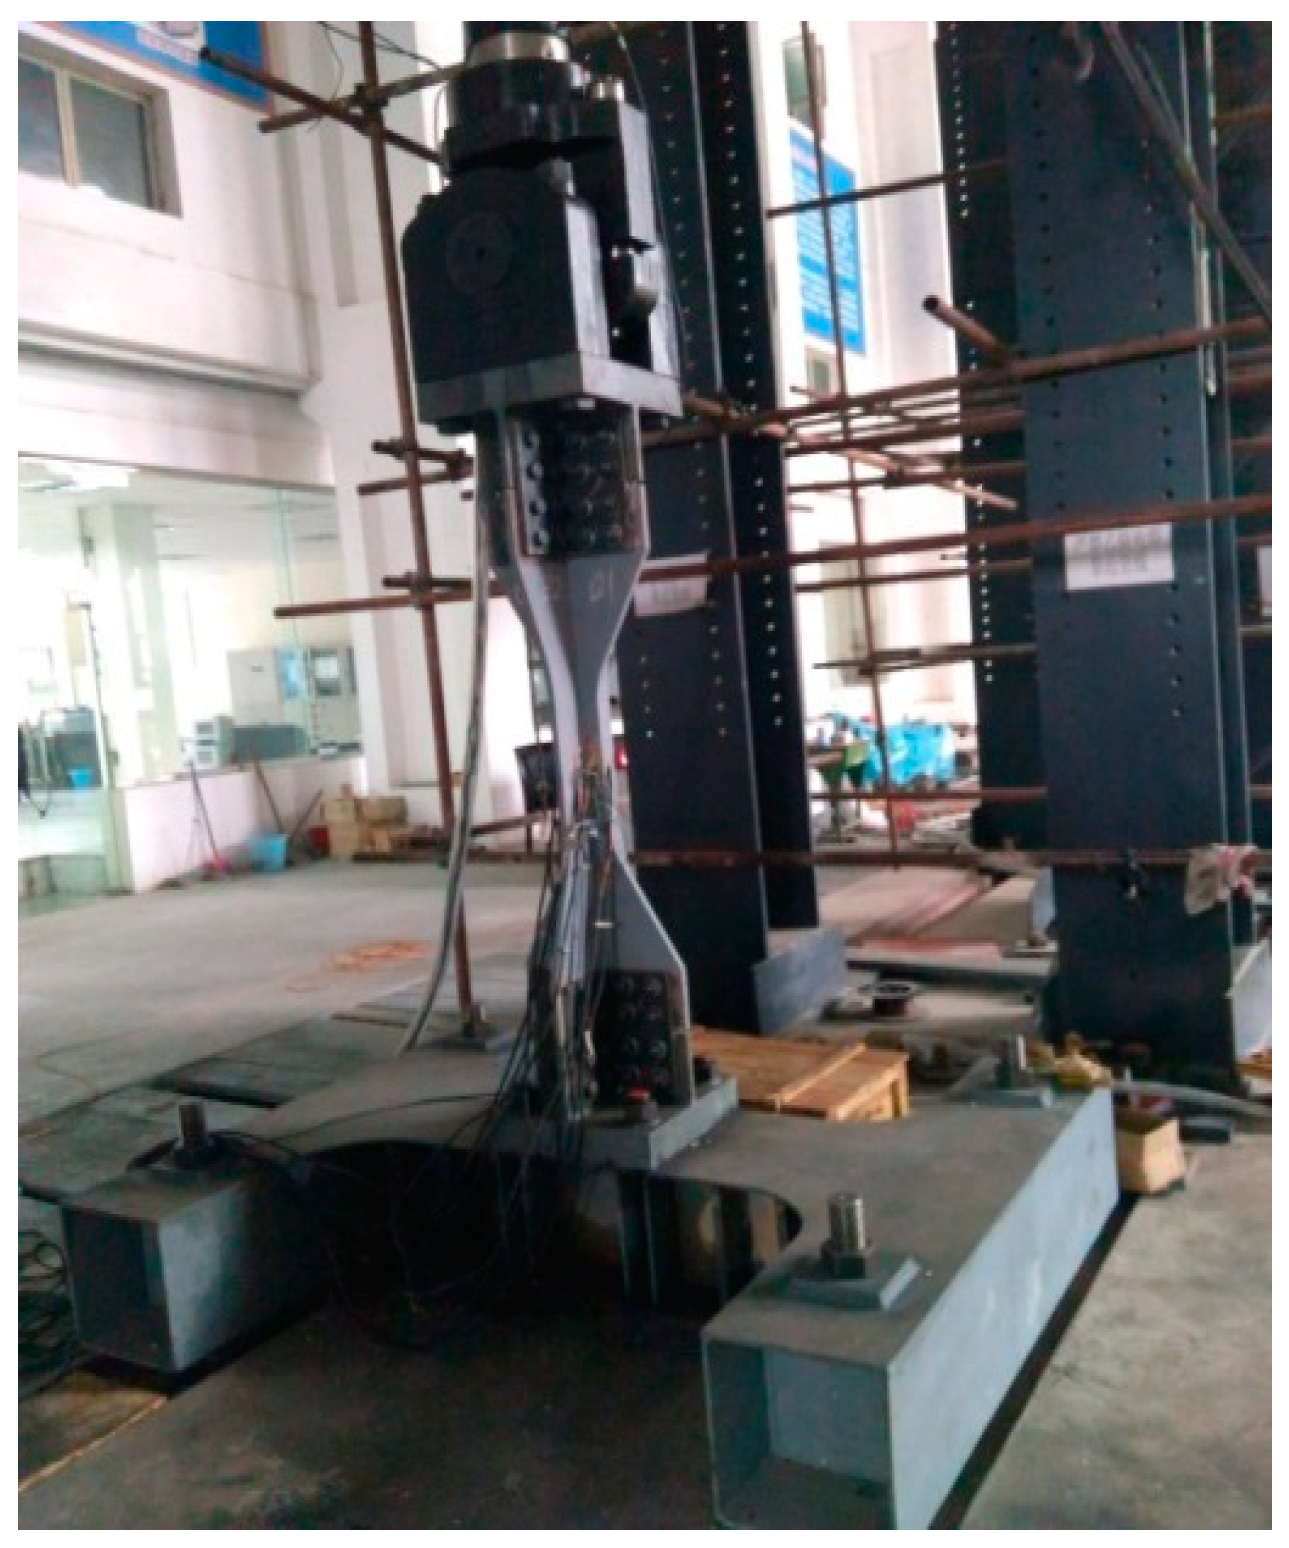
2.3. Testing and Loading Scheme

Three revised cope-hole detail specimens are tested under the stress amplitude of 99 MPa, 90 MPa, and 63 MPa, respectively. Strain data are collected every two hours during the fatigue experiment before the formation of fatigue crack. The interval of data acquisition is shortened to be every hour after the fatigue crack appeared. During the test, the data acquisition and the fatigue crack detection of specimens are carried out simultaneously. An ultrasonic nondestructive flaw detector, magnifying glass crack, and observation instrument are used to detect the fatigue cracks. Damaged bolts and strain gauges are replaced timely. The fatigue life of welded specimens is defined as the fatigue loading time that corresponds to the fatigue fracture failure occurrences. The fatigue experiments are carried out by using a sine wave with a load stress ratio of 0.1 and through a MTS testing machine (as shown in Figure 5). The loading parameters for fatigue test are shown in Table 3. The static test results can check whether the axial load is eccentric or not before the fatigue test, so that the loading device can be adjusted in time. At the same time, it can also provide some reference for the subsequent loading scheme after a certain number of fatigue cyclic loading. The loading parameters of the static test are illustrated in Table 4, where each stress amplitude is divided into five load levels when static load is applied from the initial value to the ultimate value. For example, the five static load levels corresponding to the stress amplitude of 63 MPa are 34.5 kN, 100 kN, 180 kN, 260 kN, and 345 kN, respectively.

3. Finite Element Analysis of Revised Cope-Hole Detail

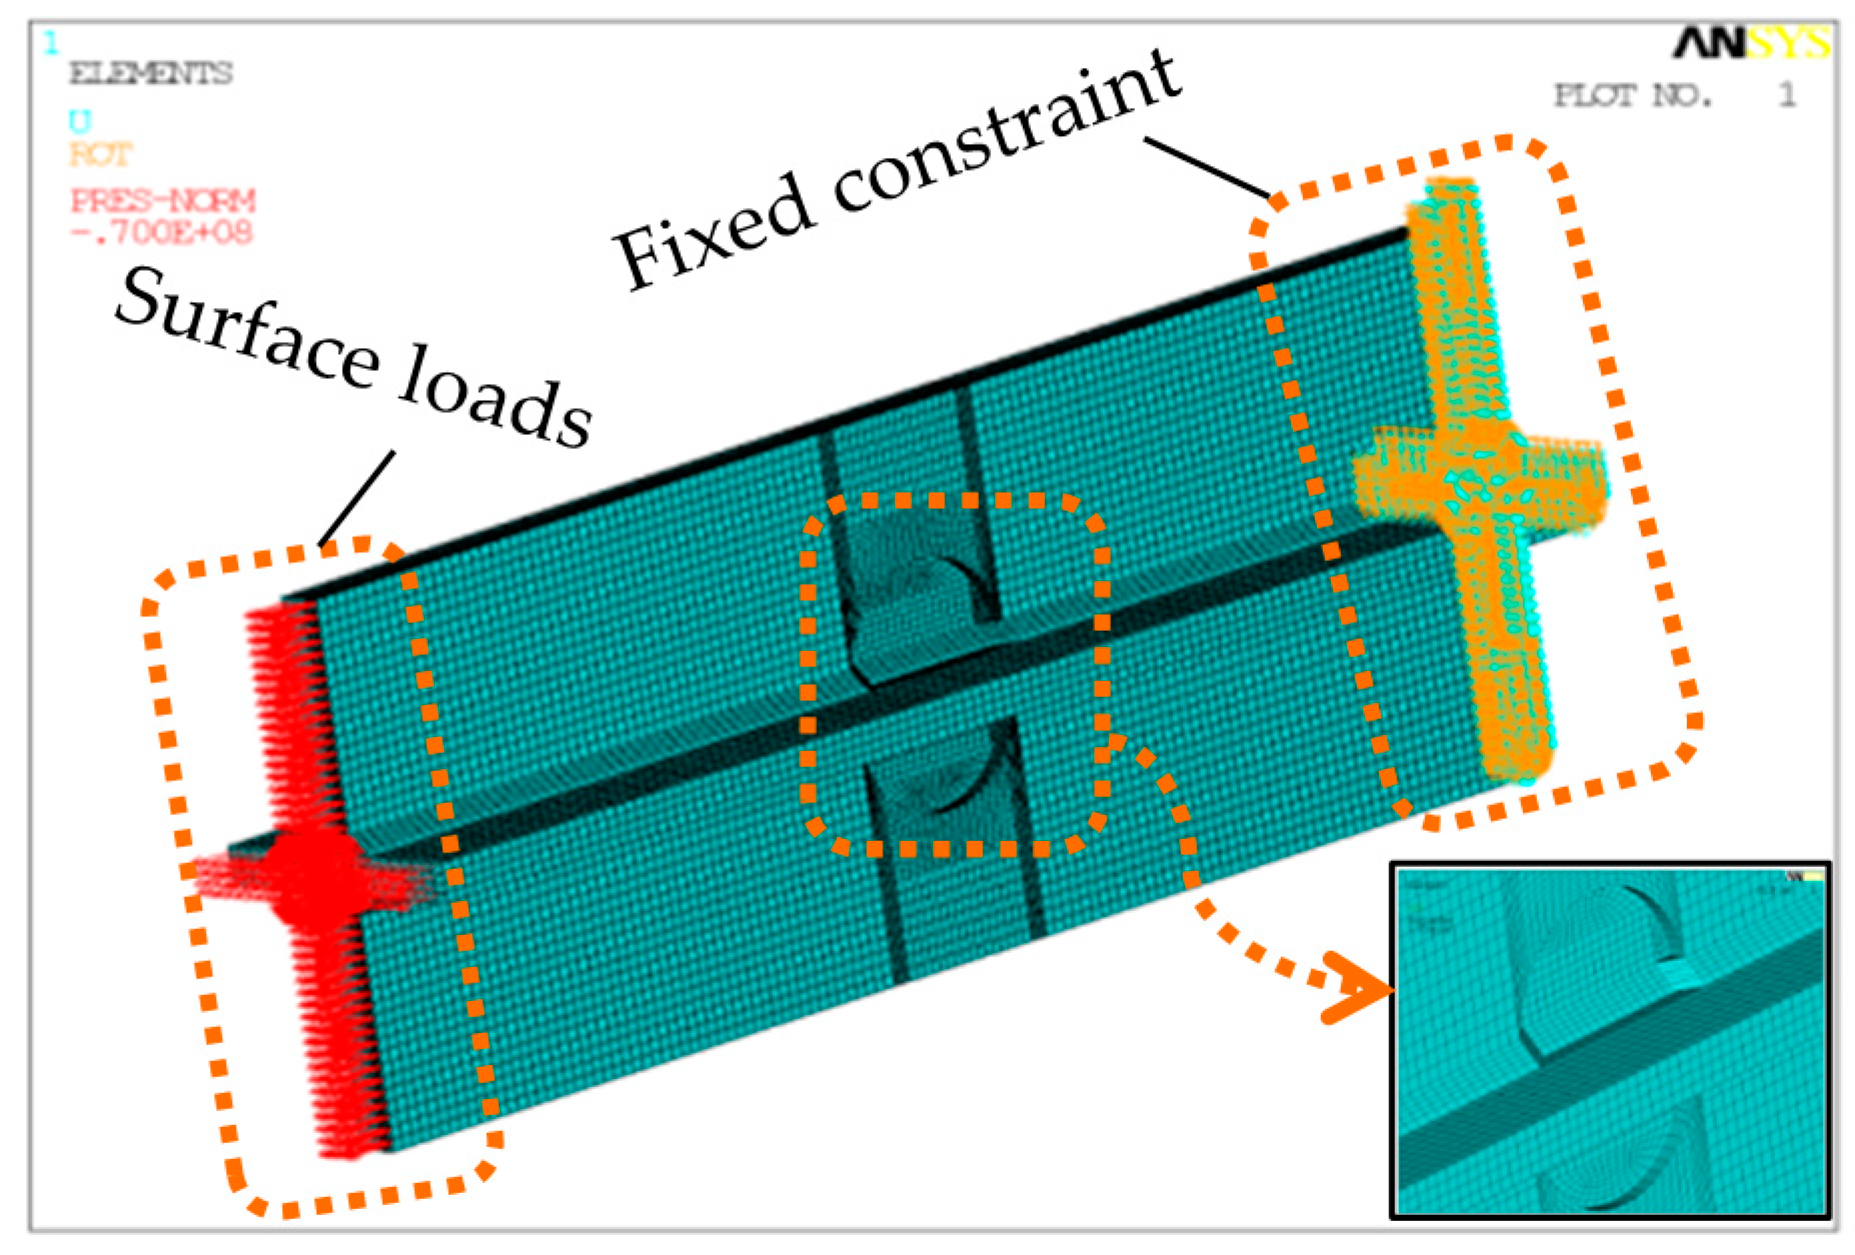
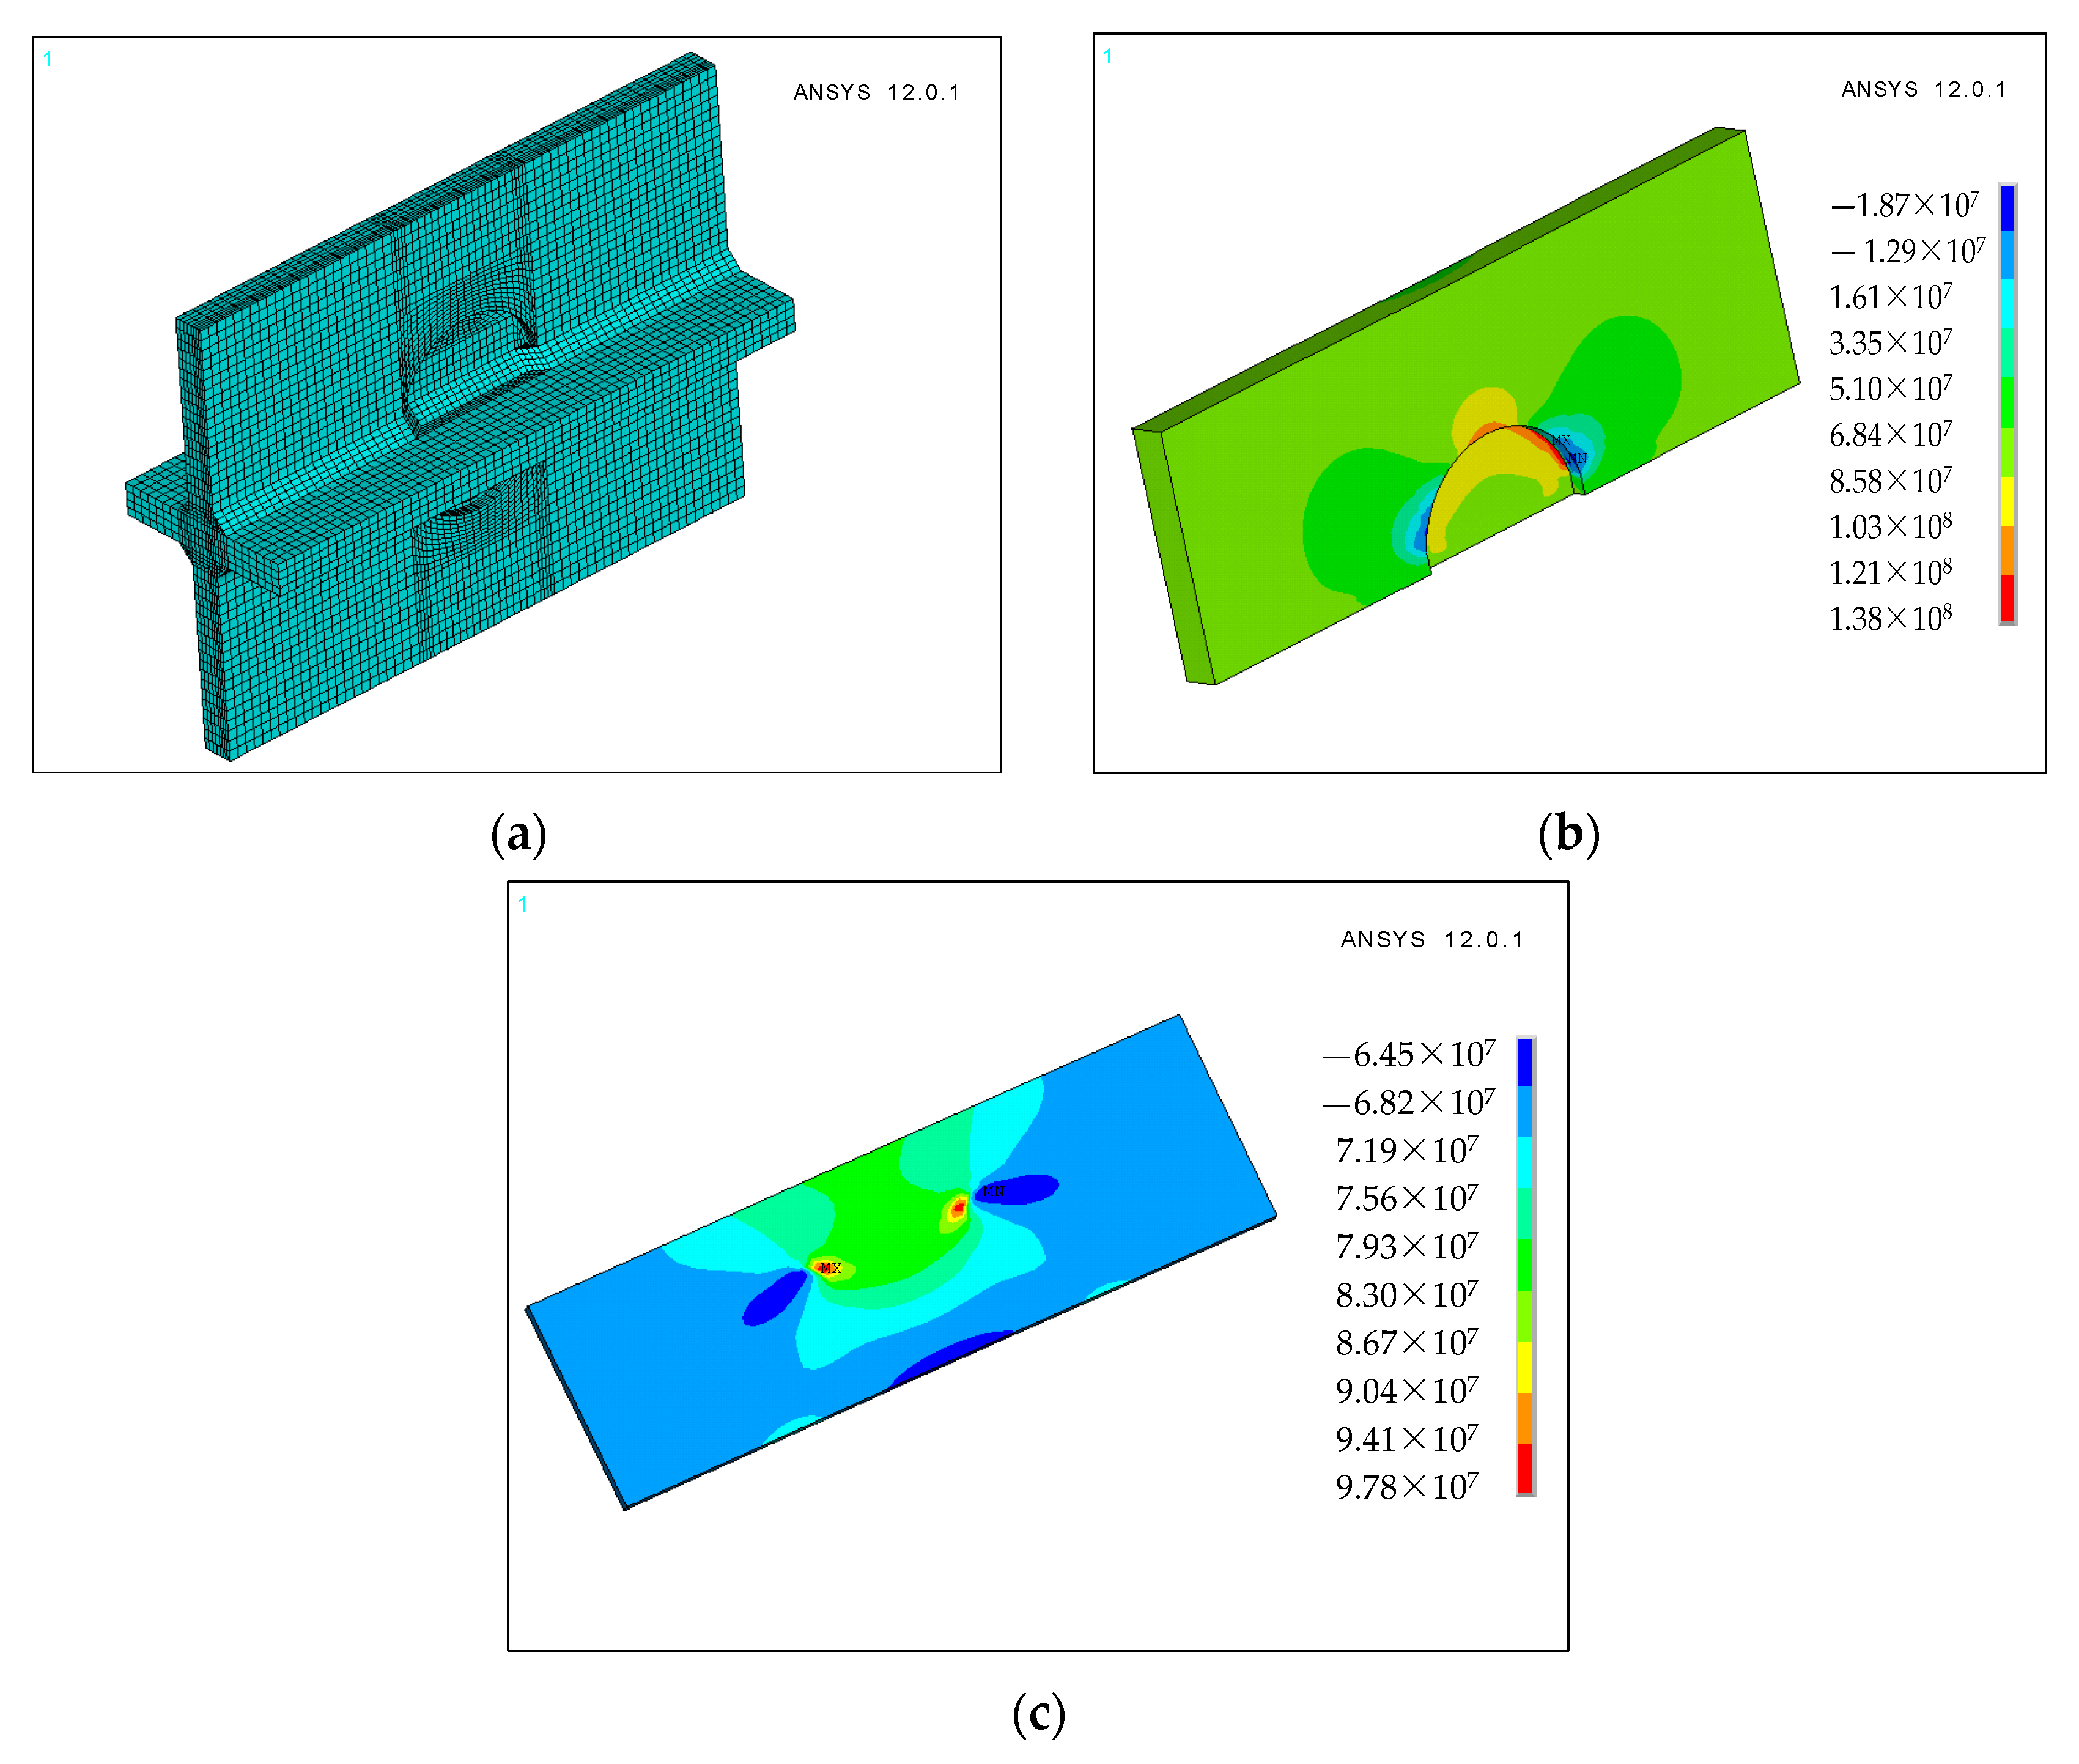
3.1. Modeling and FEA Results

According to the geometrical dimensions of welded specimens, they include one core research segment and two anchorage segments, as shown in Figure 3. The core research segment is 300 mm in the middle of the specimen, and the other two portions of the specimen are the anchorage segments. The main concern in the experiment and fatigue performance analysis is the state of stress and strain of the core research section of revised cope-hole detail. In order to reduce the computational time, only the core research section is modelled in the finite element analysis. Besides, the finite element model is extended along the length of the specimens to exclude the effect of end loading and boundary constraint on local stress distribution of the core research section. The elastic modulus of steel Q345C is 2.06 × 10⁵ MPa and the Poisson’s ratio is set to be 0.3 in the finite element model.
The connection between the plates is fillet weld and the solid element is used to simulate the weld. The fillet weld in the finite element model is simplified as a triangular cross-section. The flange plate, web, fillet weld, and butt weld are simulated by using the solid element SOLID45 with 8 nodes. The hexagonal element is used for meshing and the cell size is 0.5 cm. Surface loads are applied at one end of the model, and the other end of the model is the fixed constraint, as shown in Figure 6. There are 70,320 elements and 80,887 nodes in the finite element model. The applied pure tension load in the modeling analysis is 70 MPa. The linear elastic analysis of the finite element model is carried out by ANSYS12.0.1 (ANSYS Inc., Canonsburg, PA, USA). The influence of welding residual stress and initial defect on it is not considered in the finite element analysis, and the cracking stage of the specimen is not considered. The finite element analysis does not consider the influence of residual stresses. The finite element model and the analytical results are presented in Figure 7.
As shown in Figure 7, the stresses of the web and flange plate are symmetrically distributed under axial load, in which the maximum stress and minimum stress of the web are −18.7 MPa and 138.0 MPa, respectively.

3.2. Analysis of Static Test Results

According to the static loading parameters in Table 3, the fatigue specimens are subjected to static loading after cyclic number of 5 × 10⁵. There are five static load steps or levers for each stress amplitude. The static loading is divided into five loading steps (for example: 34.5 kN, 100 kN, 180 kN, 260 kN, and 345 kN) from the minimum to the maximum, as shown in Table 4. The testing results of the static loading before fatigue loading are summarized in Table 5. At the beginning of loading, there are no visible damage or failure caused by fatigue loads, which is consistent with the assumption of idealized finite element model. Besides, these results are compared to the calculation results of the finite element model. Comparison analysis results of CHT3’s typical measure points are listed in this Table 5.
As seen from Table 5, the comparative analysis results show that the strain far away from the weld has slight difference from the testing results of revised cope-hole detail, which is obtained from the finite element model. The differences between testing data and the finite element analysis ones are smaller than 22%, but some difference are relatively great at a few measurement points. There are three possible reasons to explain this. First, the local stress gradient of core research section is large and the local stress changes rapidly, and the node location for extracted node stress has certain difference from the actual installation location of strain gauge. Besides, the local mean deformation in a tiny region is obtained by the strain gauge in the fatigue experiment, which is different from extracted longitudinal node stress from the finite element analysis. Second, the influence of eccentric load does not exist in the finite element analysis, while it is existed unavoidably in the fatigue experiment. In addition, the welding residual stress, weld penetration depth, plate space, the actual weld shape, and geometric initial defection are not considered.

3.3. Strain Comparisons

When a semicircular arc plate is filled in the weld hole of the original welding detail, the local stress field distribution of the welding detail is significantly changed. Table 6 lists the stress comparison results at the typical measuring points between the original welding detail and the revised one.
As shown in Table 6, when a semicircular arc plate is filled in the original welding detail, the stress at the top of the hole is changed most significantly. The maximum stress on the flat surface and the slotted surface are reduced by 51% and 29%, respectively. For the flange plate, the stress at a typical measuring point near the weld has reduced by about 14–18%.

4. Fatigue Test Results and Comparisons

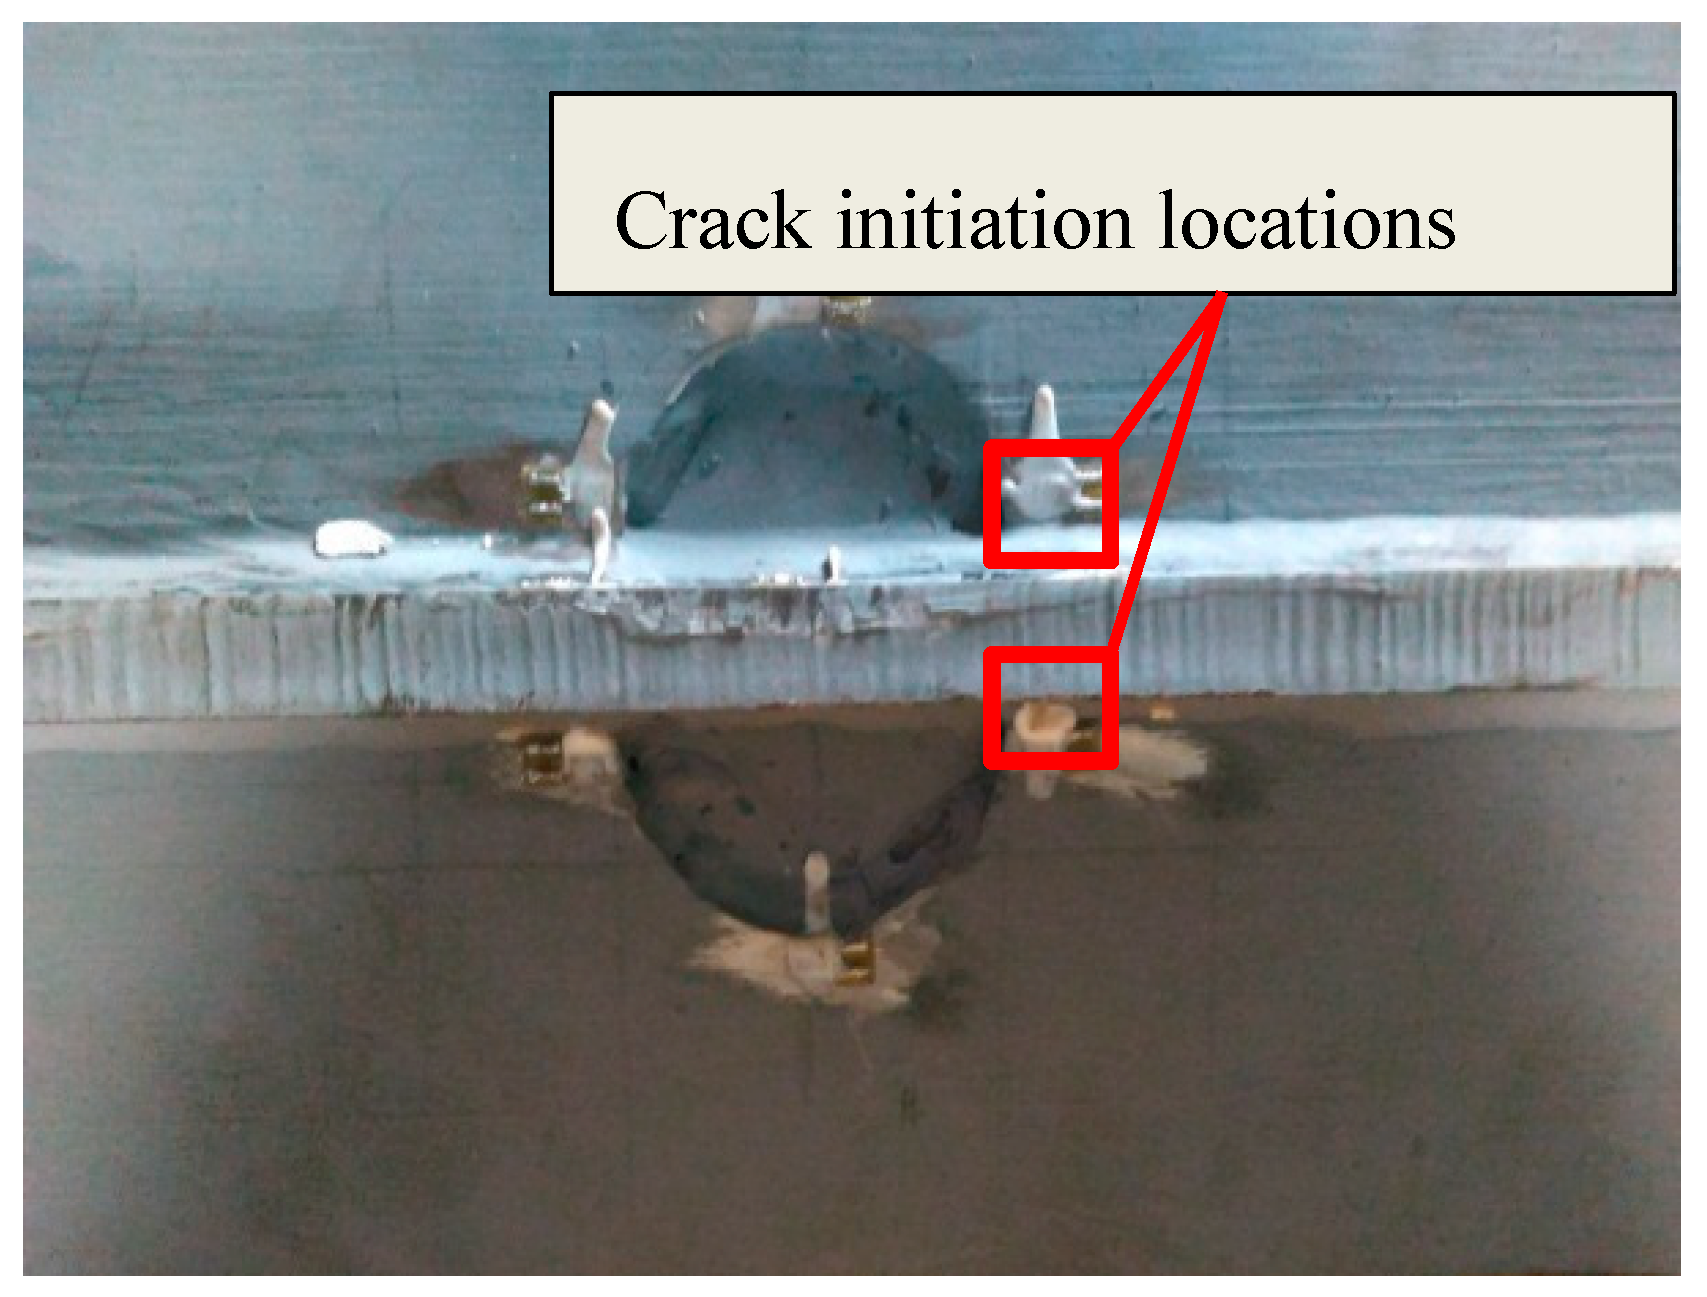
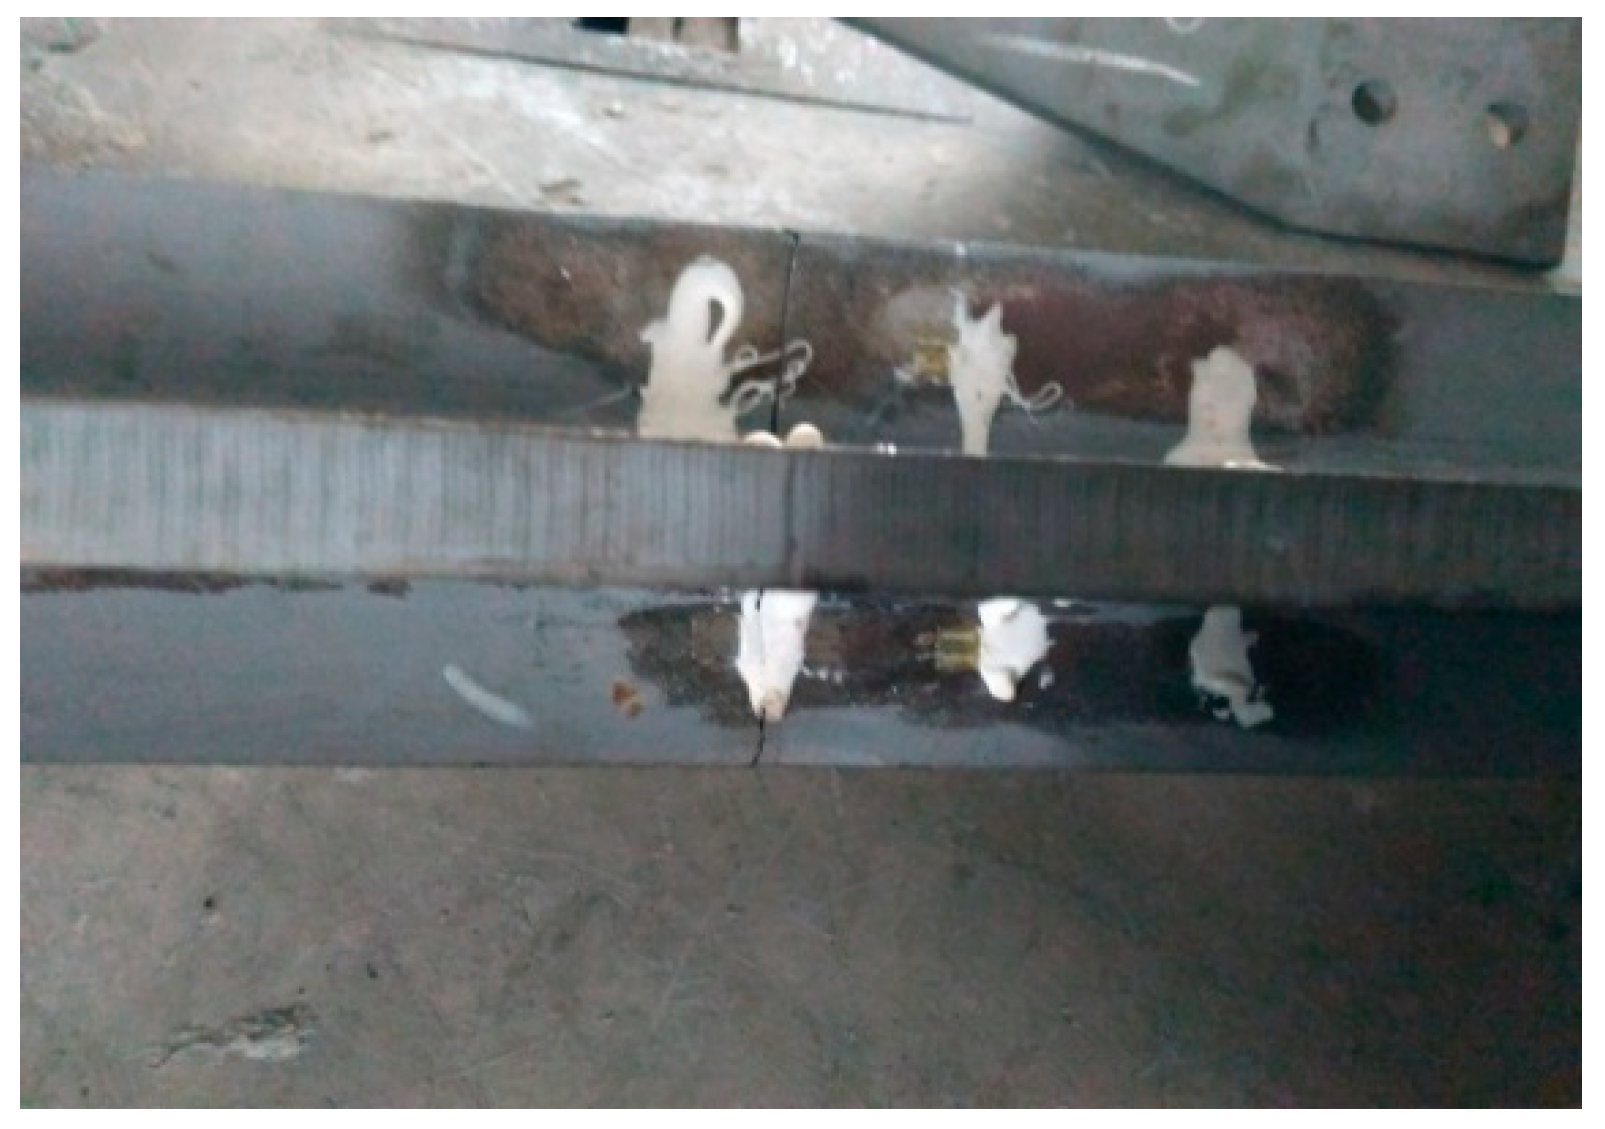
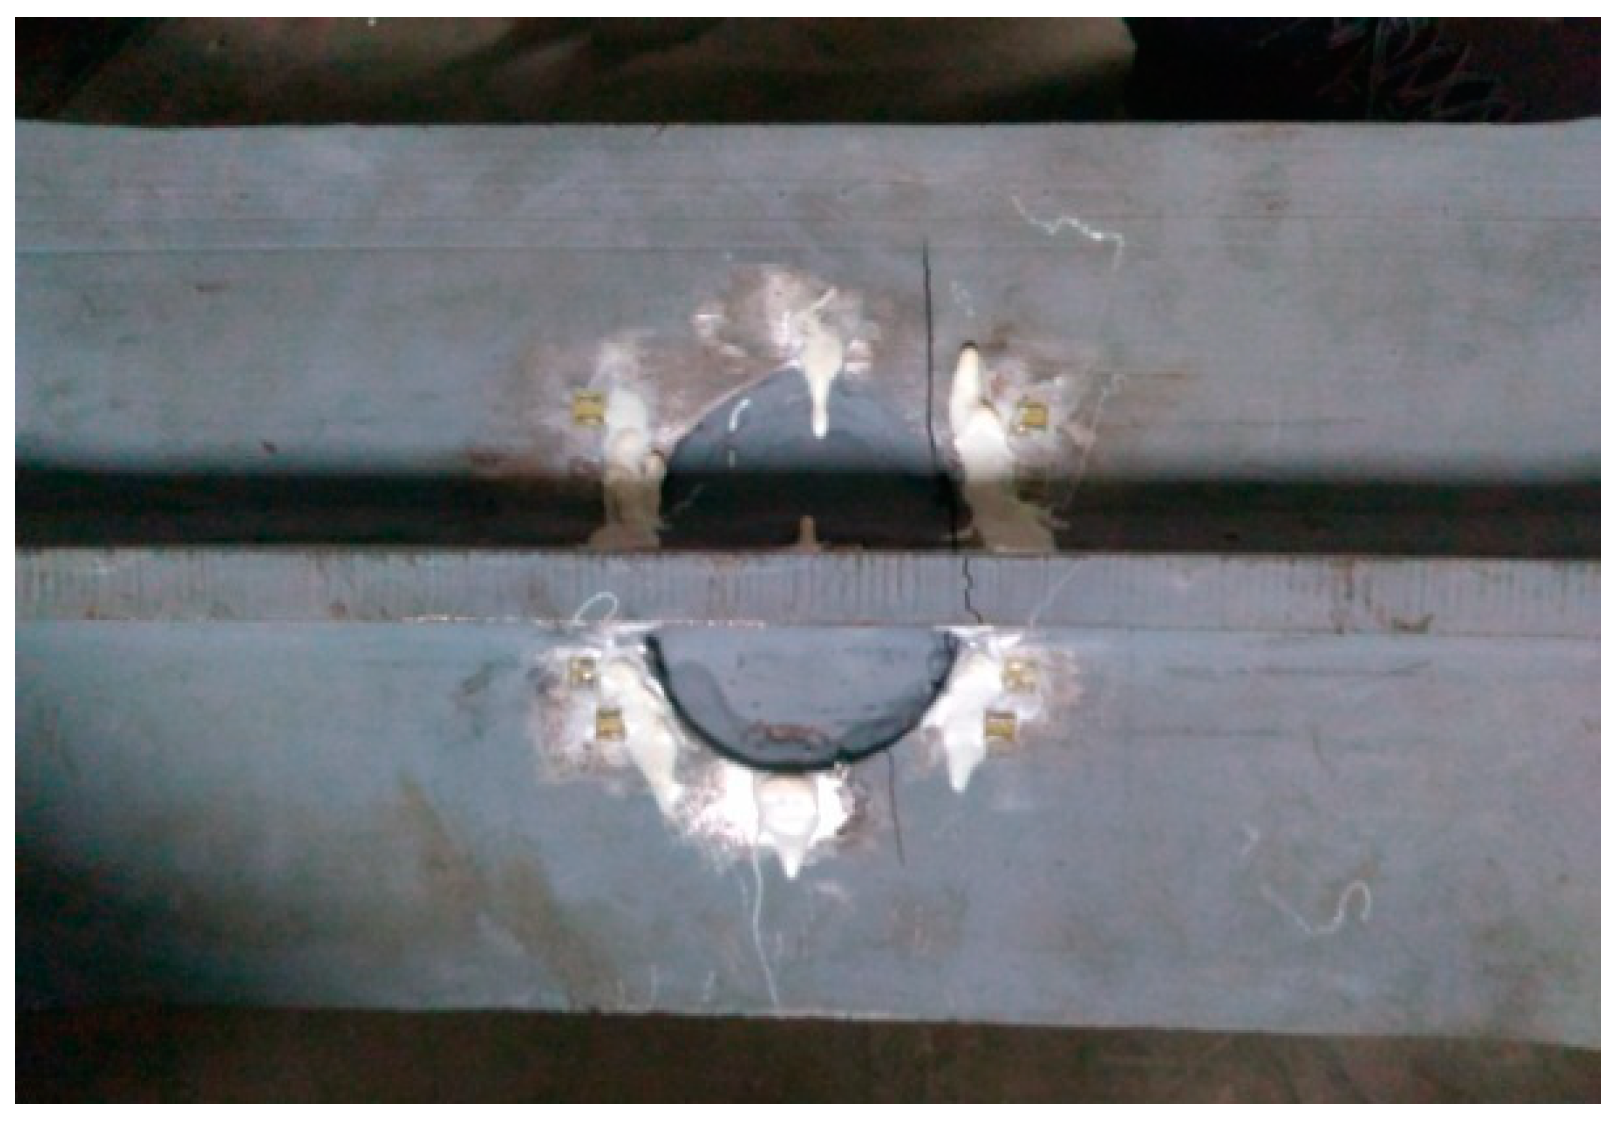
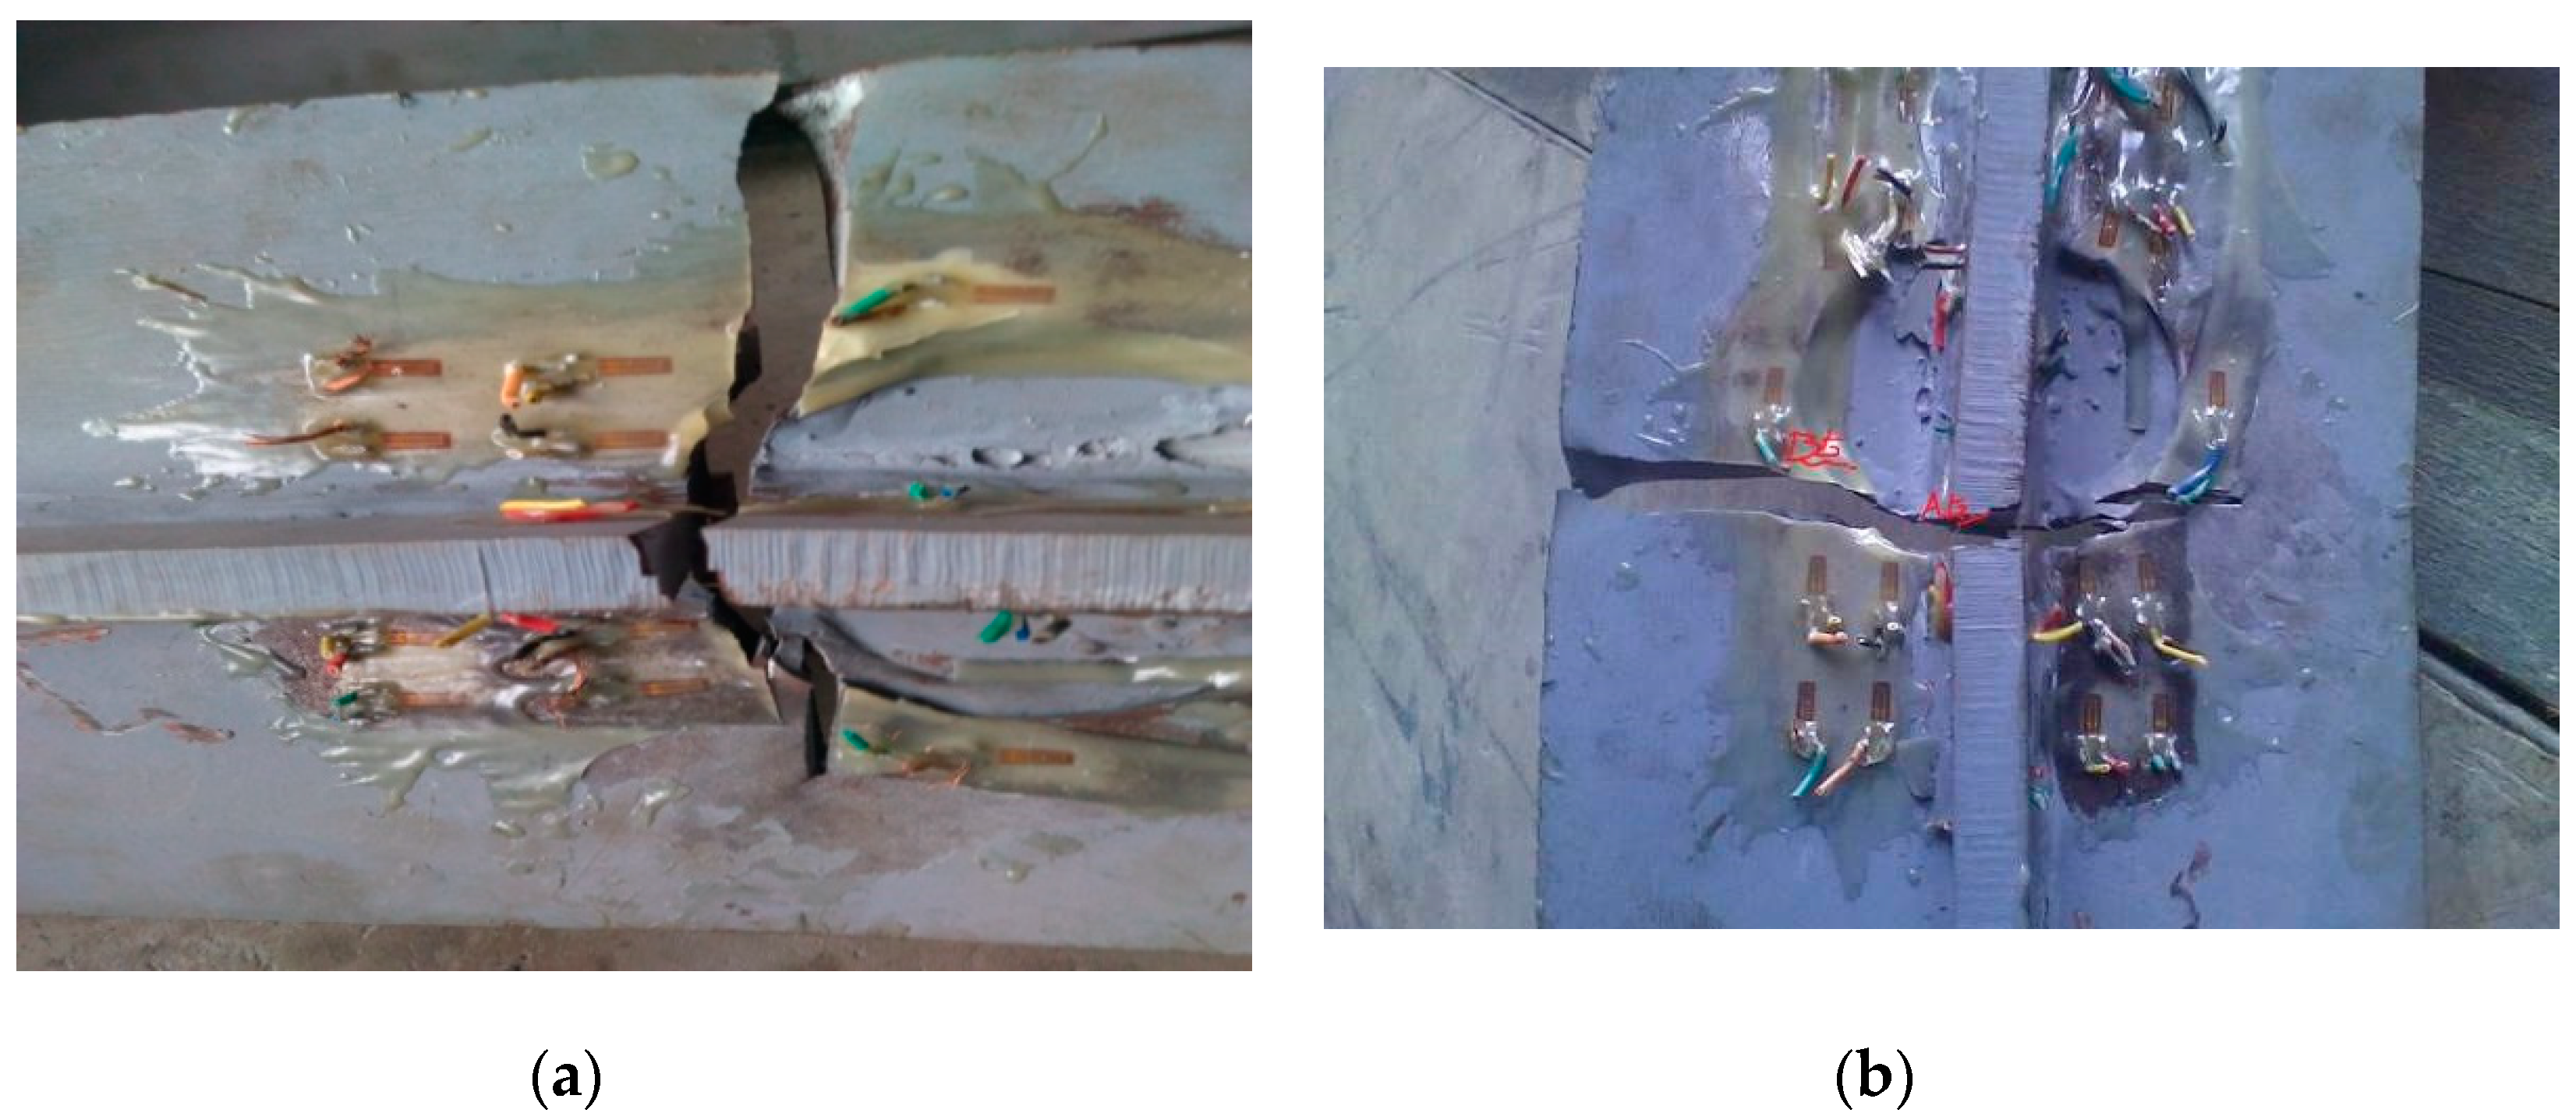
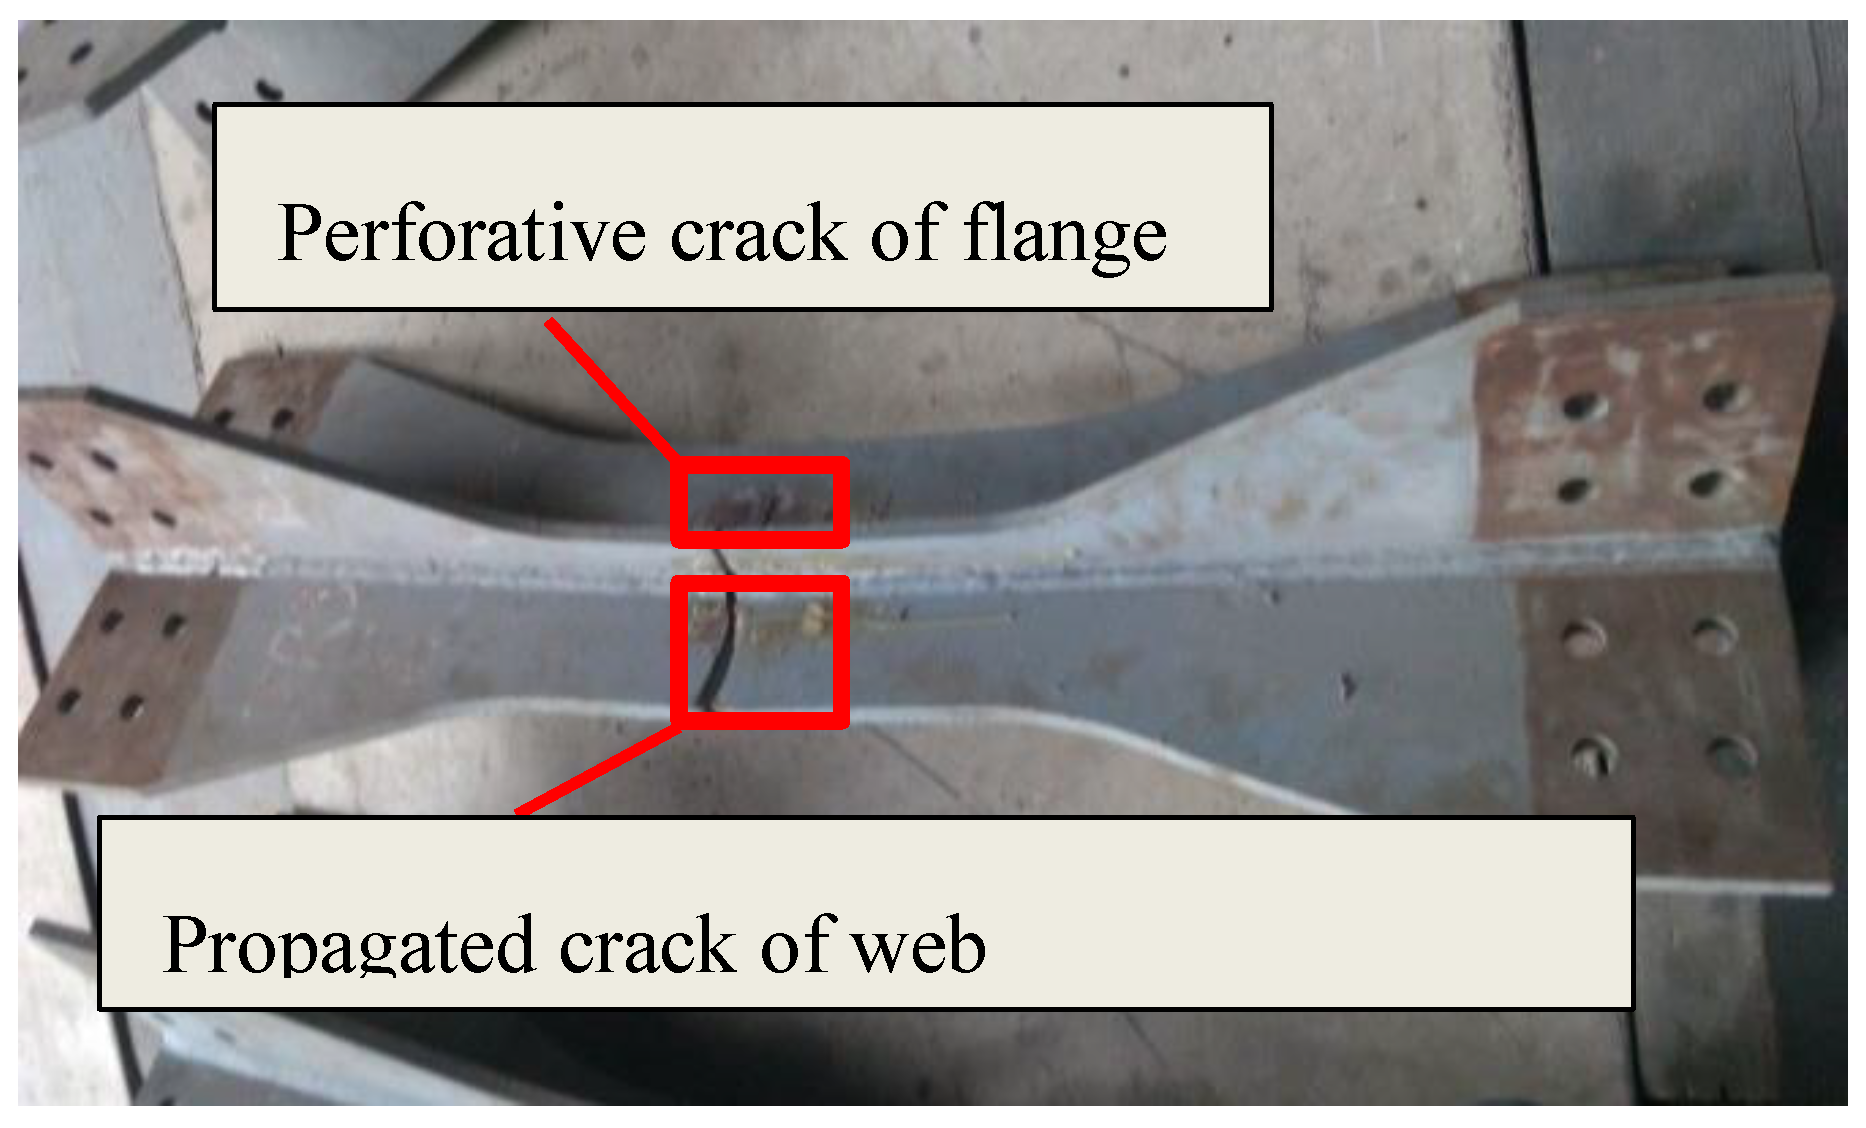
4.1. Fatigue Failure Process

From the fatigue experiment observation for all revised cope-hole specimens (CHT specimens), the fatigue initiation crack of CHT specimens under fatigue loads appeared at the intersection edges of filler-flange and web-flange longitudinal butt weld, as shown in Figure 8. The fatigue crack growth and fatigue fracture failure of CHT specimens are depicted in Figure 9, Figure 10, Figure 11, Figure 12 and Figure 13. The fatigue failure process of the specimens of revised cope-hole detail is described as follows. At initial certain fatigue loading cycles, a few fatigue cracks appeared first at the intersection edges. Then, fatigue cracks of the specimen extended simultaneously along the filler-web edge at the flange width direction with the increasing of fatigue loading cycles. As the fatigue loading cycles continues, the fatigue cracks kept propagating along the filler-web edge direction. The propagation direction changed to the web width direction before it extended to the top of circular holes. With the continuous increase of fatigue loading cycles, the fatigue damage gradually accumulated during the process, so the effective bearing area reduced significantly. The fatigue fracture failure finally appeared on the specimens when the remaining area was not sufficiently large or the specimen was not suitable for continue loading for the safety concern.
Some similarities noted from the fatigue failure process between CHT and previous welded detail specimens. The fatigue cracks appeared on the flange and web after a certain number of fatigue loading cycles, and the final fracture failure was caused by the insufficient remaining effective area of specimens to resist fatigue loading. However, the path and pattern of fatigue crack propagation presents some differences for two details. The initial fatigue crack of the previous welded details specimens appeared and extended in flange plate, and the fatigue crack of web first extended to the top of cope hole. But the fatigue crack of the CHT specimen extended simultaneously along the flange and the web. The main reasons are that the local stress field distribution and local support constraints of CHT specimens with filler plate are different. The filler plate reduces the stress concentration effectively. Therefore, under the same stress amplitude, the fatigue performance of the CHT specimen is better than that of the previous welded detail, which indicates that the revised cope-hole detail has a good improvement effect.

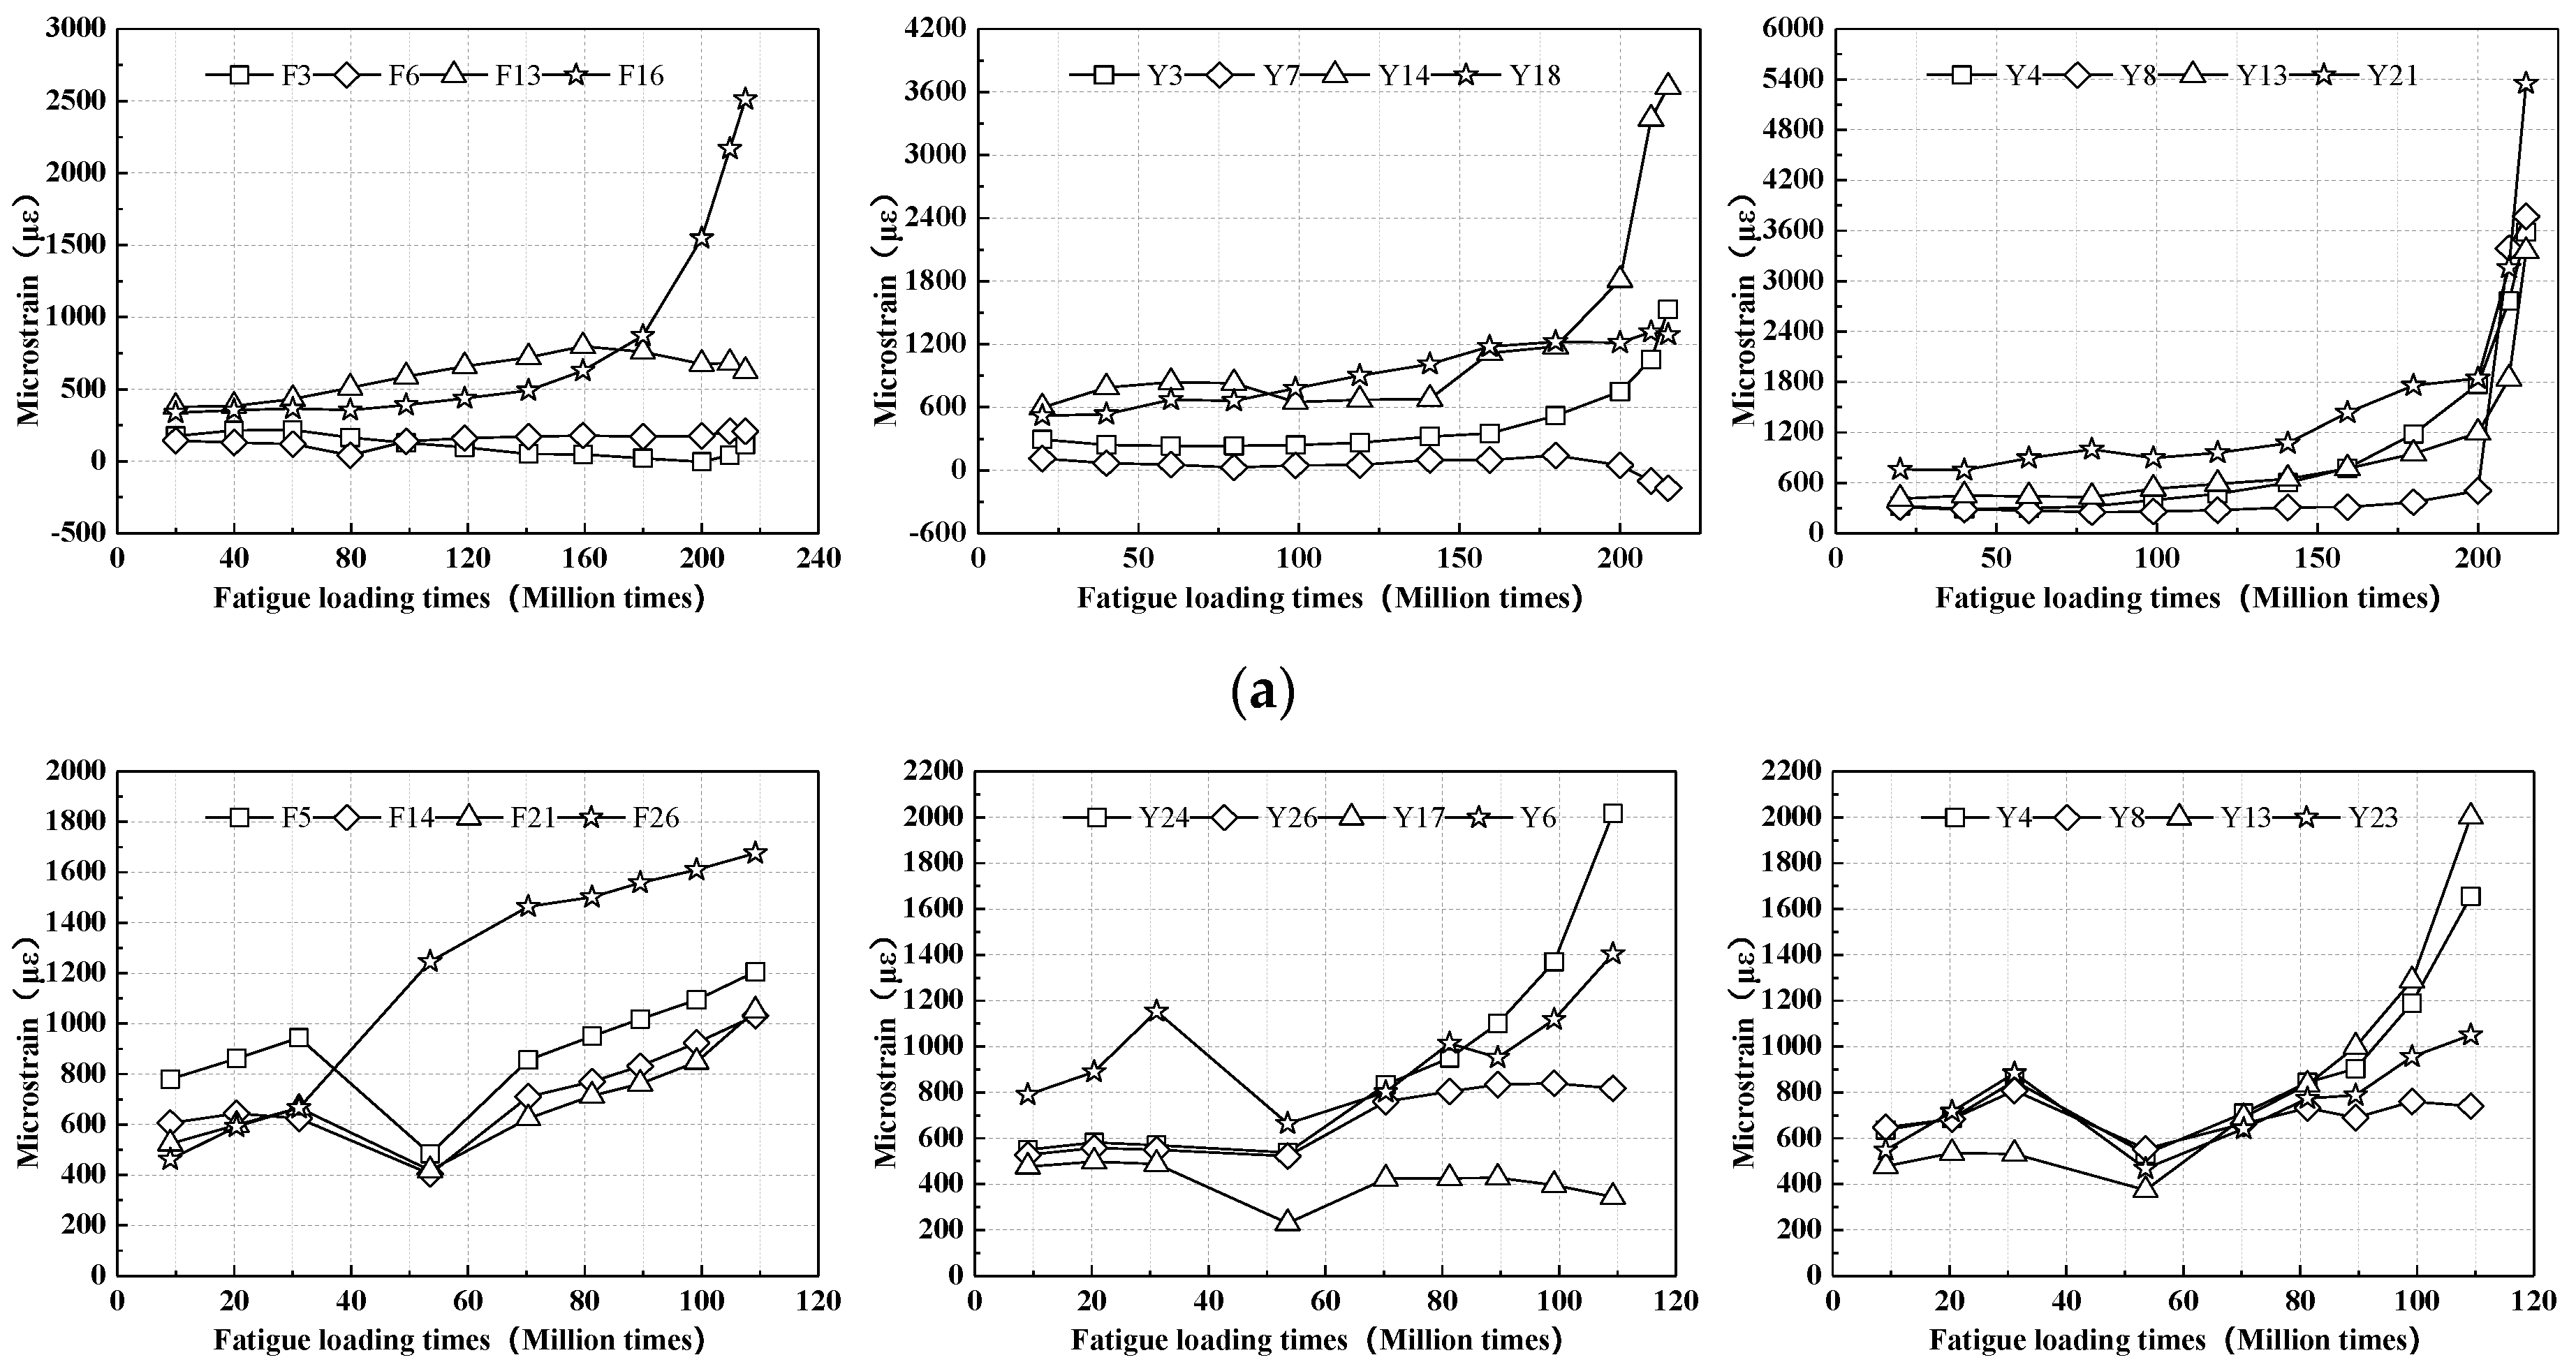
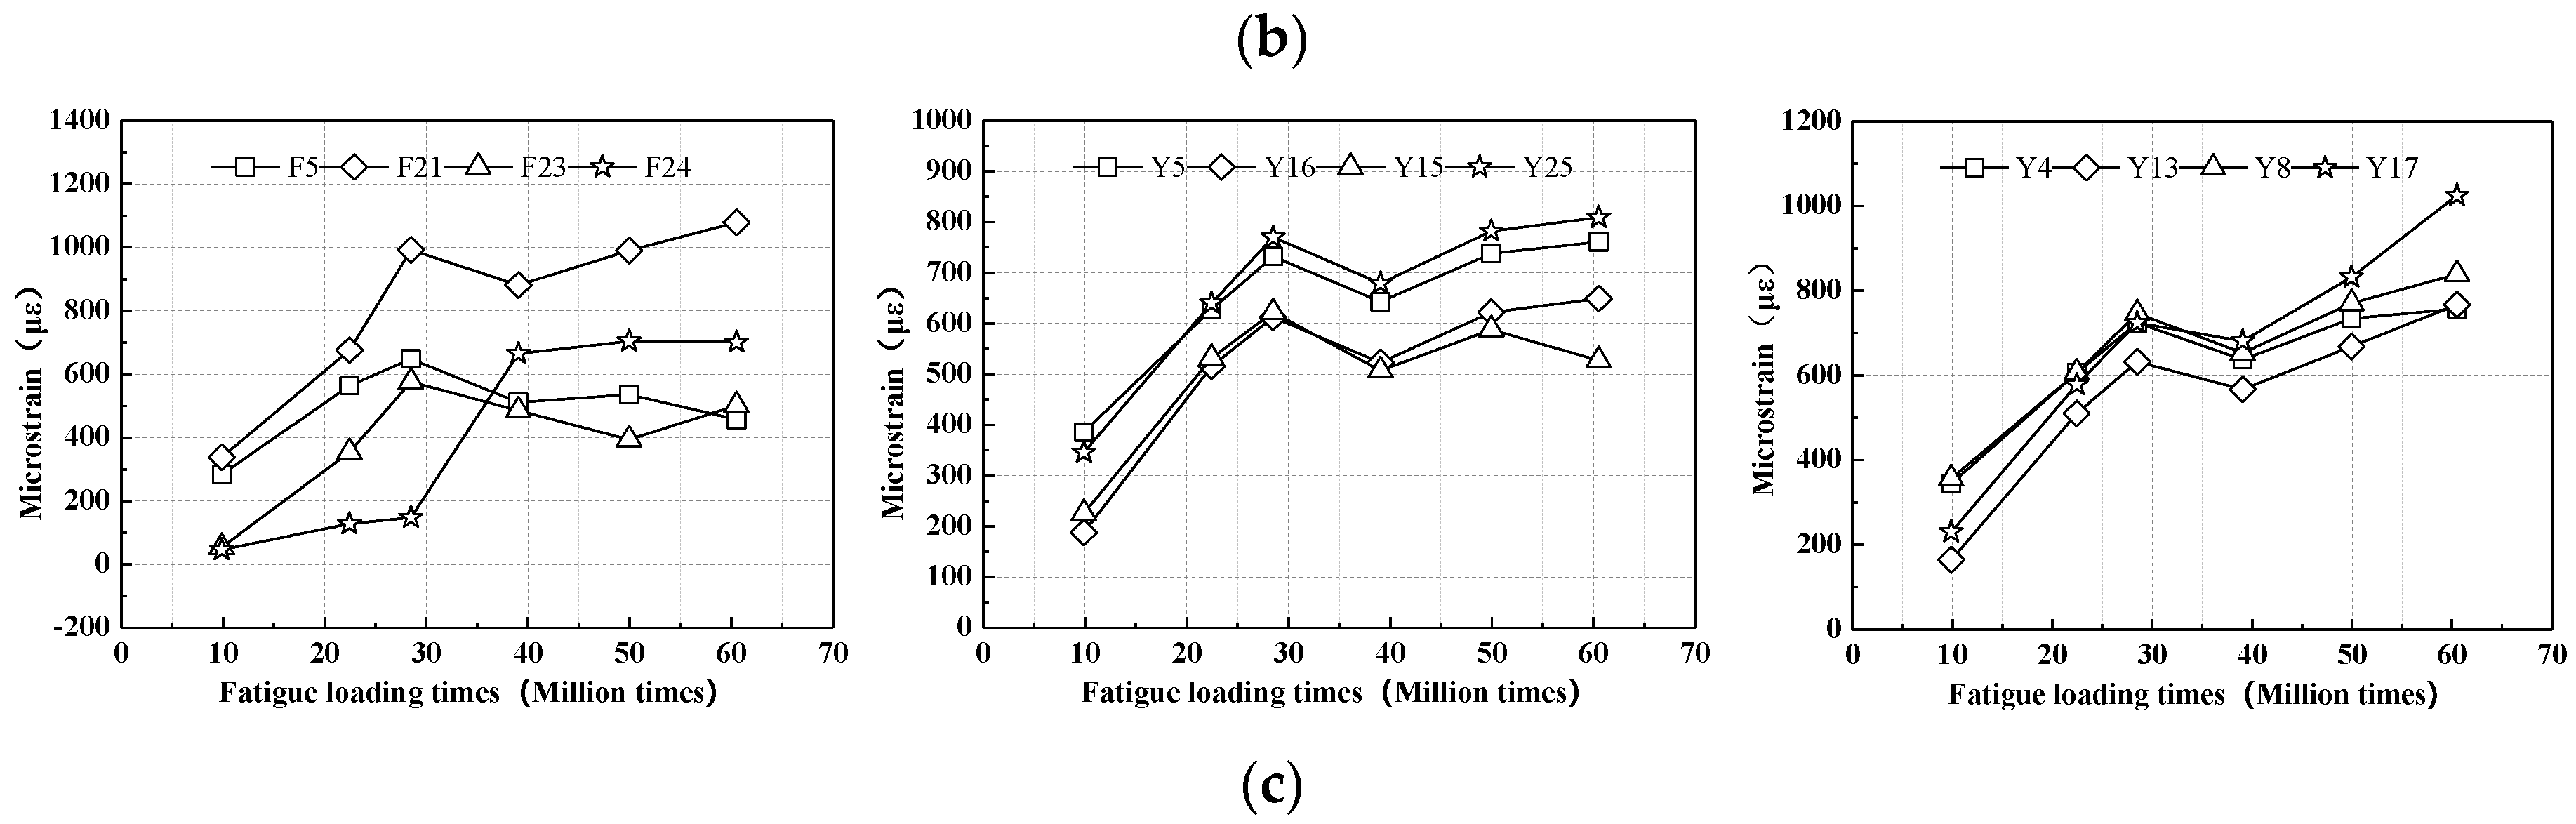
4.2. Strain Results of Fatigue Tests

According to Table 2, the corresponding fatigue loads were applied to all specimens of revised cope-hole detail. The strain curve of the specimens versus the fatigue loading cycles was depicted in Figure 14.
The fatigue damage increases with the fatigue load times. The strain state at measurement points gradually transfers from elastic strain into elastoplastic strain. Fatigue cracks appears on the specimens when the total strain exceeds the tensile strain limit of steel. The strain at some measure points continues to increase or remains, while decreases after cracking at some other measurement points. The main reason is that the stress of the measurement points near the fatigue crack is released by the stable propagation crack.
The strain data at symmetric measurement point on the flange are not consistent. This may be because of the influence of eccentric load. The fatigue crack propagation length along the flange plate surface is inconsistent. According to the observation of the fatigue experiment and the measured strain data, strain constantly changes at the initiation and propagation periods of the fatigue crack.

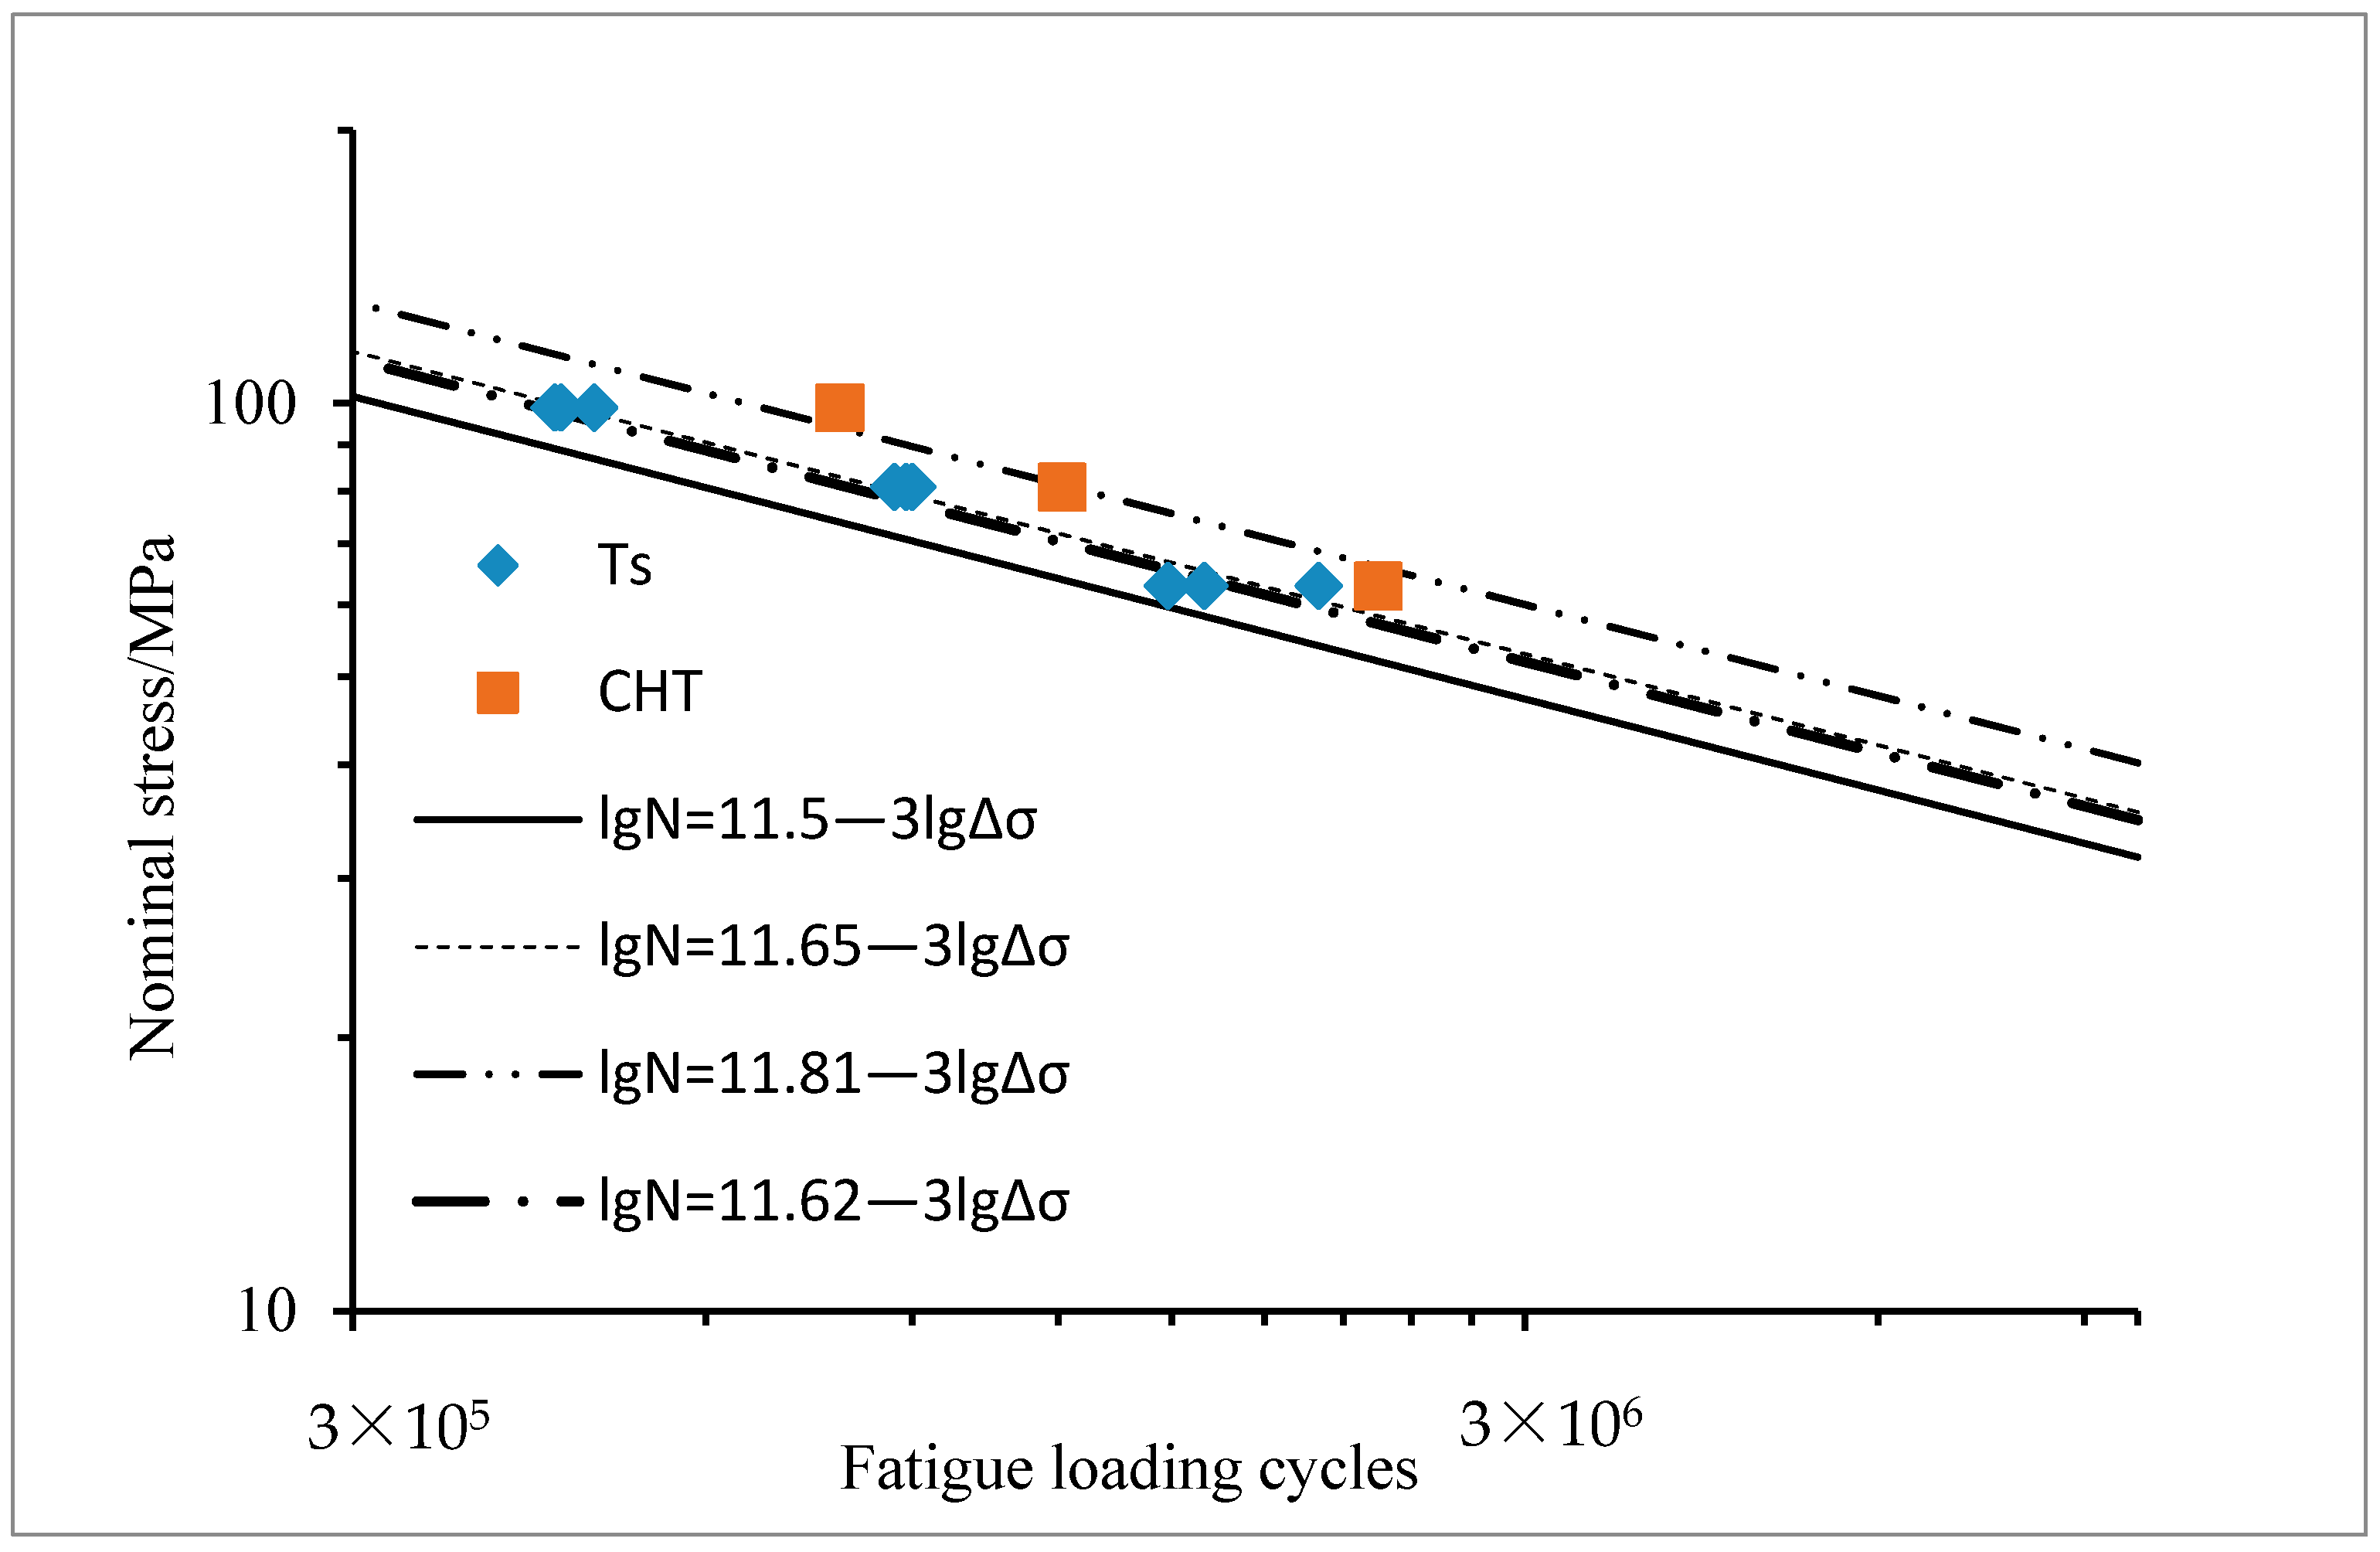
4.3. Fatigue Life Analysis

The fatigue test data of welded details with cope-hole are given in references [1,13,20,21,22]. Eurocode3 [17], IIW recommendation [18], and JSSC recommendation [23] provide the fatigue strengths that correspond to the welded details with cope-hole when the number of loading cycles is 2 million. The fatigue test data of previous welded details are given in reference [16], as shown in Table 7. In the fatigue tests, the fatigue loading cycles of revised cope-hole details are collected when the surface cracks near the cope-hole are 30 mm and 60 mm, as listed in Table 8.
According to the comparison between Table 7 and Table 8, the fatigue life of revised cope-hole details are greatly improved than that of previous welded details, regardless of the stress amplitudes. The fatigue life at the stress amplitude of 99 MPa improves the most, which is about 75%.
Based on the fatigue life of the revised cope-hole detail obtained from the fatigue experiments, regression analysis was performed for the stress amplitude and fatigue loading times through the least squares method [24]. The S-N curves of revised cope-hole details are obtained accordingly.
The S-N curve generally meets the following expression:
N = C·Δσm
where m is negative reciprocal of the slope of S-N curve and is generally related to the material property, C is a material related constant. m and C are constants to be fitted. In many standards and codes, it is recommended that m set to 3 for cope-hole details. That is to say, it is assumed that the fatigue design curves have the same constant slope.
The Equation (1) can be transformed into:
lgN = lgCm·lgΔσ
Based on the fatigue life of three revised cope-hole details specimens, the S-N curve is determined as follow:
lgN = 11.81 − 3lgΔσ
where the standard deviation is 0.19. The design S-N curve equation with a failure probability of 2.3% is determined as follow:
lgN = 11.62 − 3lgΔσ
The S-N fitting curves and test results of revised cope-hole details and previous welded details are depicted in Figure 15.
It can be concluded from Equation (4) that the fatigue stress amplitude with a failure probability of 2.3% is 59.5 MPa when the cyclic number N is 2 × 10⁶. The fatigue stress amplitude of revised cope-hole details is greater than 54.1 MPa for the previous welded details [16]. This indicates that the revised cope-hole details significantly improve the fatigue performance of previous welded details.

5. Conclusions

The following conclusions are drawn from the fatigue performance experiments and finite element analysis of revised cope-hole details:
(1) The fatigue performance of the revised cope-hole detail is better than that of the previous welded detail, which indicates that the revised cope-hole detail has a good improvement effect.
(2) The results of finite element analysis are in good agreement with the static test results, and the error at majority of measurement points is less than 22%.
(3) The S-N fitting curve of revised cope-hole details with the failure probability of 2.3% is lgN = 11.62−3lgΔσ. The fatigue stress amplitude with the failure probability of 2.3% is 59.5 MPa when the cyclic number N is 2 × 10⁶.

Author Contributions

Design, implementation, and test data collection of fatigue test, writing and modification, P.L. Introduction writing and literature collection, B.Q. Finite element modeling and data output, Y.H. Introduction modification and experimental data analysis, Y.W. Analysis of finite element results and test data, writing, Y.J. Conclusion writing and full text modification, H.Z. All authors have read and agreed to the published version of the manuscript.

Funding

The scientific subsidization project for the talented person of Putian University (2018074, 2018075, 2018076), the Natural Science Foundation of Fujian (2016J01253) and China railway corporation research and development of science and technology key project (2013G001-A-2).

Conflicts of Interest

The authors declare no conflict of interest.

Data Availability Statement

All testing raw data, calculation results and more plots not included in the study are available from the corresponding authors by request (list items: 1. Finite element calculation results of revised cope-hole details; 2. Strain data of measurement points versus fatigue cyclic loading times; 3. Test results of fatigue life for revised cope-hole details).

References

  1. Aygül, M.; Bokesjö, M.; Heshmati, M.; Al-Emrani, M. A comparative study of different fatigue failure assessments of welded bridge details. Int. J. Fatigue 2013, 49, 62–72. [Google Scholar] [CrossRef] [Green Version]
  2. Cui, C.; Bu, Y.Z.; Zhang, Q.H. Fatigue life assessment of orthotropic steel deck plate based on hot spot stress method. Bridge Constr. 2014, 44, 62–65. [Google Scholar]
  3. Deng, Y.; Ding, Y.L.; Li, A.Q. Fatigue reliability assessment for welded details of steel box girders using long-term monitoring data: Fatigue reliability indices. China Civ. Eng. J. 2012, 45, 86–87. [Google Scholar]
  4. Guo, T.; Li, A.Q. Fatigue life assessment of welds in bridge decks using long term monitoring data. China Civ. Eng. J. 2009, 42, 66–72. [Google Scholar]
  5. Jie, Z. Study on the Fatigue Performance of Welded Joints in Steel Bridges under Prior Corrosion and Complex Stress Fields. Ph.D. Thesis, Southwest Jiaotong University, Chengdu, China, 2015. [Google Scholar]
  6. Liao, P.; Wei, X.; Xiao, L.; Tang, J.S. Experimental research on the girder’s new detail fatigue performance of Hutong railway Yangtze river bridge. China Civ. Eng. J. 2016, 49, 76–83. [Google Scholar]
  7. Liao, P.; Xiao, L.; Wei, X.; Zhao, R.D.; Tang, J.S. Fatigue life prediction and parameter analysis of girder new detail. J. Southwest Jiaotong Univ. 2016, 51, 639–644. [Google Scholar]
  8. Liao, P. The Fatigue Performance Analysis on the Welded Detail of Cope Hole of the Ventral Rod of Steel Truss Bridge. Master’s Thesis, Southwest Jiaotong University, Chengdu, China, 2014. [Google Scholar]
  9. Liao, P.; Wang, Y.B.; Zhang, X.C.; Zhao, R.D.; Jia, Y.; Zhu, H.F. Fatigue life assessment and reliability analysis of cope-hole details in steel bridges. Balt. J. Road Bridge Eng. 2020, 15, 26–46. [Google Scholar] [CrossRef] [Green Version]
  10. Radaj, D.; Sonsino, C.M.; Fricke, W. Recent Developments in Local Concepts of Fatigue Assessment of Welded Joints. Int. J. Fatigue 2009, 31, 2–11. [Google Scholar] [CrossRef]
  11. Wei, X.; Li, J.; Qiang, S.Z. Fatigue test on the semirigid connections between railway floor beam and primary truss of long span steel truss arch bridges. China Civ. Eng. J. 2009, 45, 73–79. [Google Scholar]
  12. Aygül, M.; Al-Emrani, M.; Urushadze, S. Modeling and fatigue life assessment of orthotropic bridge deck details using FEM. Int. J. Fatigue 2012, 40, 129–142. [Google Scholar] [CrossRef]
  13. Miki, C.; Tateishi, K. Fatigue strength of cope hole details in steel bridges. Int. J. Fatigue 1997, 19, 445–455. [Google Scholar] [CrossRef]
  14. Park, W.; Miki, C. Fatigue assessment of large-size welded joints based on the effective notch stress approach. Int. J. Fatigue 2008, 30, 1556–1568. [Google Scholar] [CrossRef]
  15. Aygül, M. Fatigue Analysis of Welded Structures Using the Finite Element Method. Master’s Thesis, Chalmers University of Technology, Gothenburg, Sweden, 2012. [Google Scholar]
  16. Wei, X.; Xiao, L.; Tang, J.S. Fatigue Performance of Welded Detail at Connection between Web Member and Full-welded Joint in Steel Truss Bridge. J. China Railw. Soc. 2018, 40, 110–116. [Google Scholar]
  17. European Committee for Standardization (CEN). EN 1993-1-9. Eurocode3: Design of Steel Structures, Part 1–9: Fatigue; European Standards: Brussels, Belgium, 2005.
  18. IIW. Recommendations for Fatigue Design of Welded Joints and Components, IIW-1823-07; International Institute of Welding: Paris, France, 2008.
  19. Wei, X.; Xiao, L.; Pei, S. Fatigue assessment and stress analysis of cope-hole details in welded joints of steel truss bridge. Int. J. Fatigue 2017, 100, 136–147. [Google Scholar] [CrossRef]
  20. Stallmeyer, J.E.; Fisher, W.E. Behavior of Welded Build-Up Beams under Repeated Loads; University of Illinois at Urbana-Champaign: Urbana, IL, USA, 1958. [Google Scholar]
  21. Xiao, Z.; Yamada, K. Fatigue strength of intersecting attachments. J. Struct. Eng. 2005, 131, 924–932. [Google Scholar] [CrossRef]
  22. Heshmati, M. Fatigue Life Assessment of Bridge Details Using Finite Element Method. Master’s Thesis, Chalmers University of Technology, Gothenburg, Sweden, 2012. [Google Scholar]
  23. JSSC. Fatigue Design Recommendations for Steel Structures; Japanese Society of Steel Construction: Tokyo, Japan, 2012.
  24. Chen, Y.X.; Lu, P.M.; Guo, C.J.; Li, D.T.; Wang, B.H. Study on fatigue performance of orthotropic steel bridge deck U-rib and cover weld structure. J. Chang’an Univ. 2014, 31, 49–55. [Google Scholar]
Figure 1. Previous cope-hole welded detail.
Metals 10 01092 g001
Figure 2. Revised cope-hole welded detail.
Metals 10 01092 g002
Figure 3. Dimensions of revised cope-hole detail. (a) Dimensions of flange (units: mm); (b) dimensions of web (units: mm).
Metals 10 01092 g003
Figure 4. Plan view of strain gauge locations. (a) Strain gauge of web (units: mm); (b) strain gauge of flange (units: mm).
Metals 10 01092 g004
Figure 5. Loading system.
Metals 10 01092 g005
Figure 6. Loading protocol.
Metals 10 01092 g006
Figure 7. Finite element model and analytical results. (a) Finite element model of the core research segment; (b) stress distribution of web (unit: Pa); (c) stress distribution of flange (unit: Pa).
Metals 10 01092 g007
Figure 8. Crack initiation locations.
Metals 10 01092 g008
Figure 9. A certain size of fatigue crack.
Metals 10 01092 g009
Figure 10. Penetrated crack of flange.
Metals 10 01092 g010
Figure 11. Fatigue crack of web.
Metals 10 01092 g011
Figure 12. Fatigue failure process and phenomena of revised welded detail. (a) Fatigue crack of flat surface; (b) fatigue crack of slotting surface.
Metals 10 01092 g012
Figure 13. Fatigue fracture failure.
Metals 10 01092 g013
Figure 14. Strain of measure points vs fatigue cyclic loading times. (a) Strain of CHT1′s measure points; (b) strain of CHT2′s measure points; (c) strain of CHT3′s measure points.
Metals 10 01092 g014aMetals 10 01092 g014b
Figure 15. Fitting S-N curves and test results of two details.
Metals 10 01092 g015
Table 1. Mechanical properties, data from [19].
Yield Strength (MPa)Ultimate Tensile Strength (MPa)Elongation (%)Chemical Composition (wt.%)
CSiMnPSVNb
345470–630220.20.551–1.60.0350.0350.02–0.150.015–0.06
Table 2. Corresponding number of strain gauges.
NumberCorresponding NumberNumberCorresponding Number
F3(+)F19F15(+)F27
F4(+)F20F16(+)F28
F5(+)F21Y4(+)Y21
F6(+)F22Y6(+)Y22
F7(+)F23Y8(+)Y23
F12(+)F24Y13(+)Y24
F13(+)F25Y15(+)Y25
F14(+)F26Y17(+)Y26
Table 3. Fatigue loading parameters.
Specimen NumberStress Amplitude (MPa)Load Amplitude (kN)Loading Frequency (Hz)
CHT19954.20~542.003.00
CHT29049.28~492.803.00
CHT36334.50~345.003.20
Note: CHT represents the name of the specimens.
Table 4. Static loading parameters (kN).
Level34.50~345.0049.28~492.8054.20~542.00
134.5049.2854.20
2100.00140.00150.00
3180.00240.00250.00
4260.00340.00350.00
5345.00492.80542.00
Table 5. Comparison between static loading test results and finite element ones.
CodeMeasured Value/μεFEA/μεDifference/%CodeMeasured Value/μεFEA/μεDifference/%
F136832214Y427635422
F235632510Y631636413
F54705077Y827235423
F837432216Y2429436920
F937032514Y2629036921
F1039232521F2533637410
F1457250713F263303496
F1737432515F274083749
F1838632220F283443687
F2041236812F223943745
Table 6. Strain comparison between revised cope-hole details and previous welded details.
CodePrevious Welded Details (με)Revised Cope-Hole Details (με)Difference (%)
Flat SurfaceSlotting SurfaceFlat SurfaceSlotting Surface
F217163495075129
Y84343543691815
Y224923643951814
Table 7. Fatigue life of previous welded details.
CodeStress AmplitudeFatigue Loading Cycles (×104)Average Fatigue Loading Cycles (×104)
30 mm60 mm30 mm60 mm
Ts1163158.7200.1145.8169.6
Ts1263136.5159.8
Ts1363142.3148.8
Ts218184.588.982.388.6
Ts228176.486.9
Ts238185.990.1
Ts319942.545.243.846.0
Ts329946.248.2
Ts339942.744.6
Table 8. Fatigue life of revised cope-hole details.
CodeStress AmplitudeFatigue Loading Cycles (×104)
30 mm60 mm
CHT163211.7224.7
CHT281111.9120.8
CHT39973.678.1

