Article

Determination of Constitutive Equation and Thermo–Mechanical Processing Map for Pure Iridium

1
State Key Laboratory of Solidification Processing, Northwestern Polytechnical University, Xi’an 710072, China
2
Kunming Institute of Precious Metals, Kunming 650106, China
*
Author to whom correspondence should be addressed.
Metals 2020, 10(8), 1087; https://doi.org/10.3390/met10081087
Submission received: 14 July 2020 / Revised: 8 August 2020 / Accepted: 9 August 2020 / Published: 12 August 2020
(This article belongs to the Special Issue Advances in Plastic Deformation Technologies)

Abstract

:
Deformation behavior of pure iridium has been studied during thermal compression testing with the help of Gleeble-1500D in the temperature range of 1200 °C~1500 °C and strain rate range of 10−1 s−1~10−2 s−1. Resistance to deformation, microstructural evolution and hot workability of pure iridium have been used to analyze in detail. Frictional coefficient has been used to modify the experimental stress–strain curve of thermal compression test, and it has been found effective in reducing the influence of friction during thermo–mechanical testing. The hyperbolic sine constitutive equation of pure iridium has been established to give a material processing model for numerical simulation. A very high value of activation energy for iridium, 573 KJ/mol, clearly indicates that it is very hard to deform this material. The deformation mechanism of pure iridium is dependent upon temperature as well as strain rate. At low temperature and strain rate (temperature range of 1200 °C~1300 °C and strain rate range of 10−1 s−1~10−2 s−1), dynamic recovery is active while dynamic recrystallization becomes operative as temperature and stain rate are increased. On further increase in temperature and decrease in strain rate (temperature range of 1400 °C~1500 °C and strain rates of 10−2 s−1~10−3 s−1), abnormal grain growth takes place. On the basis of a constitutive model and processing map, suitable forming process parameters (temperature range of 1400 °C~1500 °C and strain rate range of 0.1 s−1~0.05 s−1) for pure iridium have been worked out.

1. Introduction

Iridium is a precious metal which belongs to the platinum group. It has a high melting point (2443 °C) and density (22.56 g/cm3). Due to unique characteristics like excellent mechanical properties at elevated temperatures, chemical stability and oxidation resistance, iridium and its alloys are extensively used in the military, electronics, aeronautical and astronautic industries despite its high cost [1,2]. Ir-0.3 pct W alloy, used as a sealing container for PuO2 nuclear fuel, can be used for thousands of hours at the temperature of 2100 °C~2200 °C without any deterioration [3]. In addition, iridium films manufactured by target materials are considered as the ideal materials for diffusion barrier and seed layer of electroplating process for unseeded copper in integrated circuits [4]. Therefore, the target materials used in integrated circuits requires high purity, compactness and fine grains. Unlike other FCC metals, iridium fractures in brittle mode at room temperature. Nowadays, there are still many disputes over its deformation behavior. Cawkwell [5] believed that the brittleness of pure iridium results from the high dislocation density caused by a special screw dislocation in the crystal, but Panfilov et al. [6] reported the main reason of brittleness is the covalent bond with an orientation, which hindered the processing and application of iridium products. Most researchers focused on the plasticity characteristics, and destruction mechanisms of polycrystalline iridium during straining [7].
To understand the deformation behavior of various metals and alloys, laboratory scale physical simulations have been practiced since the past few years [8,9]. The constitutive equation and processing map are built on the basis of experimental curves. Furthermore, combining with the microstructures, the deformation mechanism is available. However, there are few studies that can explain the deformation behavior, microstructural changes, mechanical properties evolved and energy consumed during plastic deformation under compression of polycrystalline iridium. Deformation resistance under compression of polycrystalline iridium has been investigated in temperature range of 900 °C~1400 °C and strain rates of ε ˙ = 0.2 s–1~20 s–1 [4], however microstructural changes and mechanical properties during these studies have seldom been reported. A limited amount of data related to mechanical properties of iridium in the temperature range of 1650 °C~2300 °C are available [7].
In this work, the deformation properties of pure iridium have been examined through hot compression tests in the temperature range of 1200 °C~1500 °C and strain rate range of 10−3 s−1~10−1 s−1. Effect of deformation parameters like temperature and strain rate on plastic deformation, evolution of microstructure and mechanical properties has been analyzed quantitatively. On the basis of hyperbolic sine model and dynamic material model, constitutive equation (CE) and processing maps (PM) of pure iridium have been developed. In addition, forming process parameters have also been optimized on the basis of CE and PM. This scientific work provides a reference to design and optimize the forming process of pure iridium.

2. Materials and Methods

2.1. Preparation of Compression Specimen

For experimentation, pure iridium, was obtained from a cylindrical rod by electron beam floating zone melting. Purity level of iridium was 99.95% and it was supplied by Kunming Institute of precious metals. The density of material is 22.37 g/cm3 and its relative density reaches 99%. Microhardness of the tested materials is 453. Table 1 lists the concentration of impurities present in iridium samples. Cylindrical samples were cut from a forged bar of iridium and machined into final dimensions of 6 mm and 9 mm as their diameter and length, respectively.

2.2. Hot Compression Test

In the experiment, a Gleeble-1500D tester (DSI Inc., Saint Paul, MA, USA) was used for testing the deformation behavior of iridium under thermal compression the temperature range of 1200 °C~1500 °C (1200 °C, 1300 °C, 1400 °C and 1500 °C) under the strain rate range of 10−1 s−1 to 10−3 s−1 (10−1 s−1, 10−2 s−1, 10−3 s−1). In vacuum environment, specimens were preheated to compressive temperature at a heating rate of 20 °C/s and were held on this temperature 60 s, then deformed to the true strain of 0.6. The temperature deviation of machine can be dominated within the scope of ±10 °C. Deformed samples were quenched immediately to retain the high temperature deformed microstructure for analysis. Tungsten ball indenter were used to study the hardness profile of the compressed samples. To reduce the friction and improve the deformation uniformity, graphite and tantalum sheets were used during the thermal compression testing. The time–temperature diagram of thermal compression test is shown in Figure 1.

2.3. Microstructure Characterization

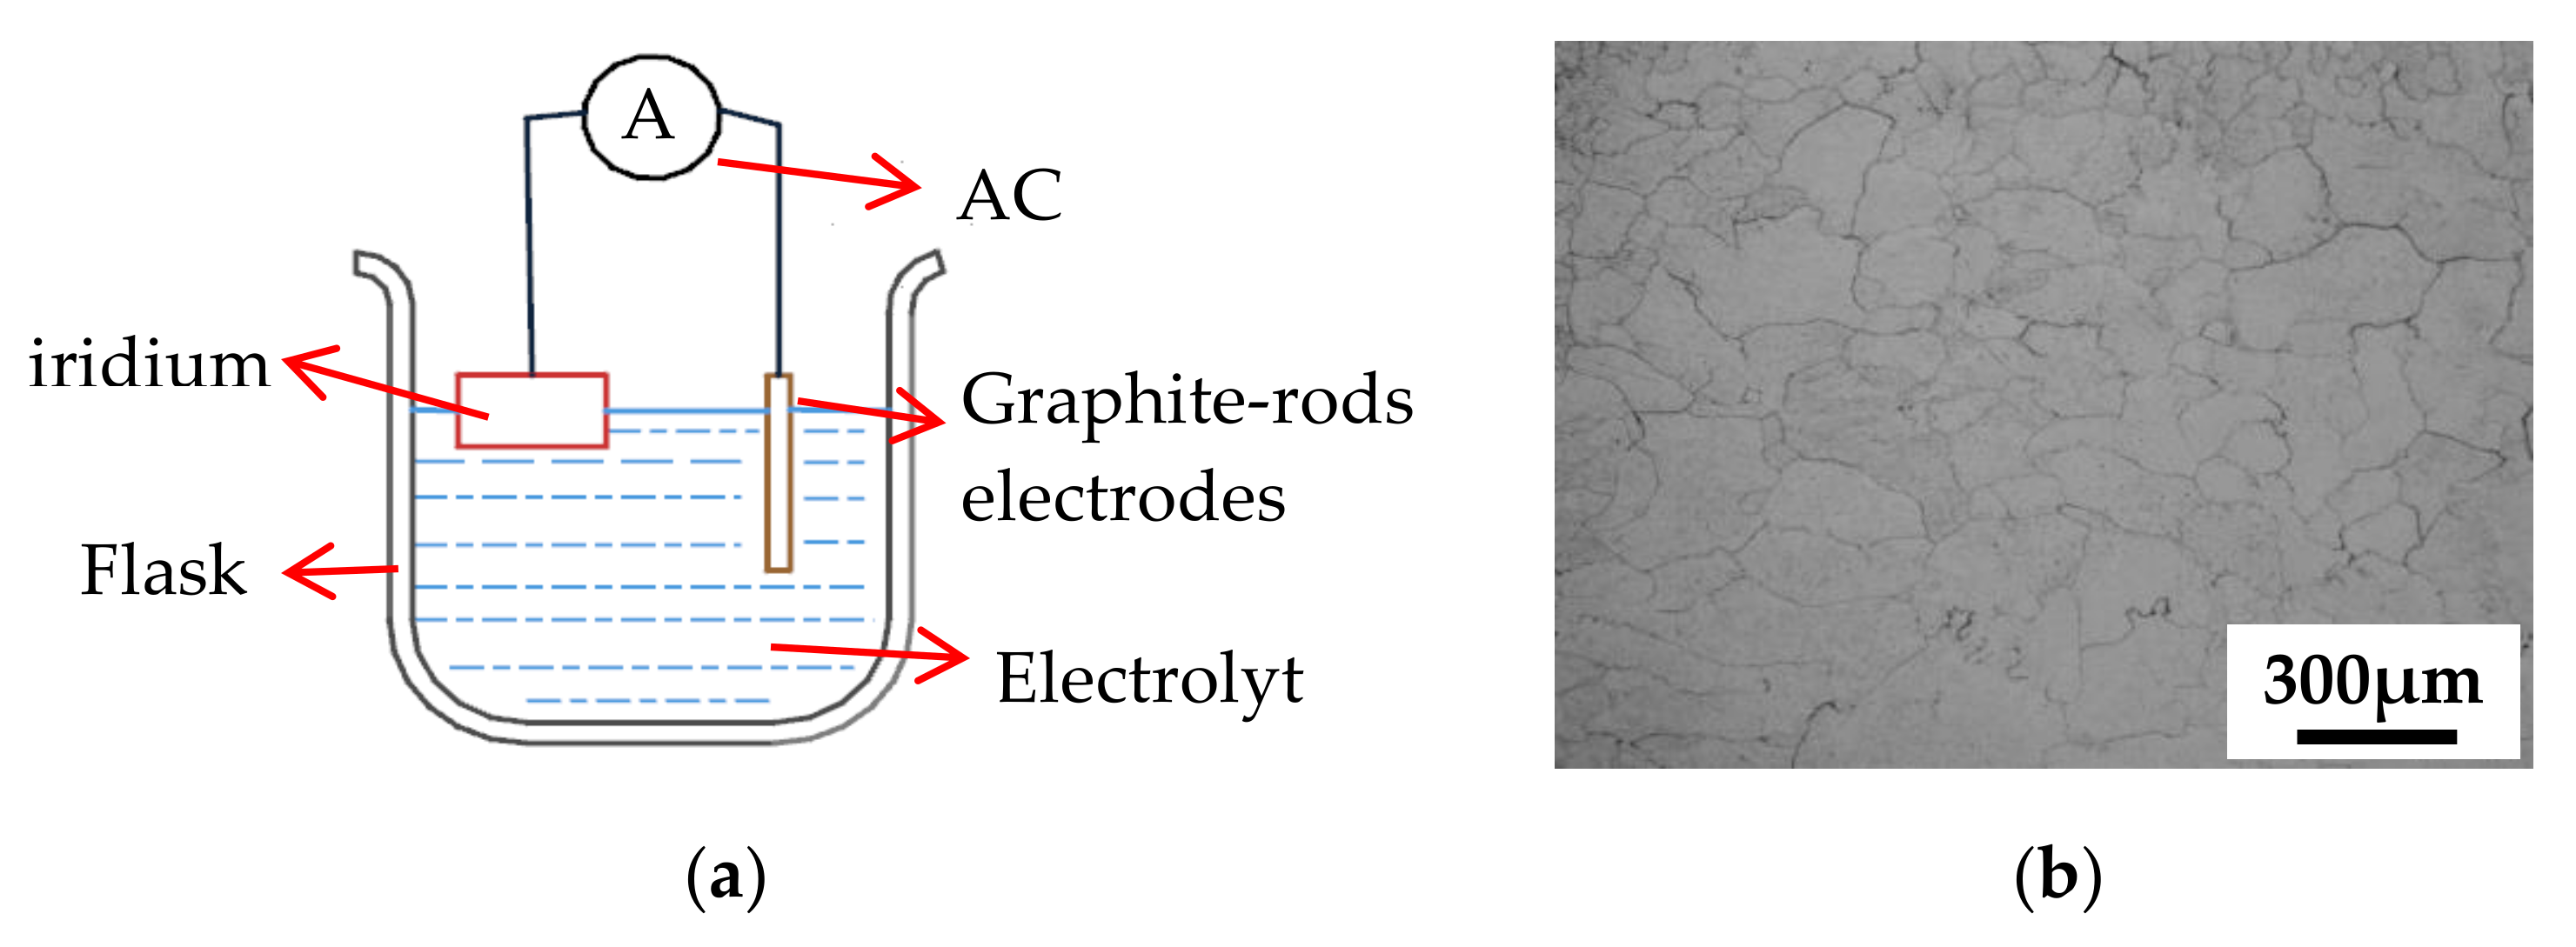
The samples for microstructural analysis were cut from center of deformed samples along the direction of compression. Then specimens were polished, smoothed and electrolytic etched by a 100 mL saturated solution of NaCl containing 35 g H, and 3–5 g HCl [10]. Apparatus used for electrolytic corrosion is shown in Figure 2a. The precision instruments of SEM (TM4000PLUS, HITACHI Inc., Tokyo, Japan) and Optical Microscopy (PMG3, OLYMPUS Inc., Tokyo, Japan) were used for observation and analysis of deformation microstructure. Figure 2b shows the original microstructure of pure iridium. Uniformity distributed coarse grains can be seen in Figure 2b.

3. Results and Discussion

3.1. Modification of Flow Stress Curves

The friction between the specimens and pressing heads is a significant factor leading to asymmetry of the specimens in the process of deformation [11]. It changes the stress state of deformation specimen from uniaxial compressive stresses to multi-directional complex stresses, which hinders the free flow of material in the radial direction especially in the region close to the end face. Consequently, the bulge appears on the side wall of specimens, as show in Figure 3. Shen et al. [12] proposed to correct the measured flow stress by taking into account the influence of friction stress at contact surface.
The bulge coefficient “B” [13] was proposed to judge the accuracy of flow stress curve obtained during experiment. B is calculated based on the change of specimen size before and after deformation. It can be calculated by the following expression (Equation (1)):
B = h f D f 2 h 0 D 0 2 ,
where h0, D0, hf and Df are the height and diameter of the deformed or un-deformed specimens, respectively, as shown in Figure 3. The curve does not need to be corrected, because the sample is less affected by friction as 1 < B < 1.1. If B > 1.1, then test curve has significant deviation due to the large friction force, so the curve needs friction correction [13]. Equation (2) can be used to revise flow stress affected by interface friction [11].
σ = σ 0 C 2 2 [ exp ( C ) - C - 1 ] ,
where σ0 and σ are the stresses before and after revision. The correction factor C is expressed by the formula: C = 2mR/hf. Here, R = D 0 2 h 0 / h f , m = ( R / h f ) B ( 4 / 3 ) - ( 2 B / 3 3 ) .
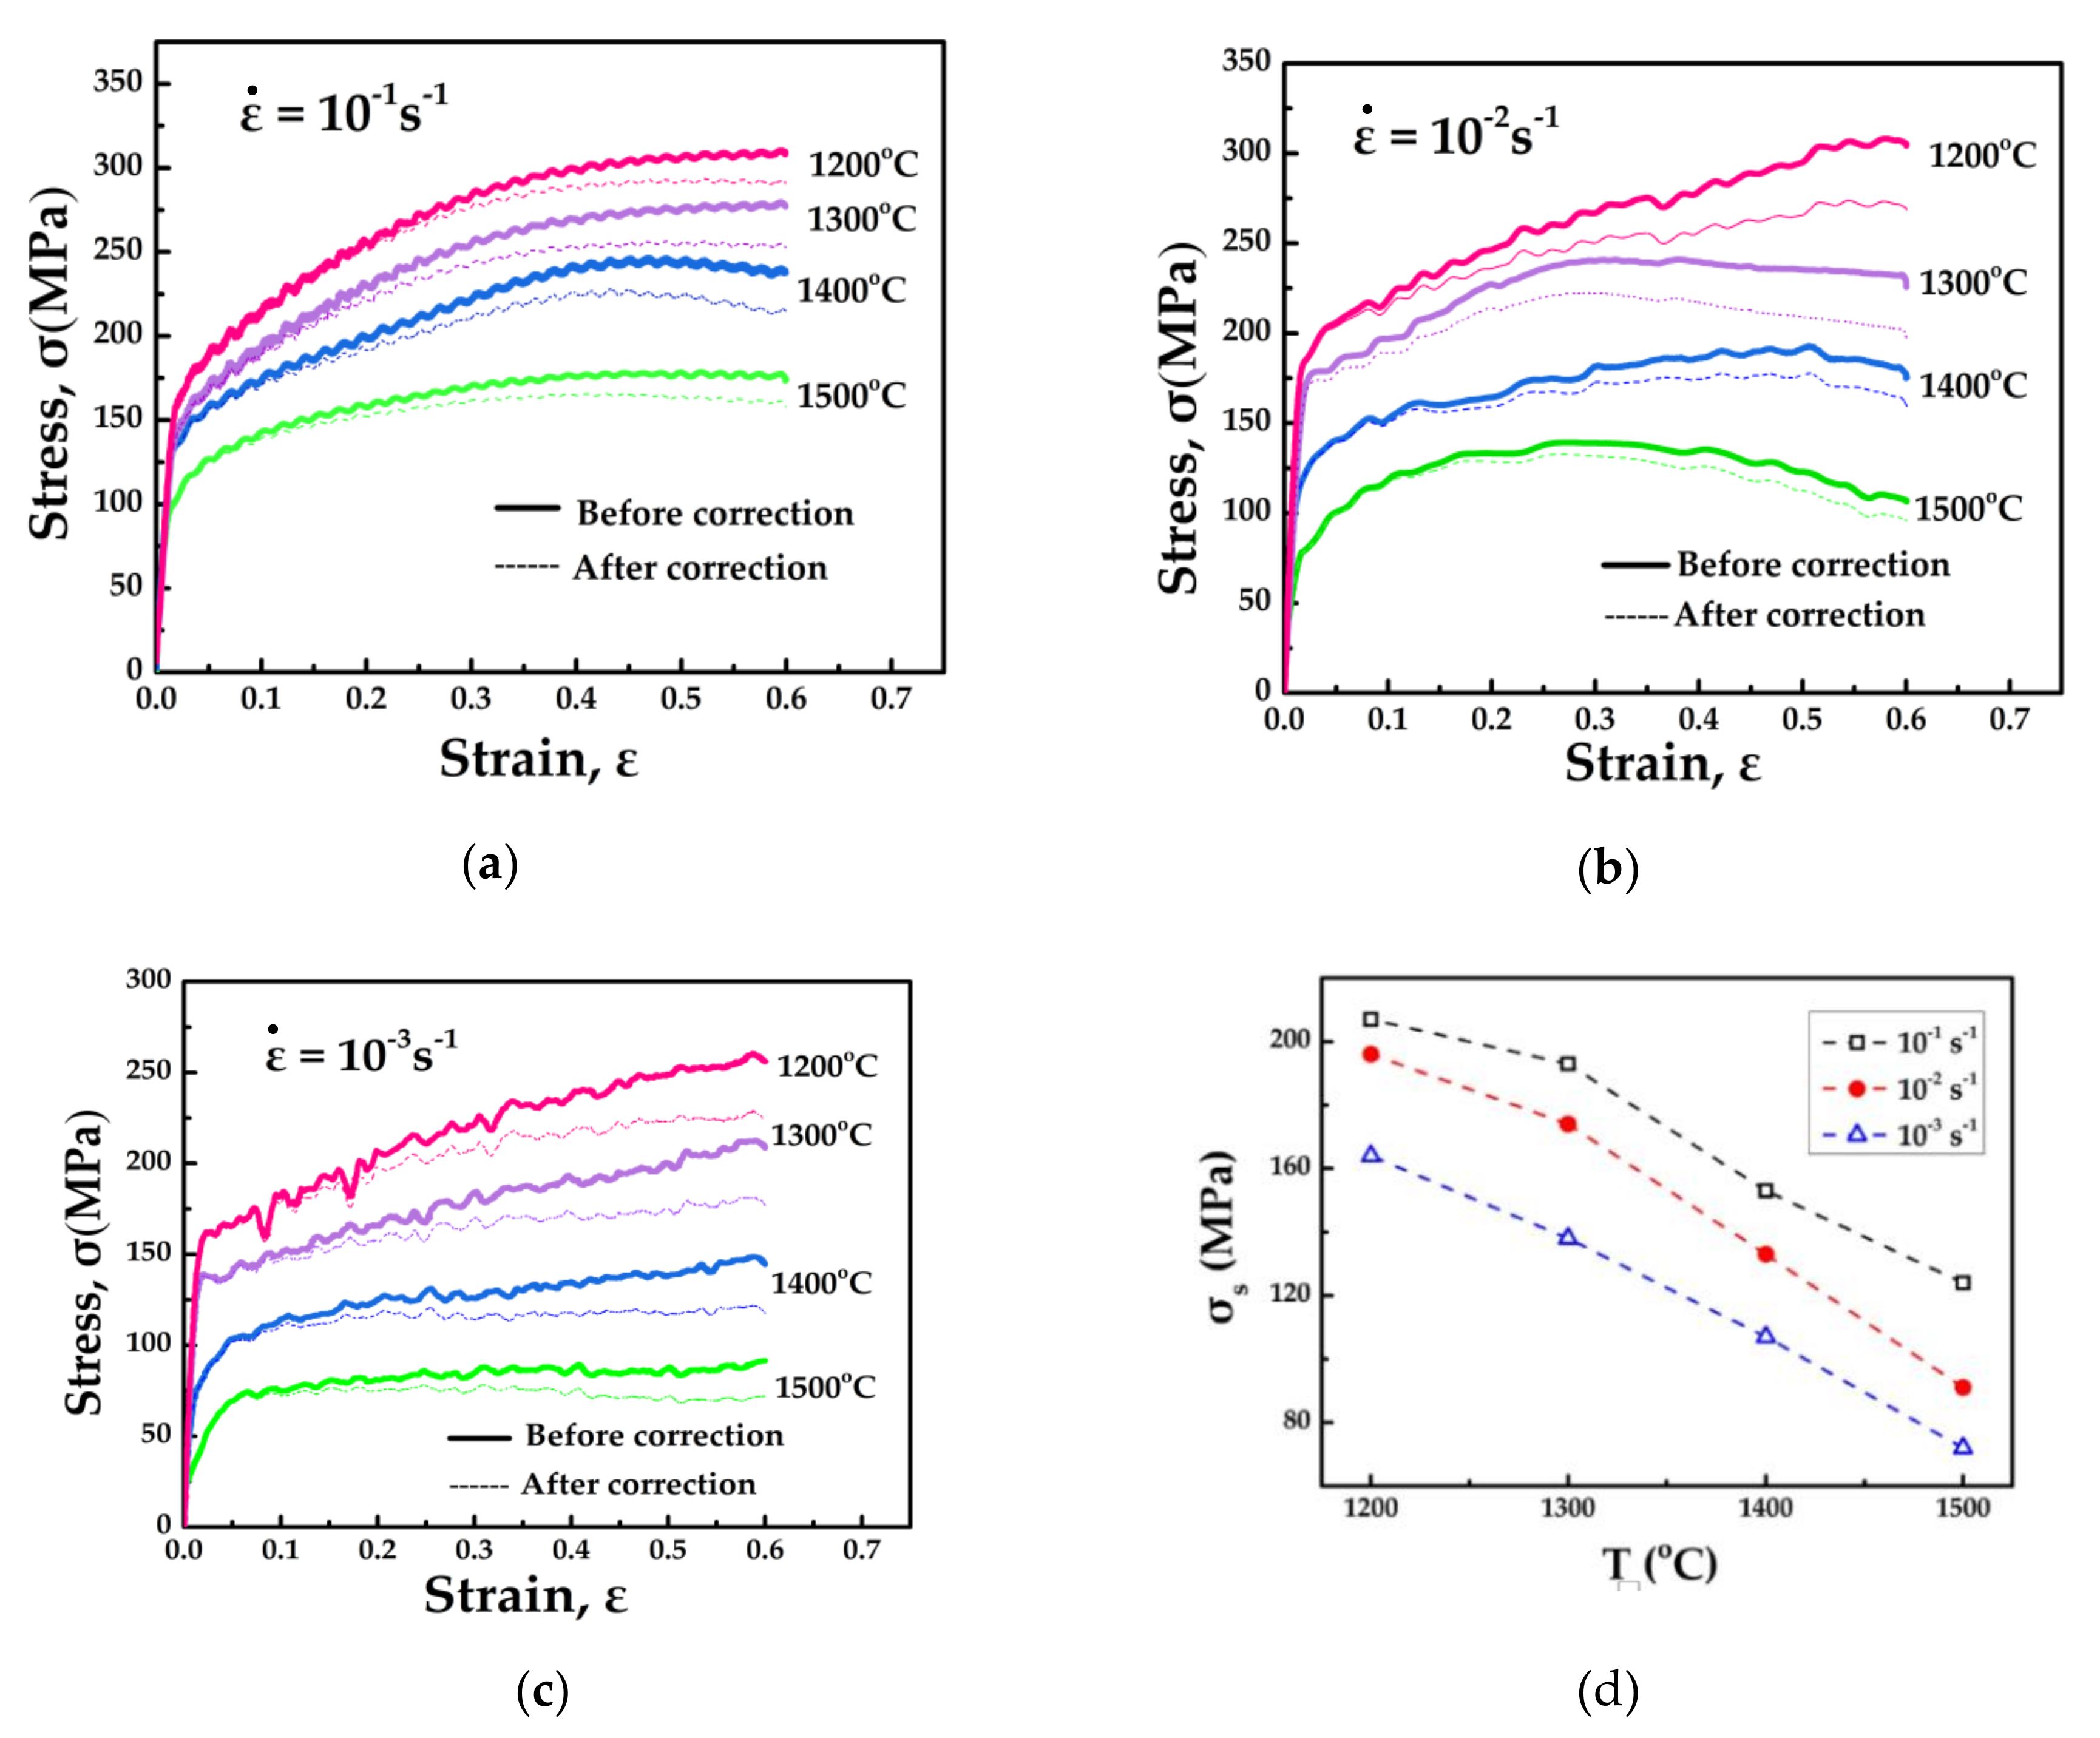
The bulge coefficient B of samples was calculated according to Formula (1), as shown in Table 2. It is found that the B of all samples is more than 1.1, which indicates that the curves need to be modified. Figure 4a–c shows contrasts of flow stresses before and after revision for pure iridium under various forming conditions. Variation of compression yield strength (σs) with deformation conditions is shown in Figure 4d. At 1200 °C, 101 s1, σs is 208.6 MPa. With the deformation temperature increasing and strain rate decreasing, σs is sharply diminished to 72.1 MPa.

3.2. Constitutive Equations of Flow Stress for Pure Iridium

Peak stress is a vital parameter to respond to the hot forming process for material [14], and it is also one of the important indexes to determine the hot processing technology. Therefore, the constitutive equation of pure iridium is established according to the peak stress.
Sellars and Whiteman [15] proposed a hyperbolic sine constitutive equation to characterize the relations among the forming conditions:
ε ˙ = A [ s i n h ( a s ) ] n exp [ - Q a c t RT ] ,
where A, α, n are undetermined normal values related to material properties, R = 8.314 mol·J−1·K−1. Qact is the apparent activation energy in the process of forming (J·mol−1), which can be used to express the difficulty of material deformation. The mathematical expression of Qact is shown in Equation (4).
Q a c t = R { ln ε ˙ ln [ sin h ( a σ ) ] } r = c o n s t { ln [ sin h ( a σ ) ] ( 1 / T ) } ε ˙ = c o n s t ,
To establish the Qact value, constant α needs to be calculated first. Previous studies have found that in the low stress level (ασ < 0.8), the relationship between stress σ and strain rate ε ˙ of different materials in plastic deformation process can be described as Equation (5) [16,17,18].
ε ˙ = A 1 σ n 1 exp ( - Q a c t RT ) ,
where A1 and n1 are constants independent of deformation temperature. In the high stress level (0.8 ≤ ασ < 1.2), both A1 and n1 are full with power exponent relationship and can be expressed as Equation (6) [16,17,18].
ε ˙ = A 2 exp ( β σ ) exp ( - Q a c t RT ) ,
where A2 and β are constants independent of deformation temperature. Comparing Equations (3), (5) and (6), it is found that the constants α, β and n1 are fully with α = β/n1 [16,17,18]. The natural logarithm of Equations (5) and (6) are used for solving materials constants β and n1.
ln ε ˙ = ln A 1 + n 1 ln σ - ( Q a c t RT ) ,
ln ε ˙ = ln A 2 + β σ - ( Q a c t RT ) ,
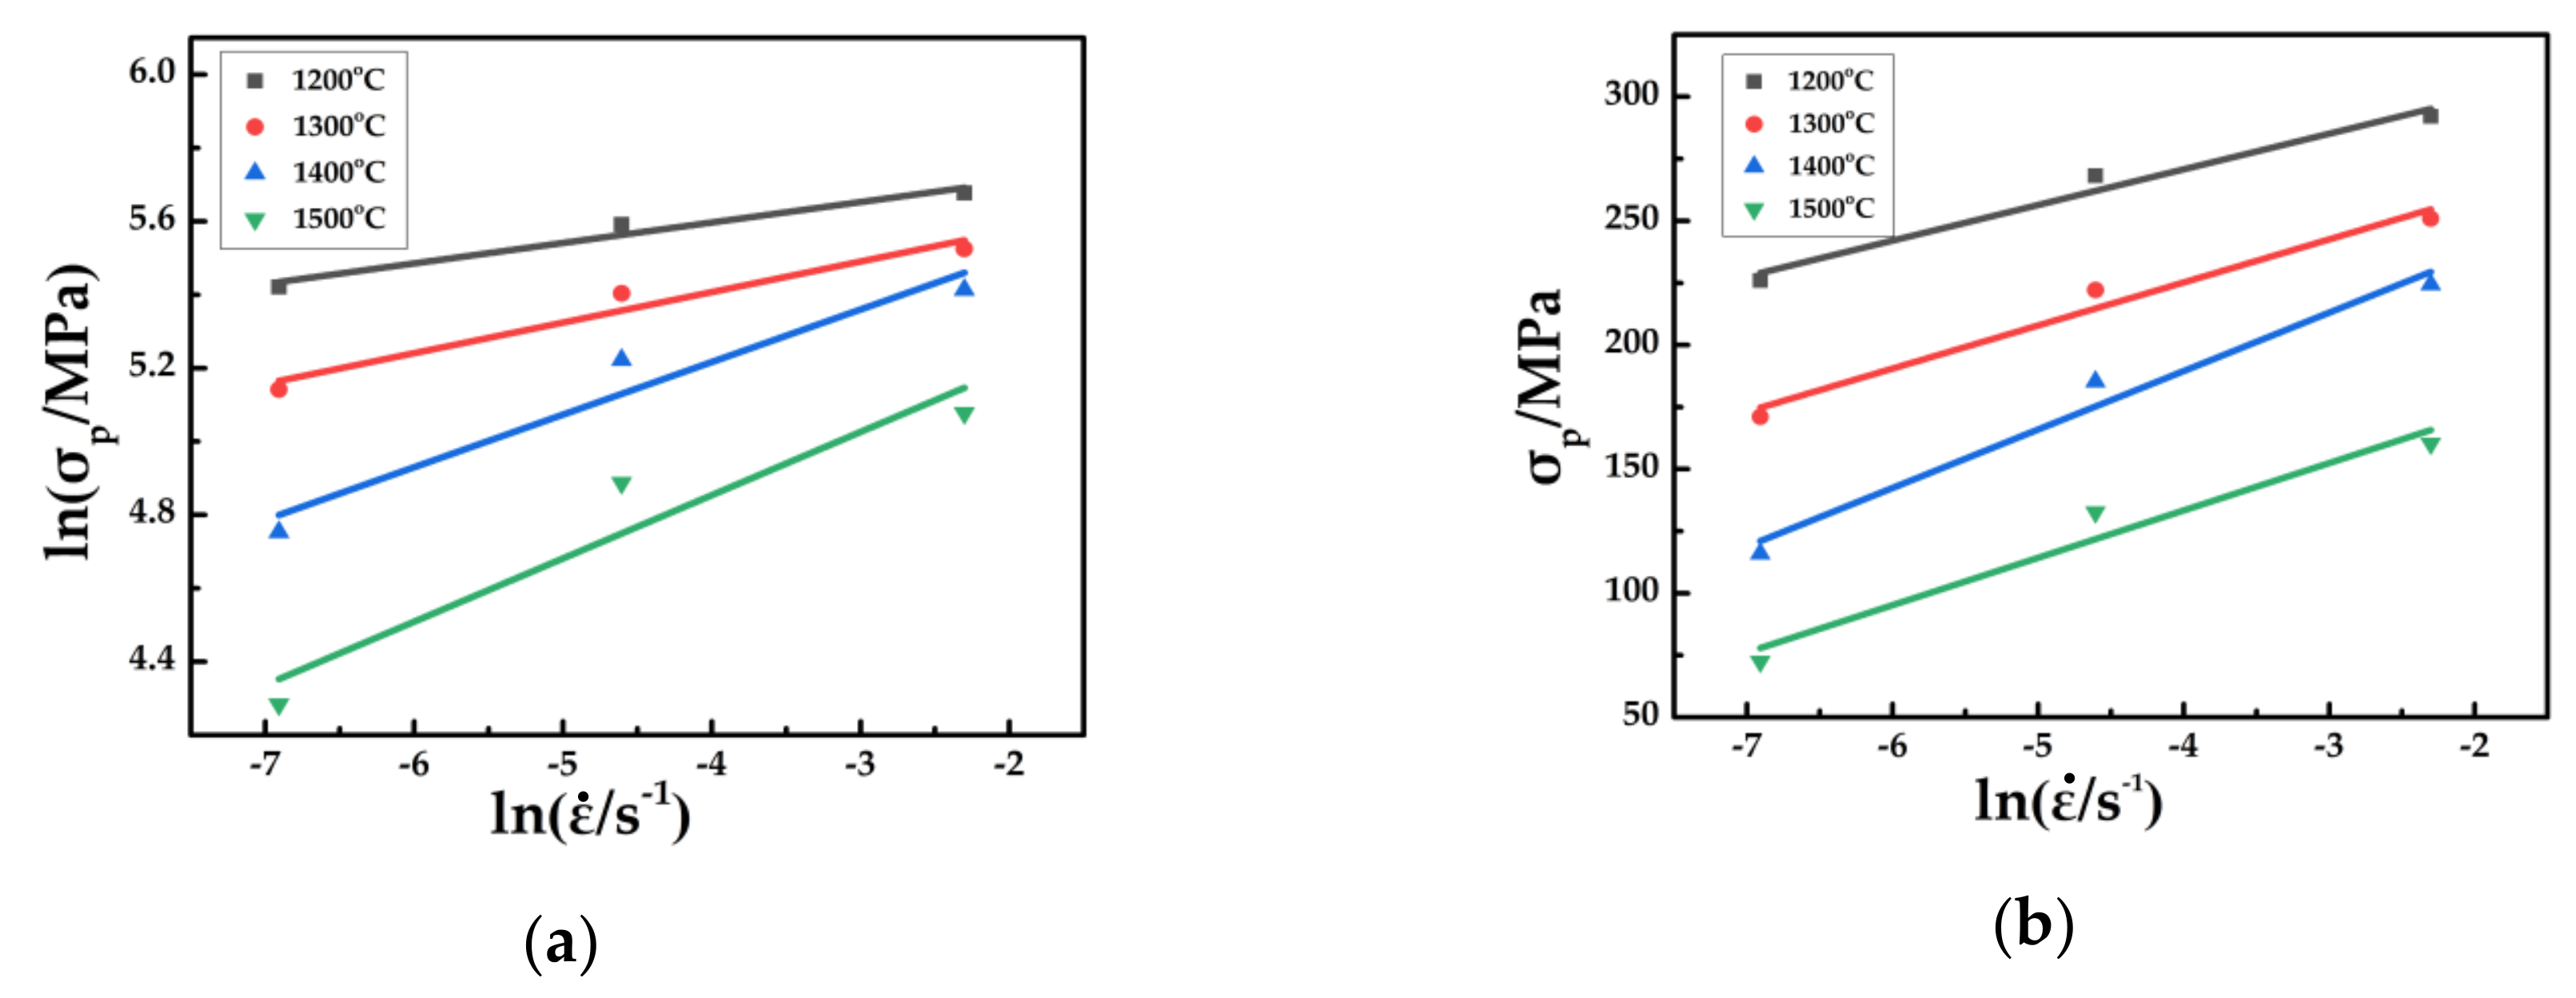
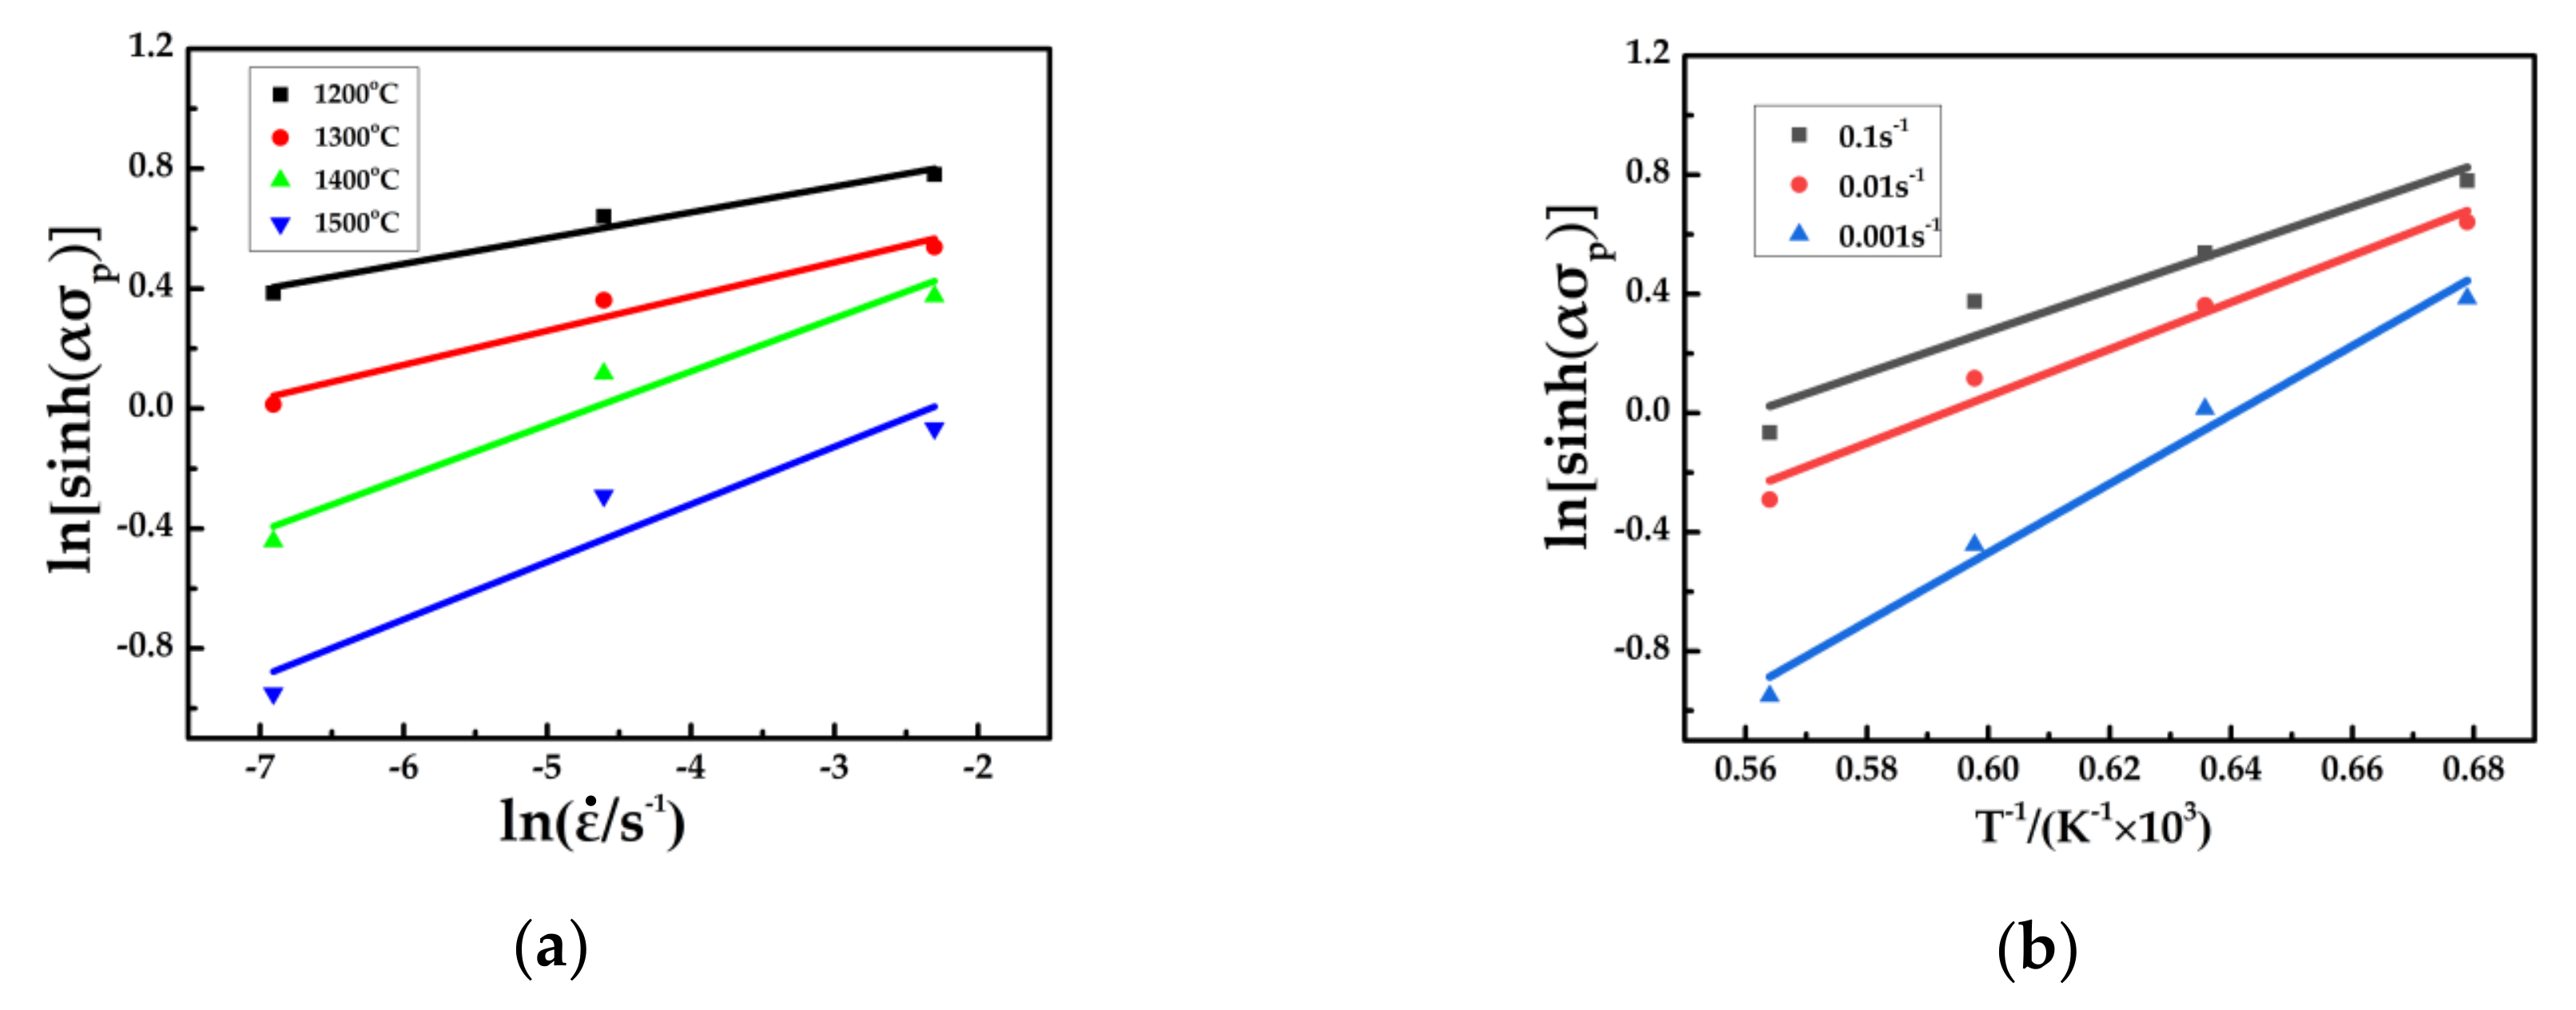
It was found that the stress peaks during different forming processes present a better linear relationship, as shown in Figure 5. Through linear fitting the lnσp-ln ε ˙ and σp-ln ε ˙ , the derivative and the slope value of each fitting curve, n1 and β were counted as 10.69 and 0.056, respectively. Then, we calculated the value of α, which is α = β/n1 = 0.0052 MPa−1. Therefore, the relationship of ln[sin(ασp)−ln ε ˙ ] and ln[sinh(ασp)]−1/T are gained like Figure 6. The Qact value is mainly acquired from R, { ln ε ˙ / ln [ sin h ( α σ ) ] } r = c o n s t and { ln [ sinh ( α σ ) ] / ( 1 / T ) } ε ˙ = c o n s t . The active energy of Qact for pure iridium is 573 KJ/mol. Atanu et al. [19] calculated that the deformation activation energy of pure molybdenum is 480 KJ/mol. Liu et al. [20] calculated that the activation energy of Haynes230 nickel base super-alloy, the main material for combustor components of gas turbine engines, is 405 KJ/mol. In comparison, it shows that the processing of pure iridium is more difficult.
Zener and Holomon [21] established Z-parameter to comprehensively elaborate the relationship between forming conditions and flow stress.
Z = ε ˙ exp [ Q a c t RT ] = A [ sinh ( α σ ) ] n ,
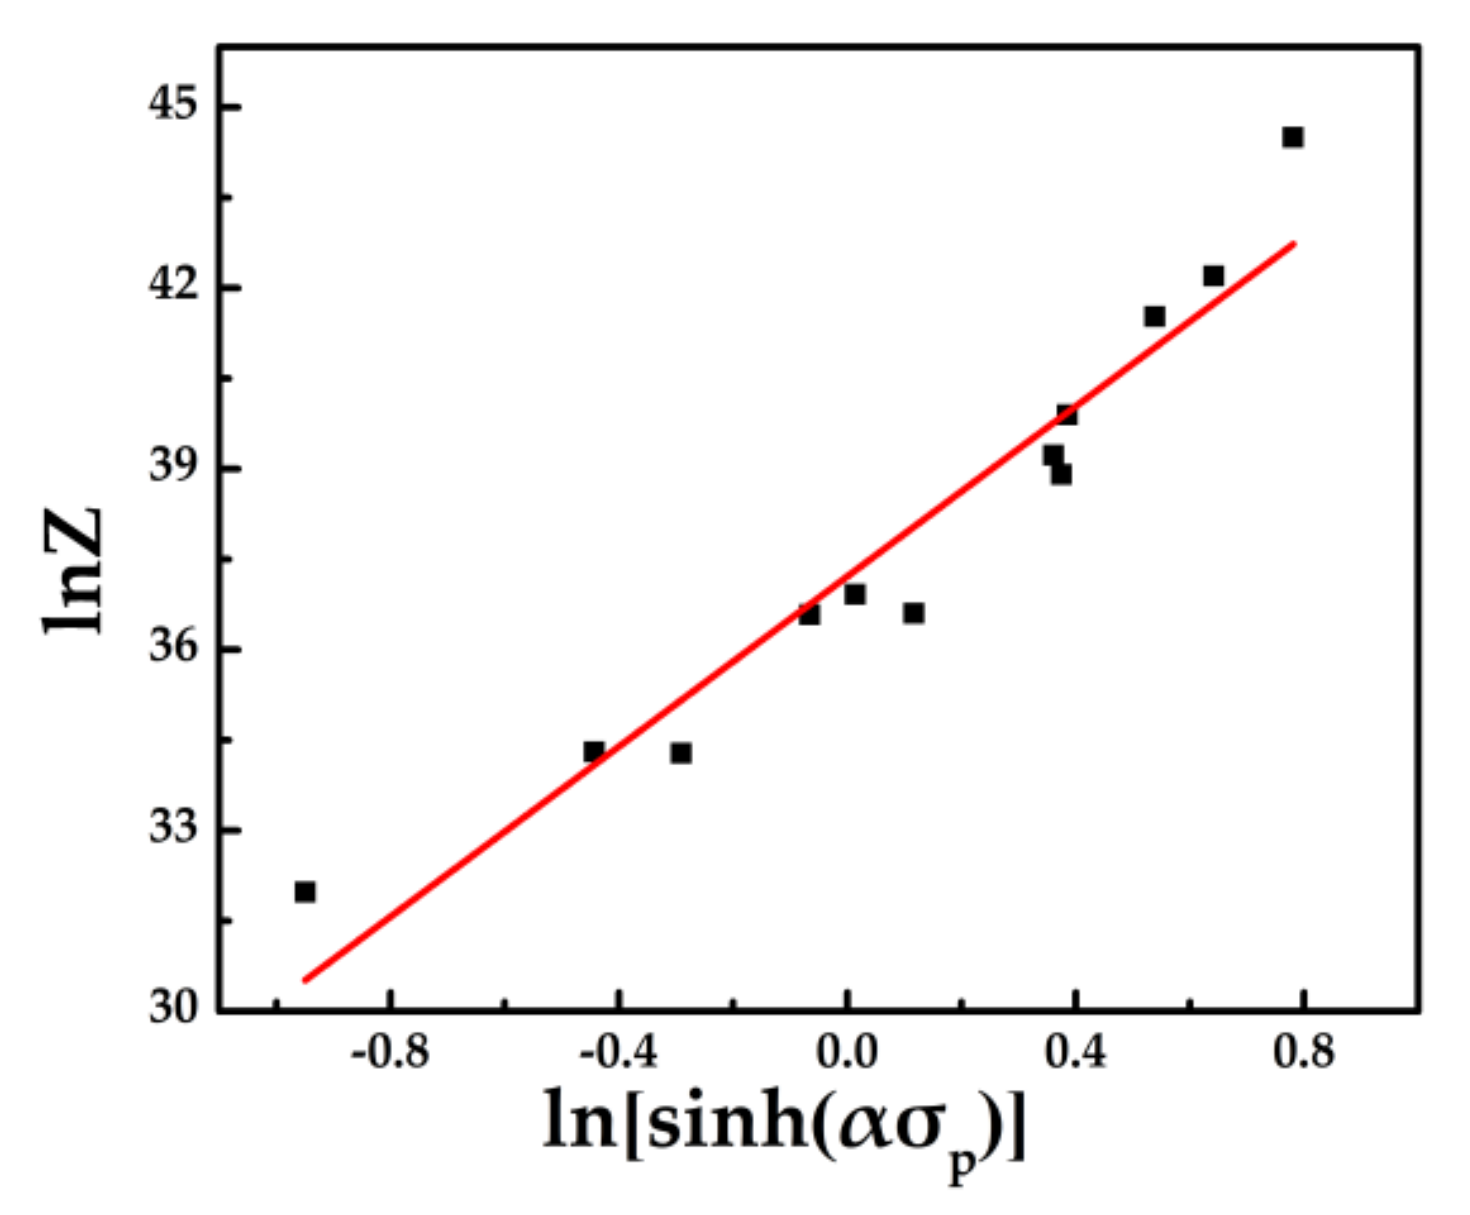
Substituting the values of deforming temperatures, strain rates and corresponding activation energy into Equation (9), the values of Z under various conditions can be acquired. The expression of lnZ-ln[sinh(ασp)] was received after taking logarithm of Equation (9). According to Figure 7, the constants were estimated as A = 1.46 × 10¹⁶ s−1 and n = 7.06. The constitutive equation of pure iridium based on peak stress is given in Equation (10).
ε ˙ = 1 . 46 × 10 16 [ sinh ( 0 . 0052 σ ) ] 7 . 06 exp [ - 5 . 73 × 10 5 RT ]

3.3. Constitutive Equations with Compensation for Strain

Impact of strain on flow stress can never be negated. Appropriately, the quantitative correlations between material constants and strains under experimental conditions can be built by introducing strain into hyperbolic sinusoidal model, and eventually, the strain-dependent constitutive equation of pure iridium was established [22,23].
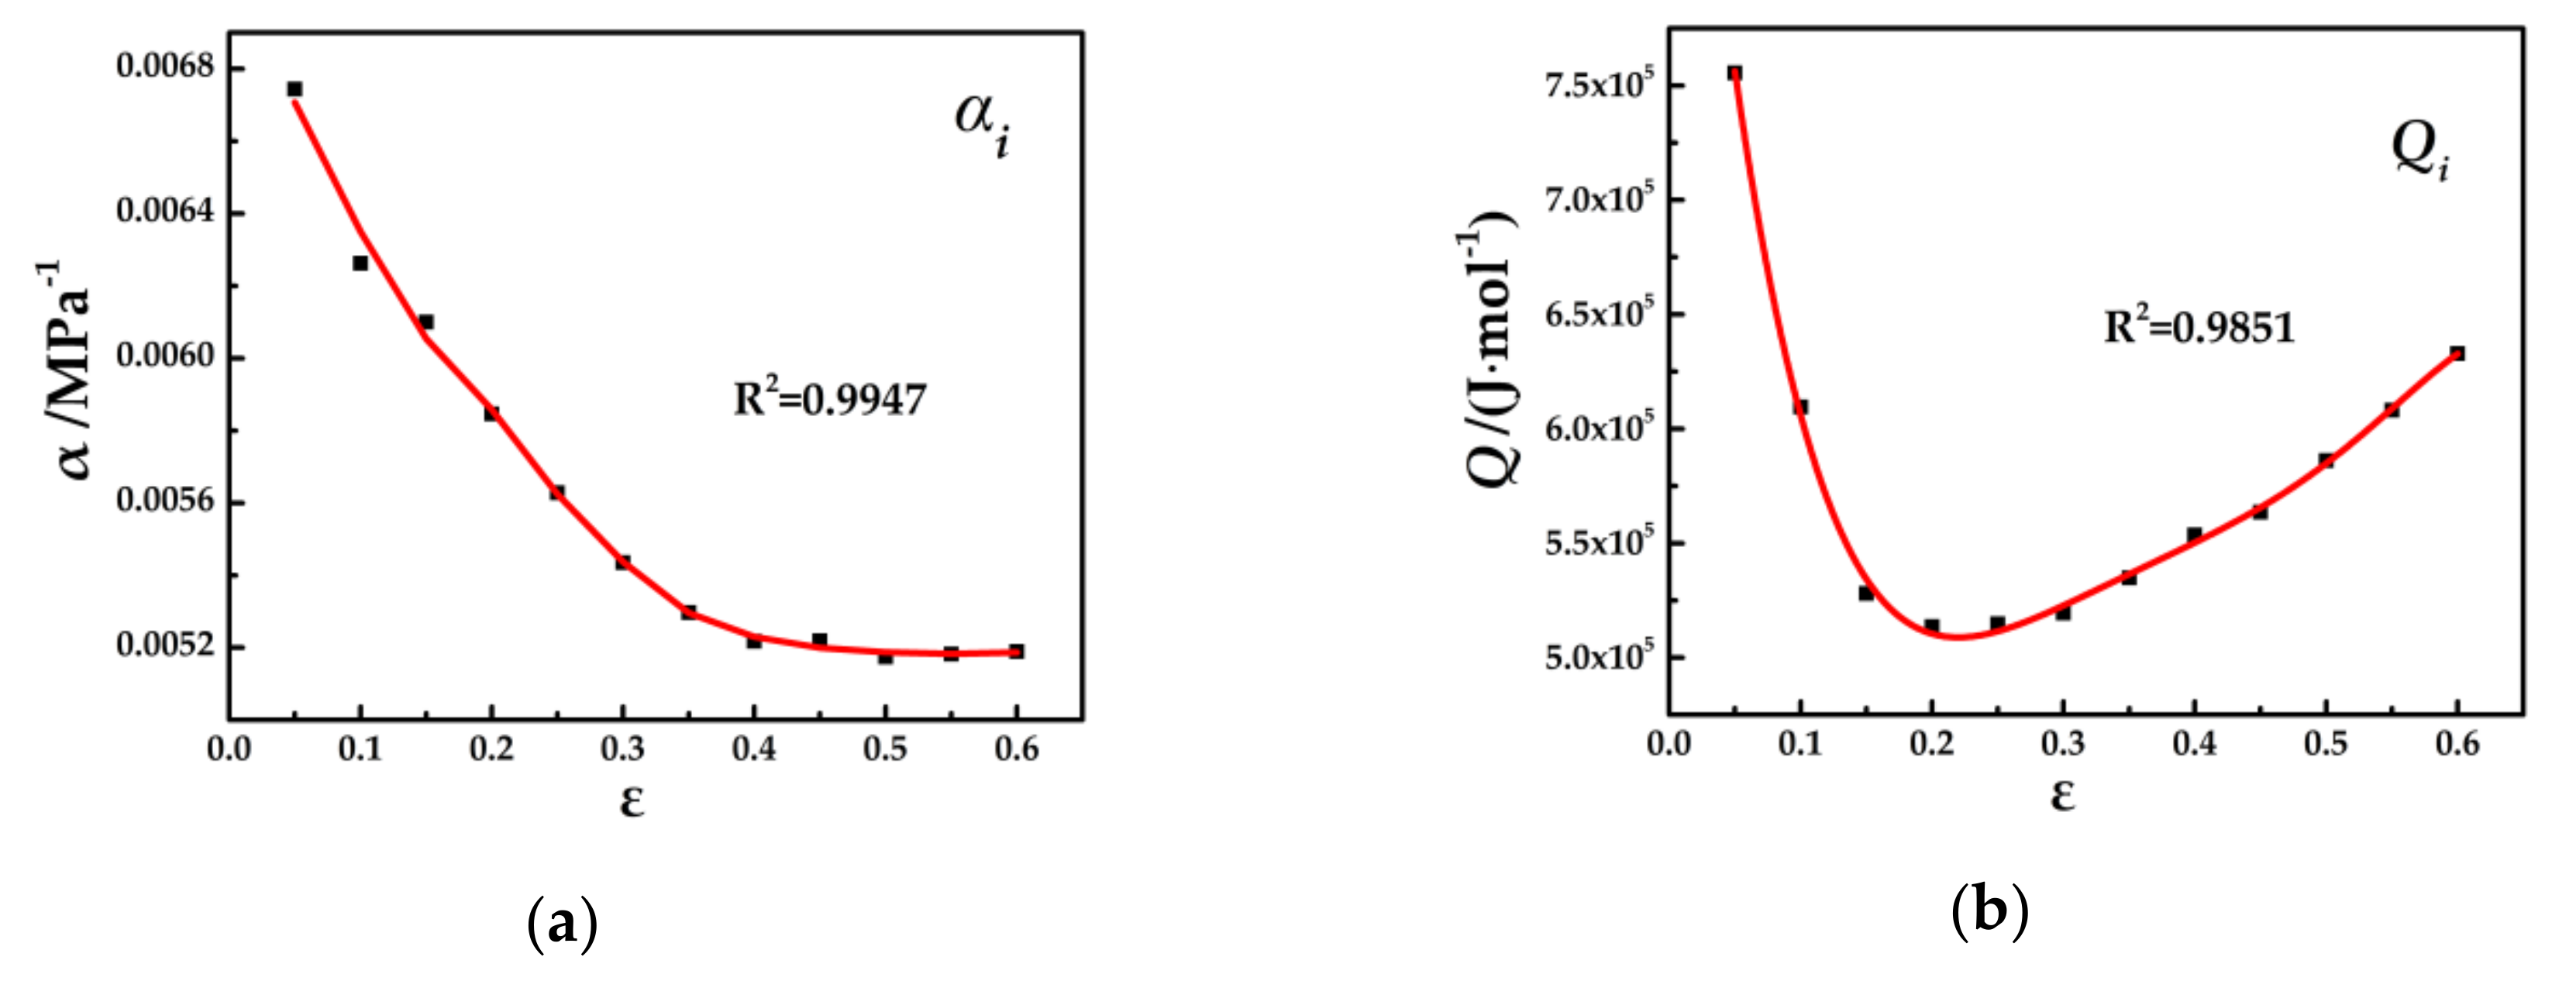
The values of material constants of α, Q, n, lnA at various strains of 0.05~0.6 at 0.5 intervals are gained by repeating the computation as mentioned in the previous post. Polynomial fits by material constants facilitated to improve the predictive constitutive equation. Therefore, these calculated data of material constants were modeled into six-order poly-nominal functions. The polynomials of α, n, lnA and Q can be described by Equation (11), and fitting results are shown in Figure 8 and Table 3. There are significant correlations between the calculated data and fitted curves, it is more than 0.97.
α ( ε ) = α 0 + α 1 ε + α 2 ε 2 + α 3 ε 3 + α 4 ε 4 + α 5 ε 5 + α 6 ε 6 , n ( ε ) = n 0 + n 1 ε + n 2 ε 2 + n 3 ε 3 + n 4 ε 4 + n 5 ε 5 + n 6 ε 6 , Q ( ε ) = Q 0 + Q 1 ε + Q 2 ε 2 + Q 3 ε 3 + Q 4 ε 4 + Q 5 ε 5 + Q 6 ε 6 , ln A ( ε ) = ln A 0 + ln A 1 ε + ln A 2 ε 2 + ln A 3 ε 3 + ln A 4 ε 4 + ln A 5 ε 5 + ln A 6 ε 6 ,
where ε is true strain, αi, ni, Qi and Ai (i = 0, 1, 2,…, 6) are polynomials coefficients. At present, the constitutive equation introduced into strain of pure iridium is shown in Equation (11).
Z = ε ˙ exp [ Q ( ε ) RT ] , σ = 1 α ( ε ) ln { [ Z A ( ε ) ] 1 / n ( ε ) + < [ Z A ( ε ) ] 1 / n ( ε ) + 1 > 1 / 2 } . .
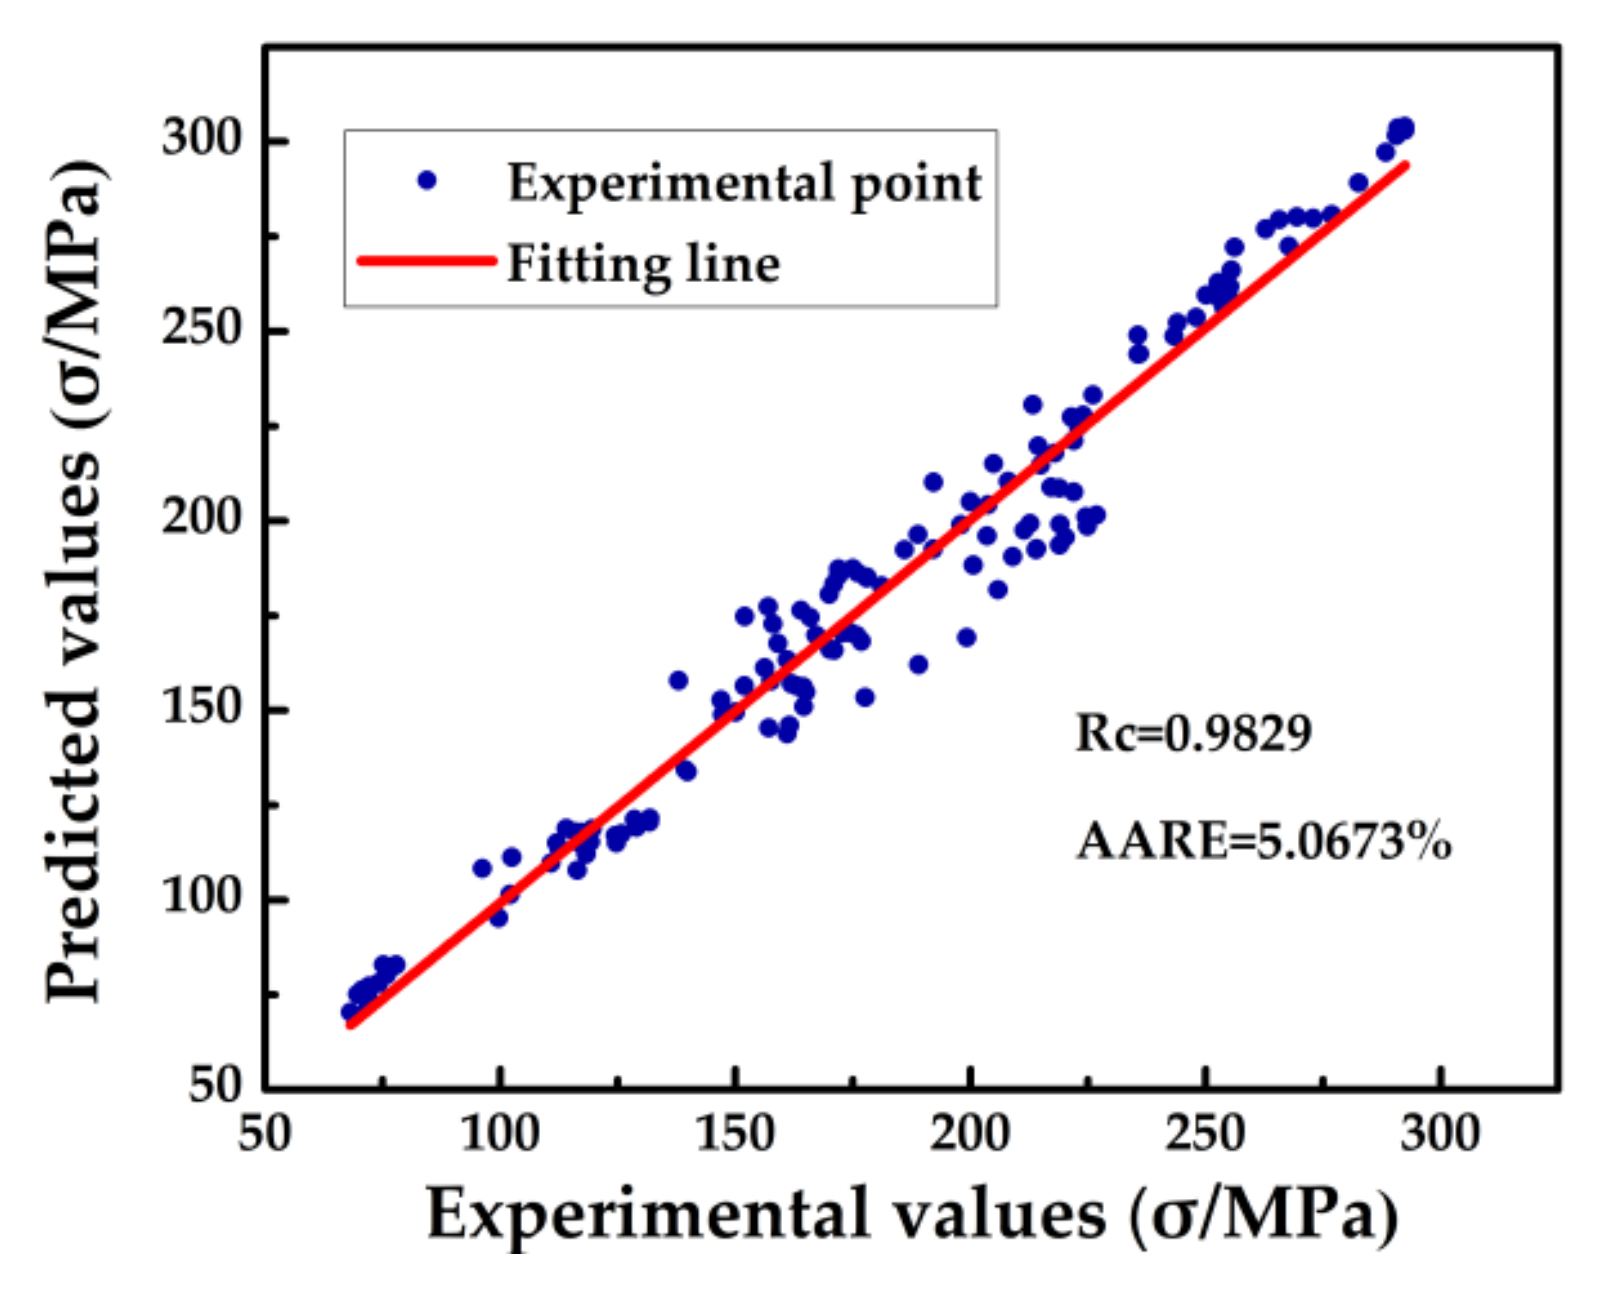
By introducing the values of polynomials like α, Q, n, lnA into the Equation (12), the flow stresses of pure iridium at various forming conditions can be divined. Figure 9 gives a comparison between predictive flow stresses at experimental forming conditions (1200 °C~1500 °C and 10−1 s−1~10−3 s−1) and actually measured values of flow stress under the same experimental conditions. Proposed constitutive model for iridium is very precise with the exception of certain points where the results are slightly diverged from the actual data. Lubricating conditions of specimens, precision of the equipment, heat-treatment state of material and inhomogeneous longitudinal deformation of specimen are all responsible for the divergence of predictive constitutive model from actually measured flow stress. Linear Correlation coefficient (Rc) and Average Absolute Relative Error (AARE) are quantitatively computed by statistical formula given in Equation (13) to analyze the precision of the given predictability of constitutive model [24]. The value of Rc is close to 1, representing the higher precision of predictive model. The value of AARE is also very small, which shows that the constitutive model is more accurate in predicting the flow behavior of pure iridium. Figure 10 shows the relevance between the experimented and predicted values under various forming conditions of pure iridium. The high value of Rc, 0.98292, shows that the measured values during experimentation and the predicted values of flow stress are very close to each other. The small value of AARE, 5.067%, suggests that the predictive constitutive model is very accurate.
R c = i = 1 N ( σ E i - σ ¯ E ) ( σ P i - σ ¯ P ) i = 1 N ( σ E i - σ ¯ E ) 2 i = 1 N ( σ P i - σ ¯ P ) 2 , AARE = 1 N i = 1 N σ E i - σ P i σ E i × 100 % .

3.4. Establishment and Analysis of Processing Map

3.4.1. The Theory of Processing Map

The processing map of Dynamic Material Models (DMM) was first discovered by Montheillet et al. [25] and further refined by Murty and Rao [26]. The map is considered as power dissipation map describing microstructure evolution and flow instability map distinguishing the damaged region during deformation.
Its theory is based on microstructural changes, the energy, P (per unit power), dissipated into the system, comprising two components, i.e., energy consumed during plastic deformation and energy consumed during microstructural changes and the expression for power dissipated is given by Equation (14).
P = σ ε ˙ = G + J = 0 ε ˙ σ d ε ˙ + 0 σ ε ˙ d σ ,
where G is the dissipated energy due to ductile deformation, and J presents the dissipated energy consumed during microstructural changes at various deformation conditions. The distribution proportion between J and G is expressed by strain rate sensitivity parameter m:
m = J G = ε ˙ σ σ ε ˙ = ( ln σ ) ( ln ε ˙ ) ,
When m = 1, the value J reaches its maximum, Jmax = (σ ε ˙ )/2. The efficiency of power dissipation (η) is defined by Equation (16).
η = J J m a x = 2 m m + 1 ,
Prasad et al. [27] put forward a failure criterion according to DMM and the maximization theories of nonreversible thermodynamic as used in large plastic flow for predicting the onset of flow instability.
ξ ( ε ˙ ) = ln [ m / ( m + 1 ) ] ln ε ˙ + m < 0 ,

3.4.2. Analysis of Processing Map

The ability to resist uneven deformation of metallic materials is measured by strain rate sensitivity factor (m) [28]. Essentially, the differences of friction, initial organizational inhomogeneity and crystal orientation cause an inhomogeneous microstructure. When the value of m is large, uneven deformation in an area would be transferred to prevent the microscopic necking and improve the uniform deformation [28]. Figure 11 describes the strain rate sensitivity maps of pure iridium at strain of 0.3 and 0.6. The distributions of strain rate sensitivity parameter (m) in 2D space are similar under different strains: the maximum value of m is at the forming region of elevated temperature-lower strain rate (T = 1500 °C, ε ˙ = 10−3 s−1). Meanwhile, with the decrease of forming temperature and increases of strain rate, the value of m reduces gradually, which shows that pure iridium has a strong ability to resist uneven deformation at elevated temperature.
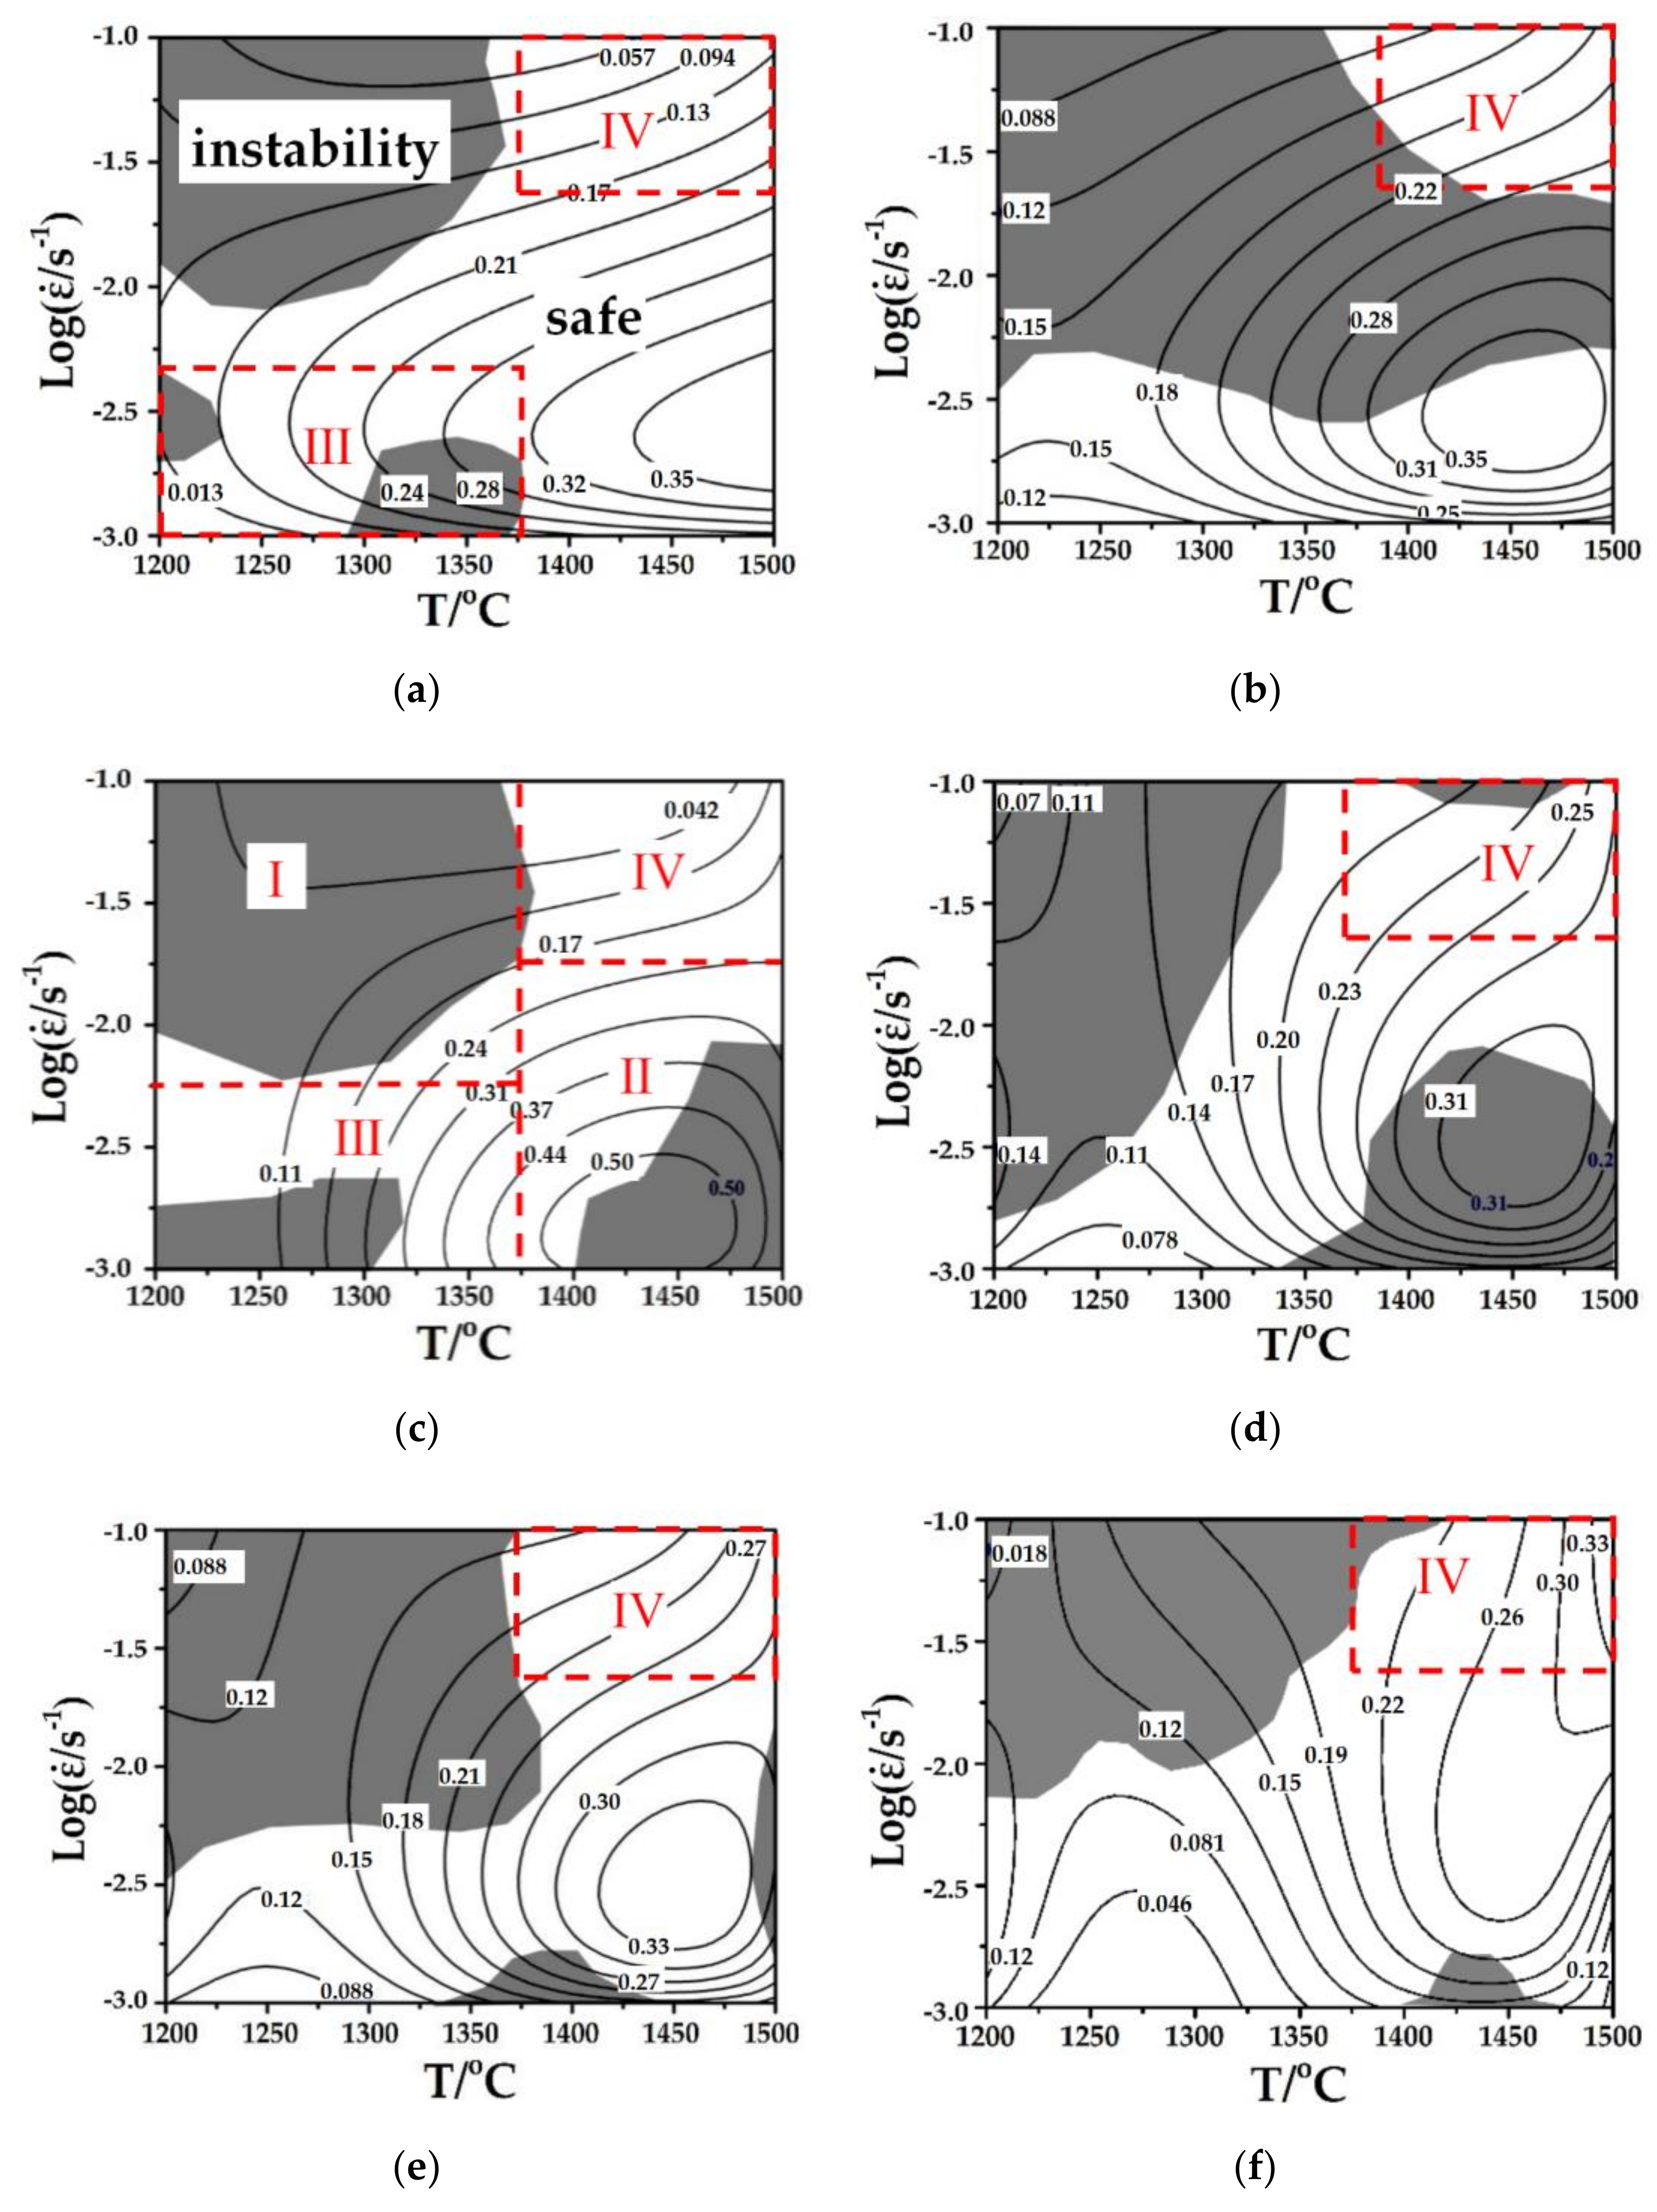
Figure 12 shows the processing maps of pure iridium at true strains of 0.1~0.6. The equivalence lines denote the efficiency of power dissipation (η) and the shadings are the instability areas. From the processing maps, the values of η for pure iridium are linked with the forming conditions. The efficiency (η) progressively raises with increasing forming temperature and reducing strain rate. The peak value of efficiency (η) is in the deformation conditions of 1400 °C~1500 °C and 10−2 s−1~10−3 s−1. When the strain level is reached to 0.6, the peak region of efficiency (η) produces changes, as shown in areas within the red markings of Figure 12f. In general, the higher efficiency (η) under different deformation conditions demonstrates that the microstructure presents homogeneous and finer equiaxed grains, which shows the good process-ability under this condition of pure iridium [24].
At the strain of 0.3, as shown in Figure 12c, the maximum value of η is 50%, that corresponds to the peak value during the whole forming process. The efficiency (η) increases from 35% to 50% by increasing the strain from 0.1 to 0.3 firstly, and then slowly drops to 33%. The maximum value of efficiency (η) is found at 1400 °C~1500 °C. An increase of the efficiency (η) illustrates that the mechanisms of dynamic recovery and dynamic recrystallization are intensifying with the increase of strain.
The instability areas of the processing maps for pure iridium are prone to generating micro-cracks in the material during deformation [29]. Figure 12 shows that the instability area follows the trend of changes in strain rate, i.e., as the strain changes, regions of instability also shift accordingly. As a whole, the instability region is large in proportion to the rest, which is an indication of high level of difficulty in forming of pure iridium. In the strain range of 0.1 to 0.2, the unstable regions are primarily due to higher strain rate. At this stage, work hardening comes into operative which results in an increase in flow stress. From Figure 12c,d, there are two major unstable domains in the maps: lower temperature-high strain rate domain Ⅰ and elevated temperature-smaller strain rate domain Ⅱ. When the strain is 0.6, as Figure 12f shows, the unstable regions are primarily located in low temperature-elevated strain rate. Furthermore, in the region corresponding to low temperature-smaller strain rate, various degrees of instability arise, as shown in domain Ⅲ of Figure 12a,c. The deformation regions of high temperature-elevated strain rate (domain Ⅳ) all have the good formability, which can be seen from the Figure 12a–f. Therefore, the suitable processing window in theory of pure iridium within the experiment scope is 1400 °C~1500 °C and 0.1 s−1~0.05 s−1, which can be obtained by superimposing the processing maps at the strain of 0.1~0.6.

3.5. Microstructure Evolution of Pure Iridium

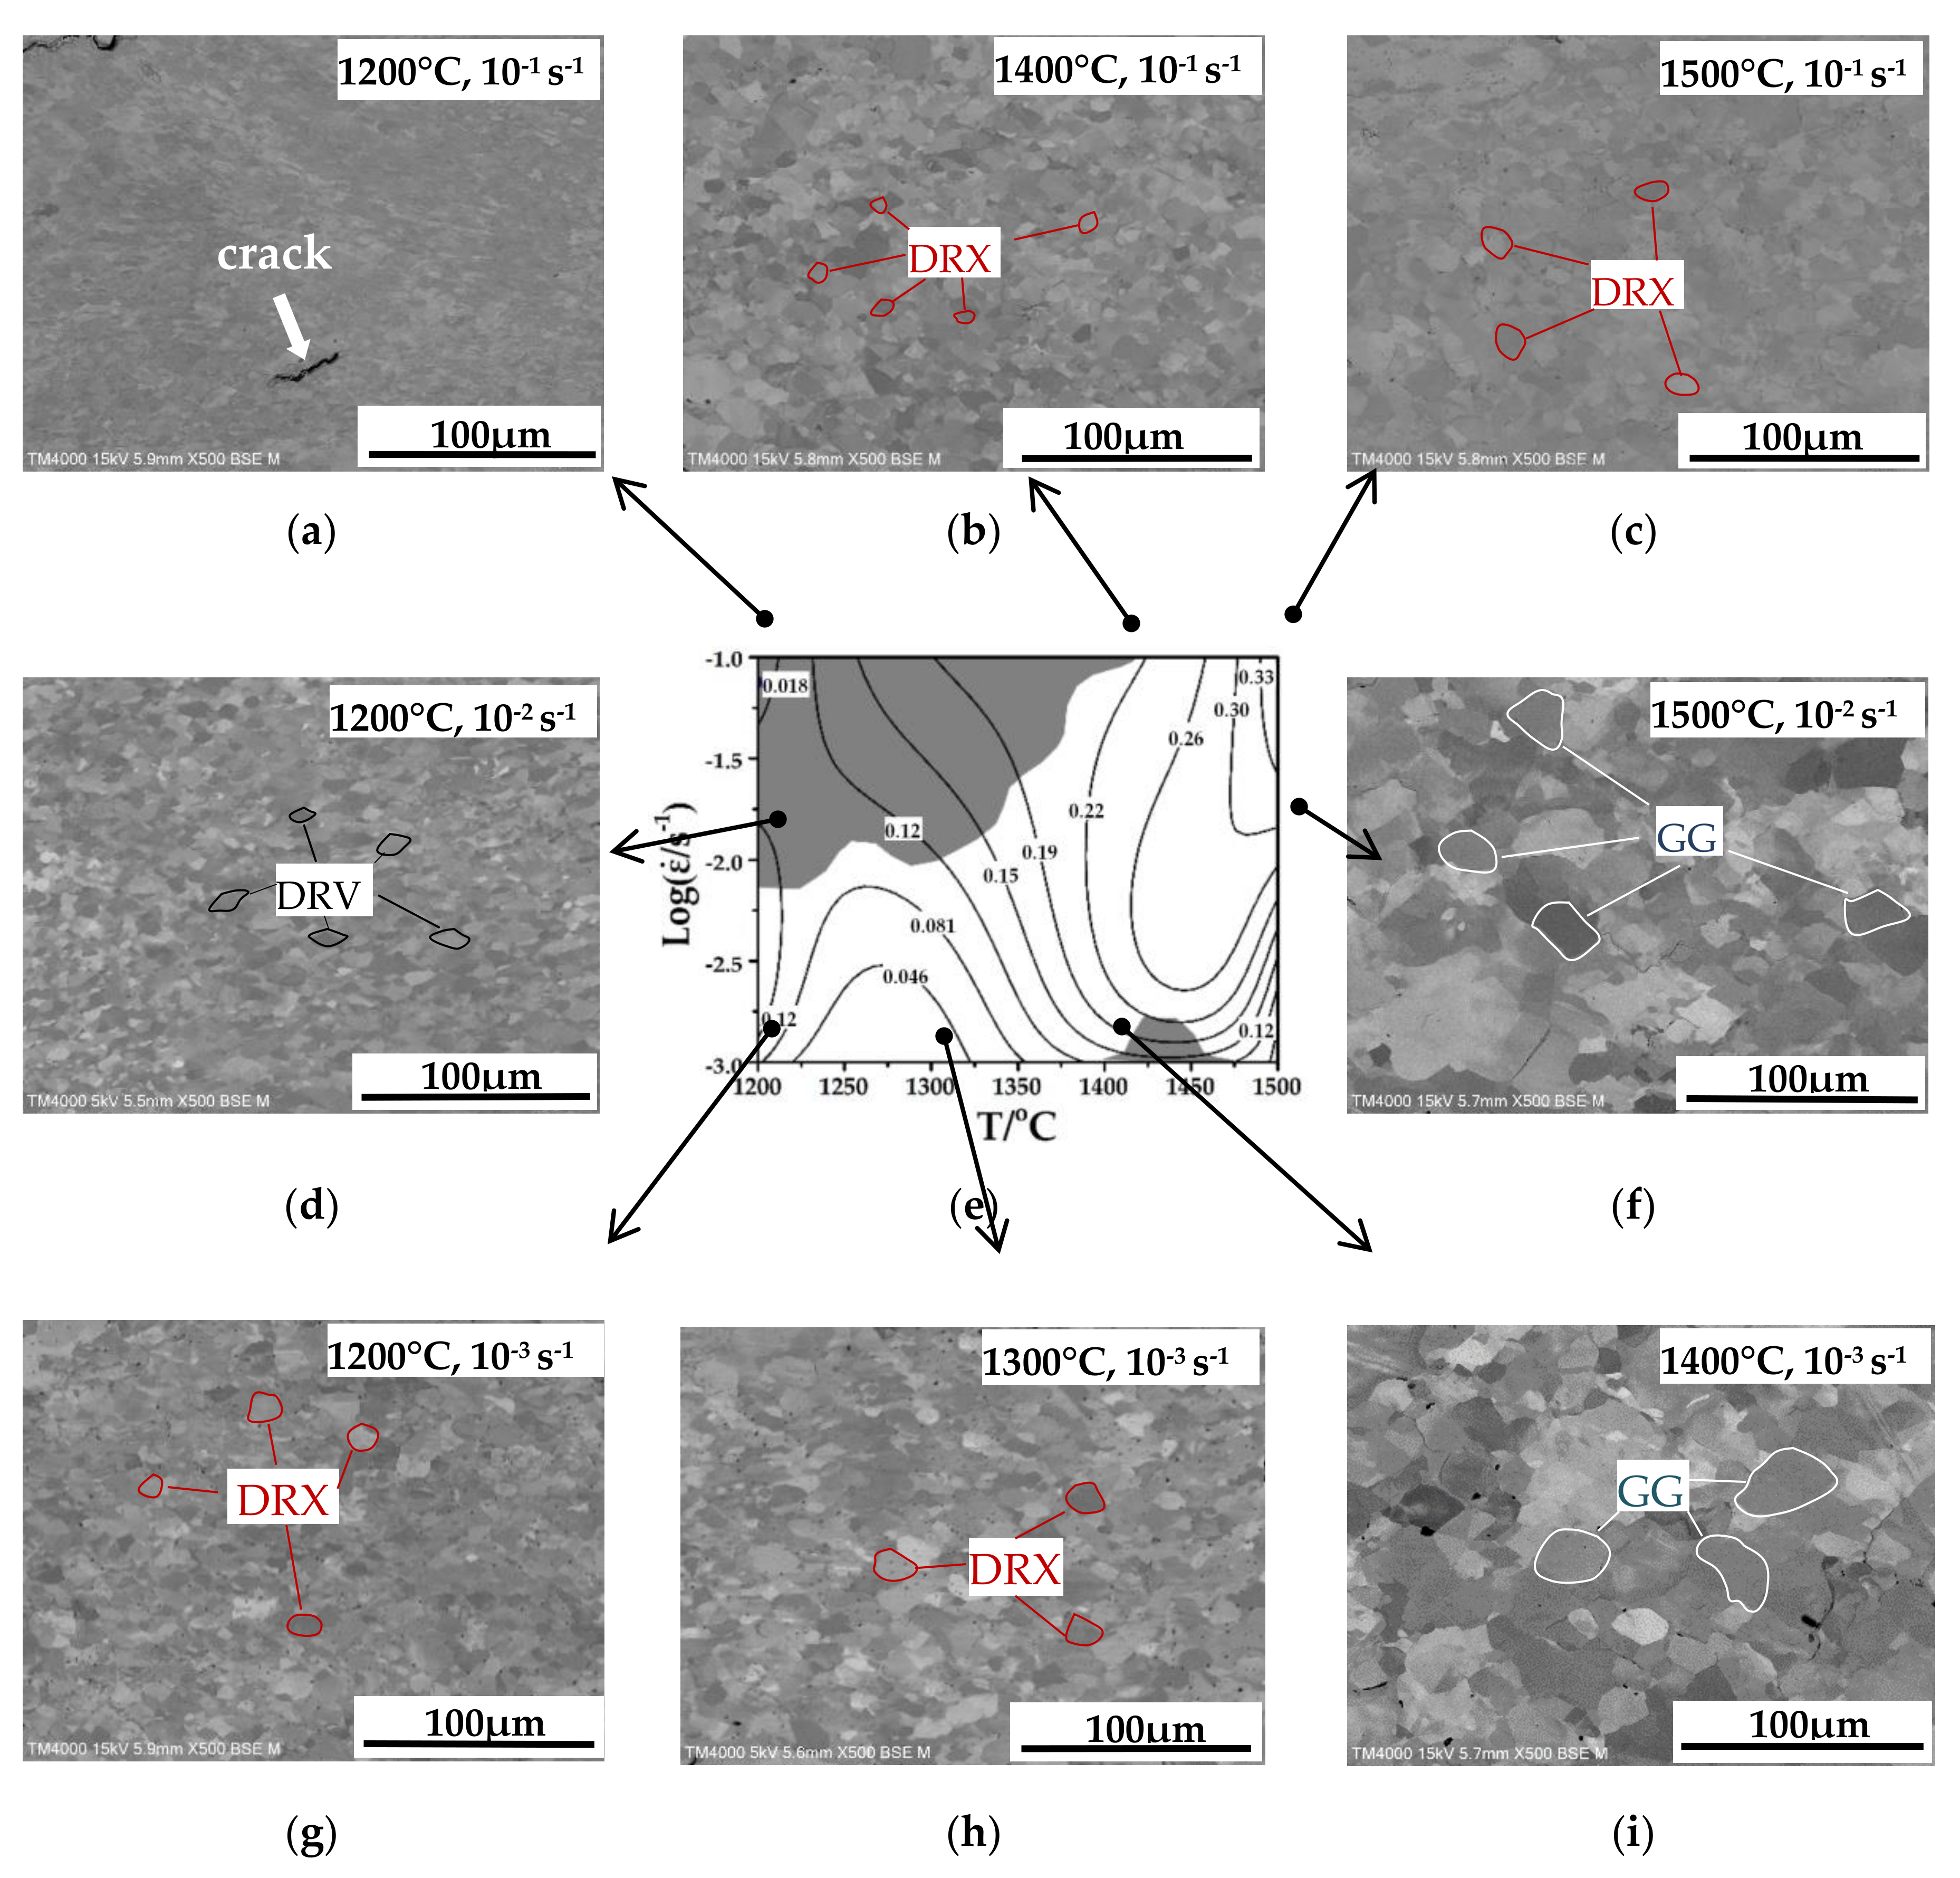
Figure 13 represents the comparison of processing map and the corresponding microstructure of pure iridium deformed at various forming parameters. The uniformity and size of deformed microstructures for pure iridium changes with the variation of forming parameters. Furthermore, dynamic recovery (DRV), dynamic recrystallization (DRX) and abnormal grain growth (AGG) are operative during the deformation of pure iridium under different deformation conditions.
Figure 13a show some cracks mainly caused by instability for pure iridium deformed on smaller temperature-elevated strain rate. In such deformation parameters, the dynamic recovery (DRV) is the major deformation mechanism [30], while cellular microstructure is a result of movement of dislocations. In addition, boundaries of the cellular structures are fairly obscure and instability, which has harmful influence on the mechanical behaviors of pure iridium [31], as show in Figure 13d.
The effect of forming temperature on microstructure during compression can be understood by comparing Figure 13a–c. The morphology and grain size changes greatly with the change in temperature. As previously described, Figure 13a, the deformation microstructure is a result of DRV in temperature range of 1200 °C–1300 °C. As the temperature expands to 1400 °C~1500 °C, the size of grains is uniform and equiaxed, and the grain boundaries become straight and clear, an evidence of DRX, as shown in Figure 13b,c. Under these deformation conditions, the efficiency of power dissipation (η) also reaches its maximum value, which also proves the existence of DRX.
From Figure 13f,i, it can be seen that grain size is getting larger at elevated forming temperature in 10−3 s−1. With forming temperature increasing, the microstructure of pure iridium transforms from DRV into DRX, and after that, DRX grains of pure iridium start coarsening. At elevated temperatures, atomic diffusion rate is increased which causes a decrease in nucleation energy thus promoting the DRX, same as proposed by Sakai et al. [32]. In addition, high temperature leads to abnormal grain growth after dynamic recrystallization. That shows that the hot deformation temperature has a distinct influence on microstructure for pure iridium.
The effect of strain rate on deformation microstructure of pure iridium can be received from Figure 13c,f. At the deformation temperature of 1500 °C, grain size increases rapidly and results in deterioration of the microstructural uniformity when strain rate decreases. The lower strain rate favors to increase the forming period and greatly promotes the grain growth of pure iridium. Meanwhile, the decline of strain rate introduces the process of DRV, which leads to lower nucleation rate in the process of the dynamic recrystallization [31].
In conclusion, the recrystallized microstructure is small and uniform in the temperature range of 1400 °C~1500 °C and strain rate range of 0.1 s−1~0.05 s−1, which is consistent with the result of the suitable processing window in Section 3.4.

4. Conclusions

With hot compression tests, the deformation characteristics of pure iridium have been studied on a Gleeble-1500D hot simulator, in the temperature range of 1200 °C~1500 °C and strain rate range of 10−1 s−1~10−2 s−1. The experimental flow stress curve has been corrected by friction correction. Meanwhile, the properties of stress–strain curves for pure iridium have been analyzed in detail and its hot workability has been studied through Dynamic Material Models. On the basis of the current experimental results, the following is concluded:
  • The compressive stress is greatly influenced by deformation temperature and strain rate during hot compression. The compression yield strength of pure iridium is sharply decreased from 208.6 MPa (1200 °C, 10−1 s−1) to 72.1 MPa (1500 °C, 103 s−1) with the temperature increasing and strain rate reducing during hot compression.
  • The deformation mechanisms of pure iridium are dependent upon temperature as well as strain rate and it varies from the dynamic recovery at temperature range of 1200 °C~1300 °C and 10−1 s−1~10−2 s−1 to the dynamic recrystallization as the temperature increases and strain rate reduces, then to the abnormal grain grown at elevated temperature-low strain rate (1400 °C~1500 °C and 10−2 s−1~10−3 s−1).
  • In view of the hyperbolic sine constitutive equation and multinomial fitting model, the relations between forming temperature, strain rate, strain and flow stress have been established to predict the deformation behavior of pure iridium. The average absolute relative error of equation, as little as 5.067%, suggests a high accuracy in predicting flow stresses. A very high value of activation energy for iridium, 573 KJ/mol, clearly indicates that it is very hard to deform this material.
  • The processing maps under various strains of pure iridium were established to identify ideal conditions for processing. The suitable processing window for hot forming of pure iridium is 1400 °C~1500 °C and 0.1 s−1~0.05 s−1, obtained through processing maps and microstructure analysis.

Author Contributions

Conceptualization, R.H.; data curation, M.Z.; formal analysis, M.Z.; investigation, J.Y.; methodology, M.W.; project administration, J.Y. and M.W.; resources, C.W.; supervision, R.H.; validation, C.W.; writing—original draft, M.Z.; writing—review and editing, R.H. All authors have read and agreed to the published version of the manuscript.

Funding

This research was funded by the National Key R & D Program of China: 2017YFB0305500.

Acknowledgments

The authors acknowledge the administrative and technical support of Northwestern Polytechnical University (NPU) and Kunming Institute of Precious Metals. And authors especially appreciate the teacher XiMing Luo in Kunming Institute of Precious Metals for providing materials and XuDong Zhou in Henan University of Science & Technology for experimental equipment.

Conflicts of Interest

The authors declare no conflict of interest.

References

  1. Weiland, R.; Lupton, D.F.; Fischer, B.; Merker, J.; Scheckenbach, C. High-temperature mechanical properties of the platinum group metals. Platin. Met. Rev. 2006, 50, 158–170. [Google Scholar] [CrossRef]
  2. Yang, J.R.; Wang, H.; Wang, B.Q.; Hu, R.; Liu, Y.; Luo, X.M. Numerical and experimental study of electron beam floating zone melting of iridium single crystal. J. Mater. Process. Technol. 2017, 250, 239–246. [Google Scholar] [CrossRef]
  3. Liu, C.T.; Inouye, H.; Schaffhauser, A.C. Effect of Thorium Additions on Metallurgical and Mechanical Properties of Ir-0.3pct W Alloys. Metall. Trans. A 1981, 12, 993–1002. [Google Scholar] [CrossRef]
  4. Loginova, Y.N.; Gladkovskiib, S.V.; Potapovb, A.I.; Fomina, A.A.; Salikhyanova, D.R. Investigation into the deformation resistance of polycrystalline iridium. Phys. Metall. Hard Treat. 2015, 56, 532–539. [Google Scholar]
  5. Cawkwell, M.J. Origin of brittle cleavage in iridium. Science 2005, 309, 1059–1062. [Google Scholar] [CrossRef]
  6. Panfilov, P.; Novgorodov, V.; Yermakov, A. Fracture behaviour of polycrystalline iridium under tension in the temperature range 20–1500 °C. J. Mater. Sci. Lett. 1994, 13, 137–141. [Google Scholar] [CrossRef]
  7. Merker, J.; Koch, M. Metals for high temperature applications under extreme conditions development and testing. Mater. Sci. Forum 2014, 783, 1165–1170. [Google Scholar]
  8. Prasad, Y.V.R.K.; Ravichandran, N. Effect of stacking fault energy on the dynamic recrystallization during hot working of FCC metals: A study using processing maps. Bull. Mater. Sci. 1991, 14, 1241–1248. [Google Scholar] [CrossRef] [Green Version]
  9. Ding, X.F.; Zhao, F.Q.; Shuang, Y.H.; Ma, L.F.; Chu, Z.B.; Zhao, C.J. Characterization of hot deformation behavior of as-extruded AZ31 alloy through kinetic analysis and processing maps. J. Mater. Process. Technol. 2020, 276, 116325. [Google Scholar] [CrossRef]
  10. Wang, B.Q.; Li, S.M.; Wang, Y.M.; Zhong, H.; Hu, R.; Liu, Y.; Luo, X.M. Single-crystal growth of iridium with [100] and [110] orientations by electron beam zone melting. Vacuum 2018, 154, 141–147. [Google Scholar] [CrossRef]
  11. Venugopal, S.; Srinivasan, G.; Venkadesan, S.; Seetharaman, V. A note on the determination of the friction factor by means of the reduction-capacity test. J. Mech. Work. Technol. 1989, 19, 261–266. [Google Scholar] [CrossRef]
  12. Shen, G.; Vedhanayagam, A.; Kropp, E.; Altan, T. A method for evaluating friction using a backward extrusion-type forging. J. Mater. Process. Technol. 1992, 33, 109–123. [Google Scholar] [CrossRef]
  13. Roebuck, B.; Lord, J.D.; Brooks, M.; Loveday, C.M.; Sellars, C.M.; Evans, R.W. Measurement of flow stress in hot axisymmetric compression tests. Mater. High Temp. 2006, 23, 59–83. [Google Scholar] [CrossRef]
  14. Mcqueen, H.J. Development of dynamic recrystallization theory. Mater. Sci. Eng. A 2004, 387, 203–208. [Google Scholar] [CrossRef]
  15. Sellars, C.; Whiteman, J. Recrystallization and grain growth in hot rolling. Met. Sci. 1979, 13, 187–194. [Google Scholar] [CrossRef]
  16. Chen, Z.Y.; Tong, R.; Dong, Z.C. Plastic flow characteristics of an extruded Mg-Li-Zn-RE alloy. Rare Met. Mater. Eng. 2013, 42, 1779–1784. [Google Scholar]
  17. Xu, T.C.; Peng, X.D.; Qin, J.; Chen, Y.F.; Yang, Y.; Wei, G.B. Dynamic recrystallization behavior of Mg-Li-Al-Nd duplex alloy during hot compression. J. Alloys Compd. 2015, 639, 79–88. [Google Scholar] [CrossRef]
  18. Liu, J.W.; Zhao, Z.G.; Lu, S.Q. Microstructure evolution and constitutive equation for the hot deformation of LZ91 Mg alloy. Catal. Today 2018, 318, 119–125. [Google Scholar]
  19. Chaudhuri, A.; Sarkar, A.; Suwas, S. Investigation of stress-strain response, microstructure and texture of hot deformed pure molybdenum. Int. J. Refract. Met. Hard Mater. 2018, 73, 168–182. [Google Scholar] [CrossRef]
  20. Liu, Y.; Hu, R.; Li, J.S.; Kou, H.C.; Li, H.W.; Chang, H.; Fu, H.Z. Deformation characteristics of as-received Haynes230 nickel base superalloy. Mater. Sci. Eng. A 2008, 497, 283–289. [Google Scholar] [CrossRef]
  21. Zener, C.; Hollomon, J.H. Effect of strain rate upon the plastic flow of steel. J. Appl. Phys. 1944, 15, 22–32. [Google Scholar] [CrossRef]
  22. Sui, F.L.; Xu, L.X.; Chen, L.Q.; Liu, X.H. Processing map for hot working of Inconel 718 alloy. J. Mater. Process. Technol. 2011, 211, 433–440. [Google Scholar] [CrossRef]
  23. Meng, Q.G.; Bai, C.G.; Xu, D.S. Flow behavior and processing map for hot deformation of ATI425 titanium alloy. J. Mater. Process. Technol. 2018, 34, 105–114. [Google Scholar] [CrossRef]
  24. Li, Z.; Chen, Y.B.; Wei, S.Z.; Xiao, F.N.; Sajid, H.S.; Xu, L.J. Flow behavior and processing map for hot deformation of W-1.5ZrO2 alloy. J. Alloys Compd. 2019, 802, 118–128. [Google Scholar] [CrossRef]
  25. Montheillet, F.; Jonas, J.J.; Neale, K.W. Modeling of dynamic material behavior: A critical evaluation of the dissipator power co-content approach. Metall. Mater. Trans. A 1996, 27, 232–235. [Google Scholar] [CrossRef]
  26. Murty, S.V.S.N.; Rao, B.N. On the development of instability criteria during hotworking with reference to IN 718. Mater. Sci. Eng. A 1998, 254, 76–82. [Google Scholar] [CrossRef]
  27. Prasad, Y.V.R.K.; Seshacharyulu, T. Processing maps for hot working of titanium alloys. Mater. Sci. Eng. A 1998, 243, 82–88. [Google Scholar] [CrossRef]
  28. Zhang, J.; Di, H.; Wang, H.T.; Mao, K.; Ma, T.J.; Cao, Y. Hot deformation behavior of Ti-15-3 titanium alloy: A study using processing maps, activation energy map and Zener-Hollomon parameter map. J. Mater. Sci. 2012, 47, 4000–4011. [Google Scholar] [CrossRef]
  29. Wu, H.Y.; Wu, C.T.; Yang, J.C.; Lin, M.J. Hot workability analysis of AZ61-Mg alloys with processing maps. Mater. Sci. Eng. A 2014, 607, 261–268. [Google Scholar] [CrossRef]
  30. Sakai, T.; Jonas, J. Dynamic recrystallization-Mechanical and microstructural considerations. Acta Metall. 1984, 32, 189–209. [Google Scholar] [CrossRef]
  31. Huang, K.; Logé, R.E. A review of dynamic recrystallization phenomena in metallic materials. Mater. Des. 2016, 111, 548–574. [Google Scholar] [CrossRef]
  32. Sakai, T.; Belyakov, A.; Kaibyshev, R.; Miura, H.; Jonas, J. Dynamic and post-dynamic recrystallization under hot, cold and severe plastic deformation conditions. Prog. Mater. Sci. 2014, 60, 130–207. [Google Scholar] [CrossRef] [Green Version]
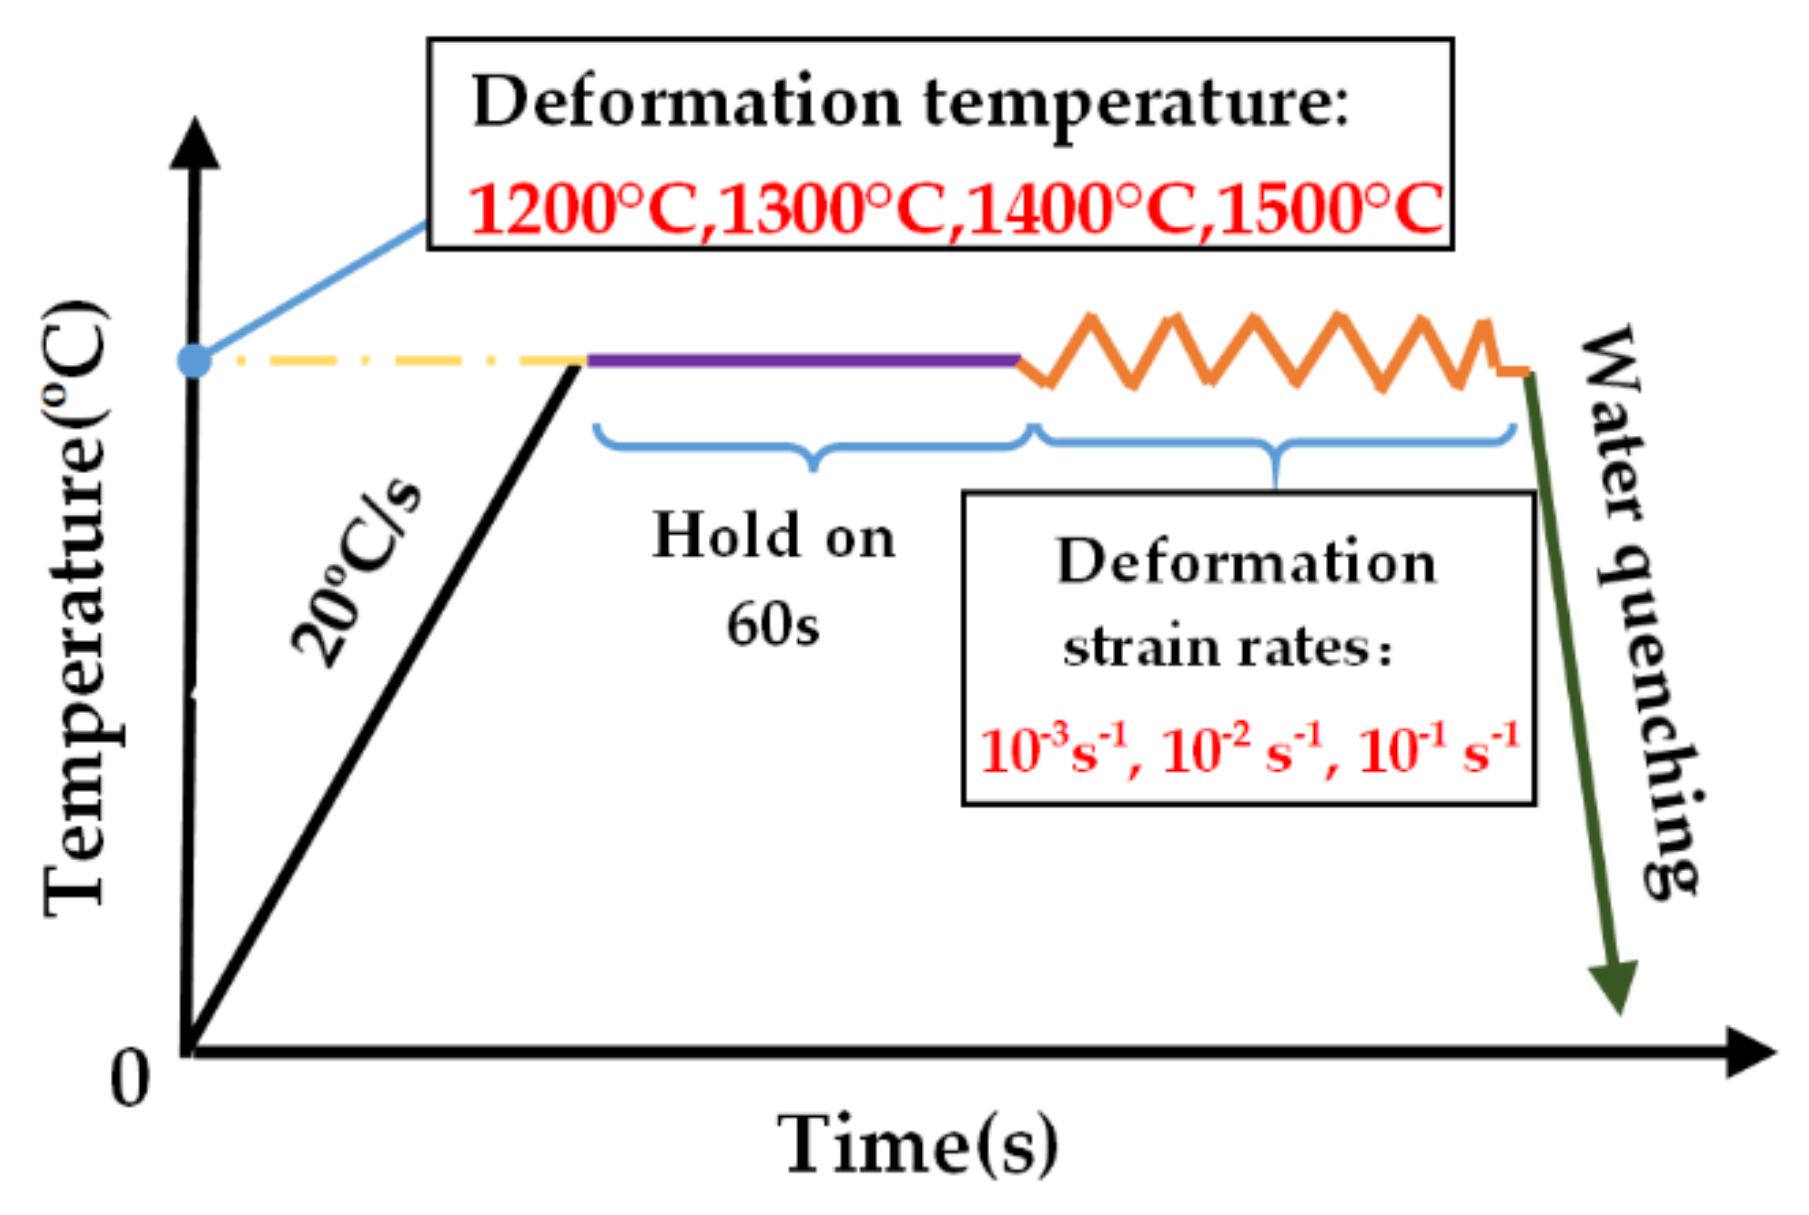
Figure 1. The flowchart for hot compression tests of pure iridium.
Metals 10 01087 g001
Figure 2. The initial microstructure of iridium: (a) Electrolytic corrosion device; (b) Optical Microscopy (OM) images.
Metals 10 01087 g002
Figure 3. Change of specimen shape before and after compression: (a) Sketch map; (b) sample.
Metals 10 01087 g003
Figure 4. Comparisons between the corrected and measured flow stress cures: (a) ε ˙ = 10−1 s−1; (b) ε ˙ = 102 s−1; (c) ε ˙ = 10−3 s−1; (d) variation of compression yield strength (σs) with deformation conditions.
Metals 10 01087 g004
Figure 5. Relationship between: (a) l n ε ˙ -lnσp; (b) l n ε ˙ -σp.
Metals 10 01087 g005
Figure 6. Relationship between: (a) l n ε ˙ -ln[sinh(ασp)]; (b) 1/T-ln[sinh(ασp)].
Metals 10 01087 g006
Figure 7. Relationship between ln[sinh(ασp)] and lnZ.
Metals 10 01087 g007
Figure 8. Polynomial fitting results of material props (a) α-ε, (b) n-ε, (c) Q-ε, (d) lnA-ε.
Metals 10 01087 g008aMetals 10 01087 g008b
Figure 9. Comparison of experimental and predicted values of pure iridium under different deformation conditions: (a) ε ˙ = 10−1 s−1; (b) ε ˙ = 10−2 s−1; (c) ε ˙ = 10−3 s−1.
Metals 10 01087 g009
Figure 10. The relevance between the predicted value and the experimental value of flow stress.
Metals 10 01087 g010
Figure 11. The strain rate sensitivity map at the strain of: (a) ε = 0.3; (b) ε = 0.6.
Metals 10 01087 g011
Figure 12. Processing map of pure iridium at various strains: (a) ε = 0.1; (b) ε = 0.2; (c) ε = 0.3; (d) ε = 0.4; (e) ε = 0.5; (f) ε = 0.6.
Metals 10 01087 g012
Figure 13. Comparison of SEM images for pure iridium microstructure deformed at: (a) 1200 °C, 10−1 s−1; (b) 1400 °C, 10−1 s−1; (c) 1500 °C, 10−1 s−1; (d) 1200 °C, 10−2 s−1; (e) processing map of ε = 0.6; (f) 1500 °C, 10−2 s−1; (g) 1200 °C, 10−1 s−1; (h) 1300 °C, 10−3 s−1; (i) 1400 °C, 10−3 s−1.
Metals 10 01087 g013
Table 1. The concentration of impurities present in iridium samples.
Ir ≥ wt.%Impurity Elements (ppm)
99.95PtRuRhPdAuAgCuFeNiSi
30301010<10<10<10101010
Table 2. Calculated value of B for pure iridium samples under different deformation conditions.
T/°C ε ˙ /s−1Df/mmhf/mmB
120010−38.834.901.18
10−28.905.001.22
10−18.895.101.24
130010−38.784.871.25
10−28.915.031.22
10−18.835.201.24
140010−39.105.021.21
10−28.794.801.25
10−18.755.041.25
150010−38.824.951.29
10−29.054.921.25
10−18.815.101.19
Table 3. Polynomial fitting coefficient of material constants.
iαi/(MPa−1)Qi/(J·mol−1)niln(Ai/s−1)
07.86 × 10−39.46 × 10512.668.0
1−3.68 × 10⁻²−3.84 × 10⁶−43.1−4.00 × 10²
20.358−6.29 × 1063.209.30 × 102
3−1.991.65 × 1089.76 × 1023.86 × 103
45.37−6.44 × 10⁸−3.80 × 10³−2.12 × 10⁴
5−7.001.02 × 1095.73 × 1033.48 × 104
63.51−5.86 × 10⁸−3.09 × 10³−1.95 × 10⁴