Minimal Invasive Diagnostic Capabilities and Effectiveness of CFRP-Patches Repairs in Long-Term Operated Metals

 ,
,  ,
,  ,
,  and
and 
Abstract
:1. Introduction
- -
- How can we detect damage caused by material degradation using non-destructive or minimally invasive inspection at the operational level?
- -
- How long can structures, mostly old steel structures, be operated under fatigue loads, and how can their service life be effectively extended temporarily until further repairs and renovations?
2. Materials and Methods
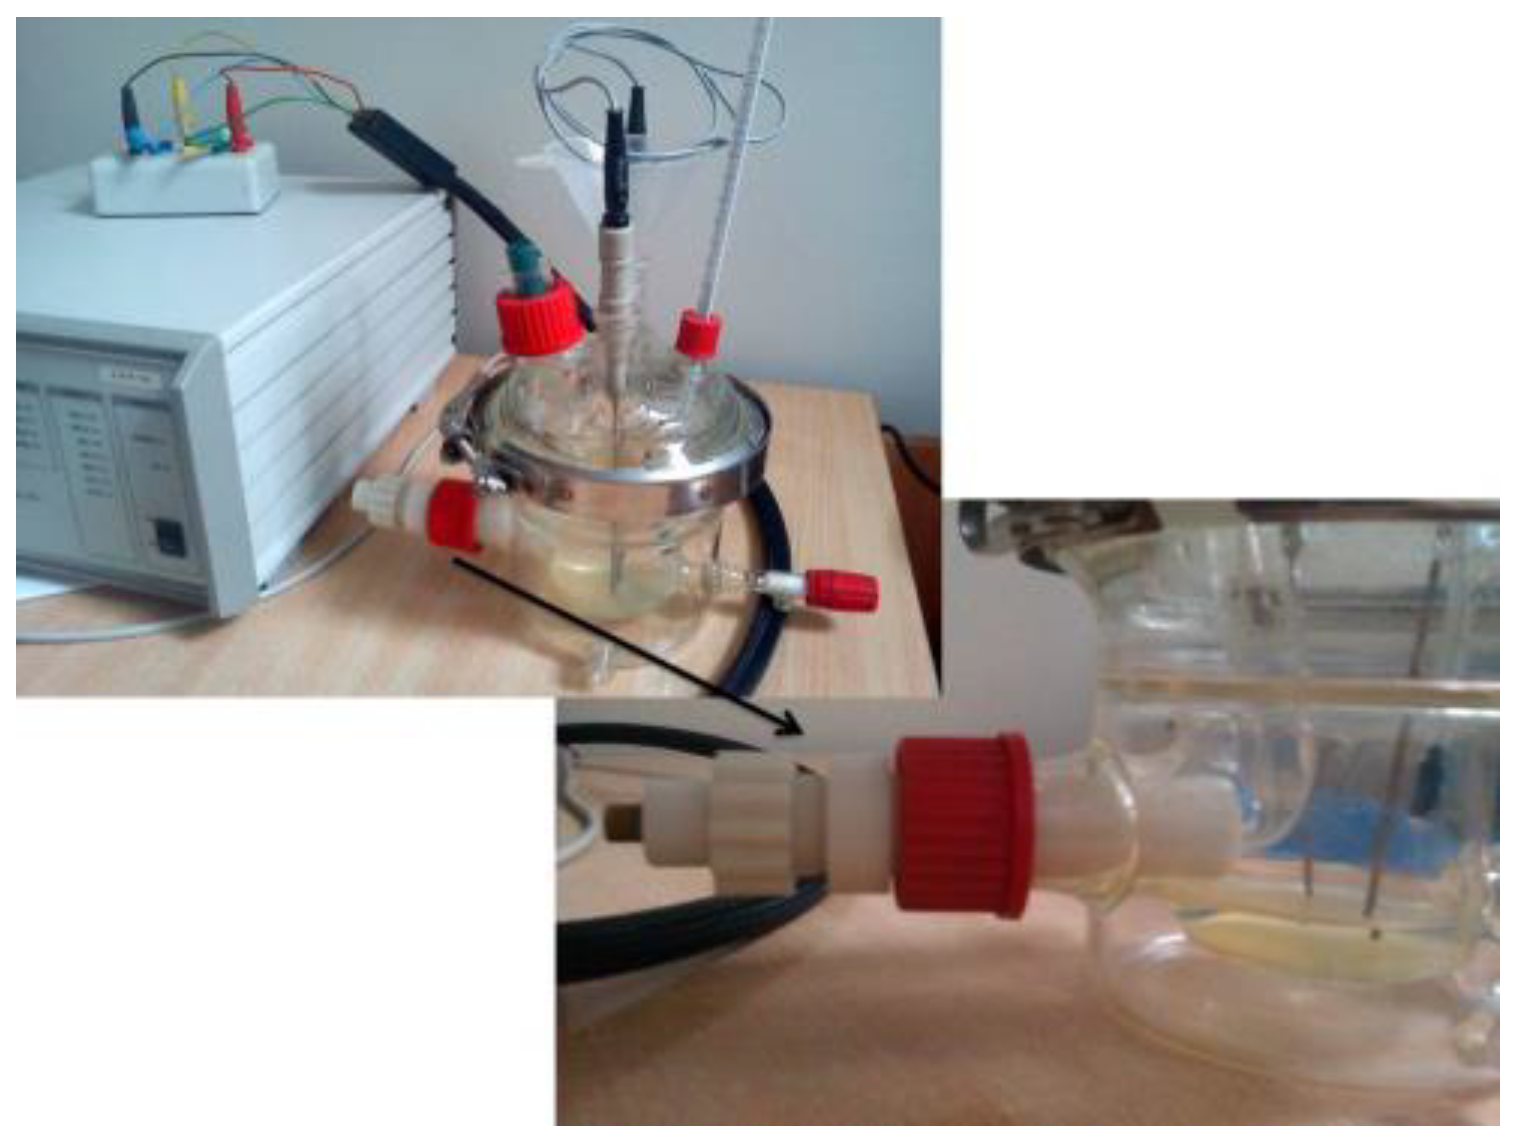
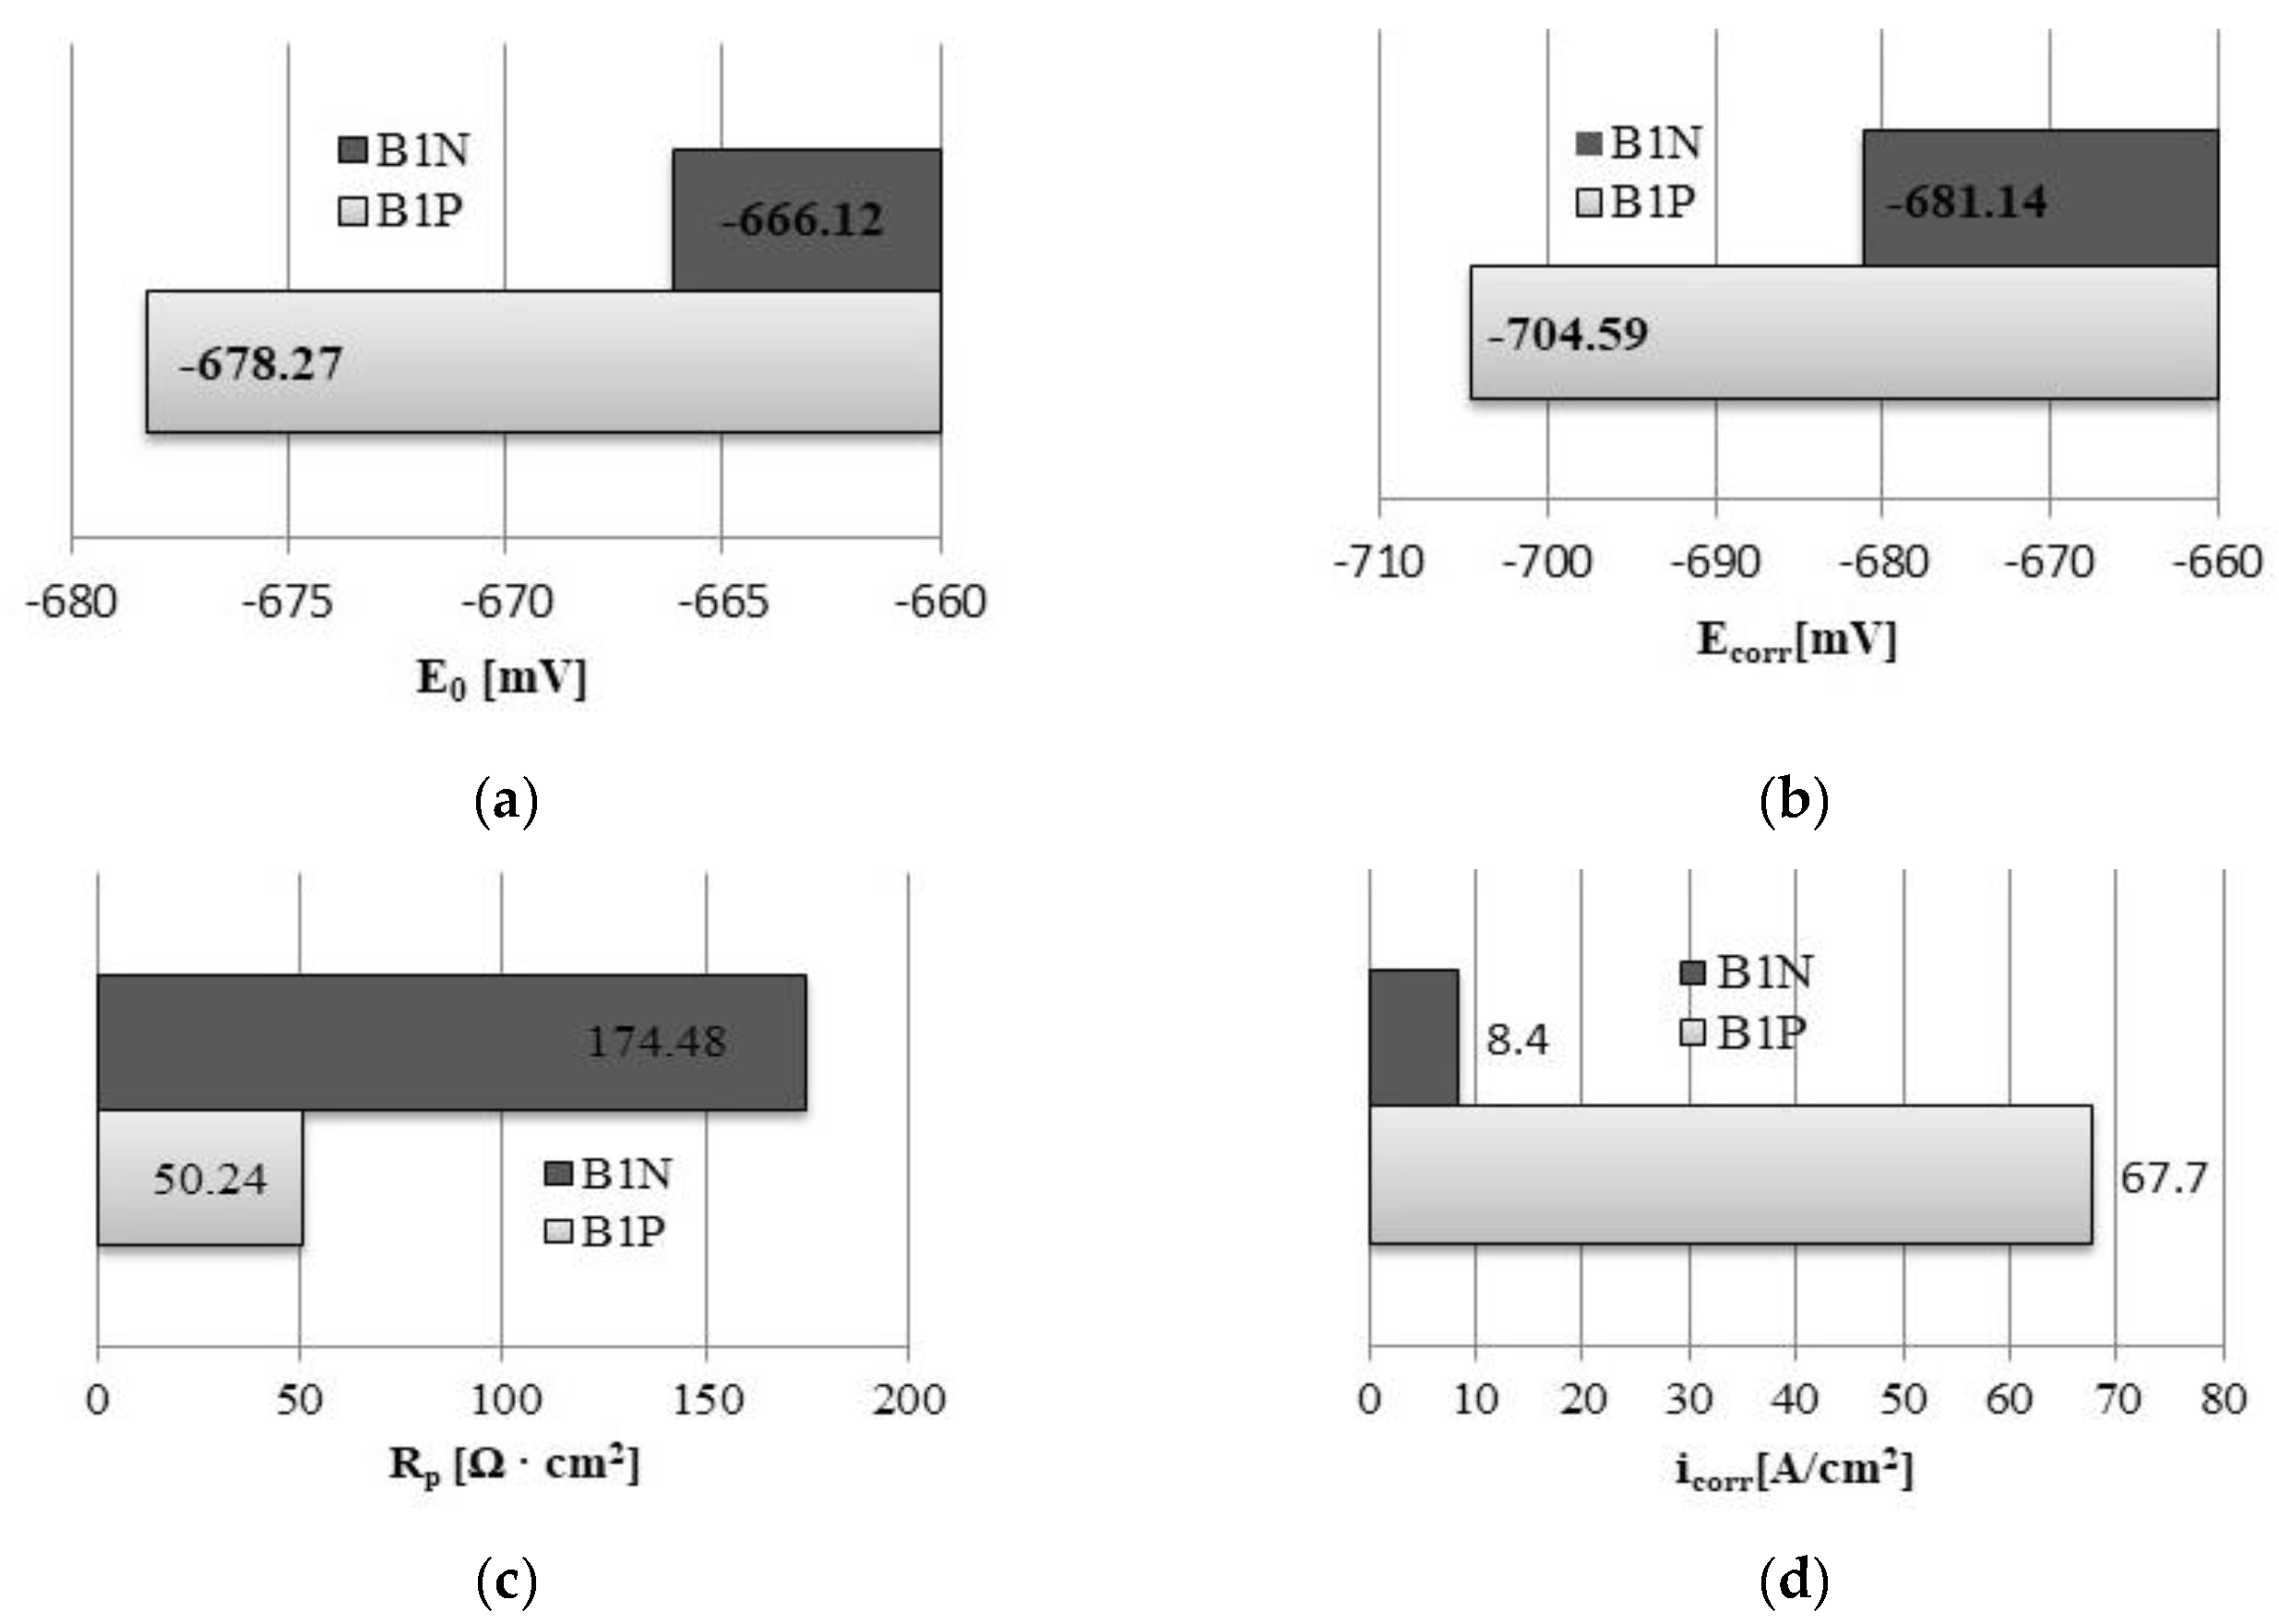
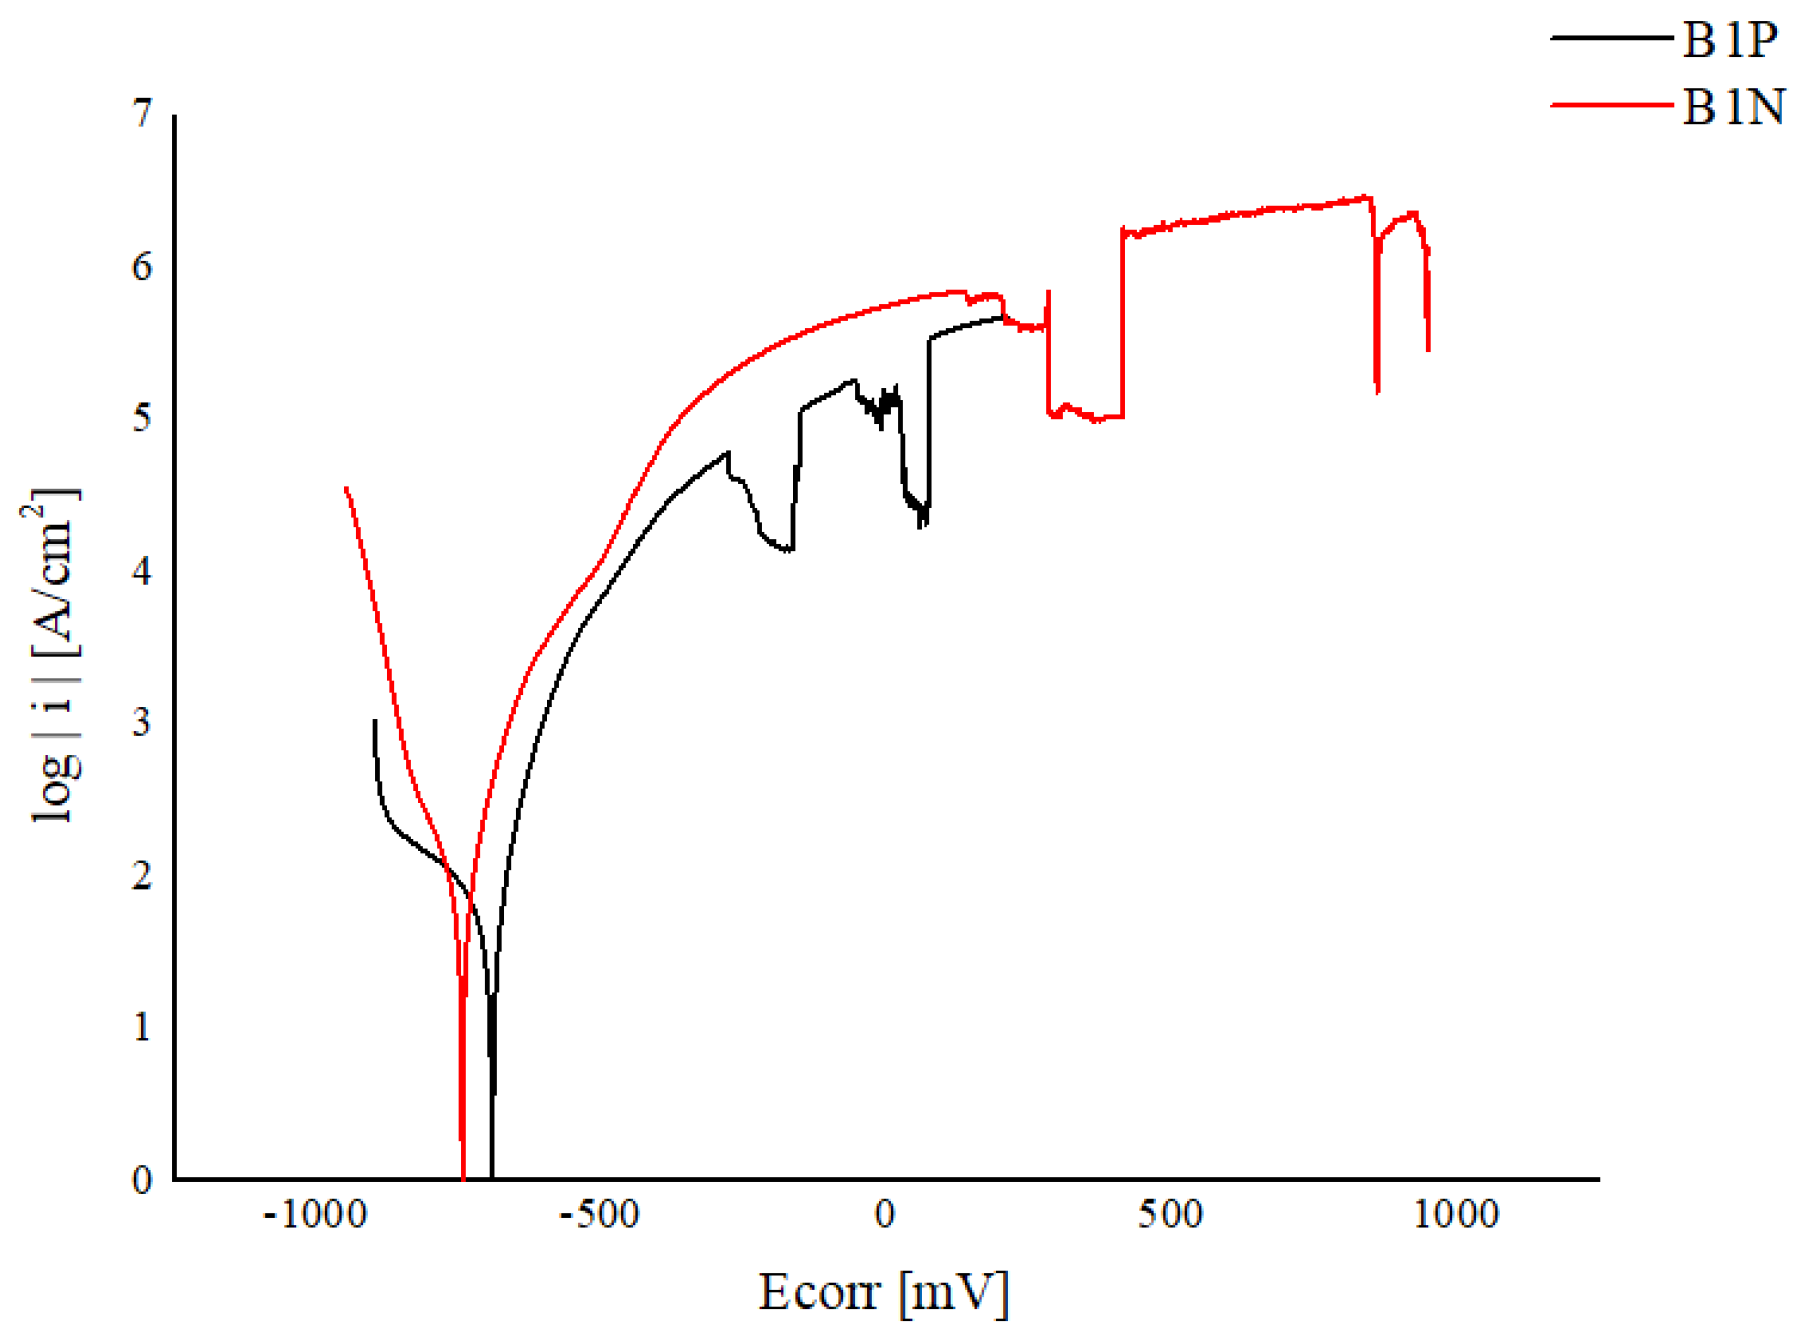
2.1. Corrosion Tests and Electrochemical Indicators of the Degradation Processes Activity
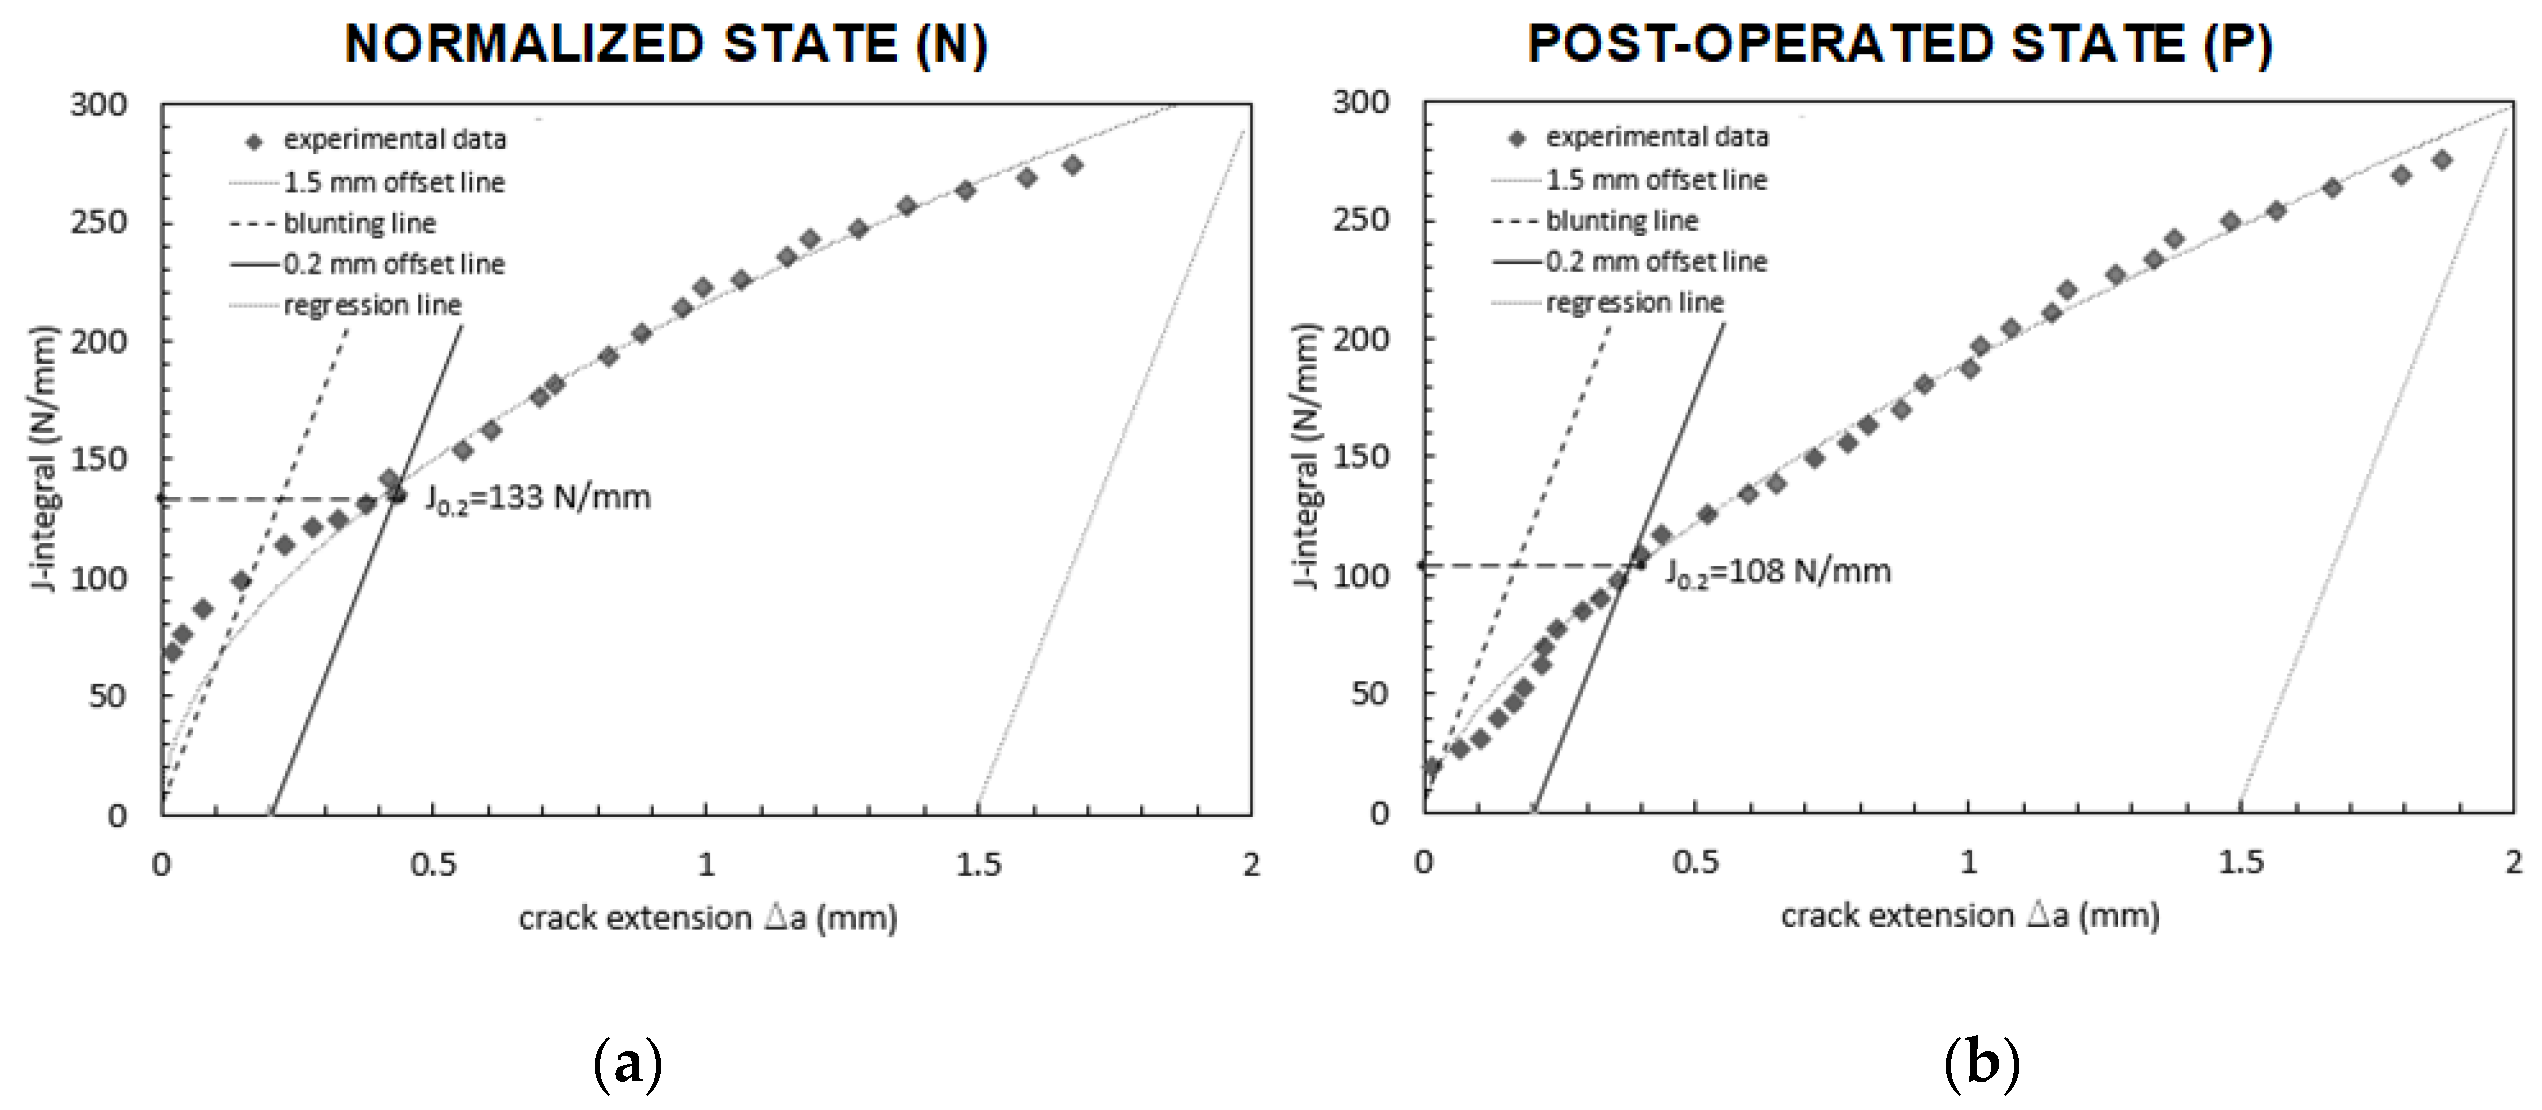
2.2. Fracture Toughness Tests
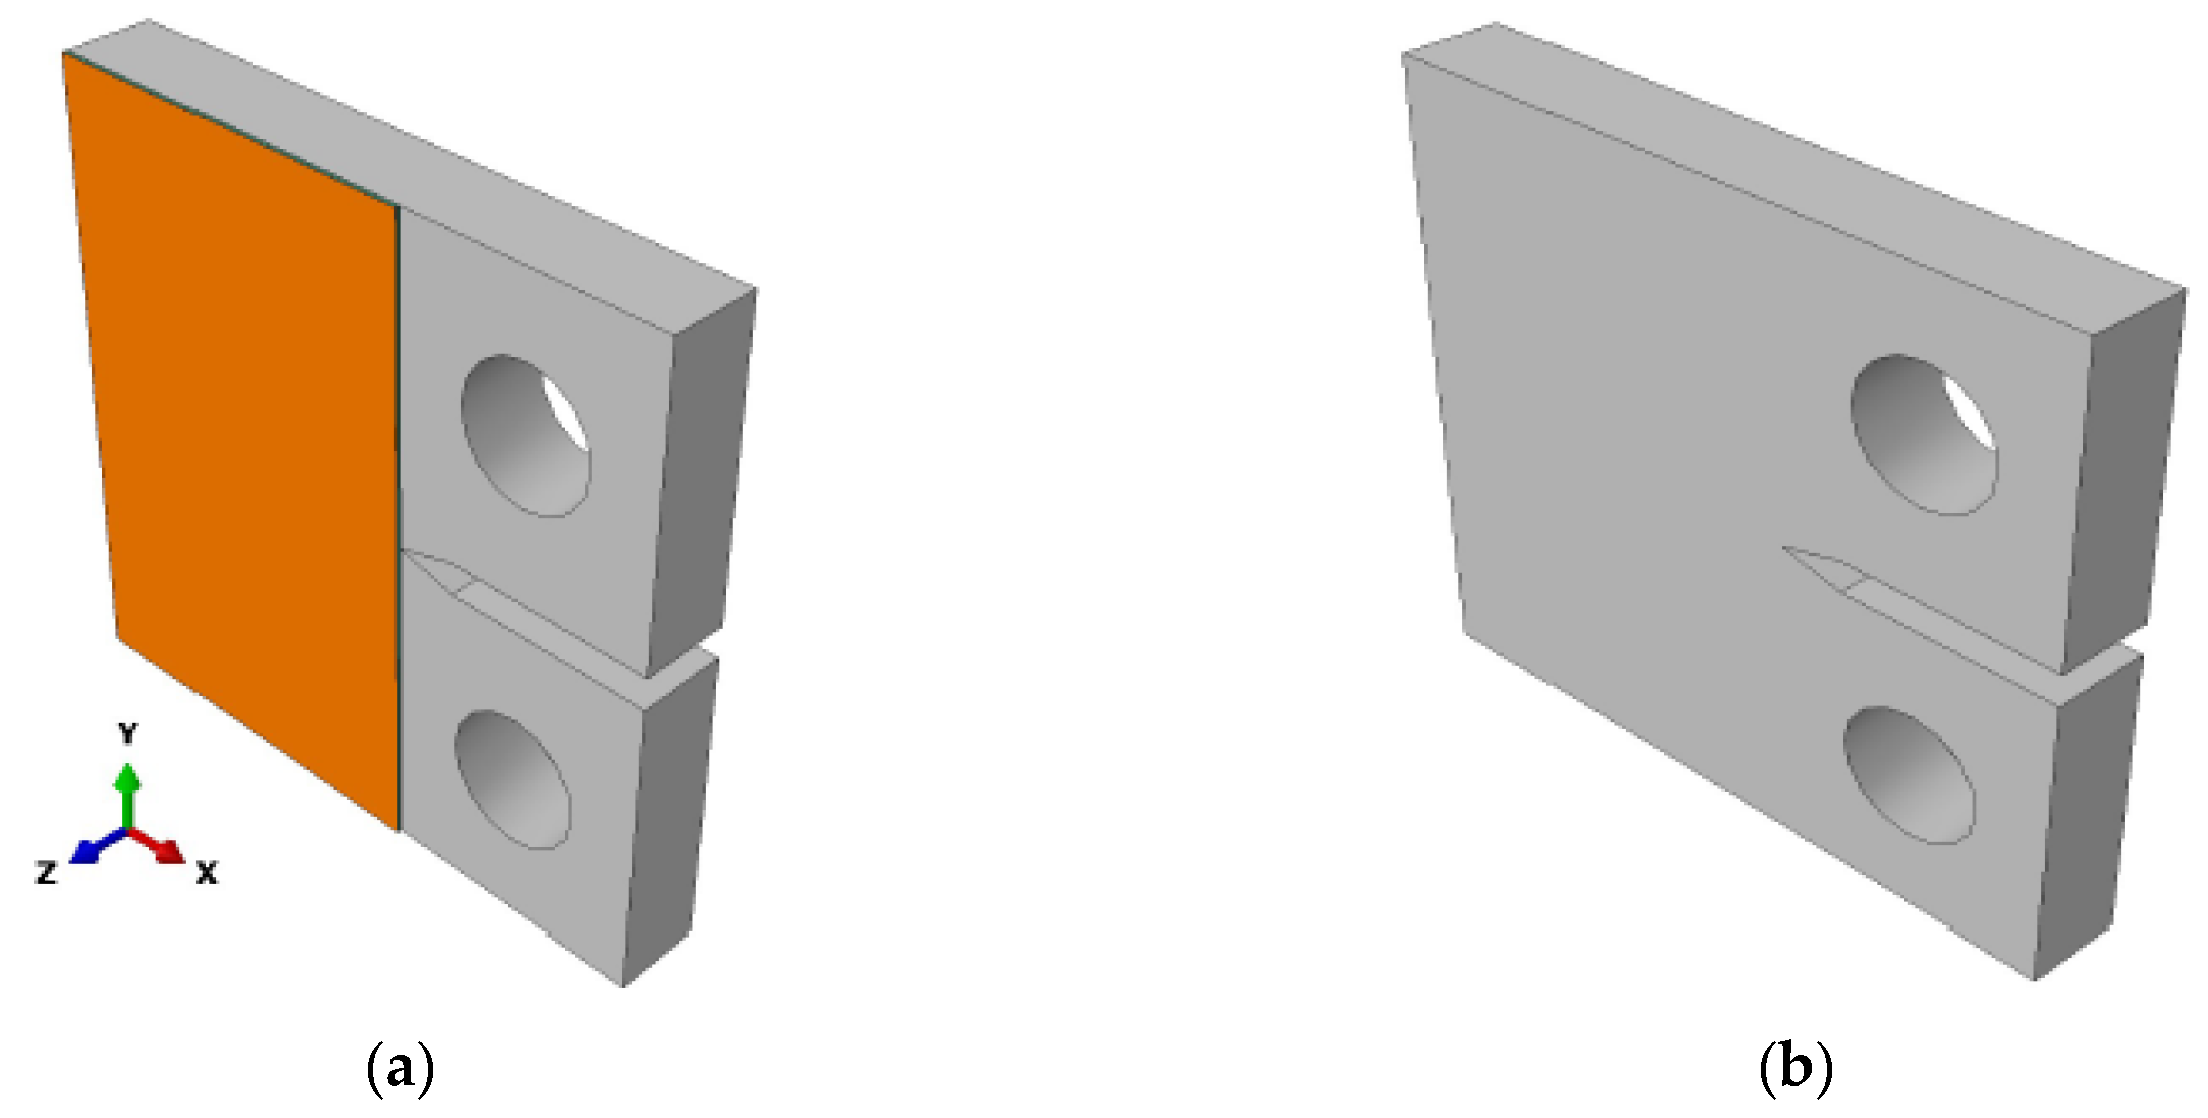
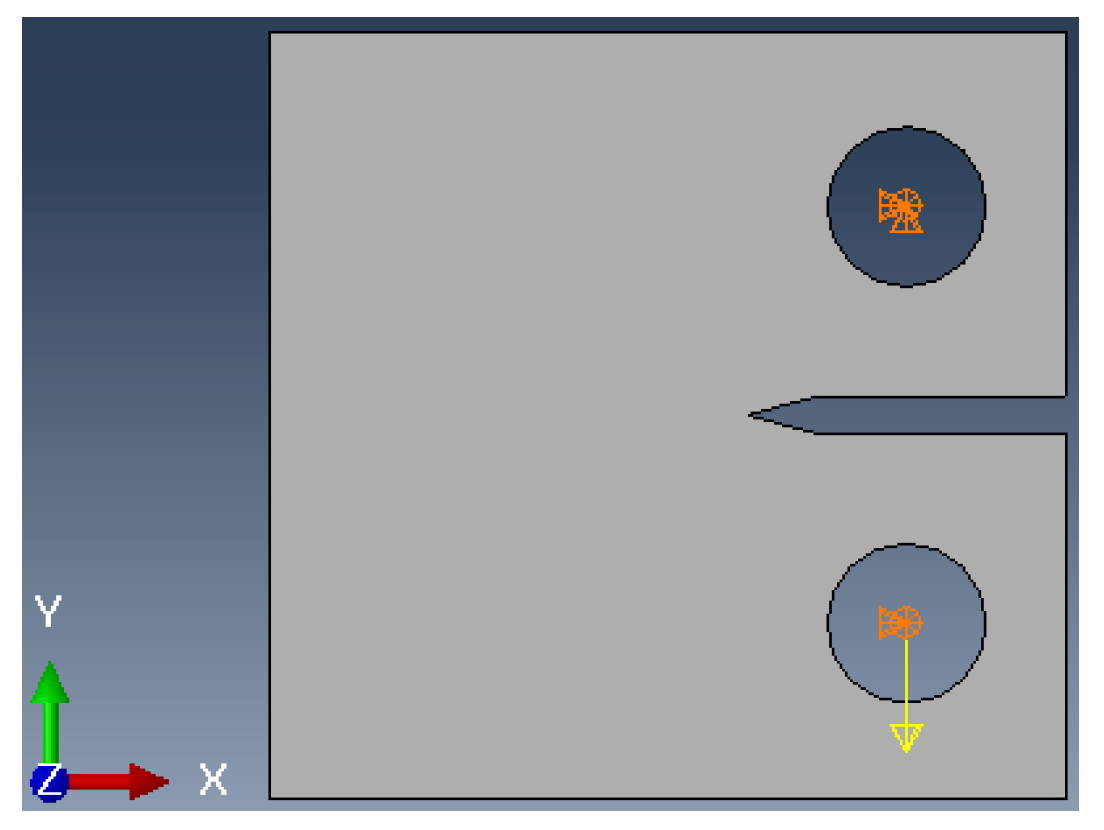
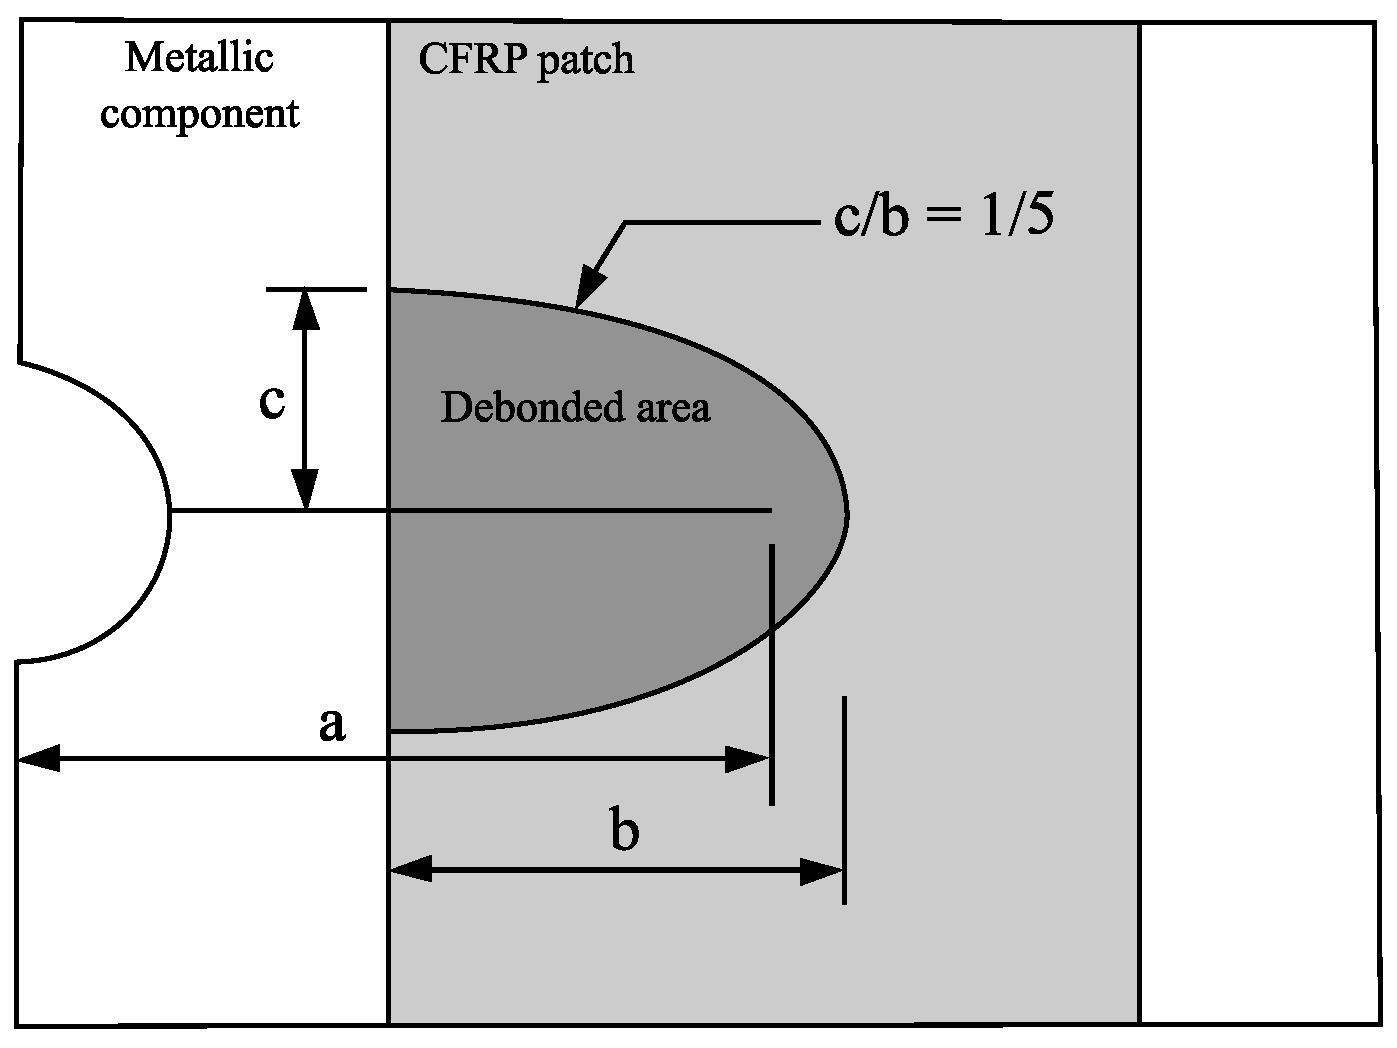
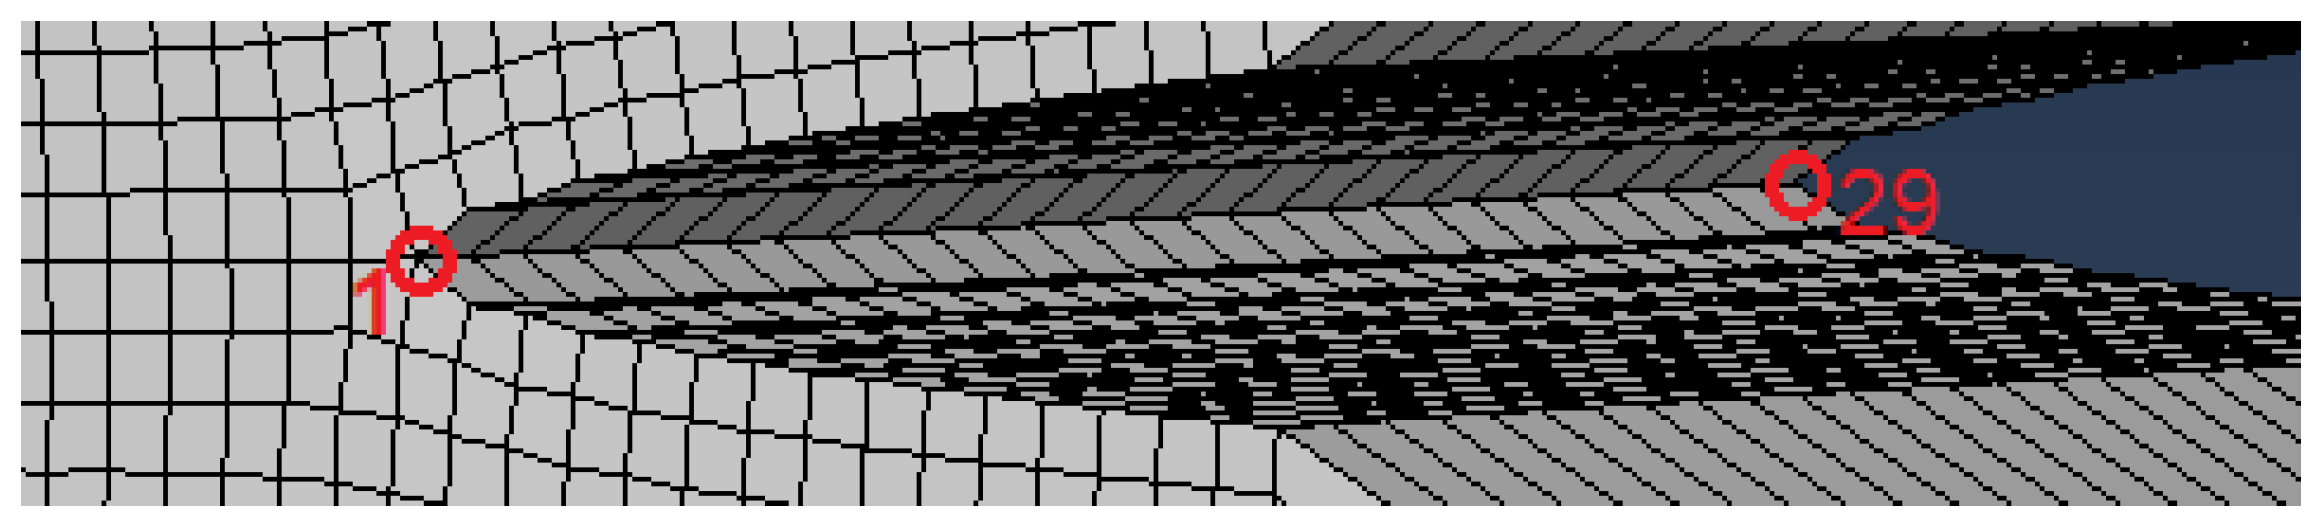
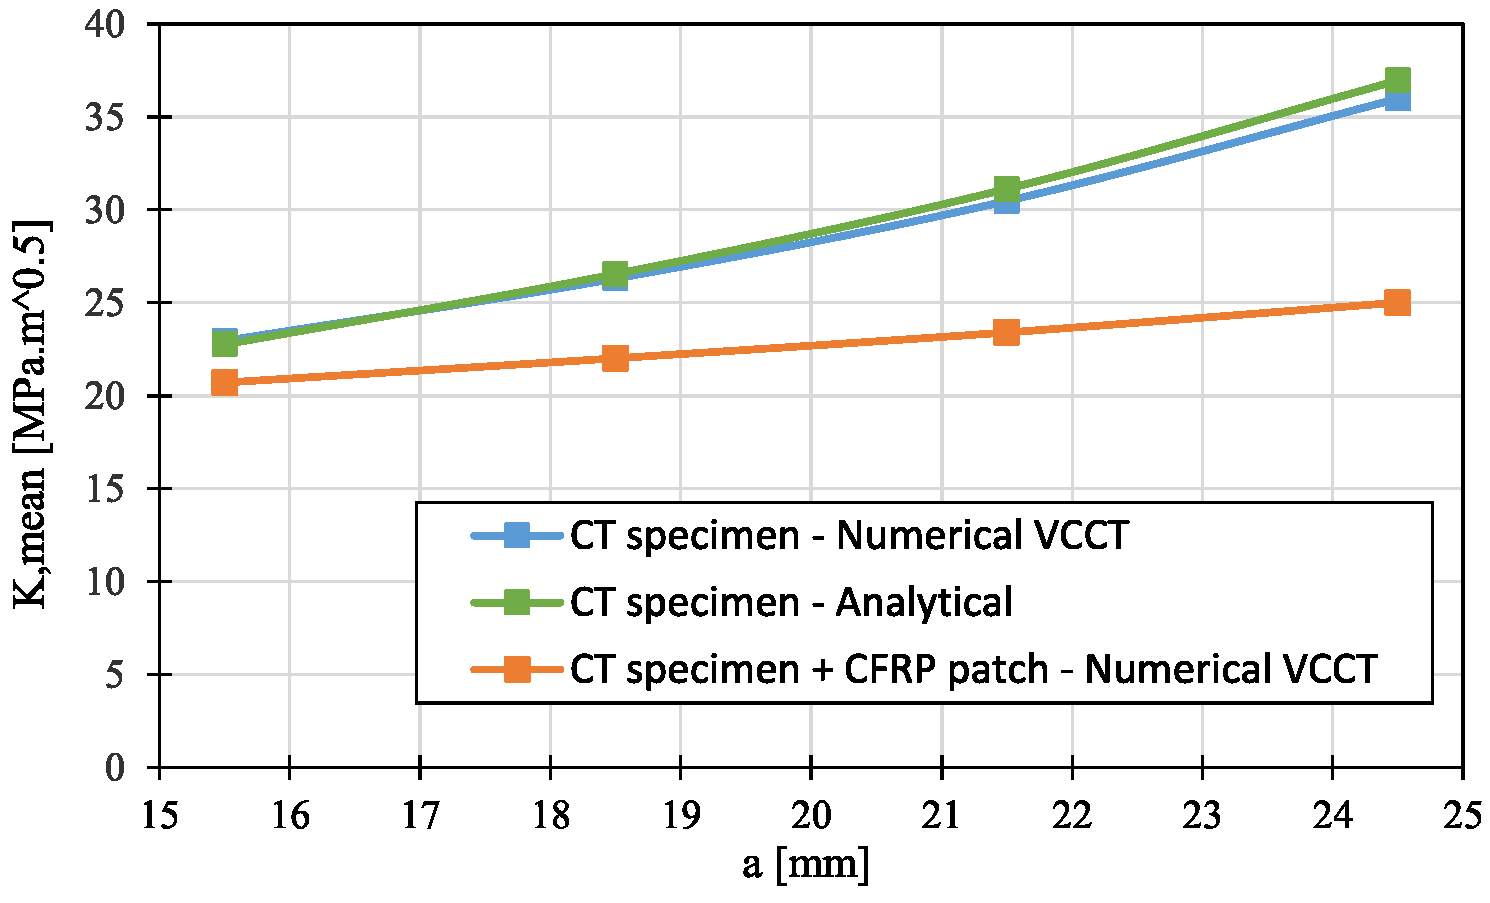
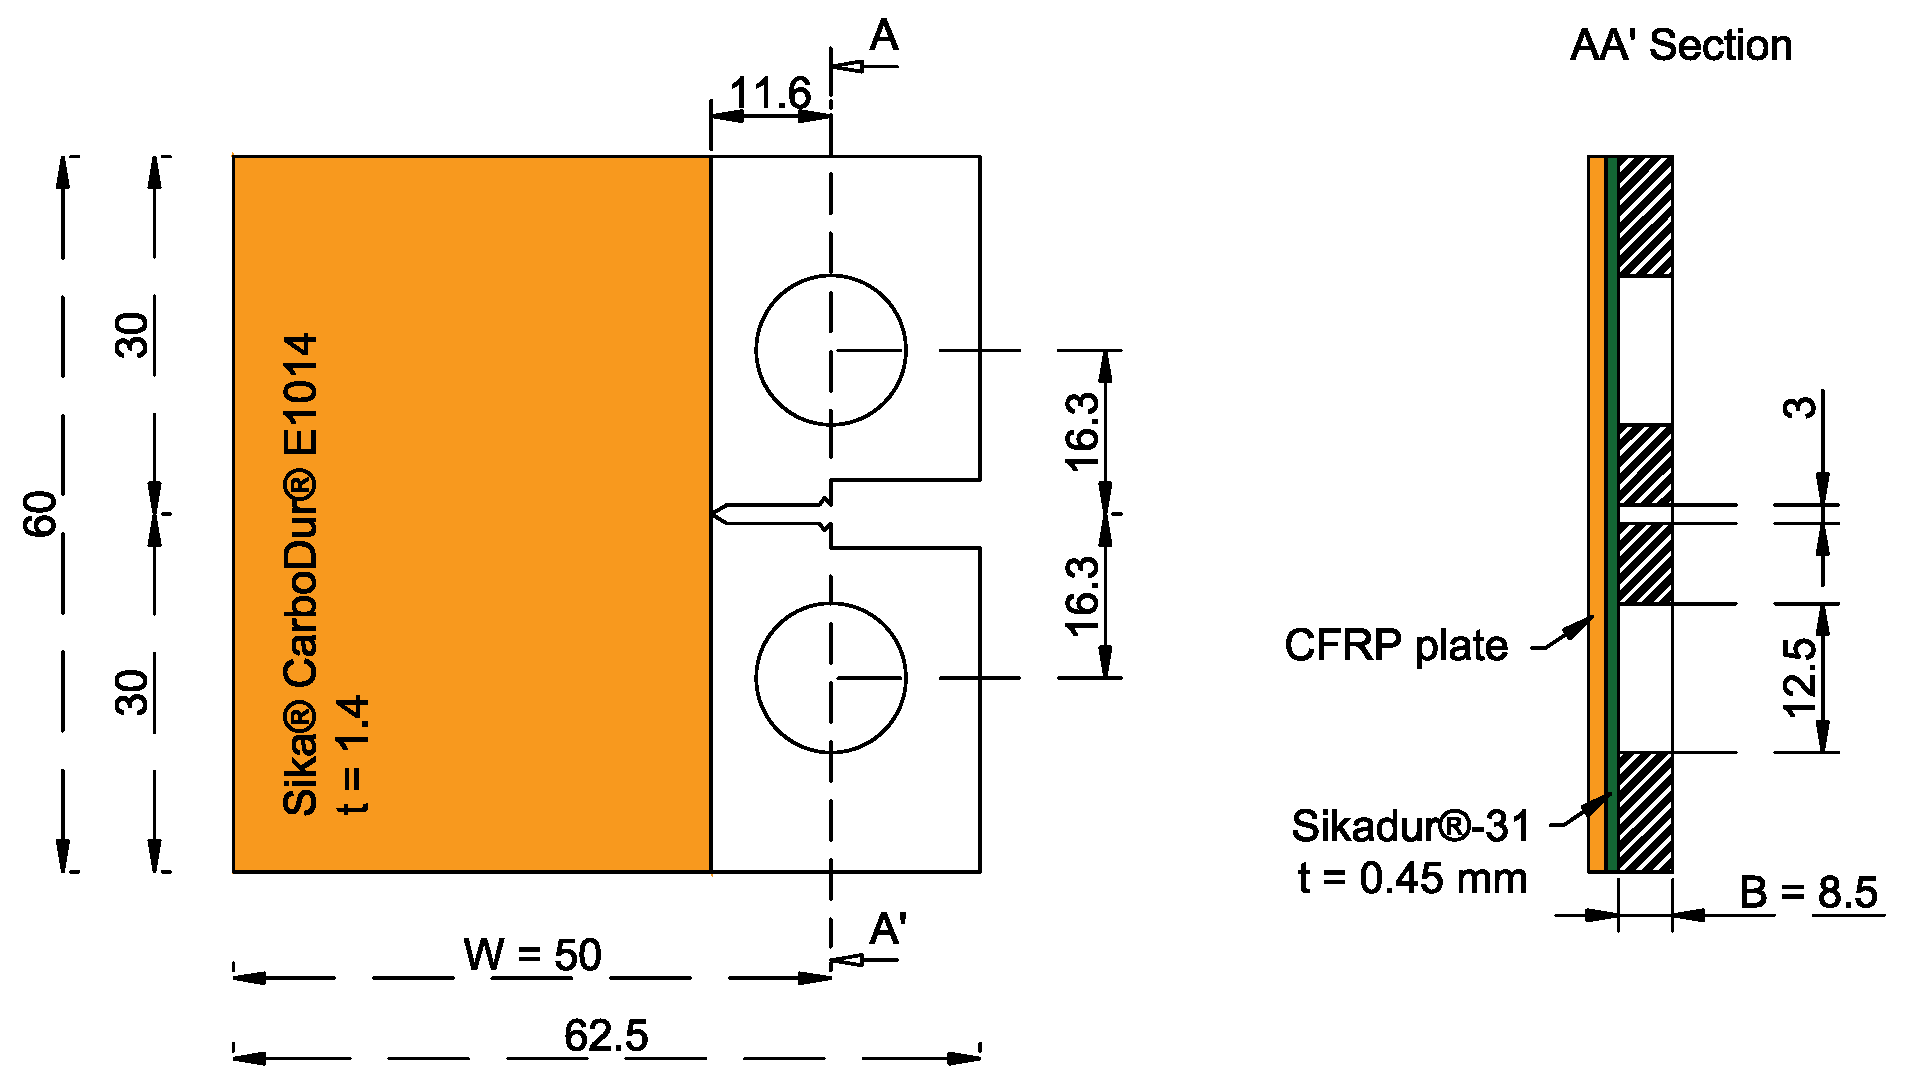
2.3. Concept of the CFRP (Carbon Fiber Reinforced Polymer) Patches Strengthening and Numerical Analysis
3. Experimental Results and Discussion
3.1. Corrosion Resistance
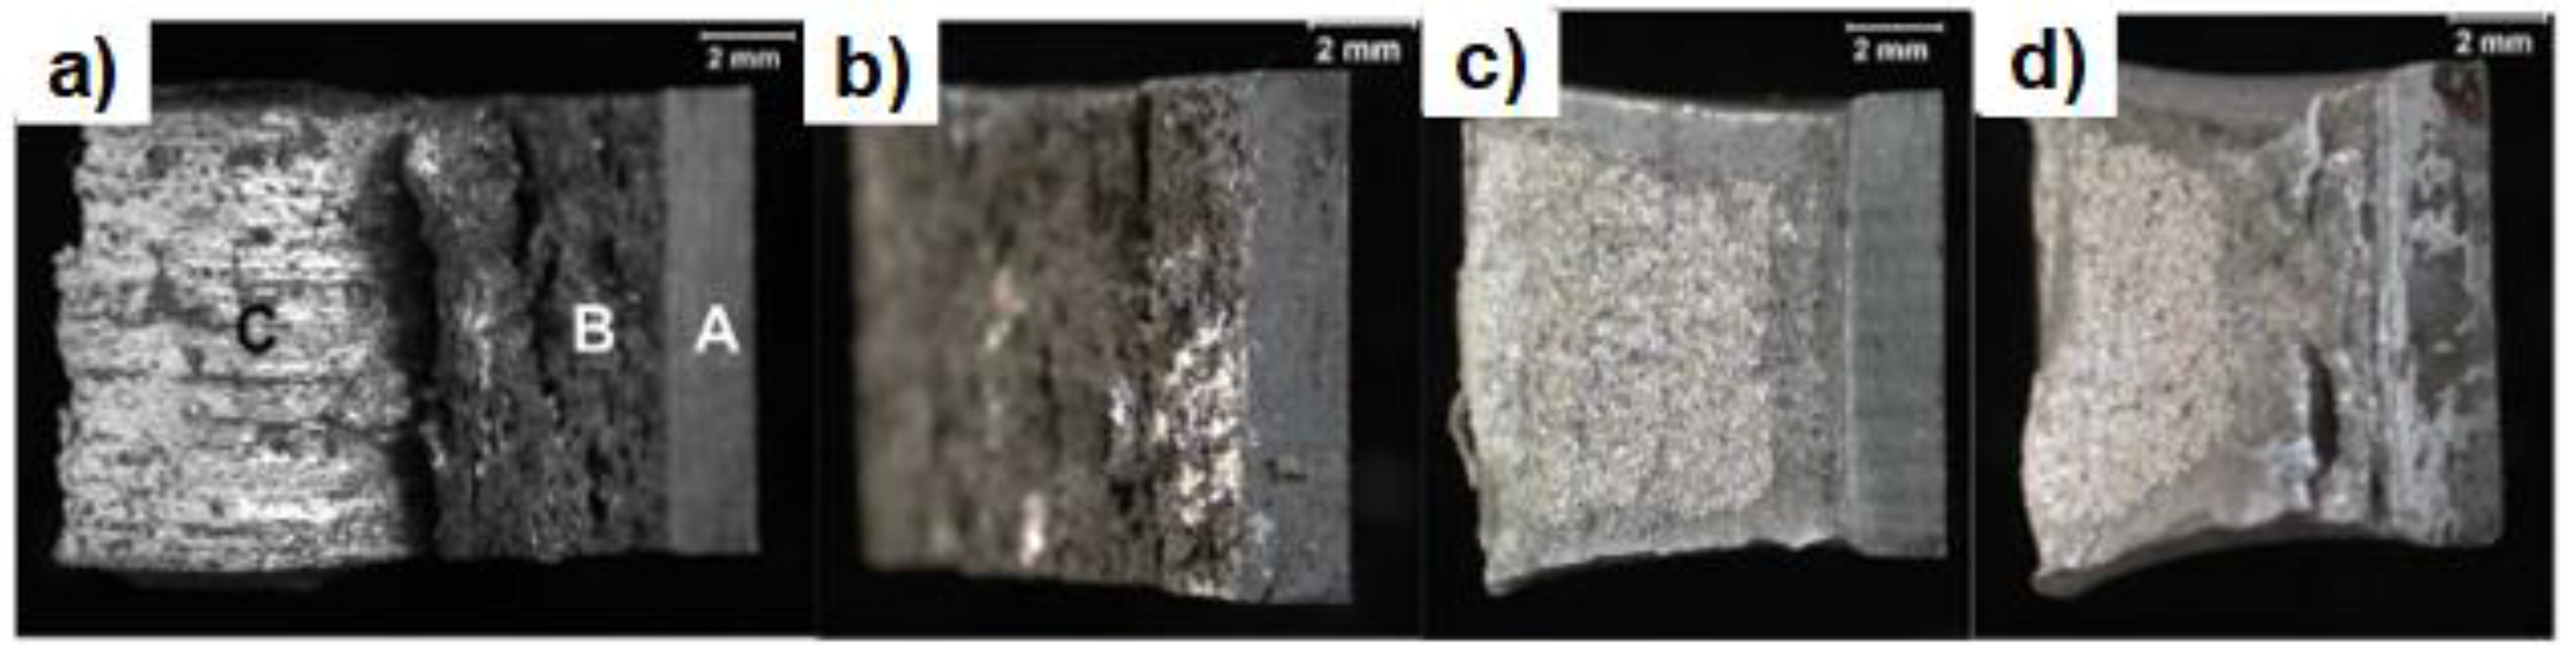
3.2. Fracture Toughness Analysis: J Integral
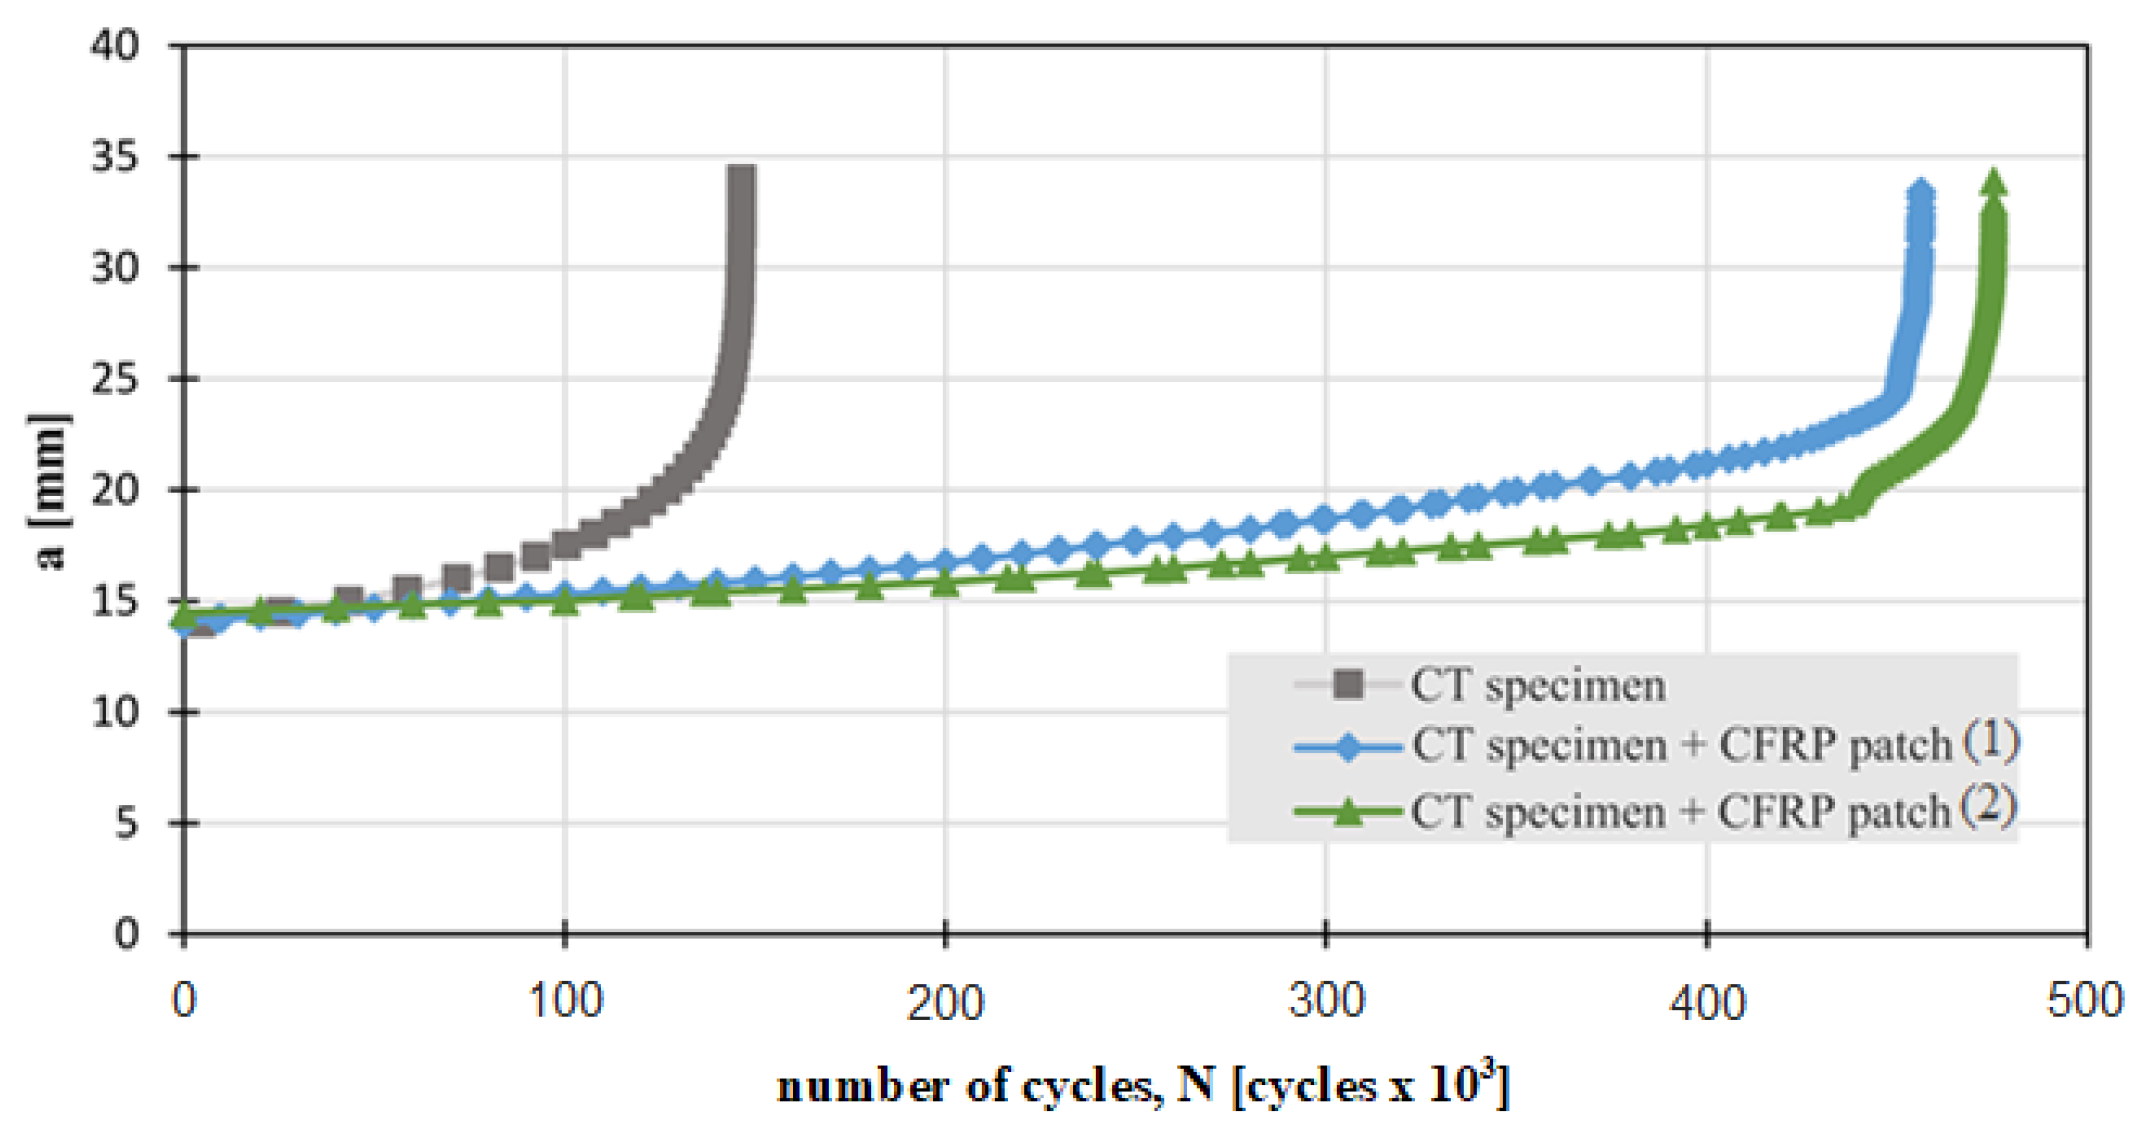
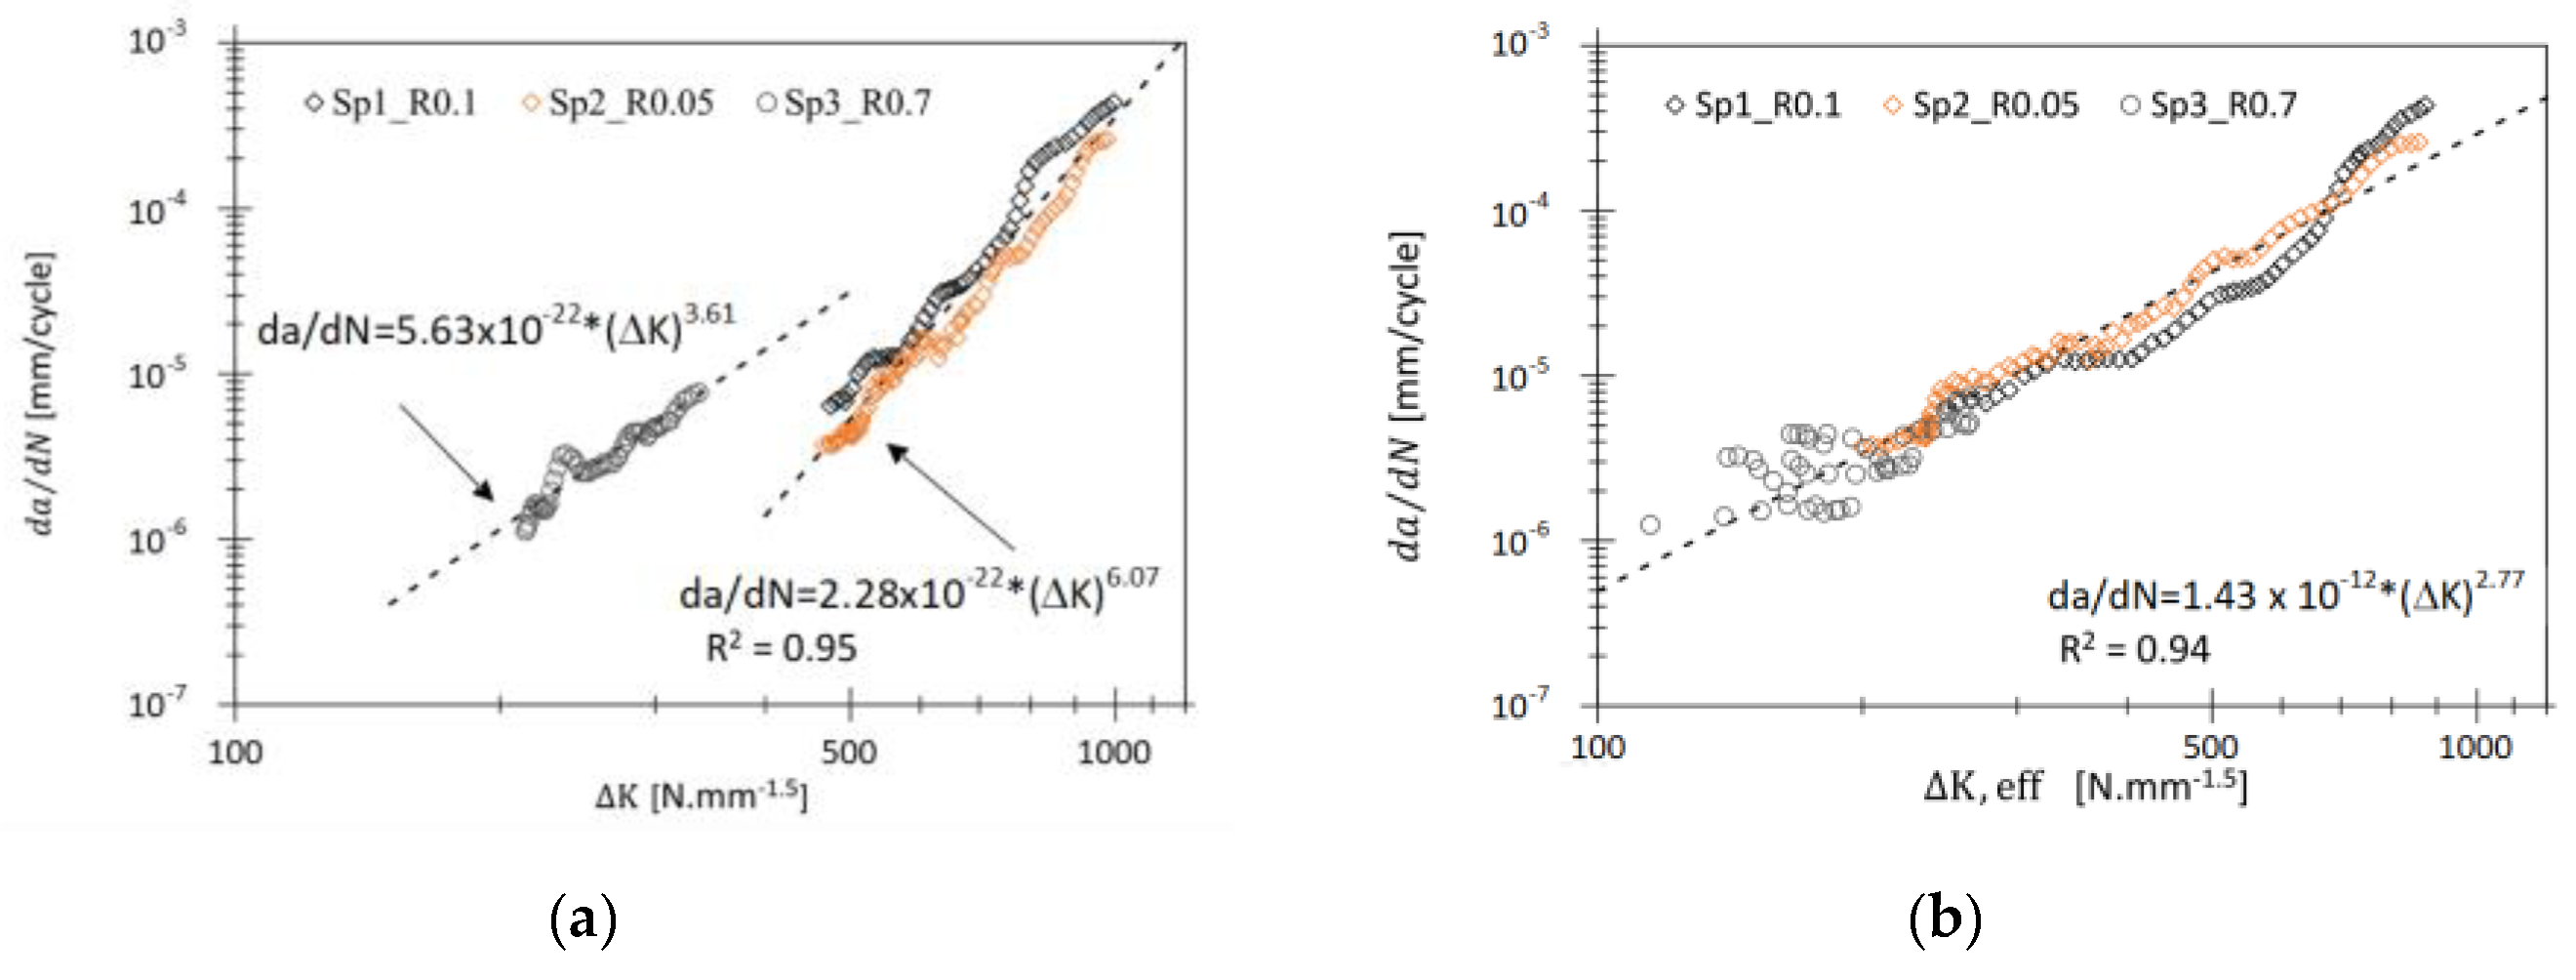
3.3. Fatigue Crack Growth Test Results
4. Conclusions
- shifting of polarization curves and change of electrochemical parameters are a good indicator to evaluate the operating condition of metals in the presented case puddle iron (19th century);
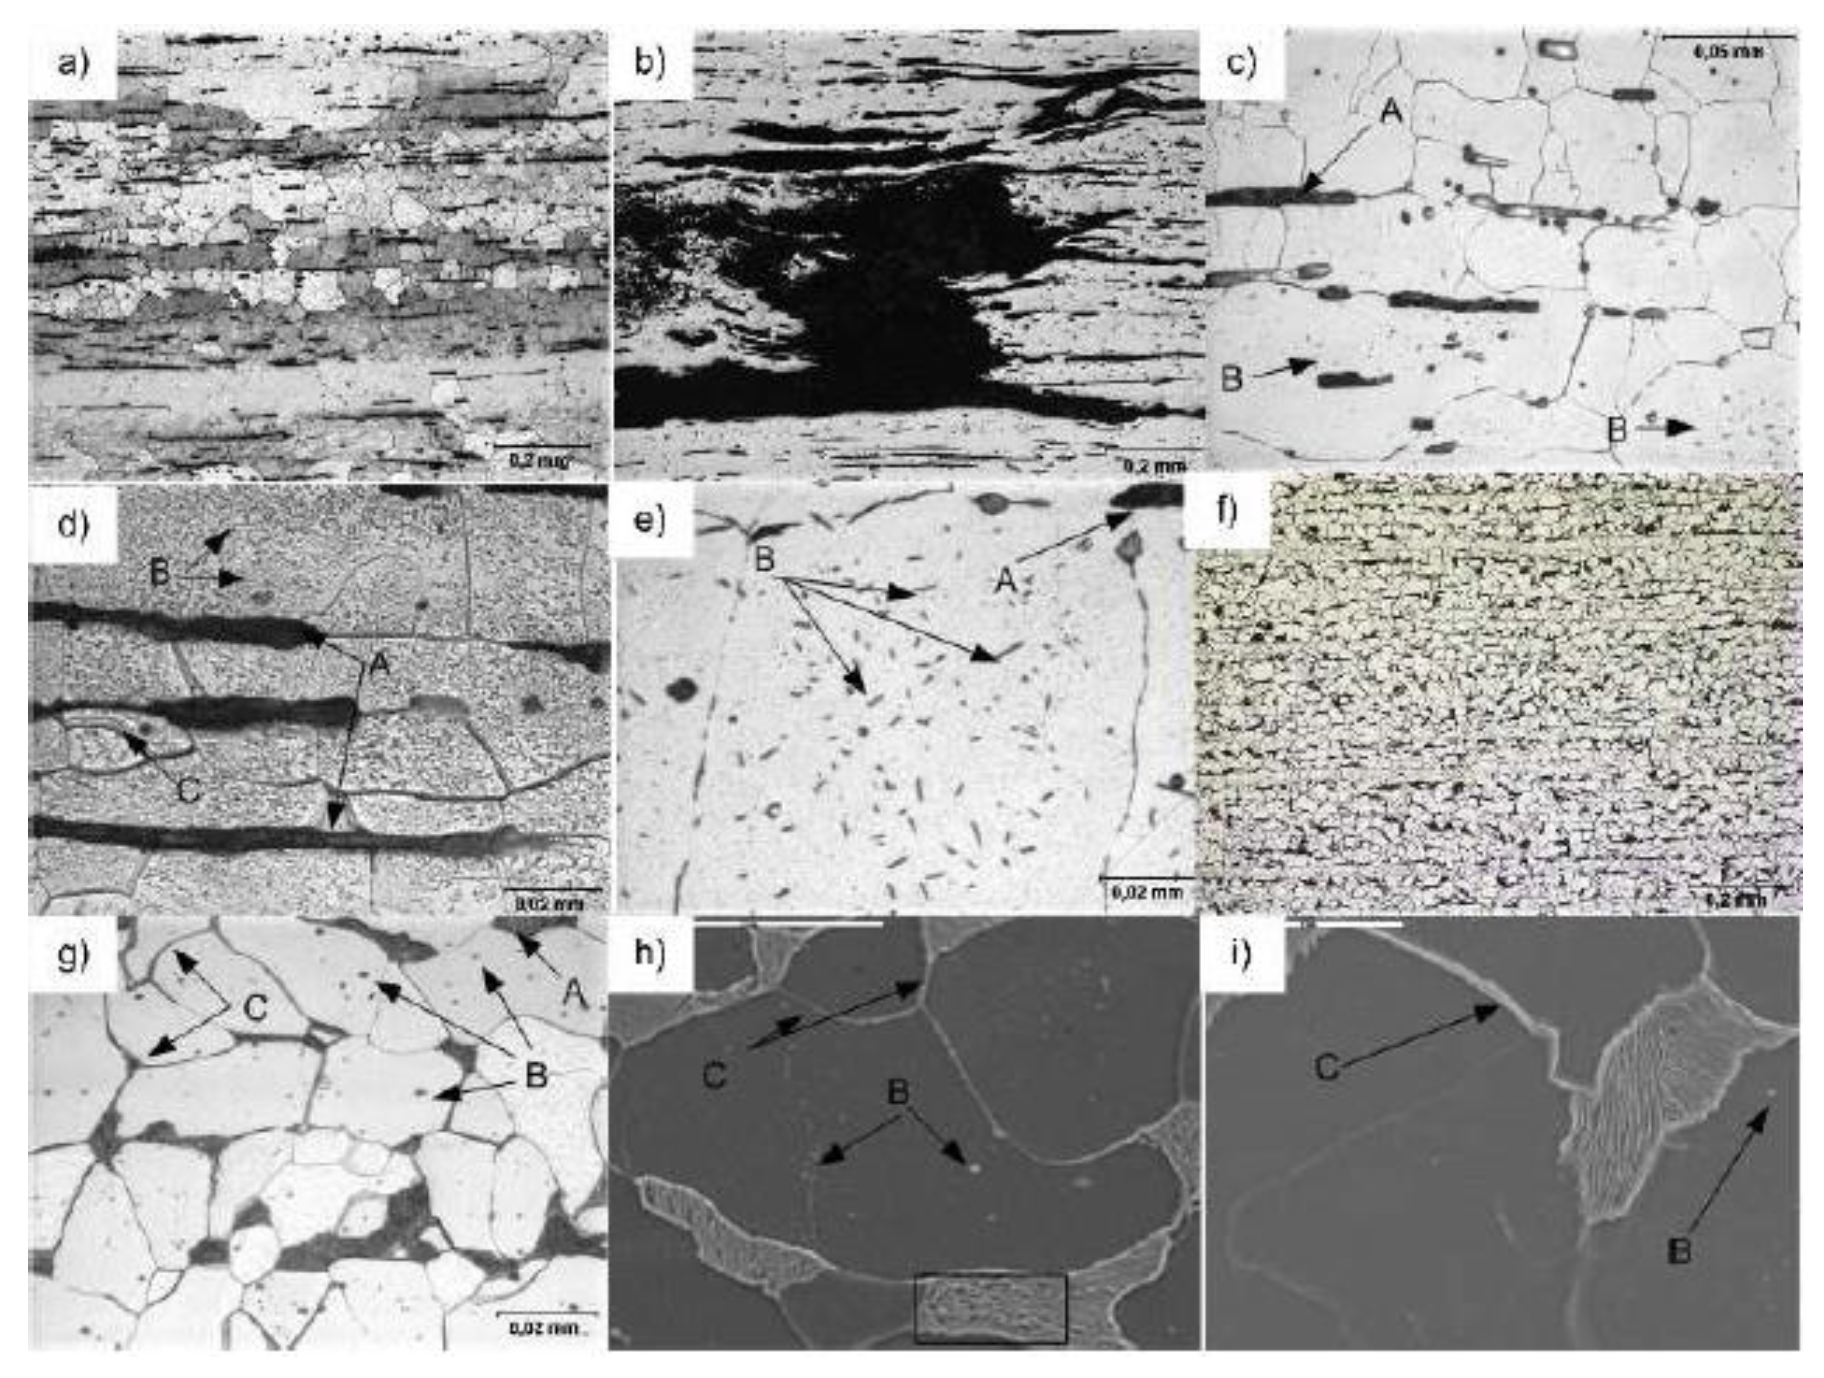
- in the case of puddle iron (and early mild steels), comparative analysis in the post-operated and normalized state—in the absence of material in the virgin state—is a reasonable solution to confirm the presence of microstructural degradation phenomena;
- application of modern adhesive solutions and CFRP patches allow effectively decelerating the development of fatigue cracking, which was confirmed numerically and experimentally. A prerequisite is to design the hybrid joint (metal + composite) correctly using numerical methods;
- further work will aim to establish the relationship between the fracture mechanism and diagnostic methods of structural elements subjected to multi-axial stress; and
- the future linking of changes in the electrochemical parameters of steel to the progress of degradation is also a further condition for the development of a diagnostic system for long term-operated materials, which requires even more experimental work. However, this study has shown the possible direction of further research.
Author Contributions
Funding
Conflicts of Interest
References
- Hołowaty, J. Toughness tests on steels from old railway bridges. Procedia Struct. Integr. 2017, 5, 1043–1050. [Google Scholar] [CrossRef]
- Sieber, L.; Stroetmann, R. The brittle fracture behaviour of old mild steels. Procedia Struct. Integr. 2017, 5, 1019–1026. [Google Scholar] [CrossRef]
- Lesiuk, G.; Correia, J.A.F.O.; Krechkovska, H.V.; Pekalski, G.; Jesus, A.M.P.; de Student, O. Degradation Theory of Long Term Operated Materials. In Structural Integrity Series; Springer Nature: Heidelberg, Germany, 2021; Volume 15, in press. [Google Scholar]
- Lesiuk, G.; Szata, M.; Bocian, M. The mechanical properties and the microstructural degradation effect in an old low carbon steels after 100-years operating time. Arch. Civ. Mech. Eng. 2015, 15, 786–797. [Google Scholar] [CrossRef]
- Lesiuk, G.; Szata, M. Aspects of structural degradation in steels of old bridges by means of fatigue crack propagation. Mater. Sci. 2011, 47, 82. [Google Scholar] [CrossRef]
- Balokhonov, R.; Romanova, V. On the problem of strain localisation and fracture site prediction in materials with irregular geometry of interfaces. Facta Univ. Ser. Mech. Eng. 2019, 17, 169–180. [Google Scholar]
- Krechkovska, H.; Student, O.; Lesiuk, G.; Correia, J. Features of the microstructural and mechanical degradation of long term operated mild steel. Int. J. Struct. Integr. 2018, 9, 296–306. [Google Scholar] [CrossRef]
- Zvirko, O.I.; Mytsyk, A.B.; Tsyrulnyk, O.T.; Gabetta, G.; Nykyforchyn, H.M. Corrosion degradation of steel of long-Term operated gas pipeline elbow with large-scale delamination. Mater. Sci. 2017, 52, 861–865. [Google Scholar] [CrossRef]
- Szata, M.; Lesiuk, G.; Pękalski, G. Assessment of degrading processes progress in the old brigde steel in terms of fracture mechanics-Part one-The investigation of possibilities. Logistyka 2009. bwmeta1.element.baztech-article-BUS6-0035-0025. Available online: http://yadda.icm.edu.pl/yadda/element/bwmeta1.element.baztech-article-BUS6-0035-0025 (accessed on 12 May 2020).
- ASTM E1820; Standard Test Method for Measurement of Fracture Toughness; American Society for Testing and Materials: West Conshohocken, PA, USA.
- Dudziński, W.; Konat, Ł.; Pękalski, G. Modern constructional steels. In Maintenance Strategy of Surface Mining Machines and Facilities with High Technical Degradation Levels; Wrocław, D.D., Ed.; Publishing House of Wrocław University of Technology: Wrocław, Poland, 2013; pp. 346–366. [Google Scholar]
- Konat, Ł.; Pękalski, G. Overview of Materials Testing of Brown-Coal Mining Machines (Years 1985–2017). In Mining Machines and Earth-Moving Equipment; Springer: Heidelberg, Germany, 2020; pp. 21–58. [Google Scholar]
- Lesiuk, G.; Sire, S.; Ragueneau, M.; Correia, J.A.F.O.; Pedrosa, B.A.S.; Jesus, A.M.P. Mean Stress Effect and Fatigue Crack Closure in Material from Old Bridge Erected in the Late 19th Century. Procedia Struct. Integr. 2019, 17, 198–205. [Google Scholar] [CrossRef]
- Lesiuk, G.; Katkowski, M.; Correia, J.; De Jesus, A.; Blazejewski, W. Fatigue Crack Growth Rate in CFRP Reinforced Constructional Old Steel. Int. J. Struct. Integr. 2018, 9, 381–395. [Google Scholar] [CrossRef]
- Lesiuk, G.; Kucharski, P.; Correia, J.; De Jesus, A.; Rebelo, C.; Simões da Silva, L. Mixed Mode (I+II) Fatigue Crack Growth in Puddle Iron. Eng. Fract. Mech. 2017, 185, 175–192. [Google Scholar] [CrossRef]
- Naboulsi, S.; Mall, S. Modelling of a Cracked Metallic Structure with Bonded Composite Patch Using the Three Layer Technique. Compos. Struct. 1996, 35, 295–308. [Google Scholar] [CrossRef]
- Sika Product Data Sheet: Sika® CarboDur® E-1014; Sika Sp. z. o.o.: Warsaw, Poland, 2019.
- Dourado, N.; Pereira, F.A.M.; de Moura, M.F.S.F.; Morais, J.J.L. Repairing Wood Beams under Bending Using Carbon-Epoxy Composites. Eng. Struct. 2012, 34, 342–350. [Google Scholar] [CrossRef]
- Krueger, R. Virtual Crack Closure Technique: History, Approach, and Applications. Appl. Mech. Rev. 2004, 109–143. [Google Scholar] [CrossRef]
- Karbhari, V. Rehabilitation of Metallic Civil Infrastructure Using Fiber-Reinforced Polymer (FRP) Composites; Woodhead, P., Ed.; Elsevier: Cambridge, UK, 2014. [Google Scholar]
- ASTM E 647; Standard Test Method for Measurement of Fatigue Crack Growth Rates; American Society for Testing and Materials: West Conshohocken, PA, USA, 2015.
- Gallegos Mayorga, L.; Sire, S.; Ragueneau, M.; Plu, B. Understanding the Behaviour of Wrought-Iron Riveted Assemblies: Manufacture and Testing in France. In Proceedings of the Institution of Civil Engineers-Engineering History and Heritage; ICE Publishing: London, UK, 2017; Volume 170, pp. 67–79. [Google Scholar]
- Zvirko, O.; Nykyforchyn, H.; Szata, M.; Kutnyi, A.; Lesiuk, G. Corrosion degradation of old structures steels. In XII International Conference “Problems of Corrosion and Corrosion Protection of Structural Materials”; Corrosion: Lviv, Ukraine, 2014. [Google Scholar]
- Tsyrul’nyk, O.T.; Kret, N.V.; Voloshyn, V.A.; Zvirko, O.I. A procedure of laboratory degradation of structural steels. Mater. Sci. 2018, 53, 674–683. [Google Scholar] [CrossRef]
- Zvirko, O.; Zagórski, A. Corrosion and electrochemical properties of the steel of exploited oil tanks in bottom water. Mater. Sci. 2008, 44, 126–132. [Google Scholar] [CrossRef]


| Material | C | Mn | Si | P | S |
|---|---|---|---|---|---|
| puddle iron for fatigue crack growth rate (bridge from Bayonne, France) marked as “A” | <0.01 | <0.02 | 0.28 | 0.41 | 0.054 |
| Puddle iron from Main Railway Station (Wrocław, Poland) marked as “B” | 0.02 | 0.03 | 0.13 | 0.29 | 0.048 |
| typical values for puddle irons | <0.8 | 0.4 | n/a | <0.6 | <0.04 |
| typical values for old mild steels | <0.15 | 0.2 ÷ 0.5 | Variable | <0.06 | <0.15 |
| E1 [GPa] | E2 [GPa] | ν12 | G12 [GPa] | G13 [GPa] | G23 [GPa] |
|---|---|---|---|---|---|
| 170 | 17 | 0.17 | 7.24 | 7.24 | 4.94 |
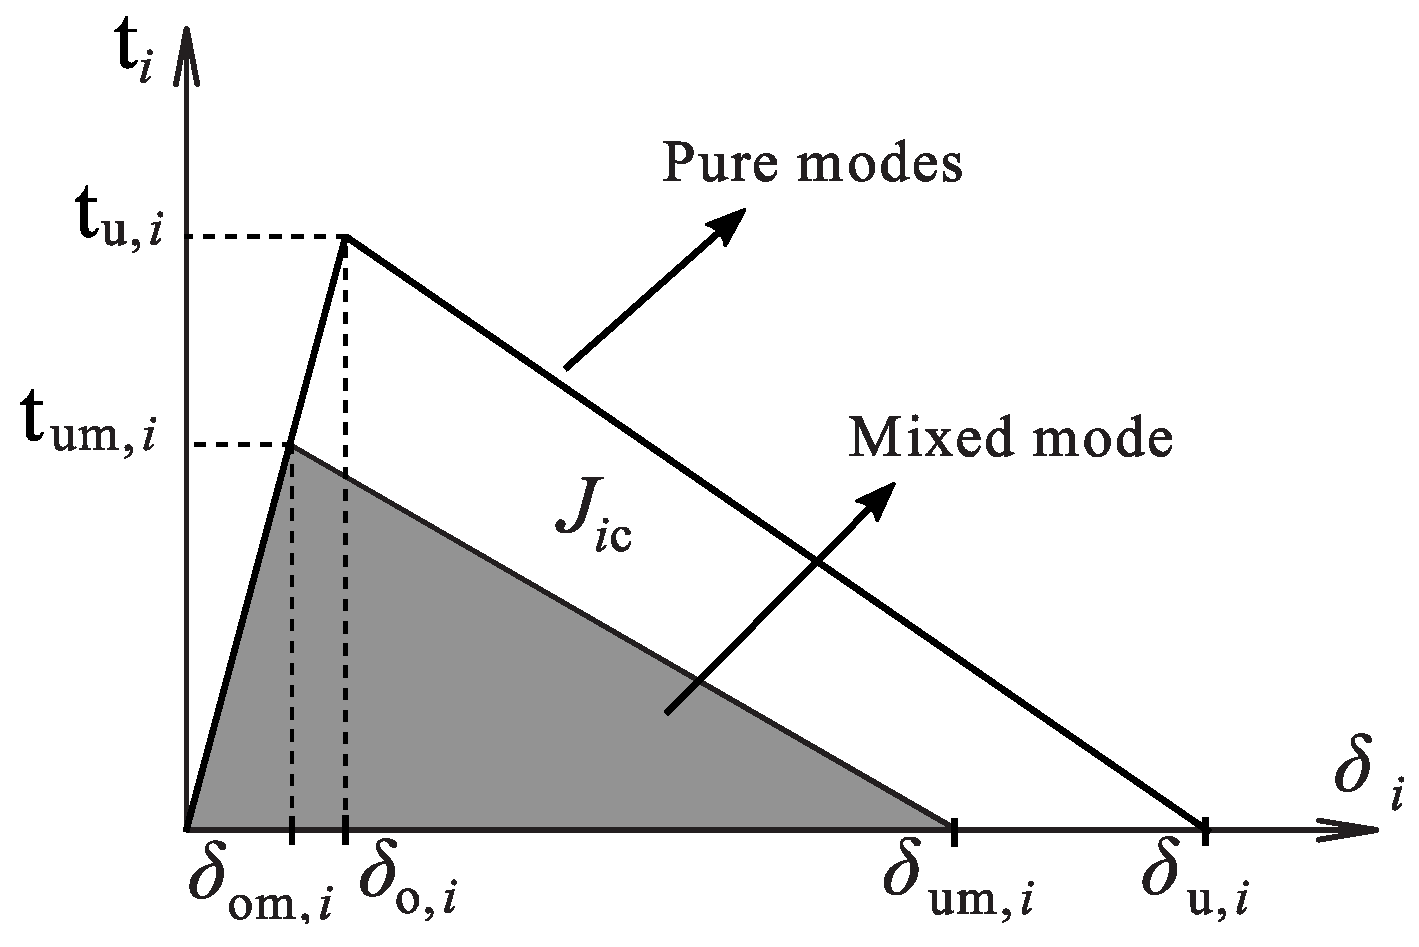
| E [GPa] | ν [–] | tu,I [MPa] | tu,II [MPa] | JIC [N/mm] | JIIC [N/mm] |
|---|---|---|---|---|---|
| 11.5 | 0.3 | 30 | 18 | 0.35 | 1.1 |
| Crack Length | CT Specimen | CT Specimen + CFRP Patch | |||
|---|---|---|---|---|---|
| K [MPa*m0.5] | Dif. (%) | K [MPa*m0.5] | Dif. (%) | ||
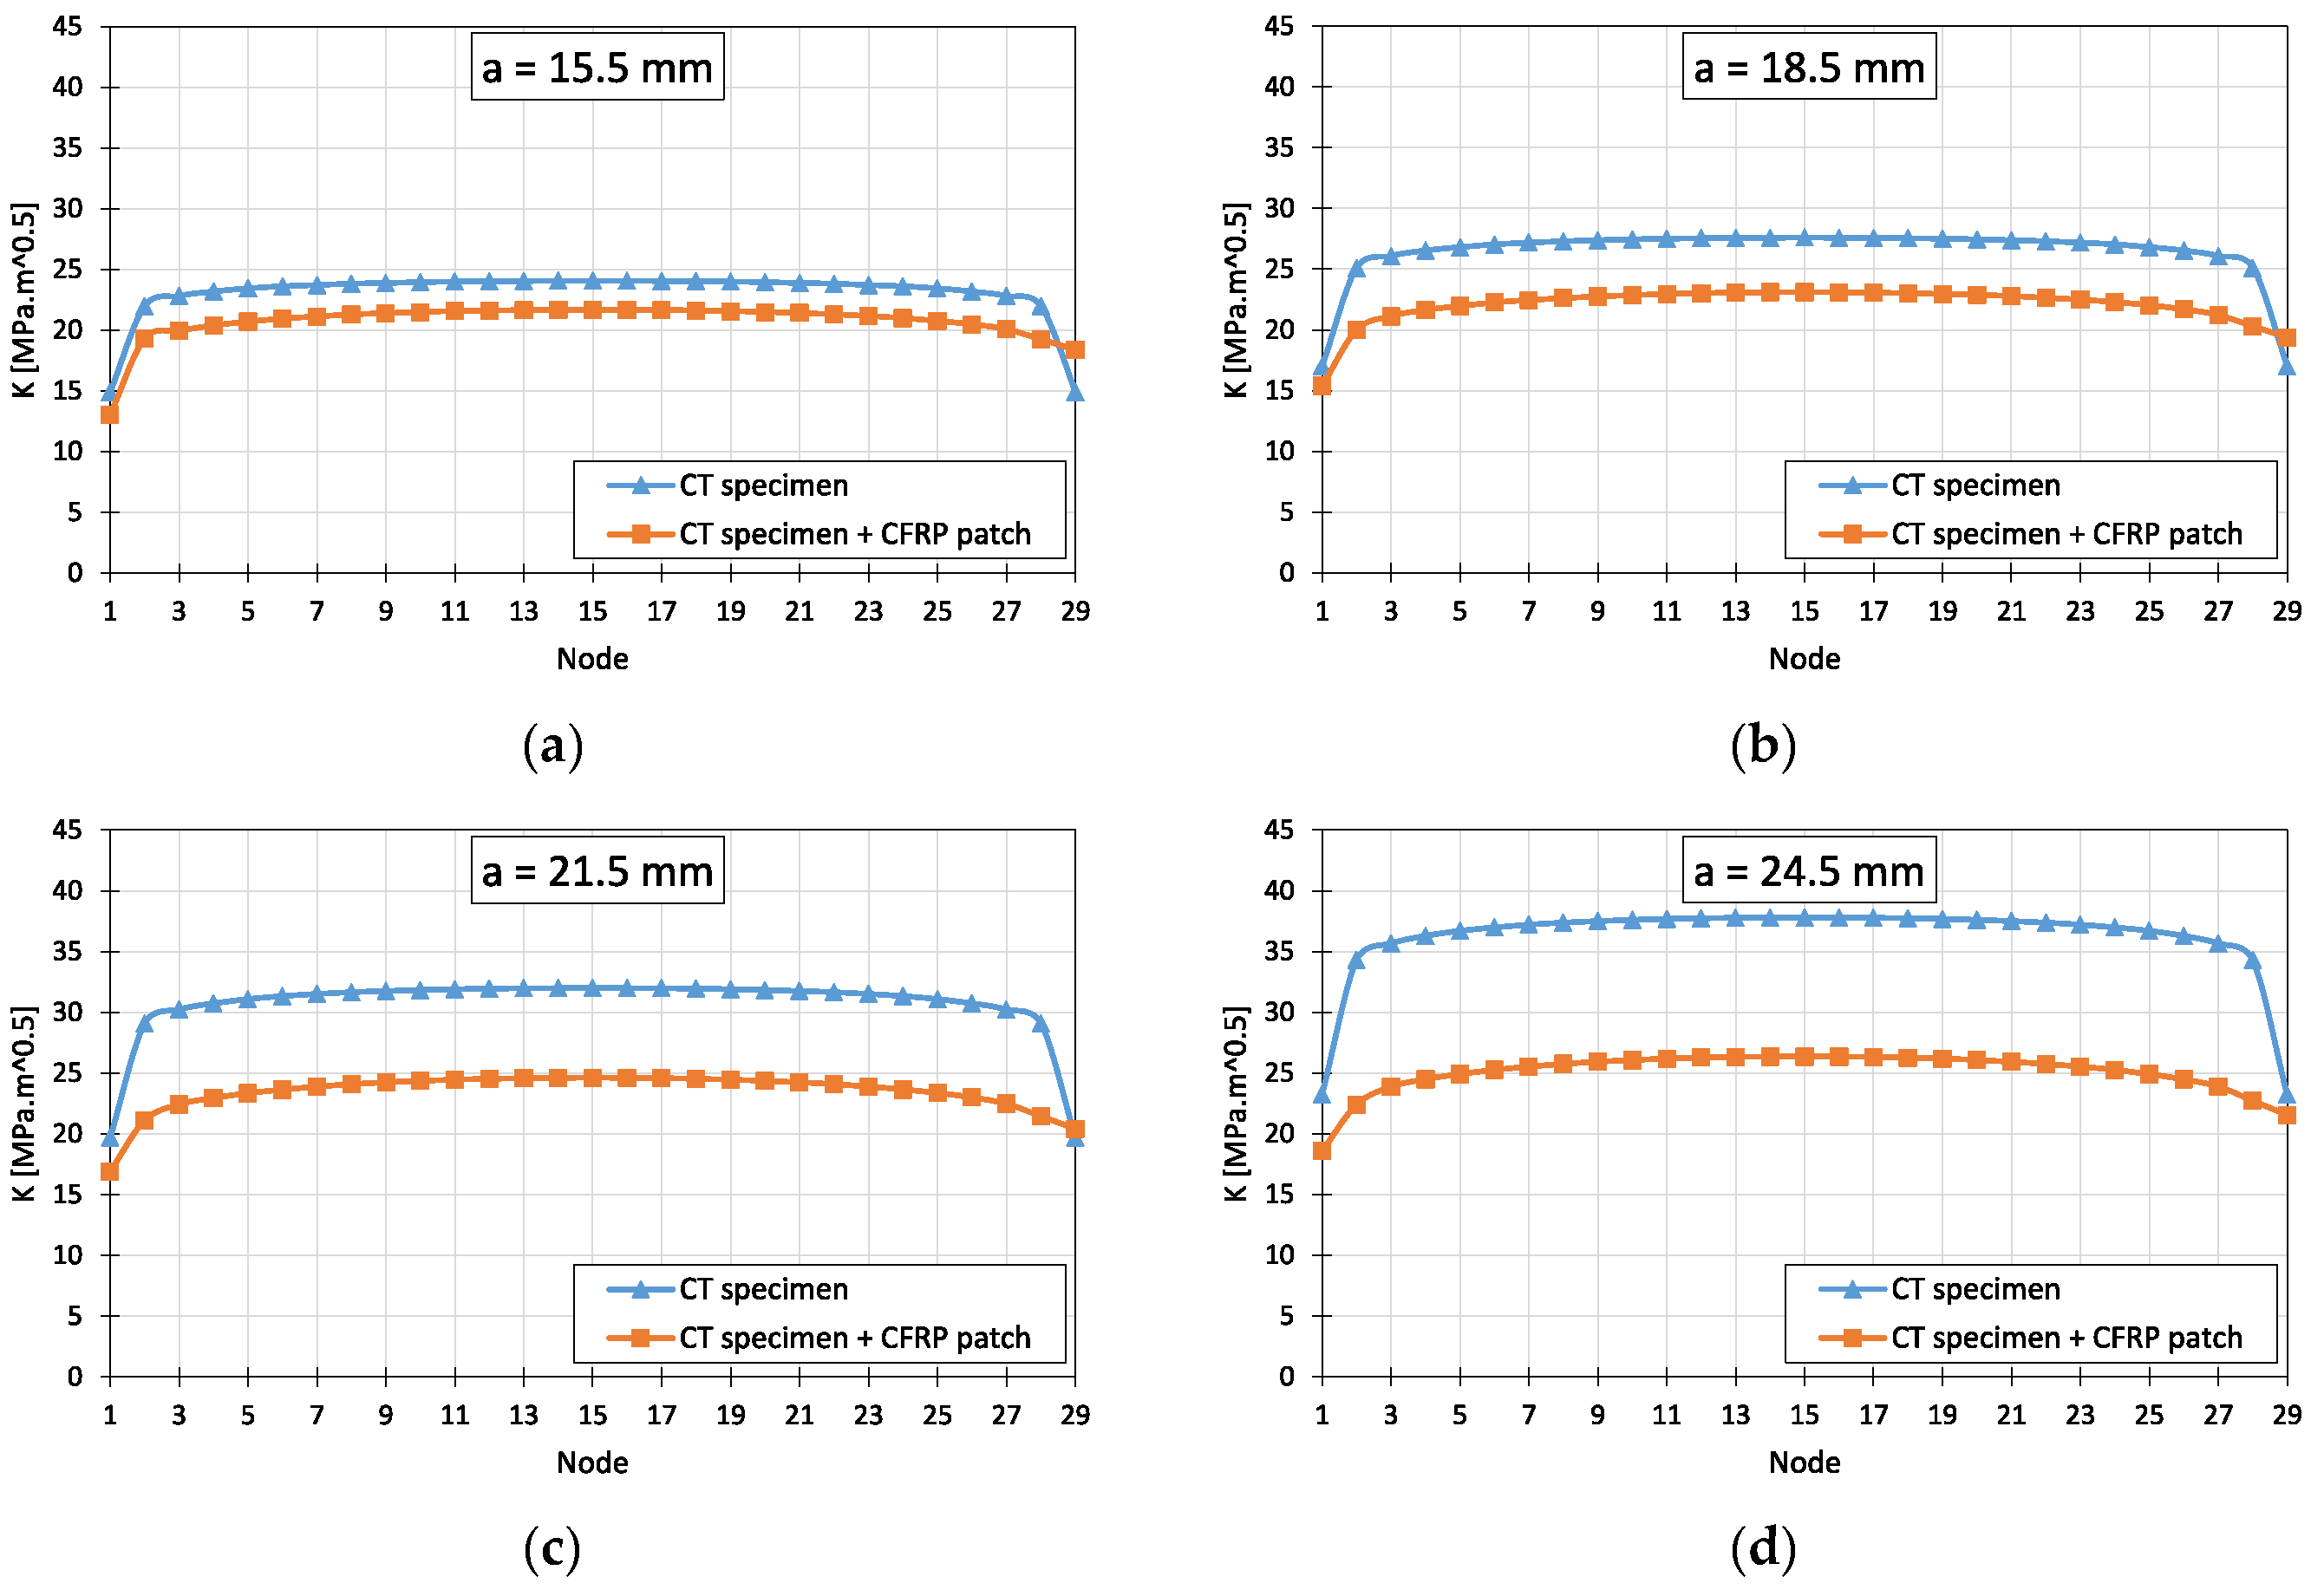
| a [mm] | Analytical | Numerical VCCT | Numerical VCCT | ||
| 15.5 | 22.8 | 23.0 | 0.9% | 20.7 | 9.0% |
| 18.5 | 26.6 | 26.3 | 0.9% | 22.0 | 17.1% |
| 21.5 | 31.1 | 30.5 | 2.1% | 23.4 | 24.8% |
| 24.5 | 37.0 | 36.0 | 2.7% | 25.0 | 32.3% |
© 2020 by the authors. Licensee MDPI, Basel, Switzerland. This article is an open access article distributed under the terms and conditions of the Creative Commons Attribution (CC BY) license (http://creativecommons.org/licenses/by/4.0/).
Share and Cite
Lesiuk, G.; Pedrosa, B.A.S.; Zięty, A.; Błażejewski, W.; Correia, J.A.F.O.; De Jesus, A.M.P.; Fragassa, C. Minimal Invasive Diagnostic Capabilities and Effectiveness of CFRP-Patches Repairs in Long-Term Operated Metals. Metals 2020, 10, 984. https://doi.org/10.3390/met10070984
Lesiuk G, Pedrosa BAS, Zięty A, Błażejewski W, Correia JAFO, De Jesus AMP, Fragassa C. Minimal Invasive Diagnostic Capabilities and Effectiveness of CFRP-Patches Repairs in Long-Term Operated Metals. Metals. 2020; 10(7):984. https://doi.org/10.3390/met10070984
Chicago/Turabian StyleLesiuk, Grzegorz, Bruno A. S. Pedrosa, Anna Zięty, Wojciech Błażejewski, Jose A. F. O. Correia, Abilio M. P. De Jesus, and Cristiano Fragassa. 2020. "Minimal Invasive Diagnostic Capabilities and Effectiveness of CFRP-Patches Repairs in Long-Term Operated Metals" Metals 10, no. 7: 984. https://doi.org/10.3390/met10070984
APA StyleLesiuk, G., Pedrosa, B. A. S., Zięty, A., Błażejewski, W., Correia, J. A. F. O., De Jesus, A. M. P., & Fragassa, C. (2020). Minimal Invasive Diagnostic Capabilities and Effectiveness of CFRP-Patches Repairs in Long-Term Operated Metals. Metals, 10(7), 984. https://doi.org/10.3390/met10070984