Abstract
For long-serviced pressure equipment that is under severe working conditions such as a high temperature, high pressure, and corrosion, the material properties and structure will be unavoidably damaged or degraded, especially cracks and other damages at key positions such as welded joints, which seriously threaten the safe operation of the equipment. In order to promote the sustainable development of industries such as the chemical and petrochemical industries, remanufacturing technology has emerged worldwide, and various surface repair processes have also rapidly developed. As an important branch of surface repair technology, the high energy spark deposition (HESD) process is a new pulse cold welding repair technology developed from electro-spark deposition, which combines the advantages of multiple surface repair processes. The HESD process has the characteristics of a smaller heat affected zone and lower welding residual stress. It is a new type of repair method that is worthy of popularization and application. The process has been initially applied in the fields of surface modification and die steel repair. In this paper, the application of the HESD process to the repair of welded joints was introduced, the mechanical properties of the joints and the residual stress distribution after welding were analyzed, and the feasibility of HESD as a repair welding method for pressure structures was discussed. First, a numerical simulation of the temperature and stress field of HESD was proposed by using ABAQUS and the related subprograms, and the validity of the simulation results was verified by the residual stress test with the indentation strain method. Due to the precise control of the heat and pulse discharge working mode, the heat-affected zone and deformation caused by the HESD were extremely small, and the residual stress that was generated was low and only concentrated on the repair welding seam. Second, according to the numerical simulation and the test results of the mechanical properties of the welded joint, the optimal repair welding process parameters were obtained through the orthogonal experiment: peak current 45 A, pulse width 90 ms, and output voltage 10 V.
1. Introduction
In industrial production, numerous key parts of equipment are inevitably subjected to deformation, corrosion, fracture, wear, deterioration, and other damages under the long-term action of complex working conditions and the severe environment, such as the wear and scratch of rotor journals and turbine blades in service, hydrogen corrosion cracking of ethylene spherical tanks, etc. According to relevant statistics, more than 80% of equipment failures are caused by surface wear, corrosion, and fatigue [1]. For the damaged parts, the traditional replacement or retirement method causes a waste of resources, which no longer conforms to the current industrial development trend. In recent years, remanufacturing technology has developed rapidly and formed a relatively complete system. The remanufacturing technology has greatly saved the investment of enterprises and achieved the maximum output, providing new methods for the treatment of damaged parts [2].
At present, the repair of damaged equipment mainly uses traditional surfacing welding technology such as gas welding and arc welding. However, excessive welding heat input during the repair process is prone to producing large welding residual stress and deformations, and it causes a degradation of the material properties in the heat-affected zone. In some cases, the welding residual stress and the stress generated by the external load will cause the plastic deformation of the material and reduce the structural rigidity. In addition, when the superimposed stress is greater than the tensile strength, this will also lead to early structural damage. When there is tensile residual stress at the stress concentration, the fatigue strength of the structure will also decrease. The residual stress is also an important cause of stress corrosion cracking. However, residual stress can also play a positive role. For example, compressive residual stress is applied on the surface of materials to improve their fatigue properties. Cseh [3] studied the surface residual stress state evolution of hardened and shot peened 42CrMo4 steel during fatigue tests by X-ray diffraction. In addition, compressive residual stress can effectively inhibit stress corrosion cracking. Therefore, the welding residual stress has a significant impact on the structural integrity, the appropriate in-service evaluation of the welded joint, and the reliable operation of the equipment [4,5]. It is necessary to find more advanced repair processes to make up for the shortcomings of traditional welding methods.
The HESD repair welding process is improved by electro-spark deposition, which combines the characteristics of various surface processes and has the advantages of a low heat input, low welding residual stress, and excellent metallurgical adhesion with the substrate. HESD can be considered as a hybrid procedure combining welding, surfacing, and metallization by evaporation [6]. The power supply of the HESD process uses the insulated gate bipolar transistor (IGBT) switch controlled by pulse width modulation (PWM) to make the capacitor charge and discharge quickly and repeatedly, which releases a high-frequency short-time pulse current in order to melt the electrode material and cladding to the repaired workpiece within a very short time (as shown in Figure 1). The process of HESD is based on the phenomenon of electrical corrosion in a gaseous environment and on the transfer of the anode material to the cathode during the pulse discharge time [7].
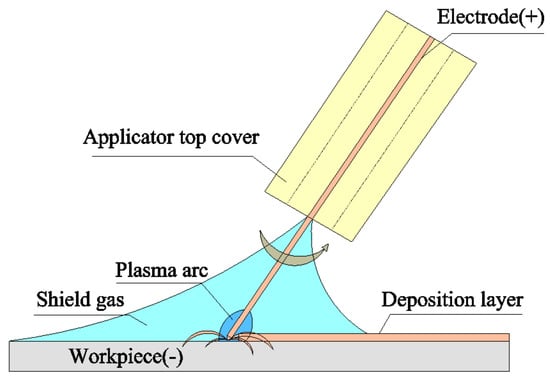
Figure 1.
Schematic of the HESD process.
Current research on the HESD process focuses mainly on the mass transfer, deposition process, interface characteristics between the coating and substrate, process parameters, and properties of deposition [8]. Yang [9] used a high-speed camera to analyze the droplet transfer characteristics during the HESD process, and found that the substrate and the repair welding layer showed a good metallurgical adhesion. Chen [10] analyzed the formation of single-pulse deposition points, proposed a physical model of “splash and gasification”, and verified the model through experiments. In addition, other scholars have studied the single deposition point in the HESD process, detailed the transfer rule of the welding material, and analyzed the distribution and morphology of the deposition point [11,12], which laid a theoretical foundation for subsequent research on HESD. Xie, Gould, and others applied HESD technology to the connection of dissimilar steels and difficult-to-weld metals, and achieved good results. Meng [13] analyzed the joints of ASTM1045 steel after HESD repair welding, and found that the joint hardness was 20% higher than that of the base metal. In addition, the joint friction coefficient was reduced by nearly 40% when compared with the base metal, which showed that the wear resistance of the joint was improved after HESD repair welding.
The HESD process involves many important parameters such as the pulse width, frequency, pulse current, and discharge voltage. In order to obtain better repair results, many scholars have discussed the relationship between the process parameters and repair performance. James summarized the main parameters in the process and briefly analyzes their respective effects, as shown in Table 1 [14]. Kondapalli analyzed the influence of the process parameters on the grain size and tensile strength of Inconel 625 nickel-based alloy joints, established a mathematical model to predict the grain size, and found that the peak current was the determining factor [15]. Chen [16] studied the influence of the output power and voltage on the deposition process, and found that an overly low power and voltage make it difficult to form a deposited layer, while an excessively high power and voltage affect the quality of the deposited layer, causing defects such as cracks and pores. This is consistent with the literature [17], which believes that excessive intermetallic phases caused by an excessive pulse energy can cause delayed cracking.

Table 1.
Process variables of high energy spark deposition.
During the HESD process, due to the concentrated discharge in space and time, high pulse frequency, small range of action, and complicated thermal cycle, it is difficult to analyze the HESD repair welding process by experimental methods. Therefore, it is necessary to use a numerical simulation to quantitatively analyze the HESD process. Huang [18] conducted a simulation of mold steel HESD repair and found the optimal parameter combination. They believed that the repair efficiency was proportional to the discharge current, discharge time, and energy distribution. Through the simulation, they found the deepest heat influence range during HESD welding to only be 2 mm. Kansal [19] established a two-dimensional finite element model of axisymmetric heat conduction. The model uses temperature-dependent material parameters while considering factors such as the energy distribution and phase change. Das Shuvra [20] simulated the instantaneous temperature distribution of the workpiece, liquid- and solid-state transition, and residual stress by changing the process parameters, and verified the simulation results through experiments.
Summarizing the existing literature, the HESD process has not yet been studied thoroughly, although it is used in practice. There are few publications that deal with HESD from a scientific point of view. Much of the literature studies HESD technology from the perspective of a surface-coating process, but there is very little research that focuses on the repair method for damaged welding joints or on the analysis of residual stress after repair welding. Therefore, it is necessary to systematically study the residual stress distribution of HESD repair welding and to discuss its feasibility, in the future, as a repair welding method for pressure structures.
2. Experiments and Simulation Method
2.1. HESD Welding and Testing
The welding sample was 07MnNiCrMoV low-alloy high-strength steel with a size of 250 mm × 200 mm × 10 mm, which is commonly used to manufacture ethylene spherical tanks. The chemical compositions of this steel are shown in Table 2. The coarse grain zone in the heat-affected zone of this kind of steel makes it easy for cold cracks to occur, and the toughness of the material is reduced. The properties of the steel at room temperature are shown in Table 3. First, shielded metal arc welding (SMAW) was used for the initial welding, followed by HESD repair welding in the heat-affected zone, where it was prone to cracking. The welding material was a J607RH ultra-low hydrogen electrode, which is a special electrode for 07MnNiCrMoV steel. The specific chemical composition is shown in Table 4. The HESD process used the JYPSD-2 developed by the Chinese Academy of Sciences (Shenyang, China). The specific parameters and performance indicators are shown in Table 5. The main process parameters of HESD repair welding, including the pulse current, pulse width, and voltage, can be displayed and manually adjusted. The welding machine is mainly composed of three parts: the pulse digital control power source, wire and shielding gas, and handheld torch. The brief working principle of the machine is roughly as follows. First, the internal rectifier of the power source filters the input voltage. Second, the internal energy storage capacitor is charged. Finally, the capacitor releases a high-energy short-term pulse current to melt the welding wire in order to complete the welding, as shown in Figure 2. The appearance of a weld beam after the HESD repair welding is shown in Figure 3 and residual stress testing shown as Figure 4.
Table 2.
Chemical compositions of 07MnNiCrMoV steel (wt. %).
Table 3.
Mechanical properties of experimental steel.
Table 4.
Chemical composition of the J607RH electrode (wt. %).
Table 5.
Parameters and indicators of the JYPSD-2 welding machine.
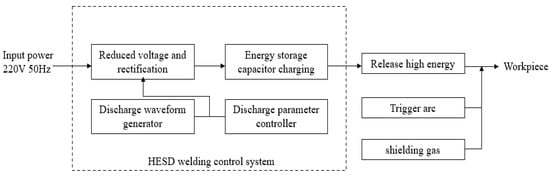
Figure 2.
Schematic of the JYPSD-2 HESD welding machine working principle.
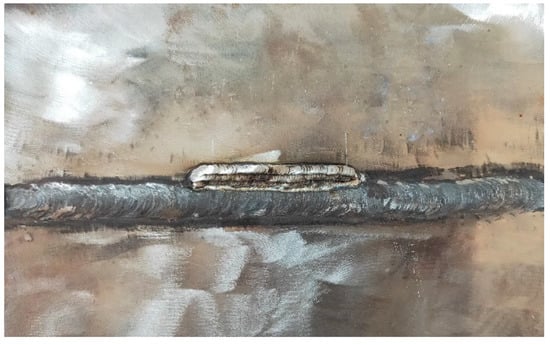
Figure 3.
Sample morphology.
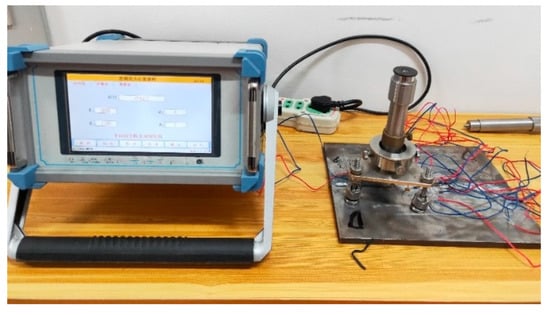
Figure 4.
Residual stress testing.
In this paper, the indentation strain method [21] was used to measure the residual stress. This method’s principle is briefly described as follows. When the indenter of the equipment produces an indentation on the metal surface under impact, the material rheology caused by the indentation leads to the workpiece surface’s relaxation and deformation. The elastoplastic zone generated by the indentation and the surrounding strain field change due to the influence of the residual stress. The amount of strain change generated by the superposition of the two deformation behaviors mentioned above is called the superimposed strain increment. The method for calculating residual stress by the strain increment induced by ball indentation is called the indentation strain method.
The resistance strain gauge is used as the sensitive element for measurement. The strain gauge records the strain increment caused by the indentation. A certain size indentation was made on the strain gauge by mechanical load, and the strain increment was recorded via strain recorder equipment. The residual strain was calculated by using the relationship between the elastic strain and strain increment obtained from a previous calibration, and the residual stress could be calculated by Hooke’s law. There is a definite polynomial relationship between the strain increment generated by indentation in the residual stress field and the elastic strain, as shown in the following formula:
where strain increment;
elastic strain;
B strain increment under zero stress;
A1, A2, A3 constants obtained from the calibration curve.
In order to verify the validity of the simulation method, a few measuring points were selected on the surface of the workpiece. The residual stress test points before and after HESD welding are shown in Figure 5 and Figure 6, respectively. The residual stress measurement was implemented by the KJS-3 indentation method stress test system (Developed by Institute of metals, Chinese Academy of Sciences, Shenyang, China). The device mainly includes two parts: a stress tester and an indentation manufacturing part. The latter consists of a centering microscope (used for centering in order to determine the impact point), a triangular fixed base (for positioning and fixing), and a hammer (manufacturing indentation), as shown in Figure 4.
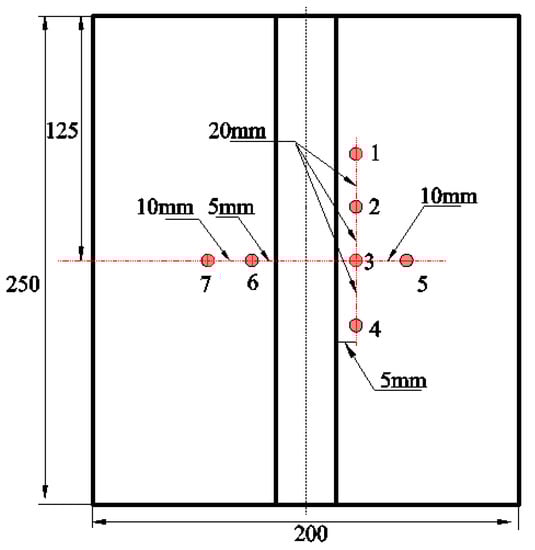
Figure 5.
Test points after the initial welding.
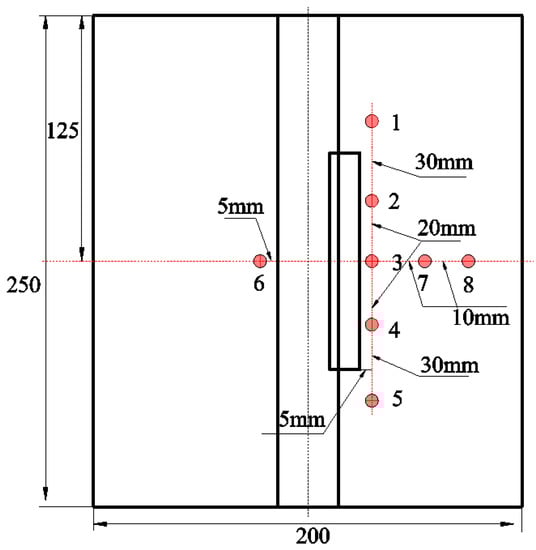
Figure 6.
Test points after the HESD welding.
The HESD welding sampling position of the mechanical property test specimen is shown in Figure 7. The tensile and fracture property tests include 11 groups of experiments, nine of which are joint specimens (No. A~I) repaired with different HESD process parameters, while one group consists of joint samples without repair welding and one group consists of base metal. Figure 8 and Figure 9 show the size of the tensile and fracture toughness test specimens, respectively. From Equation (2), KIC is calculated according to JIC, which was in turn measured in an experiment in [22].
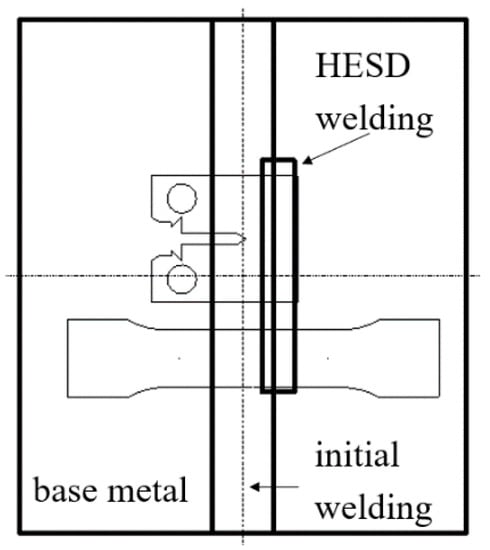
Figure 7.
Specimen sampling position.
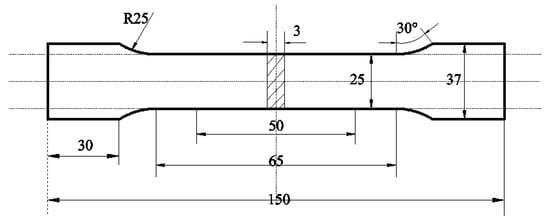
Figure 8.
Size of the tensile test specimens.
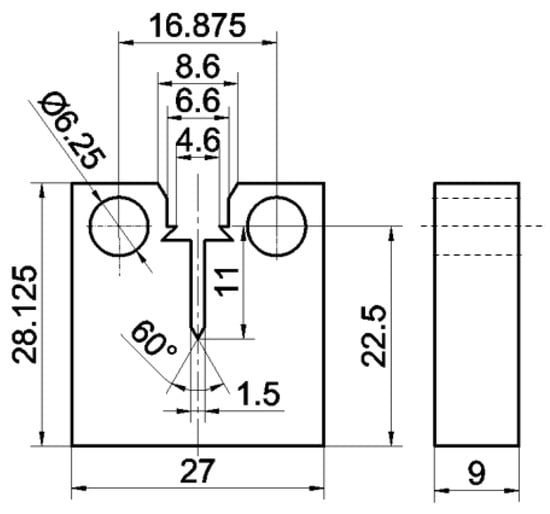
Figure 9.
Size of the fracture toughness test specimens.
2.2. Numerical Simulation
2.2.1. Geometric Model
In this paper, the ABAQUS software and its own subroutine DFLUX, FILM (ABAQUS 6.14-5, Dassault SIMULIA company, Providence County, RI, USA) was utilized to simulate the initial welding and HESD repair welding. The simulation used a three-dimensional model. The temperature changes at the weld- and heat-affected zone were large, and the stress state was also complicated. Therefore, the mesh should have been fine in this region. The base material that was farther away from the weld was less affected by the welding, and the mesh could be properly roughened. Therefore, considering the time and accuracy of the calculation, a 2:1 transition mesh was adopted. The size of the model was 250 mm × 200 mm × 10 mm, which contains 89,580 elements and 98,714 nodes. The three-dimensional model is shown in Figure 10.
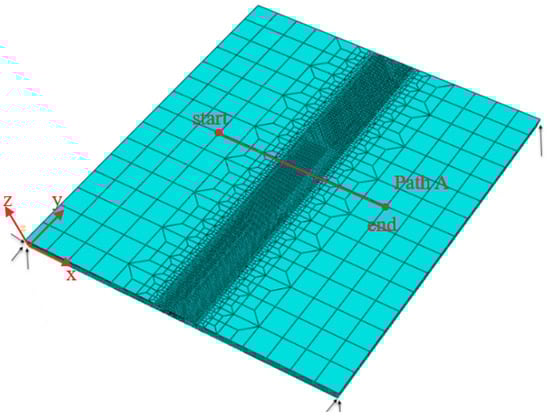
Figure 10.
Three-dimensional model.
In this simulation, the following assumptions were made: the weld material was the same as the base material (the composition of the electrode material is similar to that of the base metal and matches highly with the base metal), the chemical reaction and phase change during the welding process were ignored and only the fusion latent heat of the material was considered, and the initial temperature was equal to the room temperature. In addition, temperature-dependent thermal-physical material properties were used in the simulation shown as Figure 11. The sequential coupling method was used to calculate the residual stress. First, the welding temperature field was calculated, and the welding temperature field was introduced into the stress field calculation as a predefined field. The process of filling the welding seam was simulated by the method of birth-and-death element. The HESD repair weld bead is the product of several over-lapping spot welds and complex and rapid thermal cycling during welding. This complexity implied that the simulation required a large number of small-time increments and a longer analysis time. In addition, the HESD process simulation needed to set a small initial increment and more iterations.
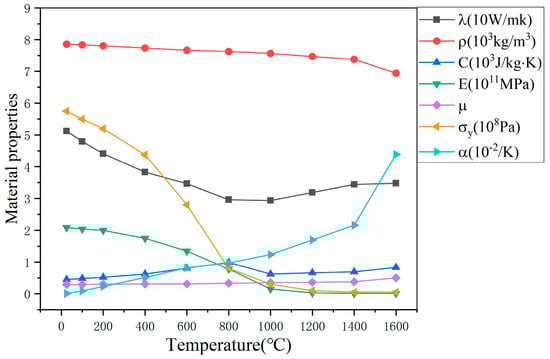
Figure 11.
The temperature-dependent thermal-physical material properties of 07MnNiCrMoV, data from [23].
2.2.2. Heat Source Definition and Boundary Conditions
The heat transfer during the welding process followed Fourier’s law, and the heat conduction differential equation was obtained according to the law of conservation of energy:
where R: heat flux density (W/m2),
: density (kg/m3),
: specific heat capacity (J/(kgk)),
T: temperature field distribution function (k),
: thermal conductivity (W/mk), which is related to the type of material and temperature,
Q: intensity of the internal heat source (W), including the heat of the welding heat source and the heat generated by the phase change.
The initial welding used a double ellipsoid heat source, and the HESD repair welding used an improved Gaussian heat source. The welding heat source code was written in FORTRAN language and applied through the DFLUX subroutine. The double ellipsoid heat source was divided into the front part and the rear part, the specific form being as follows:
where is the effective heat input, ff and fr are the front and rear end heat source distribution coefficients, respectively, and ff + fr = 2. a1, a2, b, c are the heat source shape parameters.
The Gaussian heat source used for the repair welding was [24]:
where is the thermal efficiency coefficient, R is the radius of the discharge channel, and U and I are the discharge voltage and peak current, respectively. According to research by Ikai [25] and others, the discharge radius R is calculated as follows:
where Ip is the peak current, and t is the pulse on time.
Since the work mode of HESD repair welding is an intermittent pulse discharge, it was necessary to use the MOD function to judge whether to discharge according to the pulse width and cycle parameters when writing the HESD welding heat source subroutine, in order to judge whether to apply a heat source. The boundary conditions when calculating the temperature field are shown in Figure 12. The convection heat transfer coefficient was calculated according to the following formula, and the calculation was imported through the FILM subroutine:
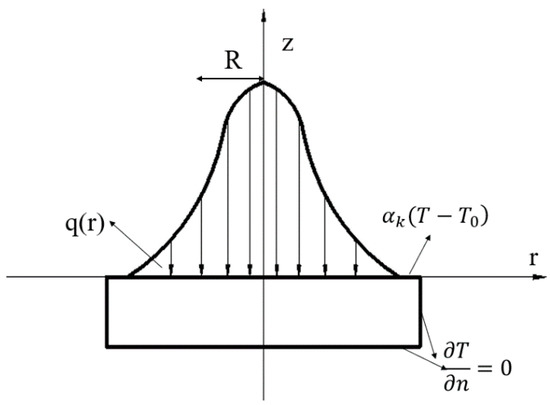
Figure 12.
Thermal boundary conditions for repair welding.
The above situation involves three boundary conditions: the known heat flux density distribution, known temperature value on the boundary, and known heat exchange with the surroundings.
In the stress field calculation, in order to limit the rigid displacement of the specimen, the displacements in three directions, two directions, and one direction were restricted at the three vertices, as shown in Figure 10. Table 6 and Table 7 are the parameters of the double ellipsoid heat source and Gaussian heat source used in the simulation, respectively.
Table 6.
Parameter values of the double ellipsoid heat source.
Table 7.
Parameter values of the Gaussian heat source.
3. Results and Discussion
3.1. Thermal Analysis
The heat source shape of the initial welding and HESD repair welding is shown in Figure 13. Compared with the initial welding, the heat source of HESD was concentrated, and the center temperature was higher. On the other hand, during the HESD process, the heat transferred uniformly in directions, and the shape of the heat source had no obvious “tail”, tending to be a circle.
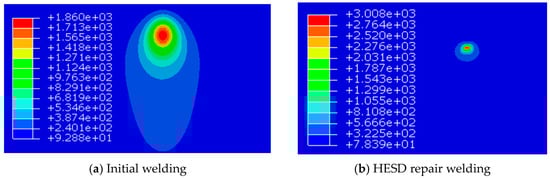
Figure 13.
Heat source morphology of the initial welding and HESD repair welding.
Figure 14 shows the temperature difference in the transverse direction (x direction) and depth direction (z direction) near the heat source during the initial welding and HESD repair welding (starting from the heat source center). The temperature gradient near the initial welding heat source was small, the heat propagated faster along the transverse direction, and the heat influence range was large. The heat source of the HESD repair welding was concentrated, the temperature gradient near the heat source was large, and the heat was evenly spread in two directions. The temperature difference between the depth direction and the transverse direction was not significant, and only the temperature near the heat source was higher.
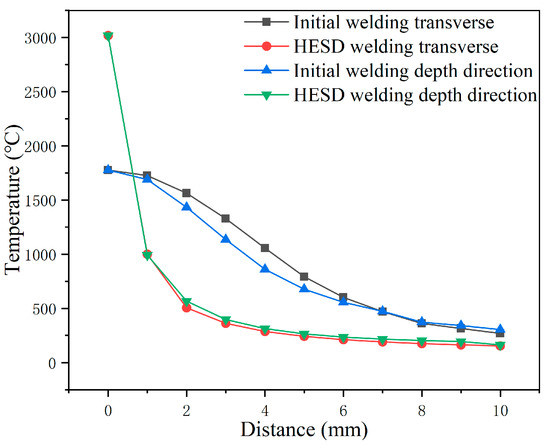
Figure 14.
Temperature curves in the transverse and depth directions.
To analyze the difference in the temperature field between HESD and conventional arc welding, five analysis points were taken in the direction of the initial welding seam and repair welding seam. The temperature history curves of the two welding methods were drawn, as shown in Figure 15 and Figure 16. Comparing these two figures, one can clearly see that the high temperature time of analysis point in the initial welding process was longer, and that the cooling process was slower, especially in the middle and low temperature stages. The high temperature time of analysis points in the HESD repair welding was extremely short, and the heating and cooling speed was extremely fast. The whole process from heating to cooling to room temperature could be completed within ten seconds. This is mainly due to the precise control of the heat input and pulse discharge characteristics of the HESD repair welding process. The heating time in a single cycle was much shorter than the cooling time, so the heat had enough time to dissipate and to not accumulate on the workpiece. Figure 16 also shows the extremely fast cooling rate of the HESD repair welding. The characteristics of rapid heating and rapid cooling effectively prevented the growth of austenite grains and the formation of brittle transitions in the welded joint, thereby preventing the performance and the service life of the welded structure from being affected.
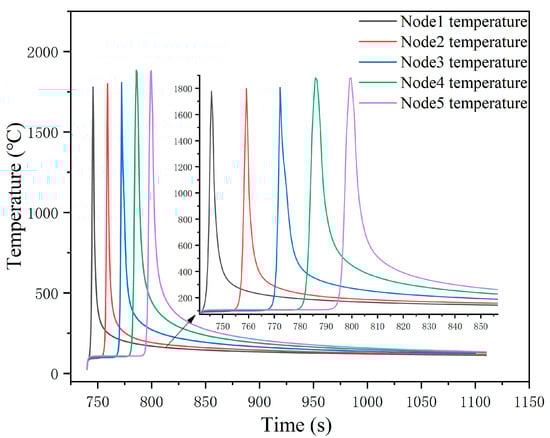
Figure 15.
Initial welding temperature history.
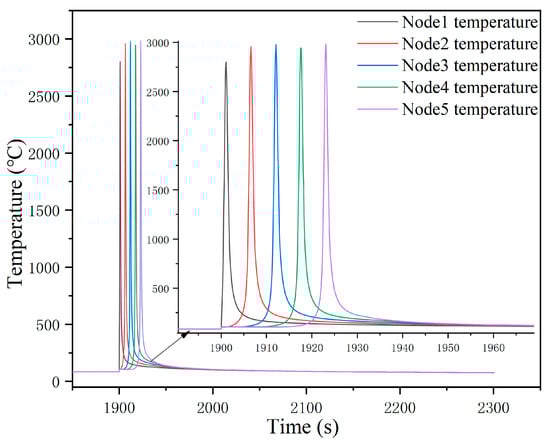
Figure 16.
HESD repair welding temperature history.
3.2. Residual Stress Analysis
First, in order to verify the correctness of the proposed numerical simulation method, a few test points taken on the surface of the workpiece and the residual stress obtained by the simulation were compared with the value measured via the experiment. Figure 17 shows the comparison between the measured and simulated residual stresses after the initial welding and HESD repair welding, respectively. The results showed that the measured and simulated results were similar in terms of the overall trend and that the data were highly consistent. The method proposed in this paper can accurately simulate the HESD repair welding process.
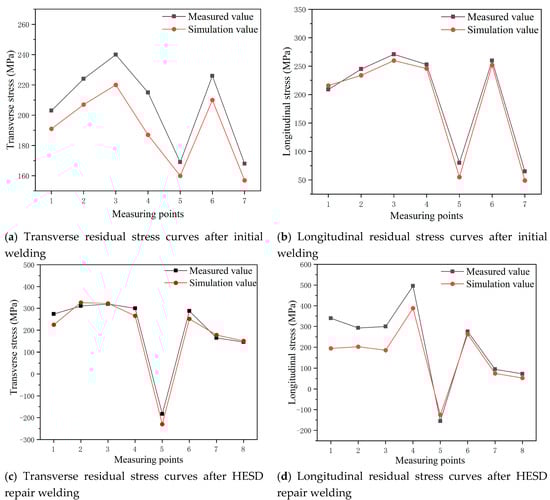
Figure 17.
Comparison between the measured value and simulated value.
Figure 18 shows the contour of the Von Mises stress field after the initial welding and HESD repair welding. The high stress of the HESD repair welding seam only existed on the surface. This is because the subsequent weld bead heated up or even re-melted the previous weld bead during repair, and the residual stress of the previous welding was released to a certain extent. In addition, due to the heat effect of the HESD repair welding, the Von Mises stress in the initial welding seam decreased by nearly 100 MPa. The high stress after repair was mainly concentrated on the HESD welding seam and the initial welding seam, far away from the repair welding area.
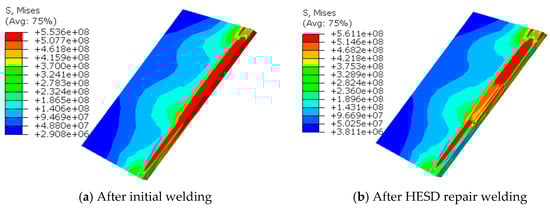
Figure 18.
Stress contour after the initial welding and HESD repair welding.
The results in Figure 17 show that the measured residual stress values before and after the HESD repair welding were in good agreement with the simulated values, which indicated the correctness of the numerical simulation method. Therefore, the change of residual stress after the HESD repair welding could be analyzed quantitatively according to the numerical simulation results, and the change curve of the node stress along path A (perpendicular to the direction of the weld) could be drawn. In the Figure 19 the initial welding seam is located between the black dotted lines, and the HESD welding seam is located between the red dotted lines.
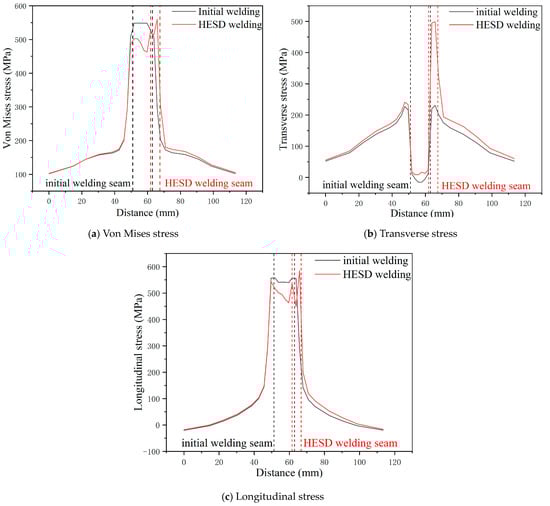
Figure 19.
Stress distribution before and after the HESD repair welding along path A.
As shown in Figure 19, the stress changes before and after the repair welding were mainly concentrated in the initial weld seam and repair weld seam. Due to the influence of the HESD repair welding, the stress in some areas of the initial weld changed. Von Mises stress decreased by nearly 16%, longitudinal stress (y direction) decreased by 11%, and transverse stress increased slightly from compressive stress to tensile stress. This was mainly due to the different simultaneous effects of the transverse shrinkage of the repair weld and the nearby plastic deformation zone, as well as the longitudinal shrinkage of the repair weld and the nearby plastic deformation zone. After the repair welding, the high stress area was transferred to the repair weld area. One can see that the distribution of residual stress outside the weld area was basically the same, which shows that the HESD repair welding process has the characteristic of a smaller heat-affected zone. This is mainly due to the precise control of the heat input during the HESD repair welding process. Because the heat input was small, the heat had enough time to dissipate during the pulse interval, and the heat would not accumulate on the workpiece, the effect on the base metal was slight.
3.3. Process Optimization
In order to find the optimal HESD repair welding process, the fracture toughness, yield to ultimate strength ratio (), and maximum transverse residual stress value in the repair welding seam were taken as the indexes, while the peak current, voltage, and pulse width of the HESD process were taken as the influencing factors. The orthogonal test analysis of three levels and three factors was carried out. Table 8 shows the orthogonal test schedule. The tensile properties and fracture toughness of nine groups of repair welded joints with different processes were tested, as shown in Figure 20, where Q represents the initial welding joint and M represents the base metal.
Table 8.
Orthogonal test scheme arrangement of the HESD repair welding.
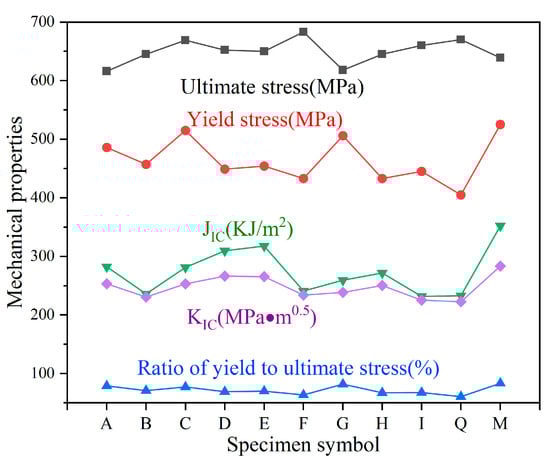
Figure 20.
Mechanical properties of the welding joints with different process parameters.
Compared with the initial welding, the yield strength of the welded joint after repair welding increased by 6.9~27.16%, and increased by 4.88~35.45%. After the HESD repair welding, the toughness of the joint was improved. The ultimate strength after repair welding was slightly lower than that of the initial welding, and only that of the F sample after repair welding exceeded that of the initial welding joint. The fracture toughness of the initial welding joint was 222.6 MPa, the lowest was 225.2 MPa, and the highest was 266.39 MPa. After the HESD repair welding, the fracture toughness increased by 1.18–19.67%. The test results of the mechanical properties of the welded joints showed that the HESD welding parameters had a great influence on the mechanical properties of the welded joints and that the ideal properties of the welded joints could be obtained via the appropriate parameter; meanwhile, the improper welding parameters might increase the possibility of cracks, pores, and other defects in the repaired welds, thus reducing the bonding strength and performance of the repaired welds.
To analyze the reason for the mechanical properties’ change after the repair welding, a metallographic test and fracture scanning electron microscopy were carried out on the joint samples. Figure 21 shows the fracture SEM (scanning electron microscope) images of the compact tensile specimen (No. F) after the test. Figure 21d shows the fracture surface of the compact tensile specimen. The SEM images of the fracture are shown at three positions, from farthest to nearest to the repair weld area along the direction shown in Figure 21d.
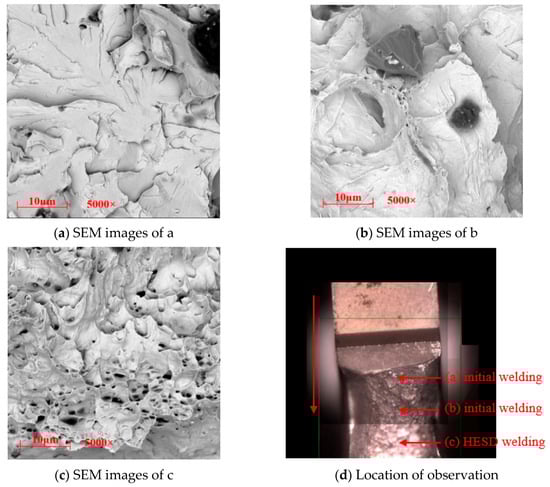
Figure 21.
SEM images of the compact tensile specimen fracture.
As shown in Figure 21a, the fracture at the initial weld shows a typical cleavage river pattern. This area is characterized by a brittle fracture. When decreasing the distance to the repair weld, the fracture in Figure 21b is still dominated by a cleavage fracture, but a small quantity of dimples begins to appear in the core. This indicates that the fracture properties of this part of the material have been slightly improved. Figure 21c shows the fracture of the repair welding seam, and it can be clearly seen that there are many dimples in this area. Each dimple contains a second phase particle or inclusion particle. This indicates that the fracture properties of the materials near the HESD repair welding area have been significantly improved and that the fracture characteristics have changed from a brittle fracture to a ductile fracture. The following images show the metallographic diagram of the area near the initial welding and the HESD repair welding of sample F.
Figure 22 shows the metallographic diagram of the initial weld region. The main microstructure is proeutectoid ferrite (PF), which is distributed along the grain boundary, and acicular ferrite (AF) in the grain.
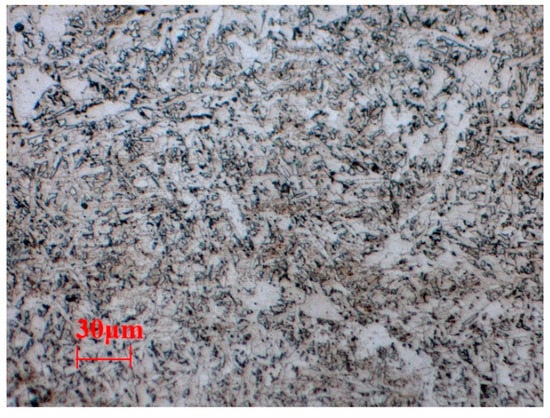
Figure 22.
Initial welding.
Figure 23 shows the metallographic structure of the HESD repair welding area. The microstructure is dominated by grid-like ferrite that is precipitated along the austenite grain boundary, and there is a little martensite. The grain size is finer and more uniform, which is approximately equiaxed. This is probably because the HESD repair welding process has an extremely high cooling rate, which will inhibit the growth of grains, thereby refining the grains in this area, and the mechanical properties of the joints after the HESD repair welding have, to a certain extent, been improved accordingly. Through the above microstructure analysis and the previous mechanical properties test, one can see that the HESD repair welding improved mechanical properties like the plasticity and toughness of the welded joint, perhaps as a result of the very rapid and repeated heat input during the HESD repair welding, which played a role in the heat treatment of the adjacent areas.
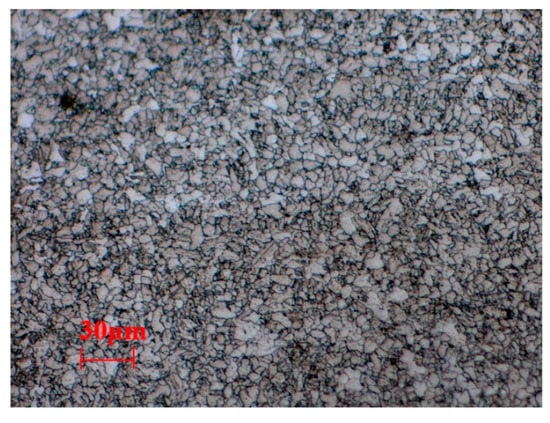
Figure 23.
HESD repair welding.
In order to obtain the optimal comprehensive performance of the repair welding joint, the comprehensive score Si was calculated via the weighted scoring method, according to the maximum absolute value of transverse stress (transverse stress being positive when compressive and negative when tensile), , and the fracture toughness, as the final index of the orthogonal test analysis. Si is calculated according to Equation (11):
where is the coefficient of test i, index j; is the value of test i, index j, with i = 9, j = 3 in this section. Assuming the total score is 100, the full score of the maximum transverse stress is 30, the full score of is 30, and the full score of the fracture toughness is 40. is calculated according to the formula = full score/Ki, where Ki is the change range of each index. The final orthogonal experiment analysis result is shown in Table 9.
Table 9.
Comprehensive score orthogonal experiment analysis table.
One can see from the range analysis that the influence degree of the HESD repair welding process parameters on the mechanical properties of the repair welding joint is: voltage > pulse width > peak current, and that the optimal combination of repair welding process parameters is: peak current 45 A, pulse width 90 ms, voltage 10 V.
4. Conclusions
In this paper, a new repair welding method via HESD technology was systematically analyzed via experimental and numerical simulation. The feasibility of applying this technology to the repair of pressure structures was discussed from the viewpoint of the welding residual stress distribution, mechanical properties of the repair welding joint, etc. The optimal combination of repair welding process parameters was obtained via an orthogonal experiment. The main conclusions are as follows:
(1) One can see from the numerical simulation that the heat source of HESD was concentrated, the temperature gradient near the heat source was large, the cooling speed was extremely fast, the heat-affected zone was extremely small, and the heat transfer was relatively uniform. After the HESD repair welding, the high stress only existed in the repair welding seam. In addition, because of HESD, the high stress of the initial welding was relieved, and the Von Mises stress was reduced by 16%. HESD had a slight effect on the base metal, and the thermal deformation and residual stress were greatly reduced when compared with conventional welding.
(2) Compared with the initial welded joint, the ultimate strength of the joints decreased by 8.06% and increased by 1.9% after the repair welding with different welding process parameters, while the yield strength increased by 6.9~27.16%. The fracture toughness of the HESD repair welding joints increased by 1.18–19.67%. HESD repair welding can improve the mechanical properties of the joints to a certain extent.
(3) The order of importance of HESD repair welding process parameters for the comprehensive performance of the repair welding joint is: voltage > pulse width > peak current, while the optimal process combination is: peak current 45 A, pulse width 90 ms, output voltage 10 V.
(4) The ideal performance for a repair welding joint can be obtained by choosing the appropriate parameters for the repair welding process. HESD technology can be utilized as an effective method to repair pressure structures.
Author Contributions
Y.Z. is mainly on the methodology, validation, formal analysis, writing-original draft preparation, investigation, writing-review & editing. K.Y. is mainly on software, writing-review & editing. J.Z. is mainly on writing-review & editing, visualization, supervision, funding acquisition. All authors have read and agreed to the published version of the manuscript.
Funding
National Key Research and Development Program of China (2016YFC0801905).
Acknowledgments
The authors wish to acknowledge Yong Jiang for his help in SEM observation. Funding from National Key Research and Development Program of China is gratefully acknowledged.
Conflicts of Interest
The authors declare no conflict interest.
References
- Xu, B.S.; Zhu, S.H. Theory and Technology of Surfacing Engineering; National Defense Industry Press: Beijing, China, 2010; ISBN 978-711-806-824-5. (In Chinese) [Google Scholar]
- Koehler, H.; Partes, K.; Seefeld, T. Laser reconditioning of crankshafts: From lab to application. Phys. Procedia 2010, 5, 387–397. [Google Scholar] [CrossRef]
- Cesh, D.; Mertinger, V.; Lukacs, J. Residual Stress Behavior in Hardened Shot Peened 42CrMo4 Specimens during Fatigue Load. Mater. Res. Proc. 2017, 2, 491–496. [Google Scholar]
- Nasir, N.S.M.; Razab, M.K.A.A. Review on welding residual stress. ARPN J. Eng. Appl. Sci. 2016, 11, 6168–6175. [Google Scholar]
- Dong, P.; Brust, F.W. Welding Residual Stresses and Effects on Fracture in Pressure Vessel and Piping Components: A Millennium Review and Beyond. J. Press. Vessel Technol. 2000, 122, 329–338. [Google Scholar] [CrossRef]
- Tušek, J.; Kosec, L.; Lešnjak, A.; Muhič, T. Electrospark deposition for die repair. Metalurgija 2012, 51, 17–20. [Google Scholar]
- Gpuld, J. Application of Electro-spark Deposition as a Joining Technology. Weld. J. 2011, 90, 191–197. [Google Scholar]
- Xie, Y.J.; Wang, M.C. Micro structural morphology of electrospark deposition layer of a high gamma prime superalloy. Surf. Coat. Technol. 2006, 201, 691–698. [Google Scholar] [CrossRef]
- Yang, J.W.; Teng, J.X.; Zhang, X.H. Droplet transfer analysis of intermittent pulsed arc welding used to repair the metal defects. Adv. Mater. Res. 2014, 915–916, 1078–1081. [Google Scholar] [CrossRef]
- Chen, C.J.; Wang, M.C.; Liu, Y.M. Mass transfer trends and the formation of a single deposition spot during high energy micro arc alloying of AZ31 Mg alloy. J. Mater. Process. Technol. 2008, 198, 275–280. [Google Scholar]
- Liu, J.; Wang, R.J. The formation of a single-pulse electrospark deposition spot. Surf. Coat. Technol. 2005, 200, 2433–2437. [Google Scholar] [CrossRef]
- Tang, S.K.; Nguyen, T.C.; Zhou, Y. Materials transfer in electro-spark deposition of TiCp/Ni metal-matrix composite coating on Cu substrate. Weld. J. 2010, 89, 172–180. [Google Scholar]
- Meng, L.D.; Liang, Z.J.; Zhang, Q. Research and development of high energy pulse precision cold-welding technology. Adv. Mater. Res. 2011, 291–294, 988–994. [Google Scholar] [CrossRef]
- James, L.; Richard, L.; Lawrence, E. Electro-spark Deposition is a Viable Process Suitable for Applying Overlays and Restoring Part Dimensions with Little Effect on Substrate Microstructure. Adv. Mater. Process. 2003, 161, 35–37. [Google Scholar]
- Kondapalli, S.P.; Chalamasetti, S.R. Effect of pulsed current micro plasma arc welding process parameters on fusion zone grain size and ultimate tensile strength of Inconel 625 sheets. Acta Metall. Sin. 2012, 25, 179–189. [Google Scholar]
- Chen, C.J.; Wang, D.S. High energy micro alloying on ZM2 Mg base alloy by ZM2 alloy. Surf. Eng. 2007, 23, 344–349. [Google Scholar] [CrossRef]
- Lorenzo, M.F.; Charles, C.F.K. The effect of pulse energy on the defects and microstructure of electro-spark-deposited Inconel 718. Metall. Mater. Trans. A 2019, 50A, 4223–4231. [Google Scholar]
- Huang, H.; Liu, C.P.; Guo, S. Simulation study of electro spark deposition on die steel. In Proceedings of the 4th International Conference on Mechanical Materials and Manufacturing Engineering, Wuhan, China, 15–16 October 2016; pp. 878–881. [Google Scholar]
- Kansal, H.K.; Sehijpal, S.; PradeeP, K. Numerical simulation of powder mixed electric discharge machining (PMEDM) using finite element method. Math. Comput. Model. 2008, 47, 1217–1237. [Google Scholar] [CrossRef]
- Das, S.; Klotz, M.; Klocke, F. EDM simulation: Finite element-based calculation of deformation, microstructure and residual stresses. J. Mater. Process. Technol. 2003, 142, 434–451. [Google Scholar] [CrossRef]
- Chen, H.N.; Li, R.F.; Chen, J. GB/T24179-2009 Metallic Materials-Residual Stress Determination—The Indentation Strain-Gage Method; China Standard Press: Beijing, China, 2009. (In Chinese) [Google Scholar]
- British Standards Institution. BS7910: 2013+A1: 2015, Guide to Methods for Assessing the Acceptability of Flaws in Metallic Structures; BSI Standards Limited: London, UK, 2015. [Google Scholar]
- Zhang, J.J. Physical and Numerical Simulation on the Weldability of 07MnNiCrMoVDR Steel. Ph.D. Thesis, Tianjin University, Tianjin, China, 2010. (In Chinese). [Google Scholar]
- Saeed, A.; Majid, G. Electro-thermal-based finite element simulation and experimental validation of material removal in static gap single spark die-sinking electro-discharge machining process. J. Eng. Manuf. 2017, 231, 28–47. [Google Scholar]
- Ikai, T.; Hashigushi, K. Heat input for crater formation in EDM. In Proceedings of the International Symposium for Electro-Machining, Lausanne, Switzerland, 17–21 April 1995; pp. 163–170. [Google Scholar]


© 2020 by the authors. Licensee MDPI, Basel, Switzerland. This article is an open access article distributed under the terms and conditions of the Creative Commons Attribution (CC BY) license (http://creativecommons.org/licenses/by/4.0/).