Abstract
This work presents, for the first time, an in-depth investigation of the structure–property–fatigue relationships of an Al-Mg-Si alloy (AA6061) processed via additive friction stir-deposition (AFS-D). As industry focus continues to shift for more efficient and lightweight structures, quantitative studies on the cyclic performance of additively manufactured materials are needed. In this study, the AFS-D processed AA6061-T6 was machined into specimens in two orthogonal orientations and subjected to monotonic and strain-controlled fatigue testing. The microstructural features of as-deposited AA6061 exhibited evidence of dynamic recrystallization and grain refinement. In addition, significant reduction in the intermetallic particles was observed after AFS-D processing. The fatigue results demonstrate that the as-deposited material, particularly the longitudinal direction, exhibited similar fatigue performance to wrought AA6061-T6 in both low-cycle and high-cycle fatigue regimes, which is a promising result for additively manufactured material in the as-deposited condition. By contrast, the as-deposited build direction orientation possessed slightly lower fatigue resistance than the wrought feedstock material. The AFS-D material was observed to exhibit different damage mechanisms from porosity-based damage mechanisms observed in fusion-based additively manufactured materials. Lastly, a microstructure-sensitive fatigue model was employed to capture the fatigue effects of the AFS-D processing on the AA6061.
1. Introduction
Recently, the transportation industry has been researching potential techniques to improve the fuel efficiency, particularly in both lightweight materials and additive manufacturing. Lightweight materials, such as aluminum, magnesium, and composites, offer cost savings in terms of fuel economy by possessing greater strength-to-weight ratios. Likewise, additive manufacturing has been investigated for the potential to save on manufacturing costs from both materials consumed and machining time and costs. Fusion-based additive techniques, e.g., selective laser melting and direct metal laser sintering, have been reported to experience difficulties in producing aluminum due to hot-cracking during solidification [1,2,3]. This phenomenon of hot-cracking ultimately makes aluminum alloys generally difficult to additively manufacture with fusion-based approaches [1,4]. However, advances in solid-state additive technologies, like additive friction stir-deposition (AFS-D) [5,6,7,8,9,10,11], show promise in producing fully dense builds with wrought-like mechanical properties.
The AFS-D process provides the potential capability to produce lightweight materials via additive manufacturing. The AFS-D process is a solid-state additive deposition process that exploits severe deformation and frictional heat to achieve dense metallurgical bonding of deposition layers. As such, the AFS-D process avoids the common deleterious effects that occur in fusion-based AM processes such as hot cracking, porosity, and columnar grain structures without the need for secondary densification post-processing. In the AFS-D process, the feed rod is pushed through a rotating hollow cylindrical tool against a rigid substrate, which induces high-shear and severe plastic deformation on the feed rod, leading to metallurgical bonding [8,10,11,12].
While the AFS-D process is a relatively new technology, the understanding of the solid-state processing on Al-Mg-Si alloys can be found in related solid-state welding processes such as friction stir welding (FSW). In FSW of AA6061, the solid-state welding process produces grain refinement in local regions near the path of the rotating pin tool [12,13,14]. In FSW, there exist three distinct regions of refinement: (1) Nugget zone (NZ)–most refined, equiaxed grains; (2) thermos-mechanically affected zone (TMAZ)–less refined grains than the NZ; (3) heat-affected zone (HAZ)–least refined grains, may or may not be equiaxed as the grains transition to the base material. The role of dynamic recrystallization (DRX) in the FSW process is an active area of study; several studies have observed high-angle grain boundaries (grain misorientation ≥ 15°) with low dislocation density in the NZ, which is indicative of DRX [13,15,16,17]. In addition to DRX, Feng et al. observed the dissolution of fine β” precipitates in the material when examined via transmission electron microscopy (TEM) [13]. This observation is suggested to be caused by the high temperatures experienced during FSW (T ≥ 250 °C), and has a significant effect on AA6061, as β” is the primary strengthening phase of the alloy [18].
Regarding the AFS-D processing of AA60601, a thorough investigation of the process–structure relationship was carried out in as-deposited AA6061 [6]. Observations from this study found a 93% reduction in average grain size from 200 to about 15 μm, strongly suggesting the occurrence of DRX and dissolution of Mg and Si into supersaturated solid solution. In particular, a focus of the study by Phillips et al. was on quantifying the relationship of the hardness, e.g., relative strength, of the samples made using various combinations of tool rotation rate, traversing speed, and actuator feedrate. A key finding from their experiments was the relationship between the traversing speed and the feedrate. If the ratio becomes too skewed toward traversing speed, the deposition is underfed, leading to galling and surface voids, but if the ratio becomes too skewed toward the feedrate, the deposition experiences excess flash, where deposited material is extruded out from under the tool. Additionally, they found that the hardness increases with increasing tool rotation rate, increasing the traversing speed and actuator feedrate.
The focus of this present paper is to quantify the relationship between the microstructure and mechanical properties including tensile and strain-control fatigue behavior in AA6061 processed with AFS-D. In this present study, cross-sections of the deposition were examined in order to characterize the nature of the grain structure and intermetallic particles using optical microscopy, scanning electron microscopy (SEM), and electron backscatter diffraction (EBSD) techniques. Postmortem analysis was performed by examining the fracture surfaces of the fatigue-tested samples to determine crack initiation mechanisms and fracture characteristics. Furthermore, a microstructure-sensitive fatigue model is employed to elucidate the effect of AFS-D processing on the fatigue mechanisms. As such, this present study provides, for the first time, a quantitative analysis of the mechanisms of cyclic deformation on an as-deposited Al-Mg-Si alloy processed via AFS-D.
2. Materials and Methods
2.1. Materials
The feedstock material used in this study was rolled AA6061-T651 that was machined using a water jet into dimensions of 9.5 mm × 9.5 mm × 304.8 mm in order to fit into the hollow opening of the AFS-D tool. A multi-layer deposition build was produced using parameters of 300 RPM spindle rotation speed, 127 mm/min traversing speed, 66 mm/min actuator feedrate, 5 mm/min Z velocity, and 1 mm layer thickness. We note that this set of AFS-D build parameters was chosen based on the results of a prior study [6], where these parameters produced the most uniform hardness throughout the deposition.
2.2. Test Specimens and Experimental Methods
The geometry of the test specimens used in this work is presented in Figure 1. The specimens were machined via wire electro-discharge machining (EDM) from the deposition in two different spatial orientations in order to quantify any orientation dependence due to anisotropy in the as-deposited AFS-D material. For this study, the specimens were machined directly from the deposition with no post-processing carried out on the specimens or the deposition. The orientation and location of each specimen were labeled as the specimens were machined, such that every specimen could be traced back to where it was in the deposition prior to machining. The layout of the specimen’s orientation is also shown in Figure 1. The specimens oriented with the long axis parallel to the long axis of the build will be referred to hereafter as the longitudinal direction, while the specimens oriented with the long axis perpendicular to the layers will be referred to as the build direction. In order to reduce the effect of surface roughness on the fatigue performance of the specimens, all fatigue specimens were mechanically ground and polished. The polishing procedure started at relatively-low-grit (~300) SiC paper and progressively increased to 2000 grit SiC paper.
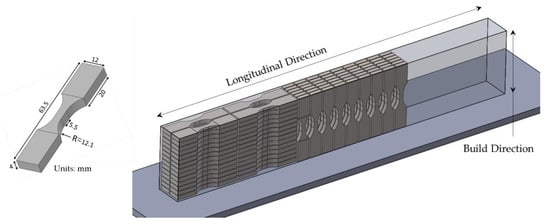
Figure 1.
Sample geometry and layout from within the additive friction stir-deposition (AFS-D) build.
Both the monotonic and fatigue experiments were carried out on a servo hydraulic load frame. The tests were conducted in lab air at room temperature. The monotonic tests were conducted in the quasi-static condition under displacement control with a strain rate of 0.001 mm/mm/s. Strain was measured using a 5 mm extensometer. Three data sets were generated: One from the wrought feedstock, one from samples oriented in the longitudinal direction of the as-deposited AFS-D material, and one from samples oriented in the build direction of the AFS-D deposition. The directions have been denoted on Figure 1. Every strain amplitude for every data set was tested on three samples to increase statistical confidence in the results. Fatigue testing was performed under a strain-control, fully-reversed (R = −1) condition until the hysteresis response of the material stabilized. The loading frequency for the strain-control portion of the test was 1 Hz. Once a stable hysteresis response was reached, the experiment was continued in load control using the stable hysteresis data to determine the loading parameters until the sample completely fractured. The loading frequency of the load-control portion of the test was kept at 1 Hz for specimens tested at 0.4, 0.5, and 0.6%, but was increased for specimens tested at 0.2% (20 Hz) and 0.3% (5 Hz). The change in frequency was made in the interest of time to conduct a fatigue test. The criterion used for determining stabilization was to run at least 1000 cycles in strain control. It should also be noted that in the tests at 0.6%, the majority of the life is strain-controlled. Only for 0.4, 0.3, and 0.2% strain amplitude tests is the percentage of the life under strain-control less than 50%. It is worth mentioning that these tests were dominated by an elastic stress response that generally did not vary much after the first few hundred cycles. As such, a load-control test, which can be conducted at a much higher load frequency, was deemed acceptable.
Post-mortem fracture samples were prepped for SEM by mounting them to an observation stage via carbon tape and grounding the sample with copper tape to prevent charging during observation. The SEM used for fractography in this work was a TESCAN LYRA3 field emission SEM from TESCAN USA, Inc. Warrendale, PA, USA. Samples for microstructural analysis were ground and polished incrementally to a 1 μm diamond suspension polish that was followed by a vibratory polish using 0.5 μm colloidal silica. The grain size analysis was performed in compliance with the guidelines set forth in ASTM 2627-13 [19]. EBSD analysis was performed on a TESCAN LYRA3 field-emission SEM with an EDAX Hikari Super EBSD camera from EDAX, LLC Mahwah, NJ, USA.
2.3. Microstructure-Sensitive Fatigue Model
The microstructure-sensitive fatigue (MSF) model, proposed by McDowell et al. [20] for automotive cast aluminum alloy and subsequently modified to account for mechanisms in other materials [21,22] and materials processing methods [23,24] including fusion-based AM [25,26], was used to correlate the experimental fatigue results and to aid in elucidating the effect of microstructure evolution on fatigue mechanisms due to the AFS-D process. The model aims to take into account various microstructural features, such as particle size, shape, nearest neighbor distance, grain size, crystallographic texture, etc., when modeling the fatigue behavior of a material. The model approach discretizes established stages of fatigue failure in distinct modeling stages, namely: (1) Crack incubation, (2) microstructurally small crack (MSC) growth and physically small crack (PSC) growth, and (3) long crack (LC) growth. The incubation stage involves the portion of the fatigue life spent developing a crack from a nucleation site, such as an inclusion or void. The microstructurally small crack growth refers to the portion of the life spent with a crack with a length on the order of microstructural features such as inclusions or small grains within the material. After the crack has grown to a physically significant size, somewhat larger than microstructural features, but not yet long enough to be characterized as a long crack, as in Paris law fatigue crack growth, it is in the PSC growth stage. Once the crack has reached a size applicable to the fatigue crack growth (FCG) stage, which is generally multiple grain lengths long [21], the long crack growth portion has been reached. The LC portion of the model uses linear elastic fracture mechanics to model that portion of the life.
The total life of a component can then be expressed as a sum of the length of life spent in each stage of fatigue:
where Ninc represents the number of cycles in the incubation stage, NMSC/PSC represents the number of cycles spent in the combined MSC growth and PSC growth stages, and NLC represents the number of cycles spent in the LC growth stage until failure.
Ntotal = Ninc + NMSC/PSC + NLC
The crack incubation contribution to fatigue life, Ninc, from Equation (1) is found using a modified Coffin−Manson fit that takes microscale parameters into consideration to characterize the nucleation of a microscopic crack from a microscopic notch. The modified Coffin−Manson expression is given as:
where α and Cinc are the respective exponent and linear coefficients, and the nonlocal plastic shear strain around an inclusion is represented by the remote applied strain amplitude (εa), the microplasticity strain threshold (εth), and ψ and , which will be explained further in detail. is a model parameter that relates the development of local plastic shear strain from the applied remote strain amplitude expressed as the following:
where R is the load ratio, and y1 and y2 are model constants. When the localized plastic region around the inclusion reaches a certain size, the is modified to include geometric effects by a parameter. More information on that process can be found in a prior study on AA6061 [27]. The parameter ψ relates observed microstructural features to the incubation behavior and is expressed as:
where MPS is the maximum particle size, NND is the nearest neighbor distance, GS is the grain size, and λ is a sensitivity parameter.
The microstructurally/physically small crack growth portion of the fatigue life from Equation (1) is determined using a crack tip displacement crack growth model. The MSC/PSC contribution can be determined from the following expression:
where da/dN is the crack growth rate, initial crack length is 62.5% of the maximum particle size, and χ is a constant related to the crack propagation rate, which typically falls between 0.33 and 0.5. ΔCTDth is the threshold value for crack tip displacement and has been reported to be 2.85 × 10⁻⁴ μm for pure FCC aluminum [21]. ΔCTD is a parameter of crack tip displacement and is given by the following equation:
where CI and CII are material parameters for the microstructure on MSC and PSC growth in low-cycle and high-cycle regimes, respectively. is a parameter for load path and amplitude of multiaxial fatigue, which, in this study, is the uniaxial loading range. The parameter U is a loading ratio parameter given by U = 1/(1 − R), GS is the grain size, GS0 is the reference grain size, and ω is a material constant related to the sensitivity of small crack growth to grain size.
3. Results and Discussion
3.1. Microstructure
The evolution of the grain size in AA6061-T651 due to the AFS-D process is shown in the EBSD maps in Figure 2. In Figure 2, the orientation is denoted in the corner of each plane with XS representing the short transverse, LT representing the longitudinal direction, and BD representing the build direction. The microstructure associated with the build parameters used in this study has been demonstrated to exhibit a refined, equiaxed grain structure with predominantly high-angle grain boundaries as reported in a prior study [6]. The presence of refined, equiaxed grains and high-angle grain boundaries is indicative of dynamic recrystallization (DRX) as reported in a study on friction stir-welded AA6061 by Feng and co-workers [13]. The refinement of the grain size is reported to be on the order of a 93% reduction from 200 μm in the feedstock to 15 μm in the as-deposited material [6]. Likewise, transmission electron microscopy (TEM) and selected-area electron diffraction (SAED) revealed complete dissolution of the strengthening β” precipitates [6], which is in agreement with Feng’s study on FSW AA6061 [13]. It is important to note that 6xxx-series aluminum alloys, particularly alloys with magnesium and silicon as the major alloying elements, utilize precipitation hardening as a strengthening mechanism [28]. The alloying elements present in a given alloy, such as magnesium, silicon, iron, manganese, etc., influence the formation of intermetallic phases in the alloy [29,30,31]. The chemical composition of some coarse intermetallic phases has been identified as Al7Cu2Fe, Al5FeSi, Al12(Fe,Cr,Mn)3Si, and Mg2Si, which is the stable β phase and, as such, an intermetallic of particular interest [32,33,34,35].
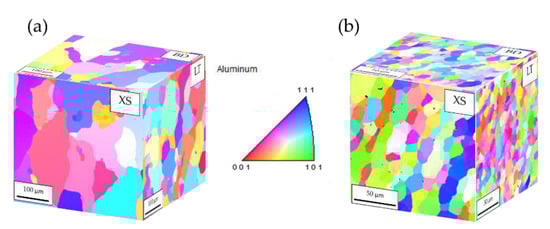
Figure 2.
Isometric view of electron backscatter diffraction (EBSD) maps of (a) AA6061-T651 feedstock and (b) as-deposited AFS-D AA6061 with equiaxed grains.
One inherent characteristic of AFS-D is the refinement of the microstructural features, e.g., grain size, from the feedstock. This is similar to what is commonly observed in FSW; however, the AFS-D material is analogous to the NZ in FSW. Avery et al. [21] observed the reduction in the average size and volume fraction intermetallic particles, which is attributed to severe plastic deformation of the AFS-D process in refining the carbides into smaller particles. In particular, the size distribution for particles processed with AFS-D was reported to be approximately 15 μm2 while the feedstock was reported to be a size of approximately 55 μm2 at the larger extreme tail of the size distribution [9]. Similarly, in the present study, the as-deposited AFS-D and feedstock AA6061-T651 specimens were polished and observed under an SEM. The results of the SEM back-scatter electron (BSE) images for the AFS-D and the feedstock are shown in Figure 3. Figure 3a shows a 1500× BSE of the AFS-D as-deposited sample while Figure 3b shows a 5000× BSE of some particles in the AFS-D sample. Figure 3c shows the particles in the wrought AA6061 feedstock at 1500× using a BSE detector. Lastly, Figure 3d shows a normal distribution curve of the constituent particle size in both as-deposited and feedstock specimens. These results show a similar particle refinement behavior to what was reported by Avery et al. [9], although the constituent particles in the feedstock of AA6061 were smaller than the carbide particles observed in the Inconel feedstock. The particles seen in the as-deposited material were generally spherical with no preferred orientation, while the wrought feedstock possessed larger, more amorphous intermetallic particles oriented randomly. This finding also suggests that the refinement of microstructural features, including defects, is inherent to the AFS-D process and not material- or alloy-specific, although more material systems will need to be examined to verify this hypothesis. Table 1 shows the average particle size and standard deviation of the particle sizes in the wrought and as-deposited AFS-D 6061 aluminum alloy. Table 1 also calculates the average particle size + and − half the standard deviation, which will be used in the modeling portion discussed later.
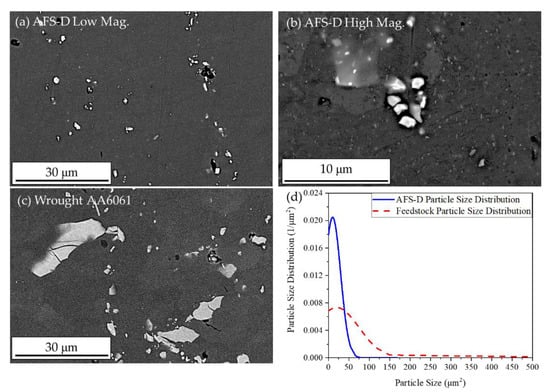
Figure 3.
(a) AFS-D back-scatter electron (BSE) image showing iron-rich particles generally spherical in nature, (b) 5000× magnification BSE image of a cluster of particles in the AFS-D, (c) wrought AA6061-T651 feedstock BSE image with larger, amorphous iron intermetallic particles, and (d) a normal distribution contrasting the sizes of the iron particles in the AFS-D and feedstock materials.

Table 1.
Average and standard deviation from particle distribution for wrought and as-deposited AFS-D AA6061.
3.2. Monotonic Tensile Results
The results from the monotonic testing are presented in Figure 4. Each curve in Figure 4 is the averaged curve of the three discrete data sets with the error bars shown. As expected, the precipitation-hardened feedstock experienced significantly higher strength than either of the as-deposited orientations with a yield and ultimate strength more than double the ultimate strength of either as-deposited orientations. The feedstock also exhibited a lower elongation to failure of approximately 34%. The as-deposited material exhibited a mostly isotropic mechanical behavior. Both the longitudinal and build direction have yield and ultimate tensile strengths that are within one standard deviation of the other as-deposited orientation. Additionally, both as-deposited orientations exhibit strengths comparable to that of wrought AA6061-O, which makes sense based on the dissolution of the β” strengthening phases. In terms of elongation to failure, the longitudinal possessed the most ductile behavior at 60% while the build direction demonstrated an average elongation of approximately 45%. We note that the as-deposited longitudinal experimental results exhibited the largest error bars, and that is because of one specimen behavior performing anomalously. One of the longitudinal specimens taken from the very top surface of the build exhibited significantly higher strength than the other longitudinal specimens. This is likely due to the top layer experiencing the least thermal cycling and, thus, the least amount of dissolution of the strengthening phases. However, additional research is needed to understand the extent of spatial location on mechanical strength in the AFS-D builds. The strength values (yield and ultimate) of the feedstock and as-deposited orientation are presented in Table 2.
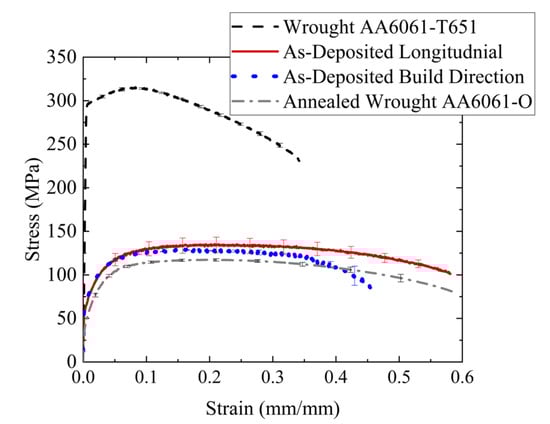
Figure 4.
Monotonic engineering stress–strain curve of wrought AA6061-T651, AFS-D AA6061 as-deposited longitudinal direction, AFS-D AA6061 as-deposited build direction, and the annealed wrought AA6061-O.
Table 2.
Monotonic strength properties for feedstock and as-deposited AFS-D material.
3.3. Effect of Thermomechanical Processing on Monotonic Behavior
The monotonic tensile curve of the as-deposited AA6061 presented in Figure 4 demonstrated significantly lower strength than the feedstock material. As noted in Section 3.1, this result is expected behavior based on the evolution of the microstructure inherent in the thermomechanical processing of the AFS-D process, due to the dissolution of Mg and Si into clusters within the material matrix [6], where the primary strengthening mechanism of AA6061 is fine β” (Mg2Si) precipitates [18]. In addition to the lower strength in the as-deposited material due to the lack of dislocation pinning β” precipitates, the ductility of the as-deposited material in terms of elongation to failure is greater than what is observed in the feedstock [21]. This phenomenon may also be attributed to the lack of β” particles as the dislocations are allowed to move much more freely throughout the matrix. The annealing process for AA6061 per the ASM Handbook vol. 4 [36] is 2–3 h at 415 °C. While the exact temperature of the AFS-D process at the deposition layer is unknown at this time, thermocouple measurements in the substrate of the AFS-D build indicate that the temperature is higher than 490 °C. Therefore, the as-deposited material in this study was subjected to thermal cycles in excess of 490 °C for several layers, although each layer deposition only took several minutes to complete. The as-deposited material also exhibited significant strain hardening, which suggests DRX occurs during the AFS-D process, as a low dislocation density is characteristic of DRX and would allow for extensive strain hardening during monotonic loading.
3.4. Strain-Control Fatigue Results
Figure 5 shows the results from the strain-controlled fatigue tests of the AA6061-T651 feedstock, AFS-D as-deposited longitudinal direction, and as-deposited build direction. Similar to the tensile results, the wrought AA6061-T651 experimental fatigue data are included as a reference, as the as-deposited material is quite different in terms of strengthening precipitates to the wrought feedstock. At the highest strain amplitude tested, the fatigue performance of the as-deposited material was on the order of about 1000 cycles for both orientations. Specifically, at the strain amplitude of 0.6%, the longitudinal direction exhibited cycles to failure that were only slightly higher than the build direction material. Similarly, the strain amplitude of 0.5% revealed that both as-deposited orientations experienced similar fatigue lives. For the lower strain amplitudes tested, and in particular, the 0.3% strain amplitude, the as-deposited build direction exhibited fewer cycles to failure than the as-deposited longitudinal orientation. Furthermore, it is noteworthy that the as-deposited longitudinal samples experienced run-outs (defined as 5 × 10⁶ cycles in this study) in all samples tested at 0.2% strain amplitude.
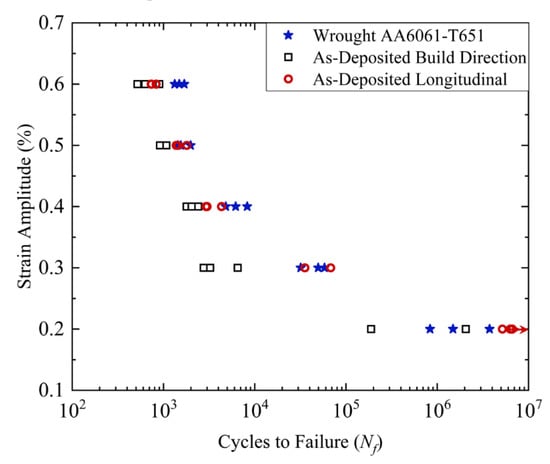
Figure 5.
Strain amplitude versus cycles to failure plot of the AA6061-T651 feedstock, AA6061 AFS-D as-deposited longitudinal direction, and AA6061 AFS-D as-deposited build direction.
Figure 6 shows the evolution of the stress amplitude in response to two different applied strain amplitudes for wrought AA6061-T651, as-deposited longitudinal direction AA6061, and as-deposited build direction AA6061. The 0.5% AFS-D longitudinal direction (the gray stars) and the 0.5% AFS-D build direction (the hollow blue triangles pointed right) did not stabilize. However, the fraction of the fatigue life for the 0.5% longitudinal is 73% and the 0.5% build direction sample failed at 914 cycles. The 0.5% wrought AA6061 cyclically softened but had stabilized by 1000 cycles. The fraction of the fatigue life under strain control was 65%. The 0.3% wrought AA6061, 0.3% AFS-D longitudinal, and 0.3% AFS-D build direction all stabilized by the 1000 cycles.
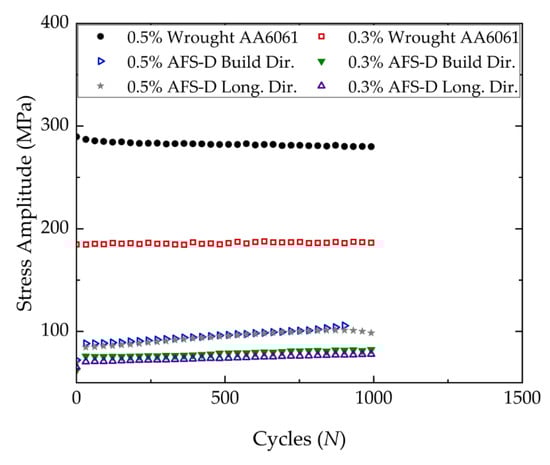
Figure 6.
The evolution of the stress amplitude response to deformation for wrought AA6061-T651, as-deposited longitudinal direction AA6061, and as-deposited build direction AA6061 for specimens tested at 0.3 and 0.5%.
3.5. Post-Mortem Analysis of Fatigue Fracture Surfaces
Figure 7 shows representative fractography of the as-deposited fatigue specimens. The fractured surface shown in Figure 7a,b was an as-deposited build direction specimen tested at εa = 0.3% and experienced a fatigue life of Nf = 6505 cycles. The fracture surface exhibited evidence of multiple crack initiation sites noticeable in Figure 7a where river patterns leading back to several areas can be seen. These areas include the lower left corner, the middle of the bottom surface, the top left corner, and the area in the top right to top middle region. There is no evidence of a fish-eye-type fracture in any samples investigated, meaning both orientations of as-deposited and the feedstock experience crack initiation at near-surface defects in the material. Figure 7b shows an initiation region in the upper left corner crack initiation region from Figure 7a, where a void is observed that was likely caused by the fracturing of a particle that subsequently fell out of the specimen upon fracture. The parameters used in this study were identical to the process parameters used in a study on the same material on the same AFS-D machine [6]. In particular, the study by Phillips et al. [6] reported fully dense depositions made with the same parameters as this study; therefore, the void likely developed as a result of the deformation that resulted from cyclic loading. Figure 7c,d show a fracture surface from an as-deposited longitudinal direction AFS-D specimen tested at εa = 0.3%, which experienced a fatigue life of Nf = 67,983 cycles. Figure 7c shows crack initiation occurring from multiple initiation sites along the left surface and propagating across the surface of the specimen until final fracture occurred. The dark region shown in Figure 7d reveals broken particles in the vicinity of the initiation on the surface of the specimen.
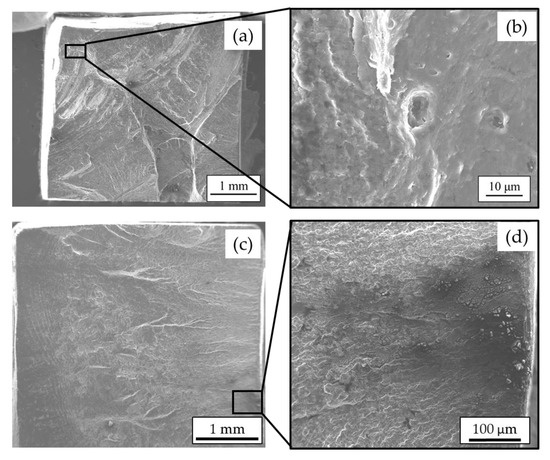
Figure 7.
Fracture surface of (a) AFS-D as-deposited build direction sample tested at εa = 0.3% (Nf = 6505 cycles) with (b) high-magnification view of a crack initiation site, and fracture surface of (c) AFS-D as-deposited longitudinal direction sample tested at εa = 0.3% (Nf = 67,983 cycles) with (d) higher-magnification view of crack initiation site.
3.6. MSF Model Results and Discussion
The results from the MSF model for the AFS-D as-deposited longitudinal direction model correlation is provided in Figure 8a, and the AFS-D as-deposited build direction model correlation is shown in Figure 8b. In both fatigue modeling results, the higher strain amplitude fatigue lives are dominated by small crack growth after a brief incubation stage. Likewise, all fatigue modeling results experienced incubation-dominant fatigue behavior when subjected to lower strain amplitudes. The parameters used for the model fits of the longitudinal and build direction data are recorded in Table 2. In addition, it is important to note that the initial selection of the MSF model parameters were taken from a study of AA6061 conducted by McCullough et al. [27]. By adjusting the material constants in the MSF model to fit the measured values from this study, such as modulus of elasticity, grain size, particle size, etc., as well as being informed by the constants in the study by McCullough et al. [27], such as crack tip displacement threshold for AA6061, MSF model fits were generated for each data set: Wrought, AFS-D as-deposited longitudinal, and AFS-D as-deposited build direction. The parameters used for the model fits of the longitudinal and build directions are reported in Table 3 at the end of this section.
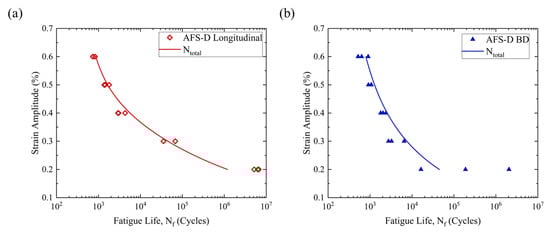
Figure 8.
Microstructure-sensitive fatigue (MSF) model fit for (a) AFS-D as-deposited AA6061 in the longitudinal direction and (b) AFS-D as-deposited AA6061 in the build direction.
Table 3.
MSF parameters for each data set.
Figure 9 shows the contributions of the incubation (INC) and the microstructurally small crack growth and physically small crack (MSC/PSC) growth stages of the MSF model for (a) the longitudinal direction AFS-D AA6061 and (b) the build direction (BD) AFS-D AA6061. In each plot, the dotted line represents the INC contribution and, in each condition, the INC stage has less of an effect as the applied strain amplitude increases. However, as the strain amplitude becomes smaller, more of the fatigue life is controlled by the INC stage. This seems reasonable, as smaller strain amplitudes would need more cycles to progressively accumulate the local plastic strain needed to initiate a crack compared to larger applied strain amplitudes. As a result, in the presence of the larger strain amplitudes, the incubation stage occurs at a lower number of cycles and the remaining life is dominated by the MSC/PSC stage, which is represented by the dashed line in each plot. The MSC/PSC contribution of the fatigue life tends to dominate the large strain amplitudes for the AFS-D process materials observed in this study, and contributes a lower percentage of the total life in the lower strain amplitudes. Again, this seems reasonable as the number of cycles spent in the MSC/PSC stage increases with lower strain amplitudes, but still at a rate lower than that of the INC stage. In addition, it is important to note that the INC stages tend to dominate the lower strain amplitudes of the AFS-D processed materials. Due to the relatively small size of the specimens used in fatigue testing, the LC contributions to the fatigue life were negligible. By the time the crack grew to a length that would qualify as LC, the specimens in the higher strain amplitudes had failed already, while the specimens tested under lower strain amplitudes experienced only a few cycles of the LC stage before failure.
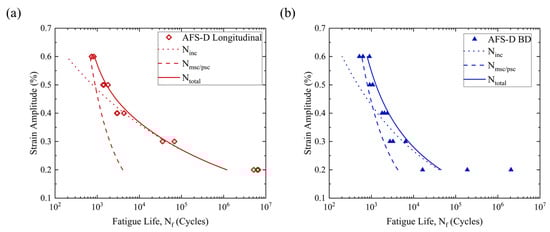
Figure 9.
MSF model plots of the incubation and small crack growth contributions to the total fatigue life prediction for (a) AFS-D AA6061 in the longitudinal direction and (b) AFS-D AA6061 in the build direction.
Fatigue performance, particularly in the range of 105 cycles or more, is greatly affected by particle size within the sample. All other concerns being equal, a larger particle, when fractured due to mechanical loading, will release more energy than a smaller particle, resulting in a larger stress intensity factor (SIF), and is, therefore, more likely to nucleate a fatigue crack, and will do so in fewer loading cycles than a smaller particle. The smaller average particle size coupled with the smaller standard deviation in the as-deposited material than the wrought results in a narrower distribution band of particle sizes. This observation is likely the cause of the longitudinal as-deposited AA6061 performing with a higher number of cycles to failure than the wrought AA6061-T651 at the strain amplitude of 0.2%, which would otherwise be expected to outperform the as-deposited material on account of the superior strength of the wrought samples. Additionally, the refined grain size inherent to the AFS-D process also contributes to the performance of the AFS-D as-deposited material, as a smaller grain size tends to provide better resistance to crack nucleation.
The effect of particle size on the fatigue behavior of the AA6061 as-deposited material was then used to bound the total fatigue life fits of the MSF model on an upper and lower model prediction. To calculate the bounds, the only parameter varied in the model was the parameter for particle size, which was varied by ± standard deviation based on the characterization shown in Figure 3. The values of the averages and standard deviations used to make the upper and lower bounds are provided in Table 1. The bounded MSF model correlations are shown in Figure 10 for the (a) longitudinal direction and (b) build direction. As can be seen, the effect of particle size in the MSF model can be used to account for the scatter observed in the longitudinal and build direction experimental fatigue results. A noteworthy finding from the results is that both the longitudinal and build direction data sets skew toward the lower bound. This makes sense in that the largest particle in a sample will likely exert the greatest effect on the performance of the sample. In other words, if all the particles in a sample are 2 μm except for one 15 μm particle, the large particle will cause the sample to perform more toward the lower bound. Another noteworthy behavior is that the width of the band between the lower and upper bound is larger in longitudinal samples. This finding suggests that specimens in the longitudinal direction may be affected differently than the build direction specimens by the deposition process with potential reasons associated with particle size effects, orientation of particle sizes, and interlayer effects. Further investigation of these effects is needed to fully elucidate the observed behavior.
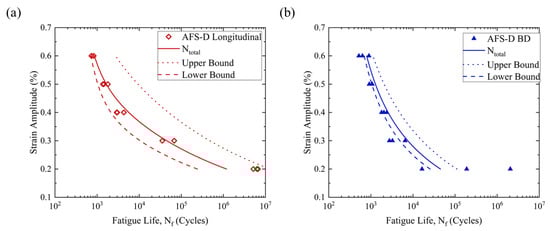
Figure 10.
Bound life MSF model plots for (a) AFS-D AA6061 in the longitudinal direction and (b) AFS-D AA6061 in the build direction.
4. Conclusions
In this study, the fatigue properties of AFS-D-deposited AA6061 were investigated for the first time. Based on the experimental results and subsequent analysis from this study, the following conclusions are presented:
- Microstructure of AFS-D AA6061 possesses refined, equiaxed grain structure with predominantly high-angle grain boundaries indicative of DRX. In addition, the AFS-D process refines the size of the intermetallics particles.
- Strain-control fatigue behavior of as-deposited AFS-D AA6061 is reported for the first time. The longitudinal orientation exhibited a slightly higher number of cycles to failure than the build direction, especially at lower strain amplitudes.
- The as-deposited material exhibits generally homogeneous behavior with the exception of the top surface of the longitudinally oriented samples. This is likely due to fewer thermal cycles experienced by the top deposition layers compared to the bottom layers that experience more of the detrimental repetitive thermal exposure to the reinforcing particles due to frictional heat generation during layer depositions.
- As-deposited material experienced fatigue cracks that initiated from the surface of the specimens, as well as near-surface defects such as intermetallic particles.
- The fatigue crack nucleation and growth mechanisms associated with AFS-D AA6061, like wrought material, are likely driven by constituent particles. This differs from porosity-based fatigue mechanisms observed in fusion-based additively manufactured material.
Author Contributions
Conceptualization, B.A.R. and J.B.J.; methodology, B.A.R., D.Z.A. and J.B.J.; validation, B.A.R. and D.Z.A.; formal analysis, B.A.R.; investigation, B.A.R.; resources, B.J.P., H.M.R., D.Z.A., J.B.J. and P.G.A.; data curation, B.A.R., D.Z.A., H.M.R. and B.J.P.; writing—original draft preparation, B.A.R.; writing—review and editing, B.A.R., J.B.J., P.G.A., L.N.B., K.J.D. and D.Z.A.; visualization, B.A.R., B.J.P., H.M.R. and D.Z.A.; supervision, J.B.J., P.G.A., L.N.B. and K.J.D. project administration, J.B.J., P.G.A., L.N.B. and K.J.D.; funding acquisition, J.B.J., D.Z.A., L.N.B. and K.J.D. All authors have read and agreed to the published version of the manuscript.
Funding
This research was funded by the US Department of Defense Strategic Environmental Research and Development Program WP18-1323.
Acknowledgments
The authors would like to thank the Alabama Analytical Research Center (AARC) and the Alabama Transportation Institute (ATI) for their support of this project.
Conflicts of Interest
One of the authors of this article is part of the Editorial Board of the journal. To avoid potential conflicts of interest, the responsibility for the editorial and peer-review process of this article lies with the journal’s other editors. Furthermore, the authors of this article were removed from the peer review process and had no, and will not have any access to confidential information related to the editorial process of this article.
References
- Uddin, S.Z.; Murr, L.; Terrazas, C.A.; Morton, P.; Roberson, D.A.; Wicker, R.B. Processing and characterization of crack-free aluminum 6061 using high-temperature heating in laser powder bed fusion additive manufacturing. Addit. Manuf. 2018, 22, 405–415. [Google Scholar] [CrossRef]
- Fulcher, B.A.; Leigh, D.K.; Watt, T.J. Comparison of AlSi40Mg and Al 6061 processed Through Dmls. In Proceedings of the Solid Freeform Fabrication (SFF) Symposium, Austin, TX, USA, 4–6 August 2014; p. 46. [Google Scholar]
- Roberts, C.; Bourell, D.L.; Watt, T.; Cohen, J. A Novel Processing Approach for Additive Manufacturing of Commercial Aluminum Alloys. Phys. Procedia 2016, 83, 909–917. [Google Scholar] [CrossRef]
- Cross, C.E. On the Origin of Weld Solidification Cracking. In Hot Cracking Phenomena in Welds; Springer: Berlin/Heidelberg, Germany, 2005; pp. 3–18. [Google Scholar]
- Rivera, O.; Allison, P.G.; Jordon, J.; Rodriguez, O.; Brewer, L.; McClelland, Z.; Whittington, W.; Francis, D.; Su, J.; Martens, R.; et al. Microstructures and mechanical behavior of Inconel 625 fabricated by solid-state additive manufacturing. Mater. Sci. Eng. A 2017, 694, 1–9. [Google Scholar] [CrossRef]
- Phillips, B.; Avery, D.; Liu, T.; Rodriguez, O.; Mason, C.; Jordon, J.; Brewer, L.N.; Allison, P.G. Microstructure-deformation relationship of additive friction stir-deposition Al–Mg–Si. Material 2019, 7, 100387. [Google Scholar] [CrossRef]
- Yu, H.Z.; Jones, M.E.; Brady, G.W.; Griffiths, R.J.; Garcia, D.; Rauch, H.A.; Cox, C.D.; Hardwick, N. Non-beam-based metal additive manufacturing enabled by additive friction stir deposition. Scr. Mater. 2018, 153, 122–130. [Google Scholar] [CrossRef]
- Rivera, O.; Allison, P.G.; Brewer, L.N.; Rodriguez, O.; Jordon, J.; Liu, T.; Whittington, W.; Martens, R.; McClelland, Z.; Mason, C.; et al. Influence of texture and grain refinement on the mechanical behavior of AA2219 fabricated by high shear solid state material deposition. Mater. Sci. Eng. A 2018, 724, 547–558. [Google Scholar] [CrossRef]
- Avery, D.Z.; Rivera, O.G.; Mason, C.J.T.; Phillips, B.J.; Jordon, J.; Su, J.; Hardwick, N.; Allison, P.G. Fatigue Behavior of Solid-State Additive Manufactured Inconel 625. JOM 2018, 70, 2475–2484. [Google Scholar] [CrossRef]
- McClelland, Z.; Avery, D.Z.; Williams, M.B.; Mason, C.J.T.; Rivera, O.G.; Leah, C.; Allison, P.G.; Jordon, J.B.; Martens, R.L.; Hardwick, N. Microstructure and Mechanical Properties of High Shear Material Deposition of Rare Earth Magnesium Alloys WE43; Springer Science and Business Media LLC: Berlin/Heidelberg, Germany, 2019; pp. 277–282. [Google Scholar]
- Griffiths, R.J.; Perry, M.E.J.; Sietins, J.M.; Zhu, Y.; Hardwick, N.; Cox, C.D.; Rauch, H.A.; Yu, H.Z. A Perspective on Solid-State Additive Manufacturing of Aluminum Matrix Composites Using MELD. J. Mater. Eng. Perform. 2018, 28, 648–656. [Google Scholar] [CrossRef]
- Pirondi, A.; Collini, L. Analysis of crack propagation resistance of Al–Al2O3 particulate-reinforced composite friction stir welded butt joints. Int. J. Fatigue 2009, 31, 111–121. [Google Scholar] [CrossRef]
- Feng, A.; Chen, D.; Ma, Z. Microstructure and Low-Cycle Fatigue of a Friction-Stir-Welded 6061 Aluminum Alloy. Met. Mater. Trans. A 2010, 41, 2626–2641. [Google Scholar] [CrossRef]
- Minak, G.; Ceschini, L.; Boromei, I.; Ponte, M. Fatigue properties of friction stir welded particulate reinforced aluminium matrix composites. Int. J. Fatigue 2010, 32, 218–226. [Google Scholar] [CrossRef]
- Mishra, R.; Ma, Z. Friction stir welding and processing. Mater. Sci. Eng. R Rep. 2005, 50, 1–78. [Google Scholar] [CrossRef]
- Threadgill, P.L.; Leonard, A.J.; Shercliff, H.R.; Withers, P.J. Friction stir welding of aluminium alloys. Int. Mater. Rev. 2009, 54, 49–93. [Google Scholar] [CrossRef]
- Su, J.-Q.; Nelson, T.; Mishra, R.S.; Mahoney, M. Microstructural investigation of friction stir welded 7050-T651 aluminium. Acta Mater. 2003, 51, 713–729. [Google Scholar] [CrossRef]
- Perovic, A.; Perovic, D.; Weatherly, G.; Lloyd, D. Precipitation in aluminum alloys AA6111 and AA6016. Scr. Mater. 1999, 41, 703–708. [Google Scholar] [CrossRef]
- ASTM E2627-13 Standard Practice for Determining Average Grain Size Using Electron Backscatter Diffraction (EBSD) in Fully Recrystallized Polycrystalline Materials. Available online: https://compass.astm.org/Standards/HISTORICAL/E2627-13.htm (accessed on 27 June 2020).
- McDowell, D.L.; Gall, K.; Horstemeyer, M.F.; Fan, J. Microstructure-based fatigue modeling of cast A356-T6 alloy. Eng. Fract. Mech. 2003, 70, 49–80. [Google Scholar] [CrossRef]
- Xue, Y.; Wright, A.M.; McDowell, D.L.; Horstemeyer, M.F.; Solanki, K.; Hammi, Y. Micromechanics Study of Fatigue Damage Incubation Following an Initial Overstrain. J. Eng. Mater. Technol. 2010, 132, 021010. [Google Scholar] [CrossRef]
- Xue, Y.; McDowell, D.; Horstemeyer, M.F.; Dale, M.; Jordon, J.B. Microstructure-based multistage fatigue modeling of aluminum alloy 7075-T651. Eng. Fract. Mech. 2007, 74, 2810–2823. [Google Scholar] [CrossRef]
- Jordon, J.B.; Horstemeyer, M.F.; Daniewicz, S.R.; Badarinarayan, H.; Grantham, J. Fatigue Characterization and Modeling of Friction Stir Spot Welds in Magnesium AZ31 Alloy. J. Eng. Mater. Technol. 2010, 132, 041008. [Google Scholar] [CrossRef]
- El Kadiri, H.; Xue, Y.; Horstemeyer, M.F.; Jordon, J.B.; Wang, P.T. Identification and modeling of fatigue crack growth mechanisms in a die-cast AM50 magnesium alloy. Acta Mater. 2006, 54, 5061–5076. [Google Scholar] [CrossRef]
- Torries, B.; Shamsaei, N. Fatigue Behavior and Modeling of Additively Manufactured Ti-6Al-4V Including Interlayer Time Interval Effects. JOM 2017, 69, 2698–2705. [Google Scholar] [CrossRef]
- Torries, B.; Imandoust, A.; Beretta, S.; Shao, S.; Shamsaei, N. Overview on Microstructure- and Defect-Sensitive Fatigue Modeling of Additively Manufactured Materials. JOM 2018, 70, 1853–1862. [Google Scholar] [CrossRef]
- McCullough, R.; Jordon, J.; Allison, P.; Rushing, T.; Garcia, L. Fatigue crack nucleation and small crack growth in an extruded 6061 aluminum alloy. Int. J. Fatigue 2019, 119, 52–61. [Google Scholar] [CrossRef]
- Ravi, C. First-principles study of crystal structure and stability of Al-Mg-Si-(Cu) precipitates. Acta Mater. 2004, 52, 4213–4227. [Google Scholar] [CrossRef]
- Tanihata, H.; Sugawara, T.; Matsuda, K.; Ikeno, S. Effect of casting and homogenizing treatment conditions on the formation of Al–Fe–Si intermetallic compounds in 6063 Al–Mg–Si alloys. J. Mater. Sci. 1999, 34, 1205–1210. [Google Scholar] [CrossRef]
- Dons, A.L.; Jensen, E.K.; Langsrud, Y.; Trømborg, E.; Brusethaug, S. The alstruc microstructure solidification model for industrial aluminum alloys. Met. Mater. Trans. A 1999, 30, 2135–2146. [Google Scholar] [CrossRef]
- Sha, G.; O’Reilly, K.; Cantor, B.; Hamerton, R.; Worth, J. Effect of Grain Refiner on Intermetallic Phase Formation in Directional Solidification of 6xxx Series Wrought Al Alloys. Mater. Sci. Forum 2000, 337, 253–258. [Google Scholar] [CrossRef]
- Srivatsan, T.S.; Al-Hajri, M.; Petraroli, M.; Hotton, B.; Lam, P. Influence of silicon carbide particulate reinforcement on quasi static and cyclic fatigue fracture behavior of 6061 aluminum alloy composites. Mater. Sci. Eng. A 2002, 325, 202–214. [Google Scholar] [CrossRef]
- Olea, C.; Roldo, L.; Dos Santos, J.; Strohaecker, T. A sub-structural analysis of friction stir welded joints in an AA6056 Al-alloy in T4 and T6 temper conditions. Mater. Sci. Eng. A 2007, 454, 52–62. [Google Scholar] [CrossRef]
- Hatch, J.E. Aluminum: Properties and Physical Metallurgy; ASM International: Materials Park, OH, USA, 1984; p. 424. [Google Scholar]
- Lassance, D.; Fabrègue, D.; Delannay, F.; Pardoen, T. Micromechanics of room and high temperature fracture in 6xxx Al alloys. Prog. Mater. Sci. 2007, 52, 62–129. [Google Scholar] [CrossRef]
- ASM Handbook Committee. Heat Treating. In ASM Handbook; ASM International: Materials Park, OH, USA, 1991; Volume 4. [Google Scholar]


© 2020 by the authors. Licensee MDPI, Basel, Switzerland. This article is an open access article distributed under the terms and conditions of the Creative Commons Attribution (CC BY) license (http://creativecommons.org/licenses/by/4.0/).