1. Introduction
Nowadays, in the fabrication of metal structures, metal joining is an important process. One of the most important joining methods is welding. When a high energy source is provided, the welded parts melt and join together, and the variety of the microstructures in the weld region and the heat affected zone deserve much study [
1,
2,
3,
4,
5]. One popular method to join metals is laser welding, for it offers stable and high-quality results [
6,
7], which are highly desirable in the automotive industry. Laser welding, which has a concentrated heat source containing a high power density, offers a high welding rate, and, thus, brings about rapid heating and cooling rates. Due to this advantage, the weld region can be narrow, and the heat affected zone very small. The precise control of laser welding has made it a key process in the automotive industry [
8,
9].
In the past, a quenching process was introduced after austenitization of steels with a low level of carbon to produce martensite with high strength. However, in ferrous alloys, instead of the lath microstructures of martensite, the patchy microstructures of massive grains appeared [
10,
11,
12,
13,
14,
15]. The term “massive transformation” was first proposed by Greninger in 1939, when a rapidly quenched microstructure of a Cu-Al alloy was studied [
16]. Karlyn et al. indicated that it only occurred in single-phase to single-phase transformation [
15], which was in agreement with the thermodynamic explanation by Hillert [
17]. The massive grains had irregular boundaries, unlike the relatively smooth boundaries of allotriomorphic and idiomorphic ferrite, so much research has been conducted to figure out this intriguing phase [
12,
15,
16,
18,
19,
20,
21,
22].
In the classification presented by Bhadeshia in [
23], massive ferrite and allotriomorphic ferrite both belong to reconstructive transformation; however, there are still some differences between them. During the continuous cooling process, when the temperature is below the Ar
3 temperature, allotriomorphic ferrite is the first phase to form at the slowest cooling rates [
23]. This phase is usually termed equiaxed ferrite [
24,
25] or polygonal ferrite [
26,
27,
28,
29], for it homogeneously nucleates at prior austenite grain boundaries and grows into equiaxed grains when the prior austenite grain size is rather small. When the prior austenite grain size is extremely large, this ferrite forms along the prior austenite grain boundaries until they impinge on one another, so it possesses a layer morphology and does not reflect its crystal symmetry [
30]. Allotriomorphic ferrite has been well determined by optical microscopy to have smooth and continuous grain boundaries and by TEM to have a low dislocation density. The characteristics of massive transformation were studied and highlighted by Massalski [
31,
32]. The striking feature of massive transformation is composition invariance; the product phase inherits the composition of the parent phase. As a result, when massive transformation occurs, only short-range diffusion happens at the interface between the parent and product phases to reconstruct the new crystal. Long-range diffusion is unnecessary, for there is no difference between the compositions of the parent and product phases. Compared to diffusion-controlled allotriomorphic transformation, the massive transformation process is presumed to be interface-controlled. Once thermally activated, a small number of nuclei grow, and not until these growing grain-boundaries of massive ferrite impinge on one another does the transformation stop. During the cooling process, the growing massive ferrite can even cross into several prior austenite grains, leading to indistinguishable parent austenite boundaries [
33]. Rapid growth, involving the movement of high-energy incoherent interfaces, is another characteristic of massive transformation [
32]. There is no orientation preference for the growth of massive transformation, and the grain preferably grows along the temperature gradient. The orientation-free and incoherent interfaces lead to the massive ferrite grains with irregular boundaries. The resulting microstructure in steels is referred to as massive ferrite [
12,
24,
25]. To distinguish it from polygonal ferrite, some researchers [
26,
27,
28,
29] just term it quasi-polygonal ferrite.
Some previous works [
31,
32] on the in-situ investigation of phase transformation in interstitial-free (IF) steels offered another viewpoint to elucidate massive ferrite. In the work [
31], isothermal treatments were conducted after austenitization so as to produce the diffusional products without the displacive products. However, because both allotriomorphic and massive ferrite are reconstructive transformation phases, both can form during the phase transition process at a low cooling rate, and the microstructures are a mixture of allotriomorphic and massive ferrite, leading to the atypical massive ferrite morphology. Another work [
34] showed that the morphology of the ferrite gradually changed from smooth to severely ragged with increases in the cooling rate. Obviously, the allotriomorphic ferrite formed first, followed by massive ferrite. As the cooling rate increased, diffusion-controlled allotriomorphic ferrite faded gradually, and the ferrite grain boundaries became severely ragged, indicating the occurrence of the interface-controlled massive ferrite. Under observation by high temperature optical microscopy, it was clear that both diffusion-control and interface-control took part in the transformation process simultaneously instead of separately [
35].
From the results of previous studies, it is known that allotriomorphic ferrite competes with massive transformation when the austenite transforms to ferrite at a low cooling rate. Therefore, for the study of massive ferrite, a specific high cooling rate is required to form massive ferrite without interfering with allotriomorphic ferrite [
36]. With different austenitization temperatures, the performance of massive ferrite nucleation was revealed. In that work [
36], despite the revelation of massive ferrite microstructure, the details about the dislocation structure were not clear. Thus, they deserve more careful characterization by TEM investigation. The dislocation structure in massive ferrite is an important issue which has been discussed by many researchers [
18,
28,
37]. Roberts estimated and compared the dislocation densities in ferrite grains [
18]. Although he suggested more defects of the dislocations in massive transformation, the detailed method of dislocation density estimation was not mentioned. Shibata et. al. [
28] also reported that the dislocation density was much higher in massive ferrite than in allotriomorphic ferrite, and that dislocations sometimes accumulated in the matrix of massive ferrite. Aaronson et al. [
35] investigated massive transformation and noted the high dislocation density in massive transformation. They claimed that the growth of massive ferrite was accomplished by a random jump across massive/austenite boundaries.
In the present work, massive ferrite was produced through laser welding and compared with allotriomorphic ferrite in the base plates. To understand the substructures, scanning electron microscopy–electron backscatter diffraction (SEM-EBSD) analysis was conducted to elucidate the misorientation within the massive ferrite grain. In addition, kernel average misorientation (KAM) analysis, an advanced characterization method, was performed, and detailed TEM images of massive and allotriomorphic ferrite were compared. Dislocation structures were clearly observed with the exact-zone condition under high-angle annular dark field scanning-transmission electron microscopy (STEM), and the dislocation density was estimated precisely.
3. Results and Discussion
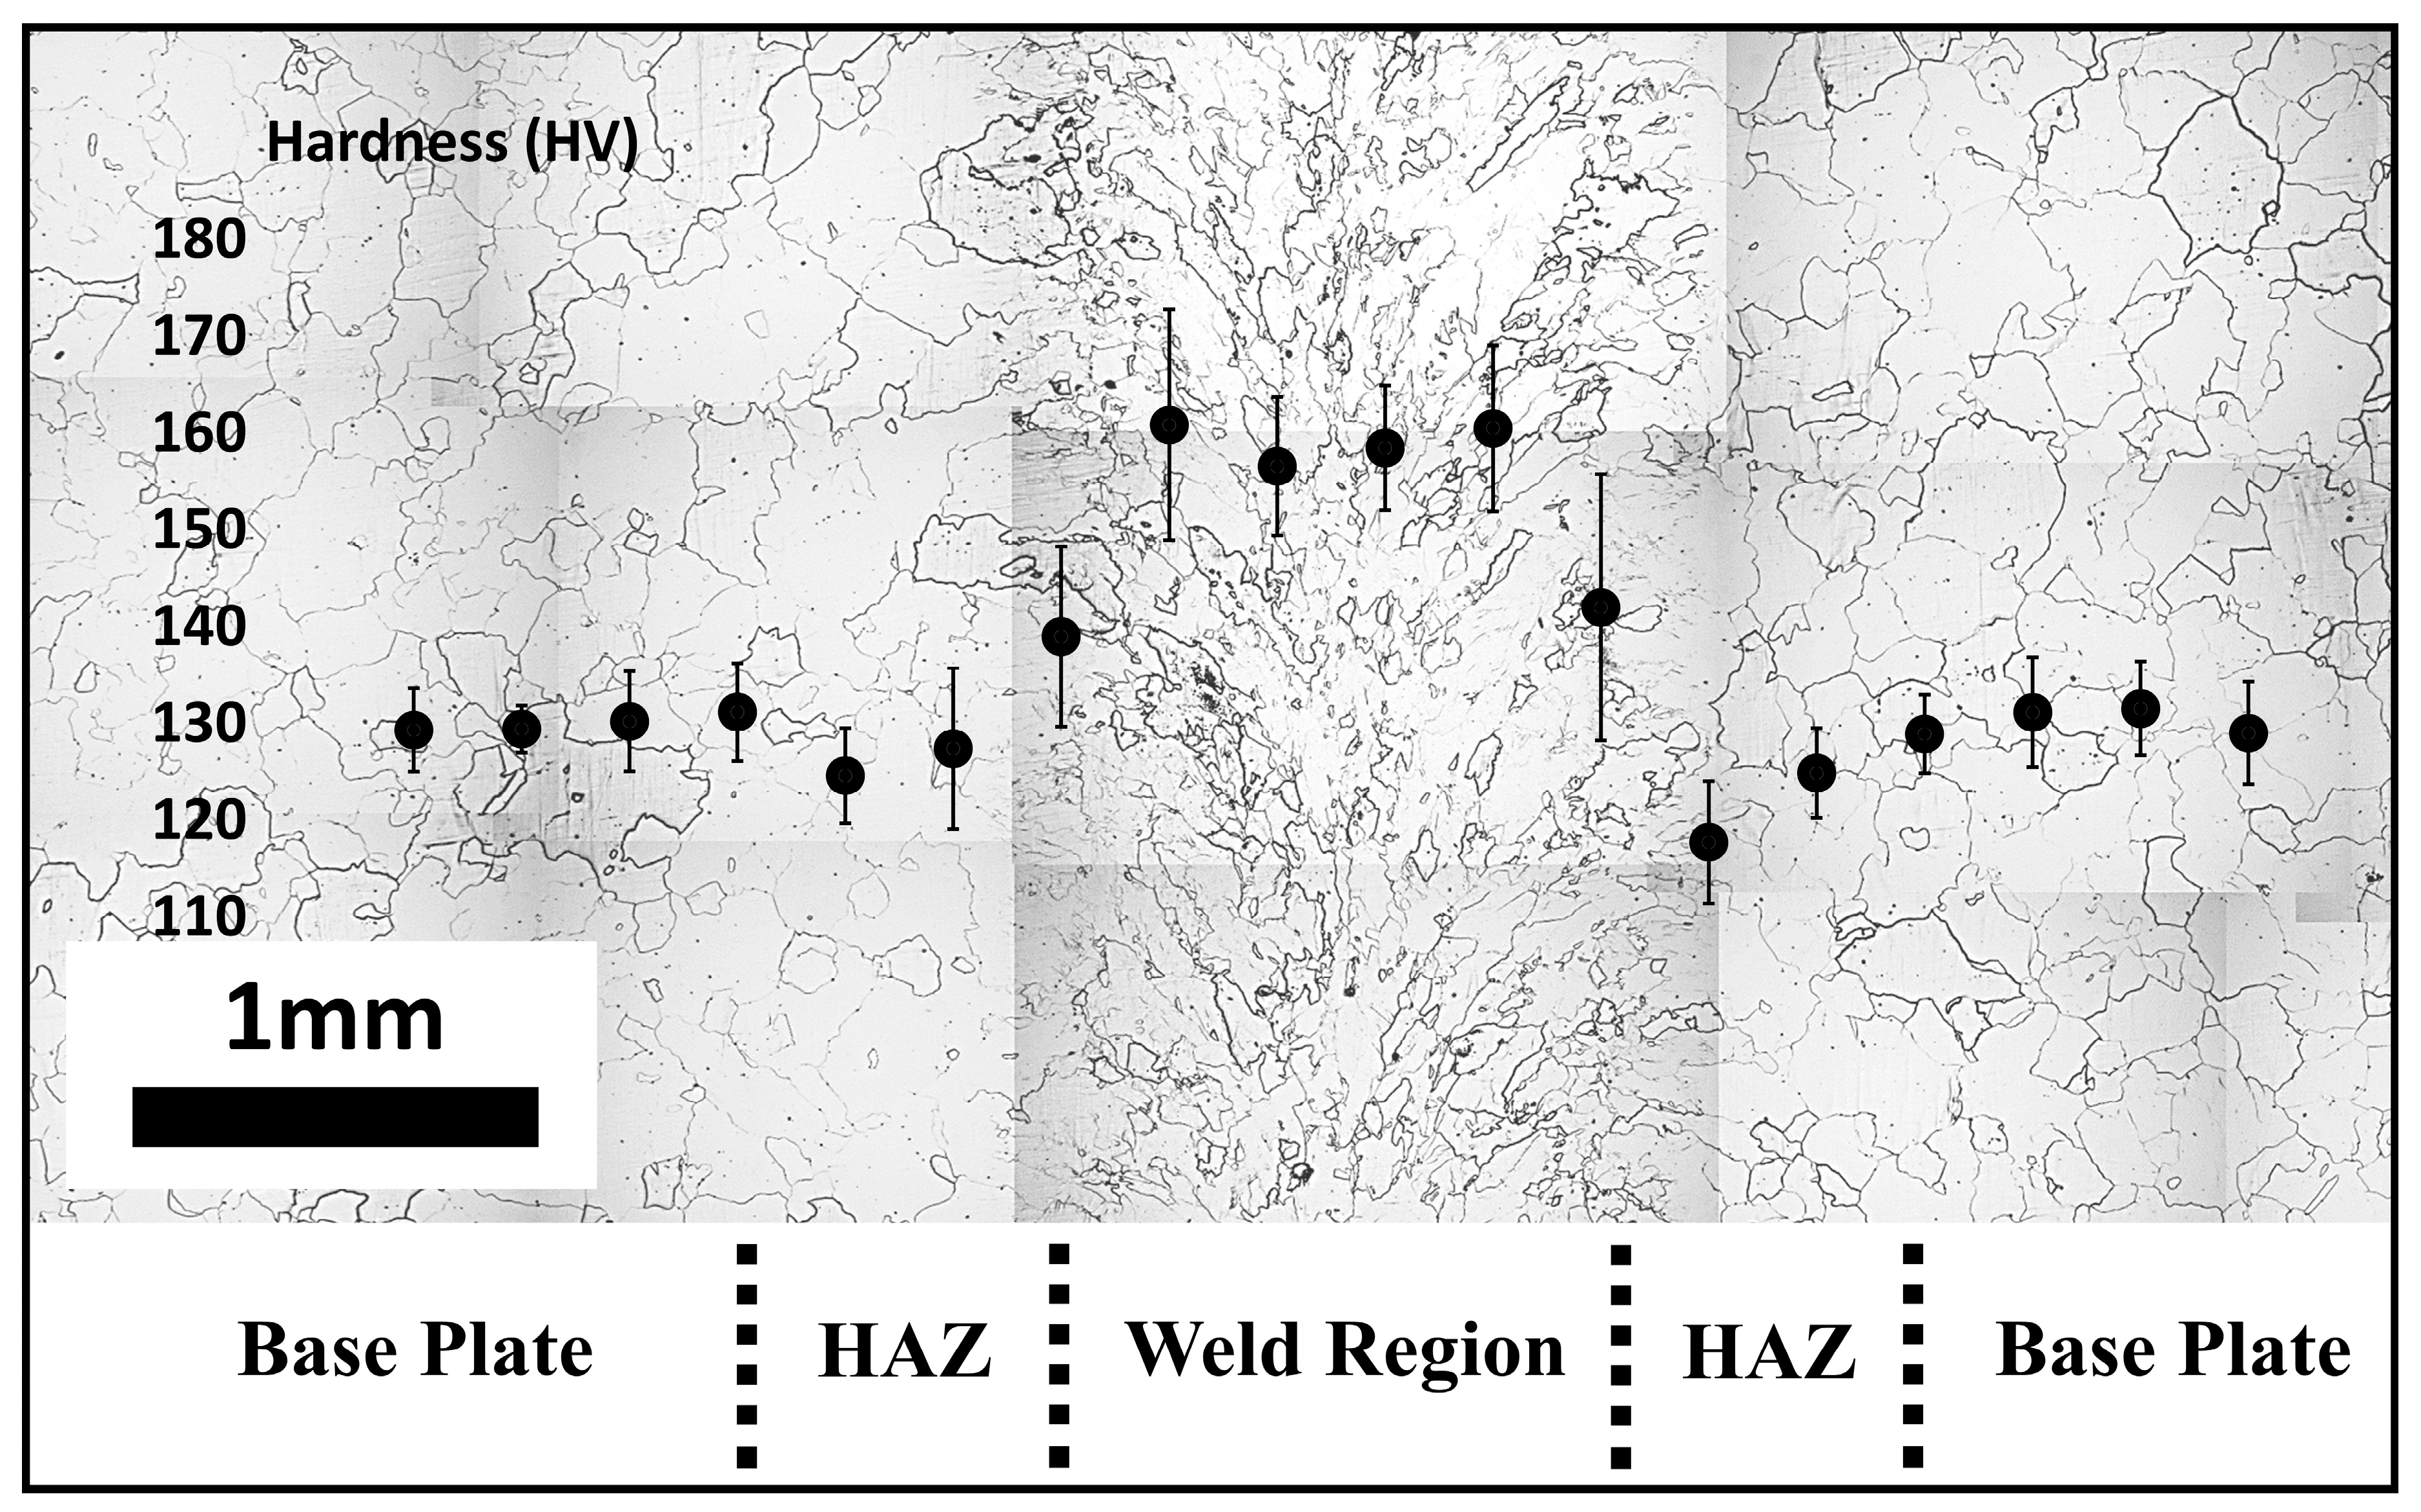
A plane-view optical micrograph of a sample of Steel A after welding is shown in
Figure 1, which presents the weld region, heat-affected zone (HAZ), and base plate. After the weld region dropped to a temperature sufficient to nucleate massive ferrite during the cooling of the laser weld process, massive ferrite grains grew along the temperature gradient, which followed the moving direction of the laser beam, from top to bottom, as presented in the middle region of
Figure 1. The profile of Vickers hardness (ranging from HV 120 to 170), with a bar for the standard deviation value, is also displayed in each corresponding area of
Figure 1. The hardness of massive ferrite in the weld region was much higher than that of allotriomorphic ferrite in the base plate. The hardness of the massive ferrite in the middle region of the weld was 158 ± 6 HV, as compared with the hardness of 130 ± 4 HV of the allotriomorphic ferrite in the base plate. However, the allotriomorphic ferrite in the heat affected zone was tempered, and its hardness was slightly lower than that of the allotriomorphic ferrite in the base plate.
The cross-section observations of the optical micrographs of samples A and B are shown in
Figure 2. The effects of different phosphorous additions in samples A and B on the corresponding microstructural evolution were investigated. Optical micrographs of allotriomorphic ferrite in the base plates of Steels A and B are shown in
Figure 2a,b, respectively. The allotriomorphic ferrite was equiaxed, had smooth, continuous boundaries, and had no substructures within the grains. It was noted that the ferrite grain size decreased with larger phosphorous additions. In the weld, massive ferrite appeared in both samples, as shown in
Figure 2c,d. In addition to having irregular boundaries and substructures, the massive grains became finer with a higher addition of phosphorous. The Vickers hardness of the allotriomorphic ferrite in Steel A was 130 ± 4 HV, and that in Steel B, 132 ± 5 HV. The Vickers hardness of massive ferrite in Steel A was 158 ± 6 HV, and that in Steel B, 161 ± 7 HV. According to the supplementary material 1 in [
36], the continuous cooling transformation (CCT) curve could be interpreted for reference. The morphologies of ferrite were compared with different cooling rates. After comparison of the massive ferrite structures in the weld region in samples A and B with the reference, the cooling rate was about 50 °C/s.
To elucidate the substructures of massive ferrite displayed in the optical micrographs in
Figure 2, SEM-EBSD analysis was conducted, and the misorientation distribution within the massive ferrite grain was thereby analyzed. The allotriomorphic ferrite observed under SEM and TEM came from the base plate without any heat treatment. Its grains presented large grains with smooth boundaries. On the other hand, massive ferrite appeared with high cooling rate and presented with irregular boundaries. In order not to confuse with the structures in HAZ region, massive ferrite observed under SEM and TEM were carefully cut near the center surface of the weld region (only remove the oxide in the surface). According to
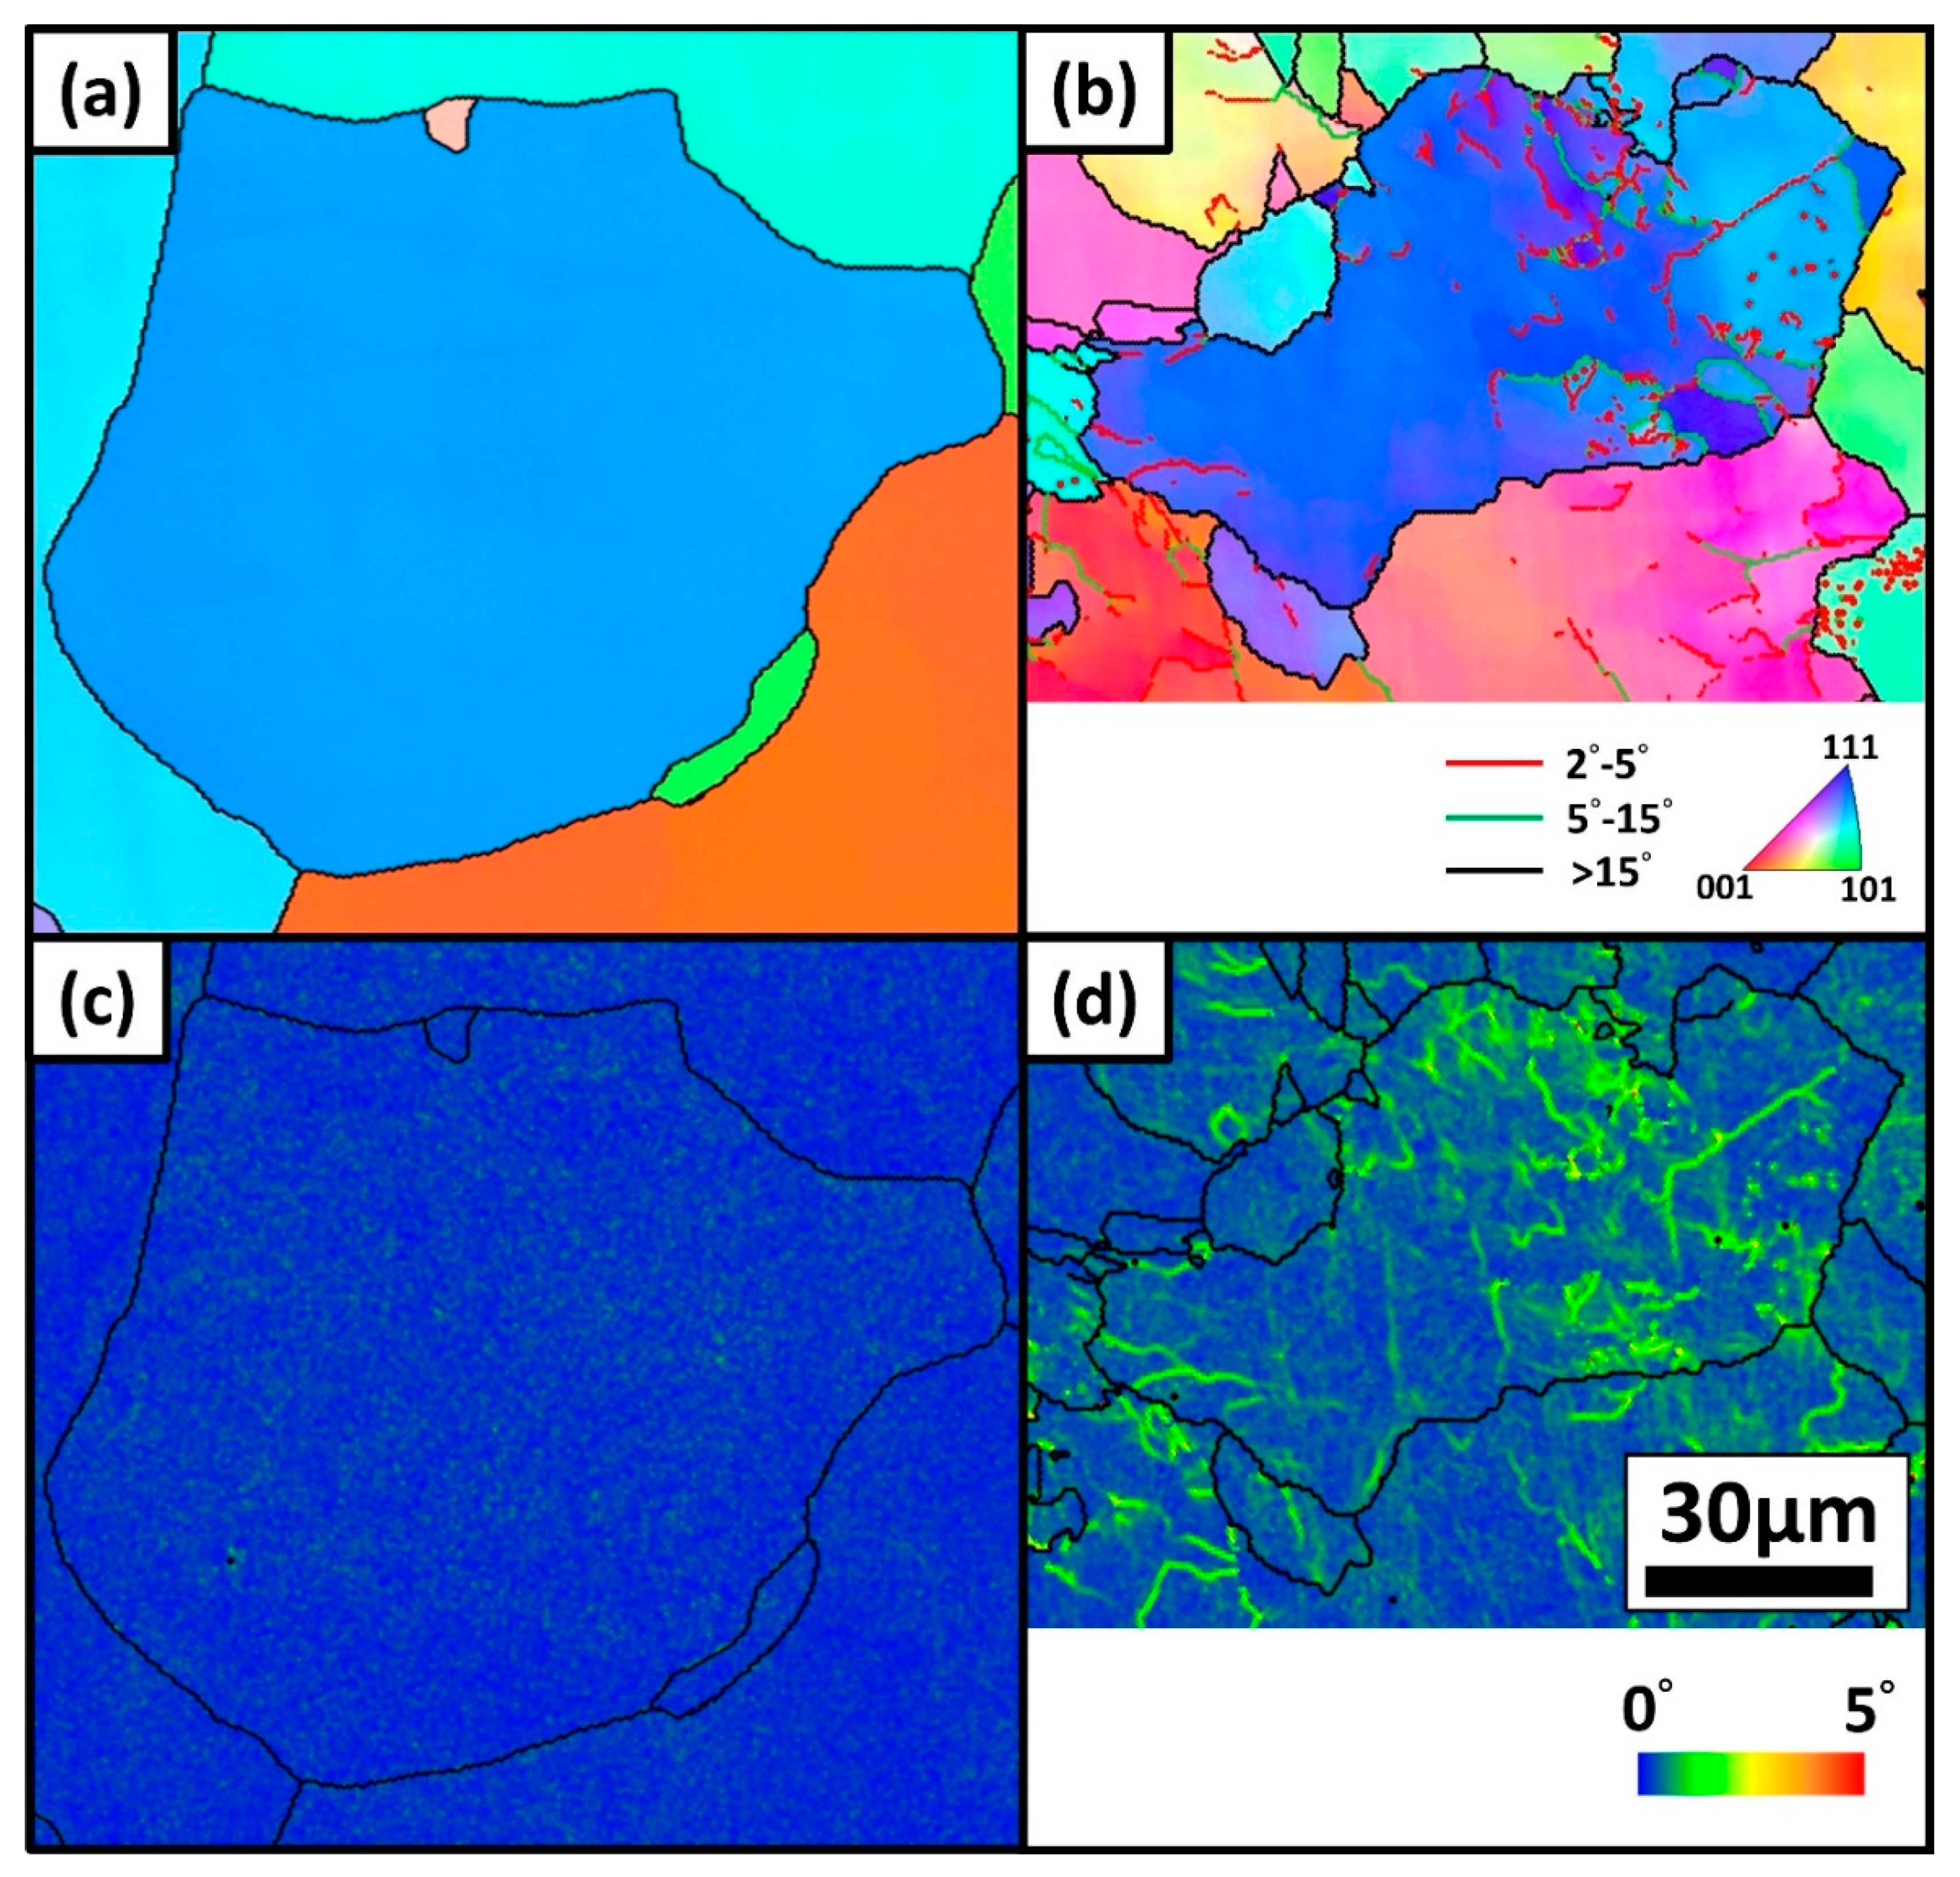
Figure 1, the microstructures of massive ferrite distributed about 1mm wide, so the samples obtained near the center surface of the weld region could promise the massive ferrite observation. To acquire clear enough data with limited time, a step size of 0.2 μm was chosen for the SEM-EBSD. In addition, the allotriomorphic ferrite in the base metal and the massive ferrite in the weld were compared. The SEM-EBSD results of Steel A were first analyzed by inverse pole figures (IPF). Allotriomorphic and massive ferrite in Steel A are respectively shown in
Figure 3a,b. Orientation differences of 2° to 5° are marked with red lines; those of 5° to 15°, with green lines; and those of over 15°, with thick black lines. In the base metal, the allotriomorphic ferrite was fully annealed, and no substructure was detected. It is presumed that as allotriomorphic ferrite formed, the strain could be accommodated at the grain boundary by the slow-moving interface. In addition, the accommodating strain within the allotriomorphic ferrite grains could be relieved at high temperature during the transformation of austenite to allotriomorphic ferrite. As a result, the IPF of allotriomorphic ferrite had no low-angle boundaries but did have a homogeneous color, as shown in
Figure 3a. However, massive ferrite was produced at the high cooling rate, and the rapid growth of the massive ferrite caused the strain to remain in the matrix. To relieve the resulting strain energy, numerous dislocations were thereby produced. Because the transformation process of massive ferrite was completed at a high temperature, these defects were recovered and formed low-angle boundaries. The IPF of massive ferrite showed that most sub-boundaries had small misorientation angles of about 2° to 5° (indicated by red lines), but a few had slightly-large misorientation angles of about 5° to 15° (indicated by green lines). This distinctive IPF of massive ferrite could be clearly distinguished from that of allotriomorphic ferrite. On the other hand, KAM analysis was also used to analyze the allotriomorphic and massive ferrite in the samples of Steel A, as shown in
Figure 3c,d. First, the local regions with orientation differences of greater than 15° were marked with coarse black lines and considered grain boundaries. Afterwards, KAM analysis, with a step size of 0.2 μm and a Kernel size of 1, was executed, and orientation differences between 0° and 5° were represented by gradation (as indicated by the color bar in
Figure 3d). The chaos in the KAM analysis represented the extent of misorientation within the grain of the massive ferrite. In the allotriomorphic ferrite (
Figure 3c), the grain was an almost homogeneous blue, representing little misorientation. In contrast, the chaotic display within the massive ferrite grain is clearly shown in
Figure 3d. The high number of fine gray lines, or substructures, within the massive ferrite grains could be observed in optical micrographs (as shown in
Figure 2c). Through KAM analysis, the low-angle boundaries within the massive ferrite were discerned, and the substructures within the massive ferrite grains in the optical micrograph could, thus, be explained. As the degree of the misorientation angles increased, more chaos was observed in the crystal in KAM (as shown in
Figure 3d).
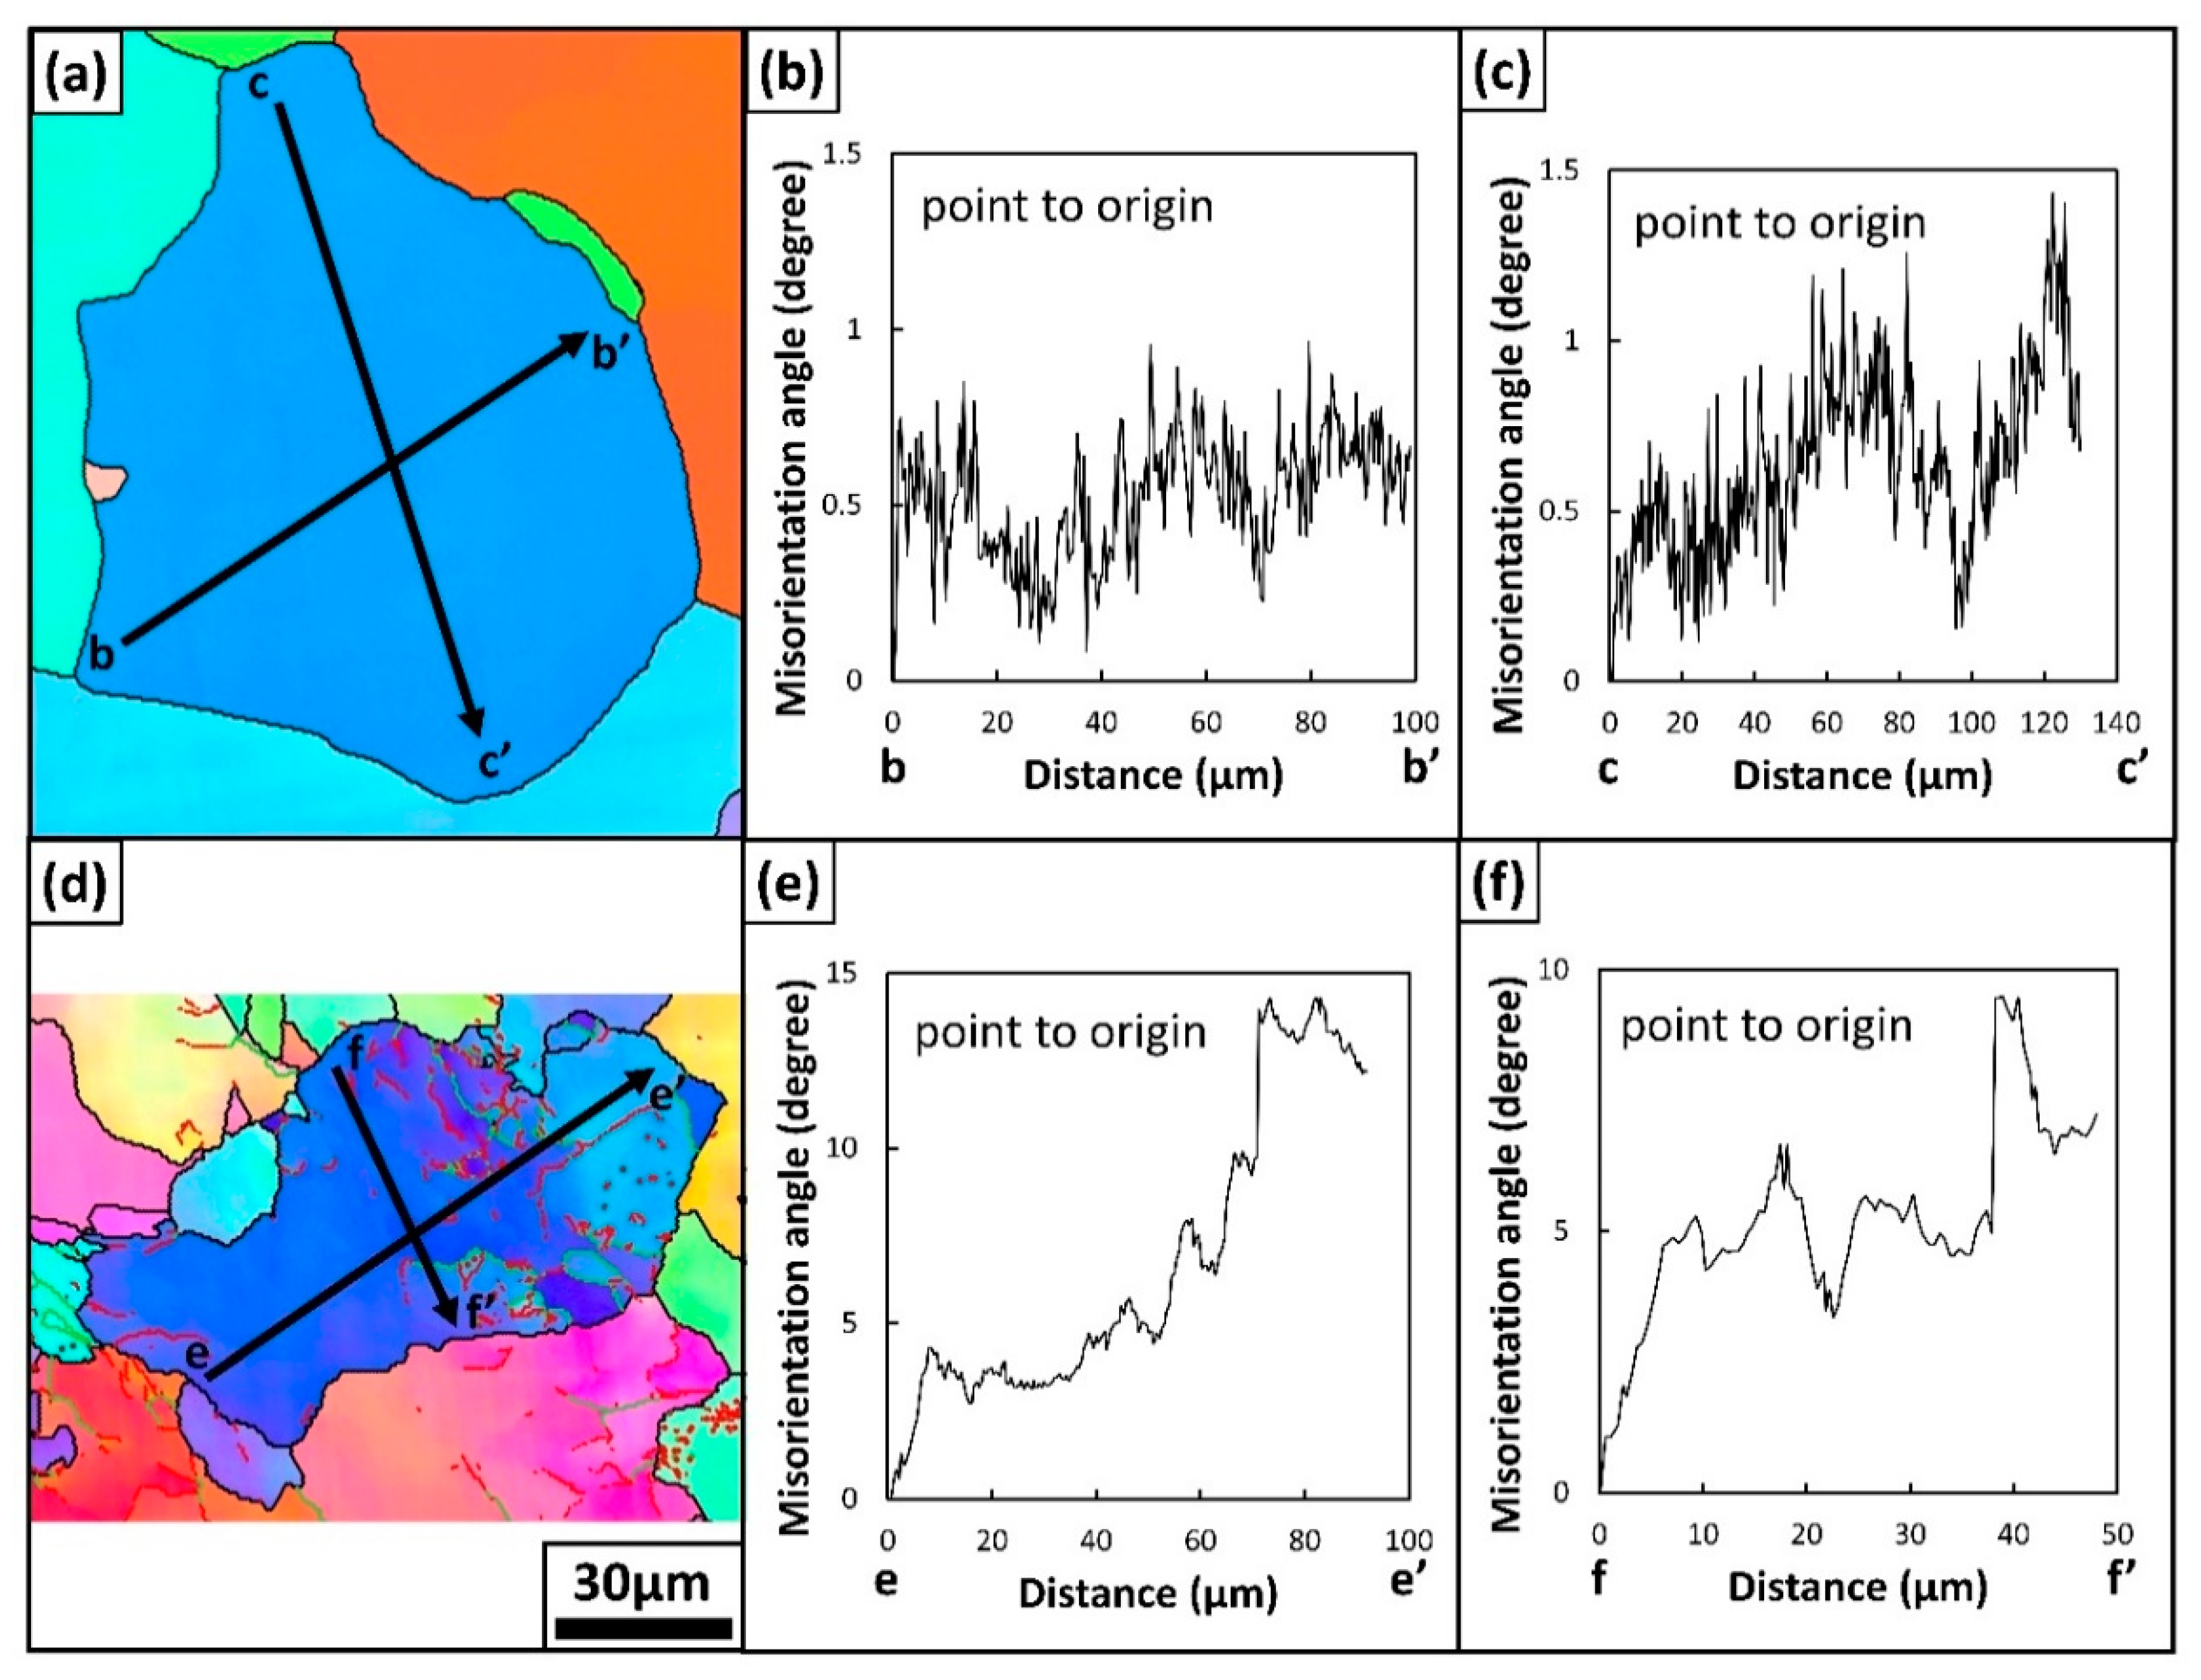
The SEM-EBSD misorientation profiles for allotriomorphic ferrite and massive ferrite in Steel A are shown in
Figure 4. In this work, the EBSD measurement using a step size of 200 nm showed the accumulated point-to-origin orientation differences: In
Figure 4b,c, along the lines b–b′ and c–c′ in the allotriomorphic ferrite (as shown in
Figure 4a); in
Figure 4e,f, along the lines e–e′ and f–f′ in the massive ferrite (as shown in
Figure 4d). For allotriomorphic ferrite in the base metal of Steel A, it was clear that almost all the orientations within the grain were the same, as shown in
Figure 4b,c. The orientations varied by less than 1.5° in both directions of the lines b–b′ and c–c′, indicating that the allotriomorphic ferrite had no low-angle boundaries. On the other hand, the great variation of the orientation within the massive ferrite in the weld region of the Steel A was obvious, as shown in
Figure 4e,f. The orientation changed by about 10° for a measured distance of about 50 μm in both in both directions of the lines e–e′ and f–f′, which suggested a great amount of variation in orientation within the massive ferrite grain.
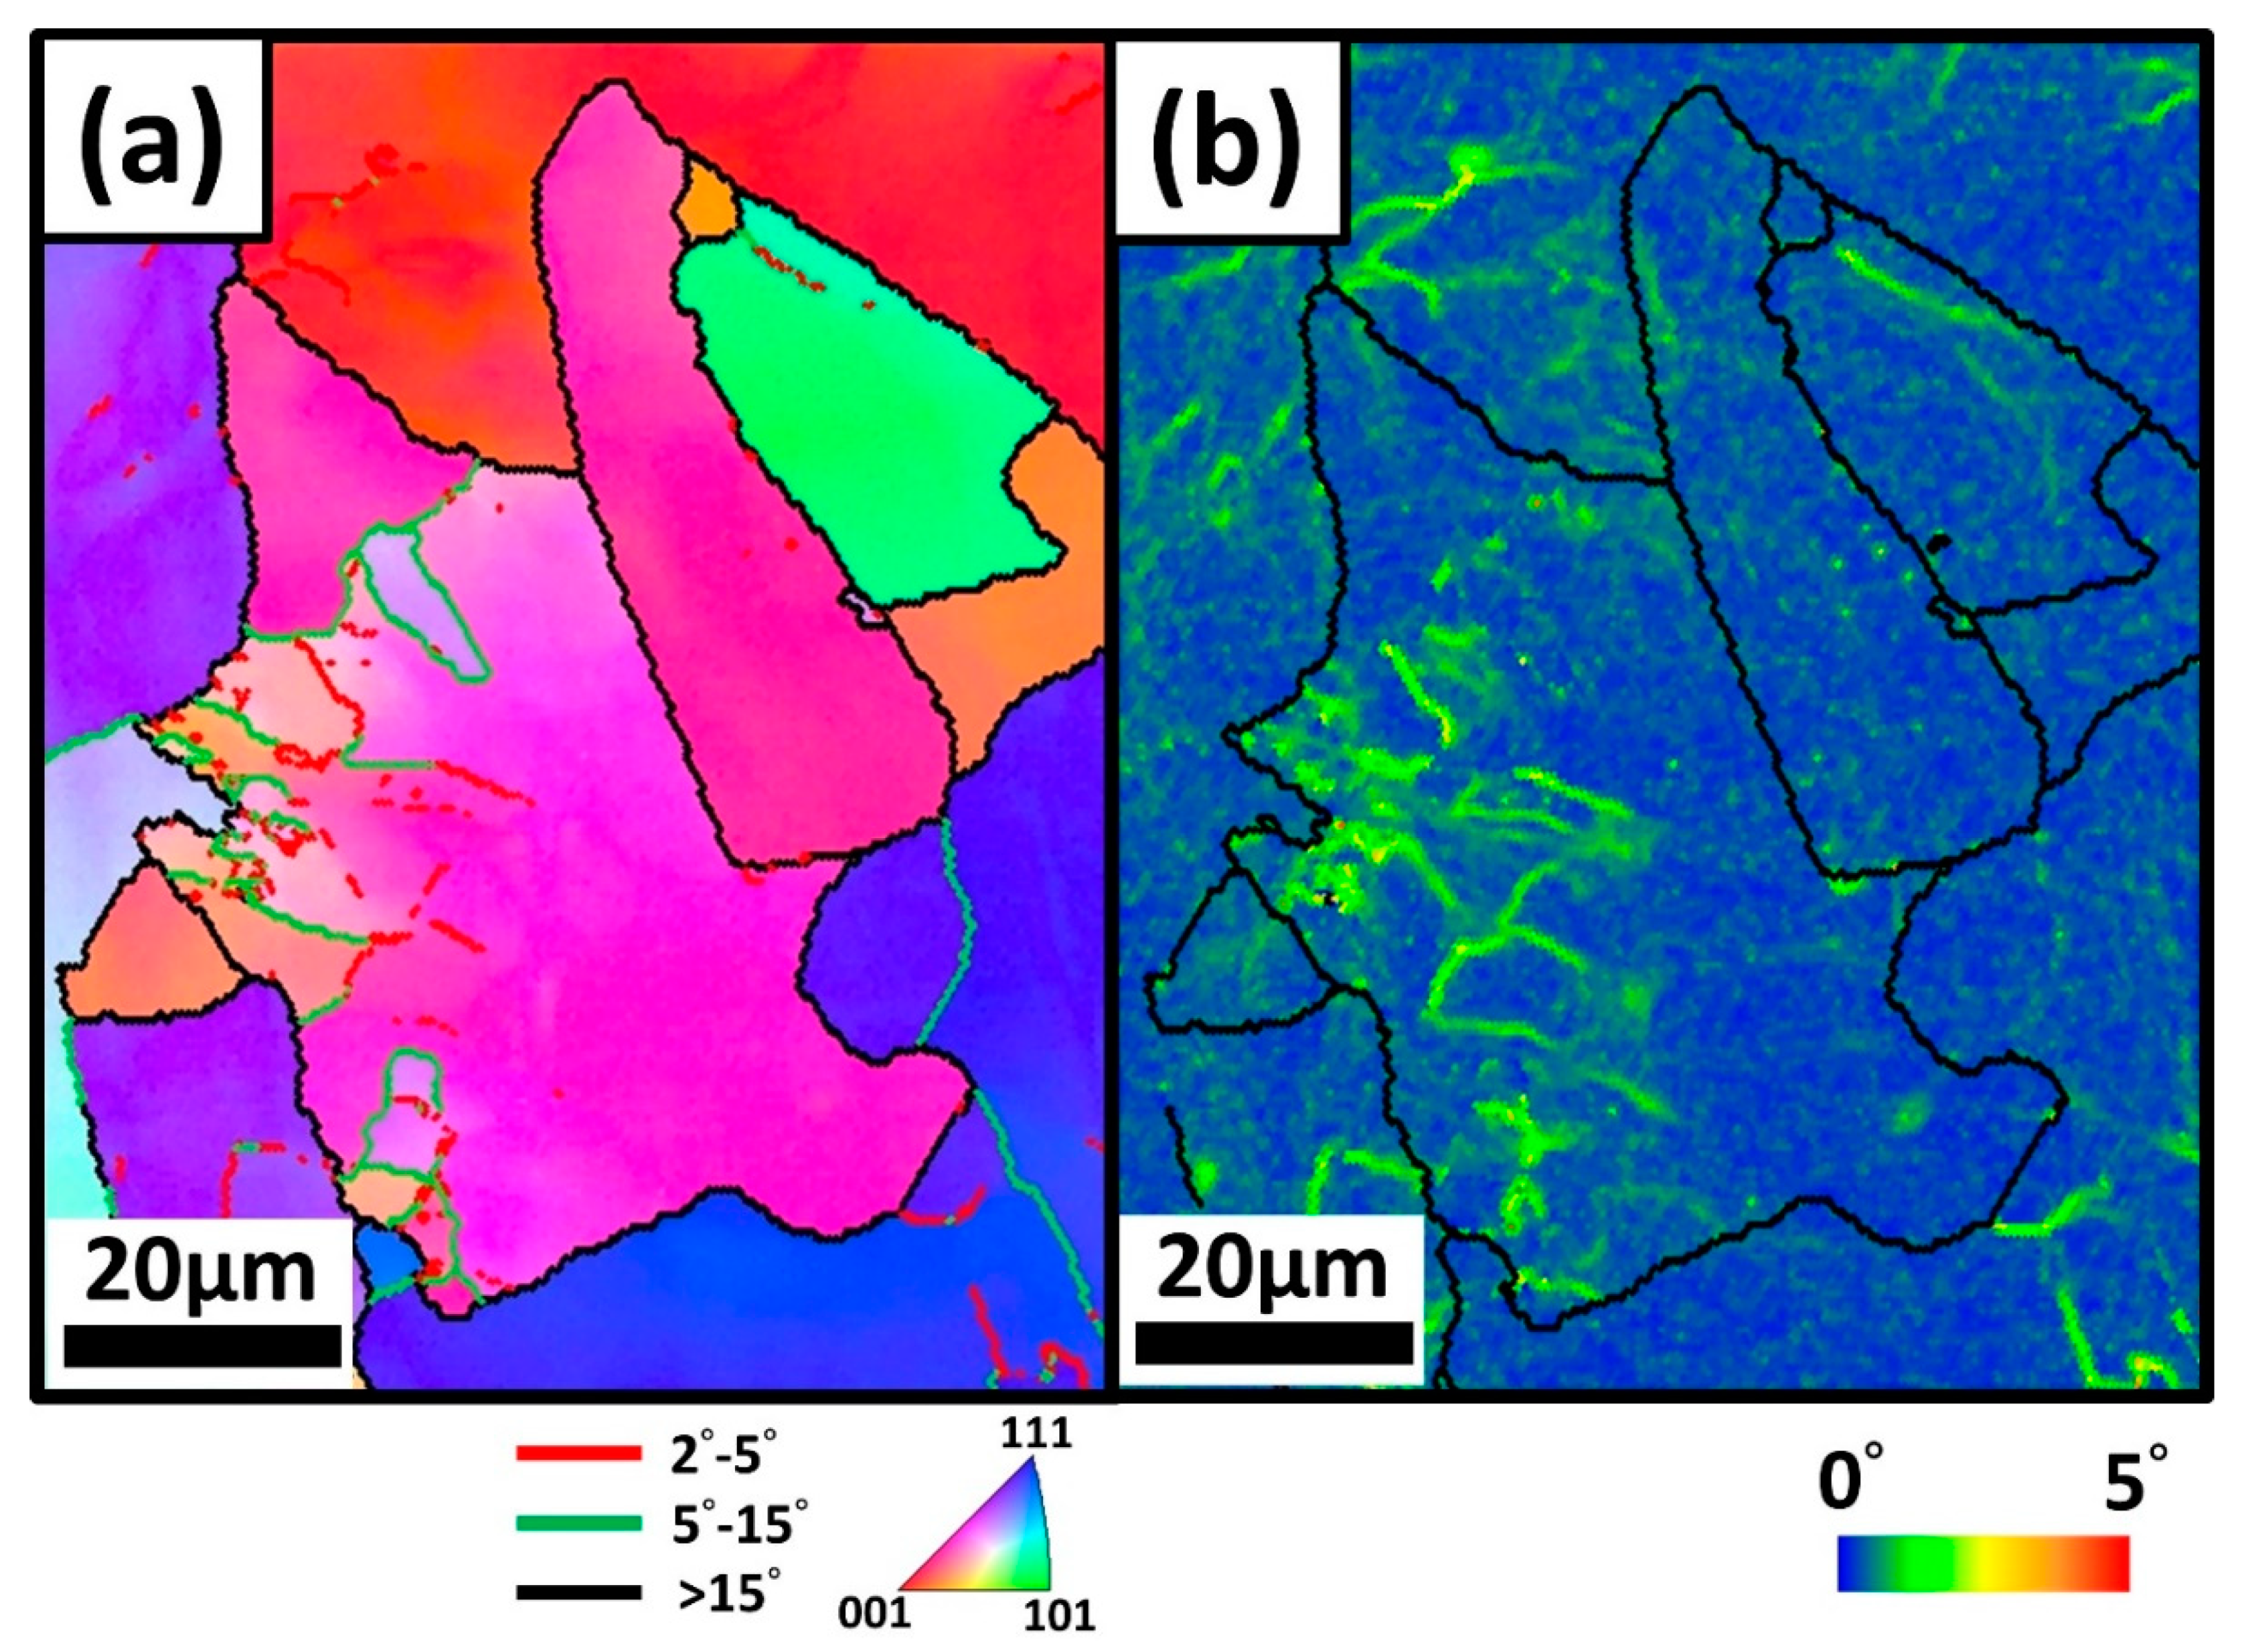
The inverse pole figure of massive ferrite in Steel B is shown in
Figure 5a. Orientation differences of 2° to 5° are marked with red lines; those of 5° to 15°, with green lines; and those exceeding 15°, with thick black lines. Although the grain size of massive ferrite in Steel B became smaller because of the greater addition of phosphorous, many low-angle boundaries still could be identified within the grains of massive ferrite in Steel B. The reason was the same as that for the formation of massive ferrite in Steel A. The distinctive microstructures resulting from the relieved strain were a significant characteristic that distinguished massive ferrite from allotriomorphic ferrite. The kernel average misorientation analysis of the massive ferrite in Steel B is shown in
Figure 5b. Similarly, the chaotic display of the massive ferrite can easily be seen.
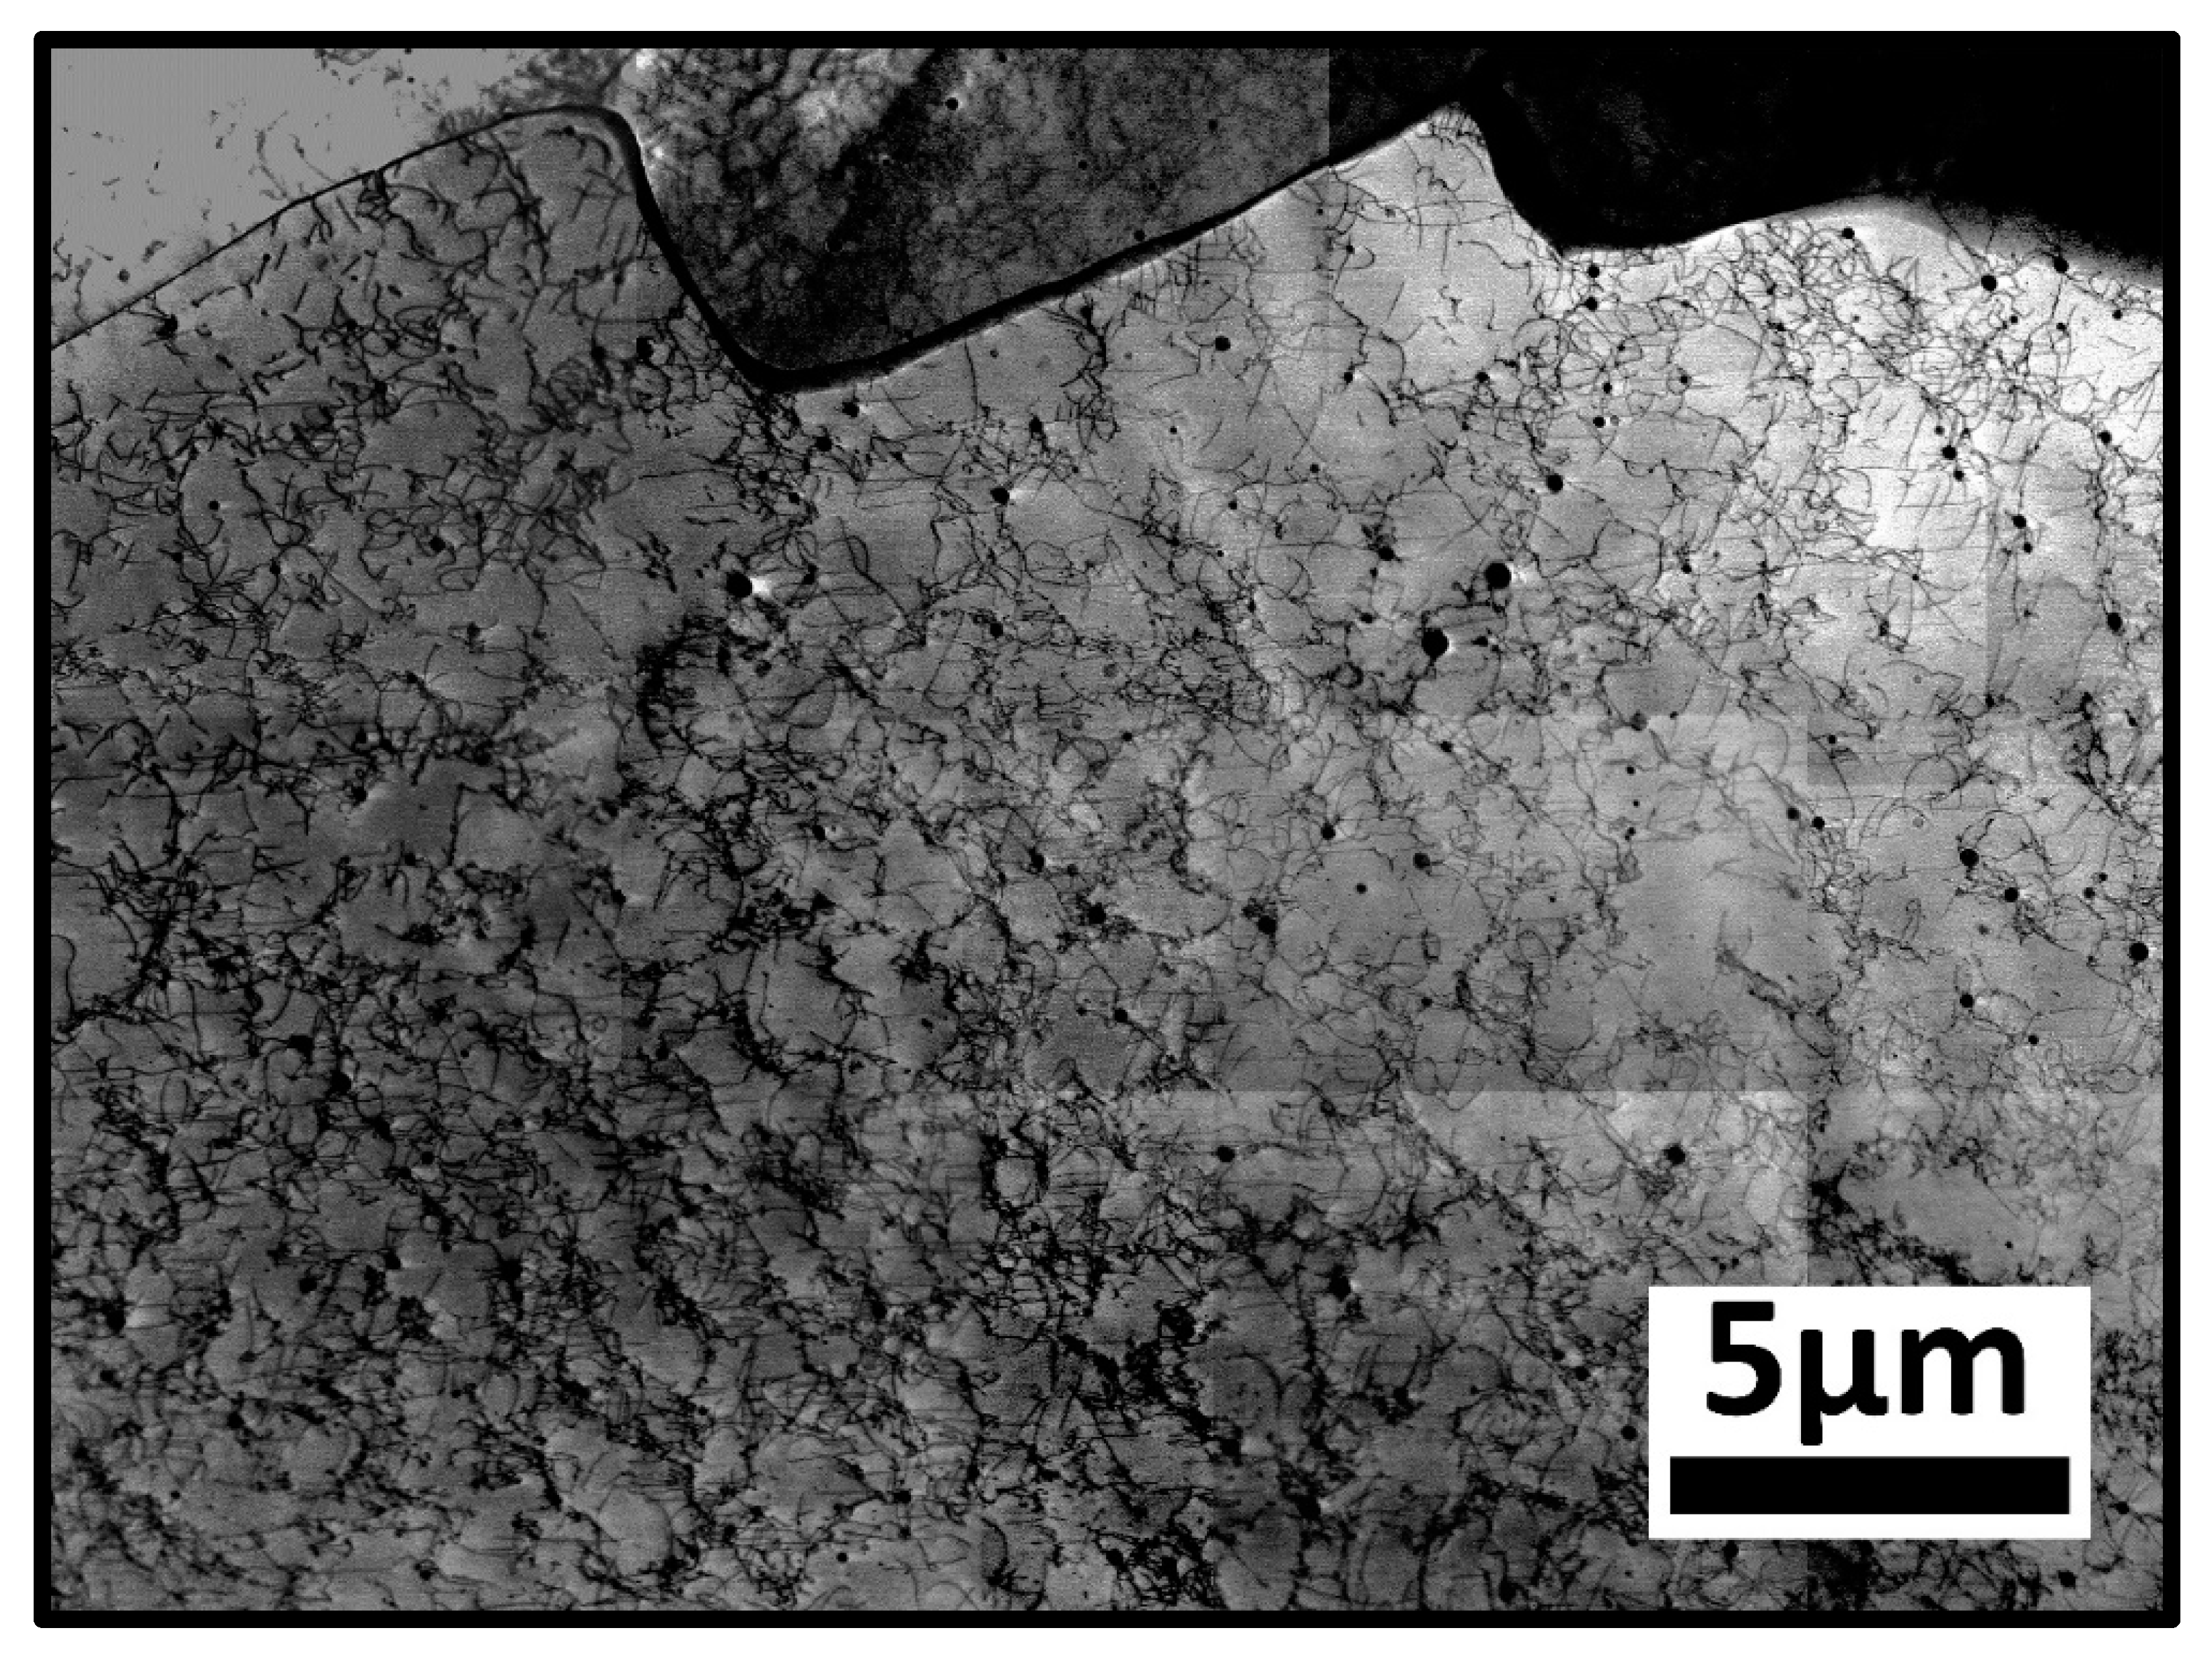
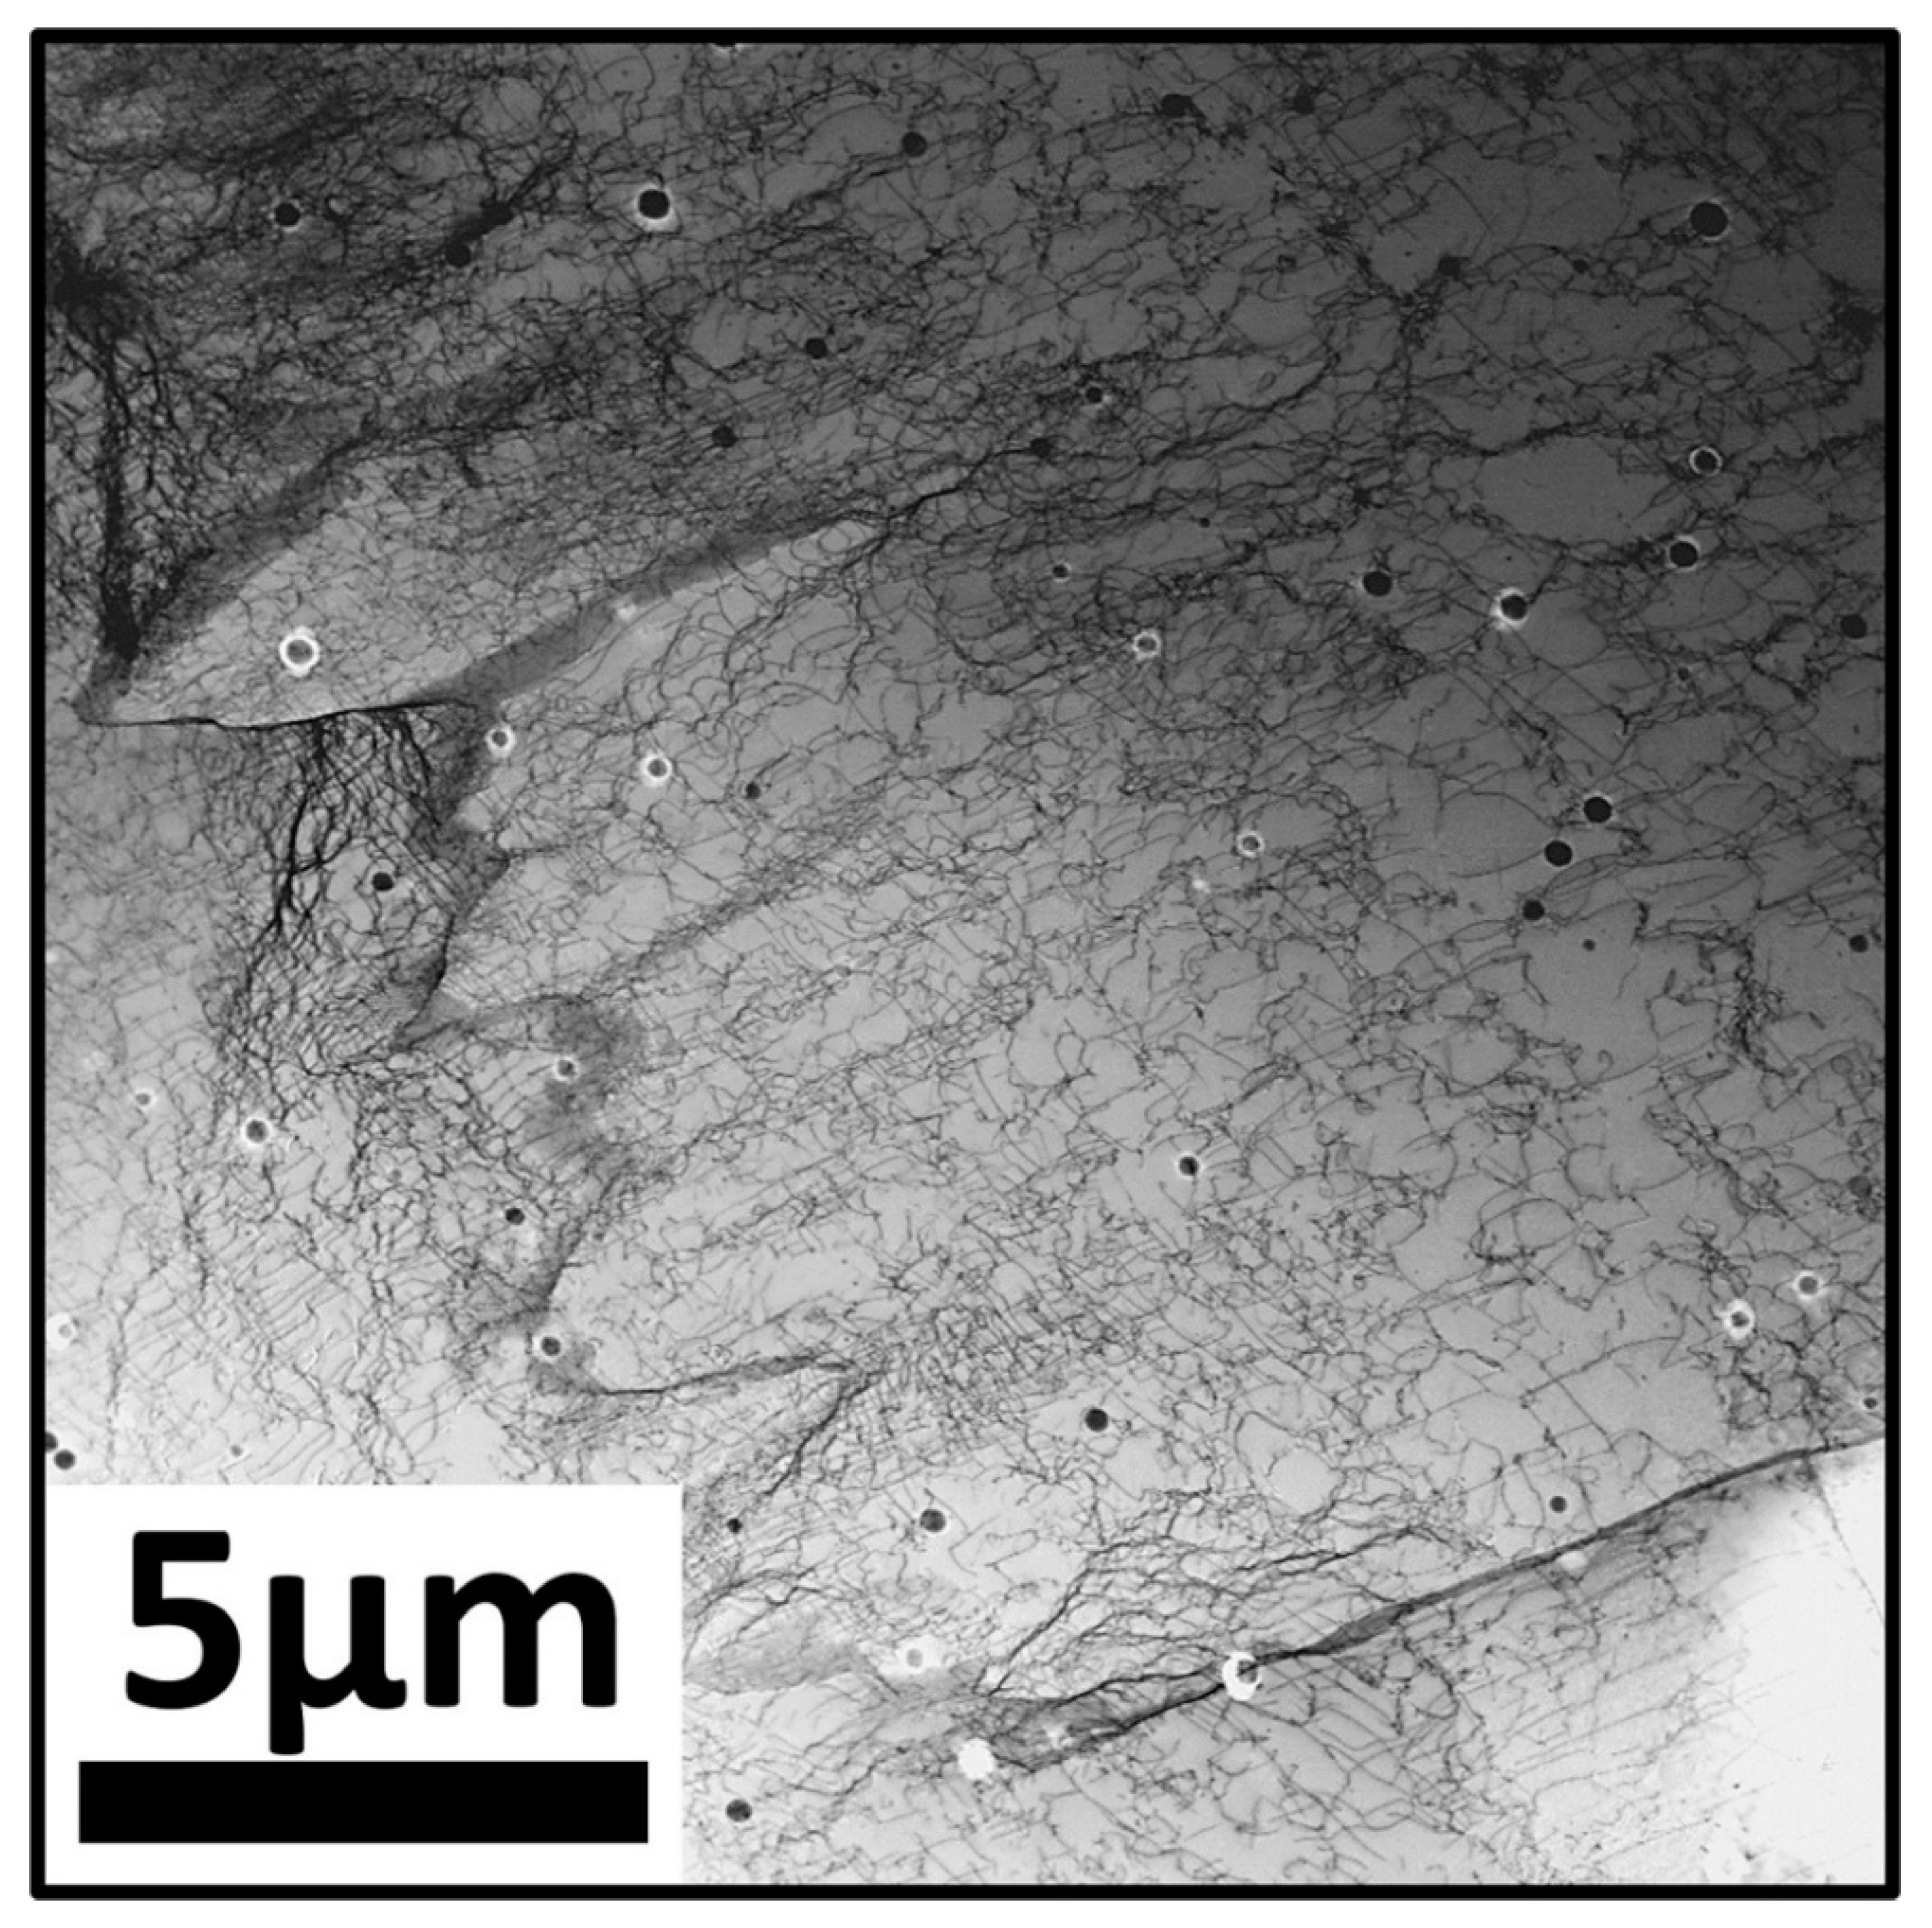
To characterize the microstructure of massive ferrite and explore the reason why the substructures formed, samples of both steels were observed by TEM. TEM images of massive ferrite taken from the samples of Steel A and B are shown in
Figure 6 and
Figure 7. Here, the characteristics of the massive ferrite are resolved more clearly. During the austenite to ferrite transformation, the composition invariance allowed the massive ferrite to grow fast. As the transformation interface met the inclusions, which were formed in the weld pool, the growth rate of massive ferrite slowed down. However, unimpeded migration boundaries still maintained fast growth. The rapid growth of massive ferrite caused strain in the matrix, which was relieved by the production of dislocations. As a result, grains with irregular boundaries containing numerous dislocations appeared and became a typical feature of massive ferrite. Based on the dilatometer results in a previous work [
36], the massive ferrite in Steel A formed at about 650 °C and was subjected to tempering during the cooling phase. Therefore, the accumulated dislocations in massive ferrite subsequently formed cell structures, which are the distinctive characteristic of massive ferrite. From the macroscopic point of view, the substructures, as observed by optical microscopy (OM), were composed of accumulated dislocations that built up low-angle boundaries, as revealed by the SEM-EBSD analysis.
During the process of laser welding, the IF steel melted and solidified, which possibly caused a considerable amount of strain. After the solidification in IF steel is completed, the δ phase is formed first, and then the γ phase. It is presumed that due to the atomic reconstruction during the transformation of δ phase to γ phase at high temperatures, the strains in austenite of the IF steel should be removed immediately. As a result, the highly dense dislocations must result from the incoherent interphase interfaces in the rapid growth of massive ferrite formation. Purely involving the transformation from solid phase to solid phase, we found the similar dislocation structure in massive ferrite in an IF steel in our previous work [
36] on the formation of massive ferrite in an interstitial-free steel with three different austenitization conditions.
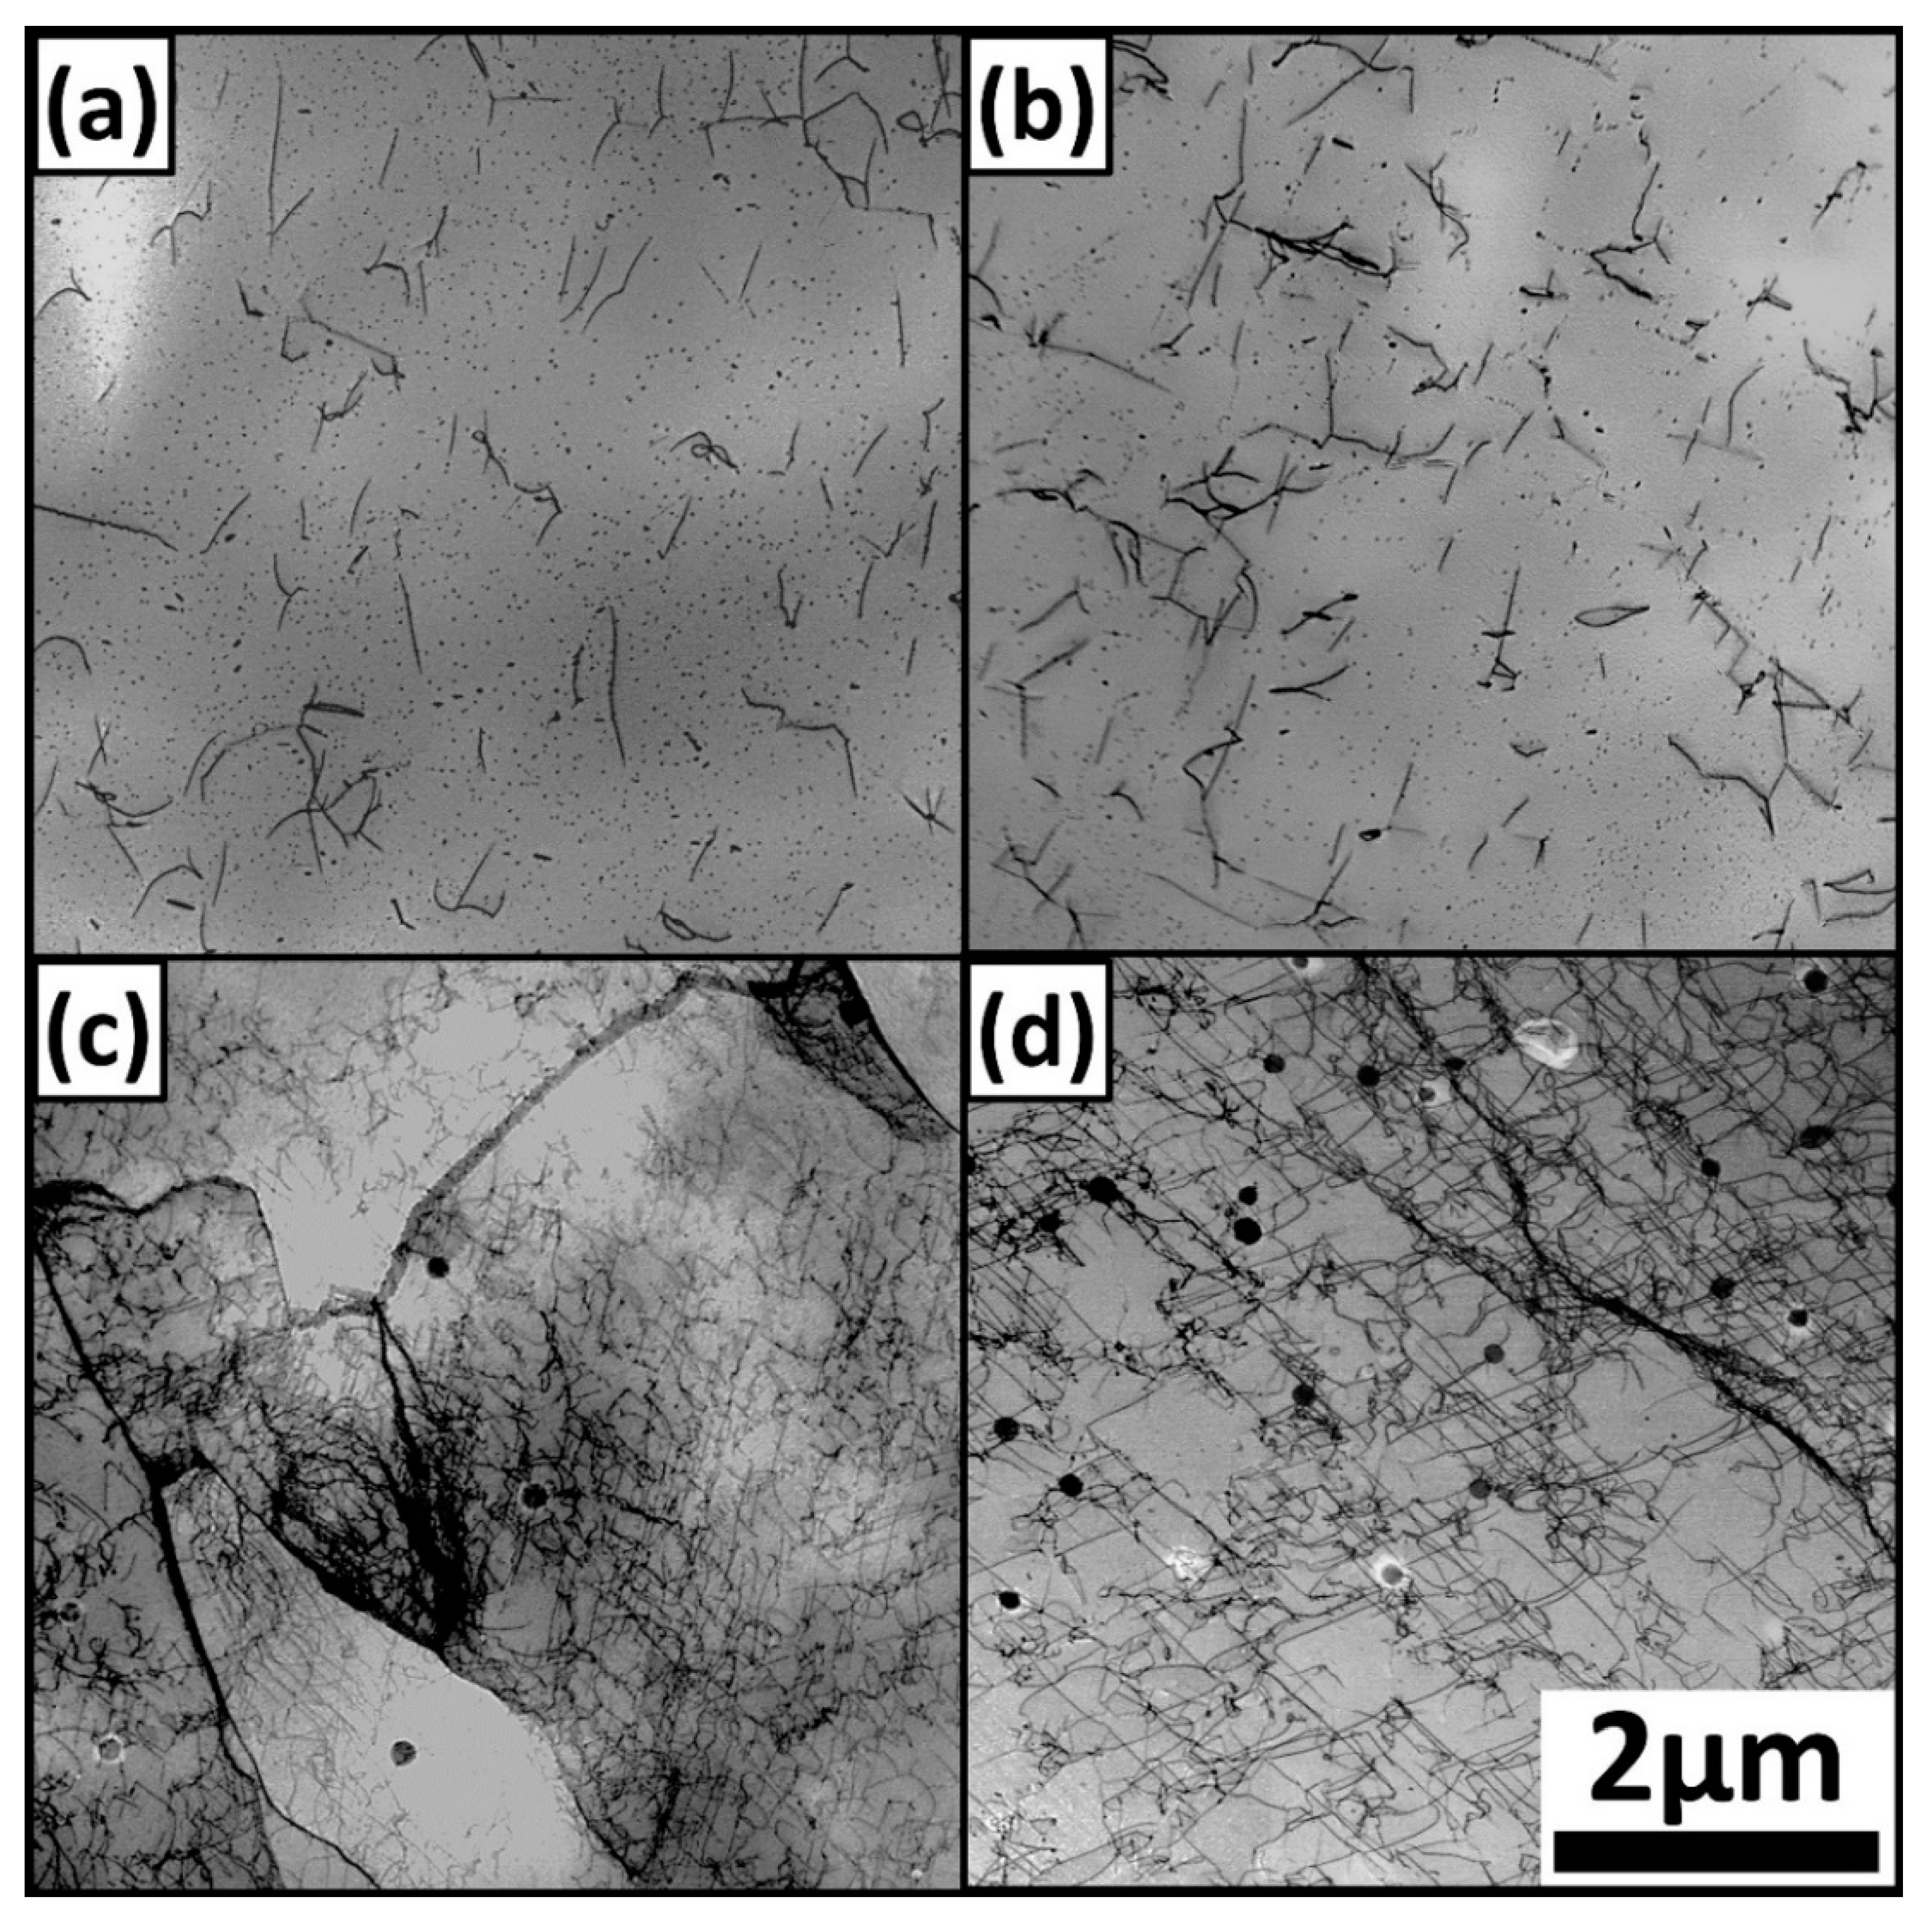
The TEM micrographs of the allotriomorphic and massive ferrite in Steels A and B are compared in
Figure 8. The remarkable difference between the allotriomorphic and massive ferrite was the amount of dislocations. The dislocation densities were estimated with the method proposed in a previous work [
38], and the thickness of the TEM thin foils was calculated using the log-ratio method by EELS [
39]. To resolve dislocations individually, the magnification of TEM images (using 10 micrographs in each case) was set larger than 50,000×. To clearly observe the dislocations in the bcc ferrite grains, the exact-zone conditions, <100>, <110> and <111>, were employed. Afterwards, by observation under scanning mode (STEM), clear dislocation structure images were collected with a high-angle annular dark field detector. The resulting data are shown in
Table 2. The dislocation density of the massive ferrite was much higher than that of the allotriomorphic ferrite, contributing to the higher hardness of the massive ferrite, as shown in
Figure 2. In addition, the phosphorous addition also increased the dislocation densities of allotriomorphic and massive ferrite in Steel B, which promoted the strength of the IF steels.
Although the allotriomorphic ferrite and massive ferrite were both stable at room temperature, their growth processes were different [
40]. Because of the different crystal structures of the parent (austenite) and product (ferrite) phases, the strain was released due to the volume change. The strain in the allotriomorphic ferrite was easily accommodated by the slow-growing grain boundaries; therefore, the strain energy was negligible during the growth of the allotriomorphic ferrite. However, in the massive ferrite, the fast growth caused the strain to remain in the matrix. To reduce the strain energy, numerous defects such as dislocations were produced, leading to the distinctive microstructures of the massive ferrite, which were unlike those of the allotriomorphic ferrite. Therefore, the massive ferrite possessed a higher dislocation density than the allotriomorphic ferrite did, as observed by TEM.


