2. Materials and Methods
In this study, Fe
balance-18Cr-7Mn-3Mo-3W-0.4N-based (in wt%) LDSSs containing different concentrations of Ni (0.03 and 0.57 wt%) were investigated. The Ni content needs to be adjusted to 0.6 wt% or less in order to prevent the solution treatment temperature from becoming too high. The detailed chemical compositions of the LDSSs, denoted as Ni03 and Ni57, are given in
Table 1, which were measured using optical emission spectroscopy (QSN 750-II, PANalytical, Almemo, the Netherlands) and inductively coupled plasma atomic emission spectroscopy (Optima 8300DV, PerkinElmer, Waltham, MA, USA).
The LDSS ingots of 10 kg were fabricated through pressurized induction melting (VIM 4 III-P, ALD Vacuum Technologies GmbH, Hanau, German) under an N
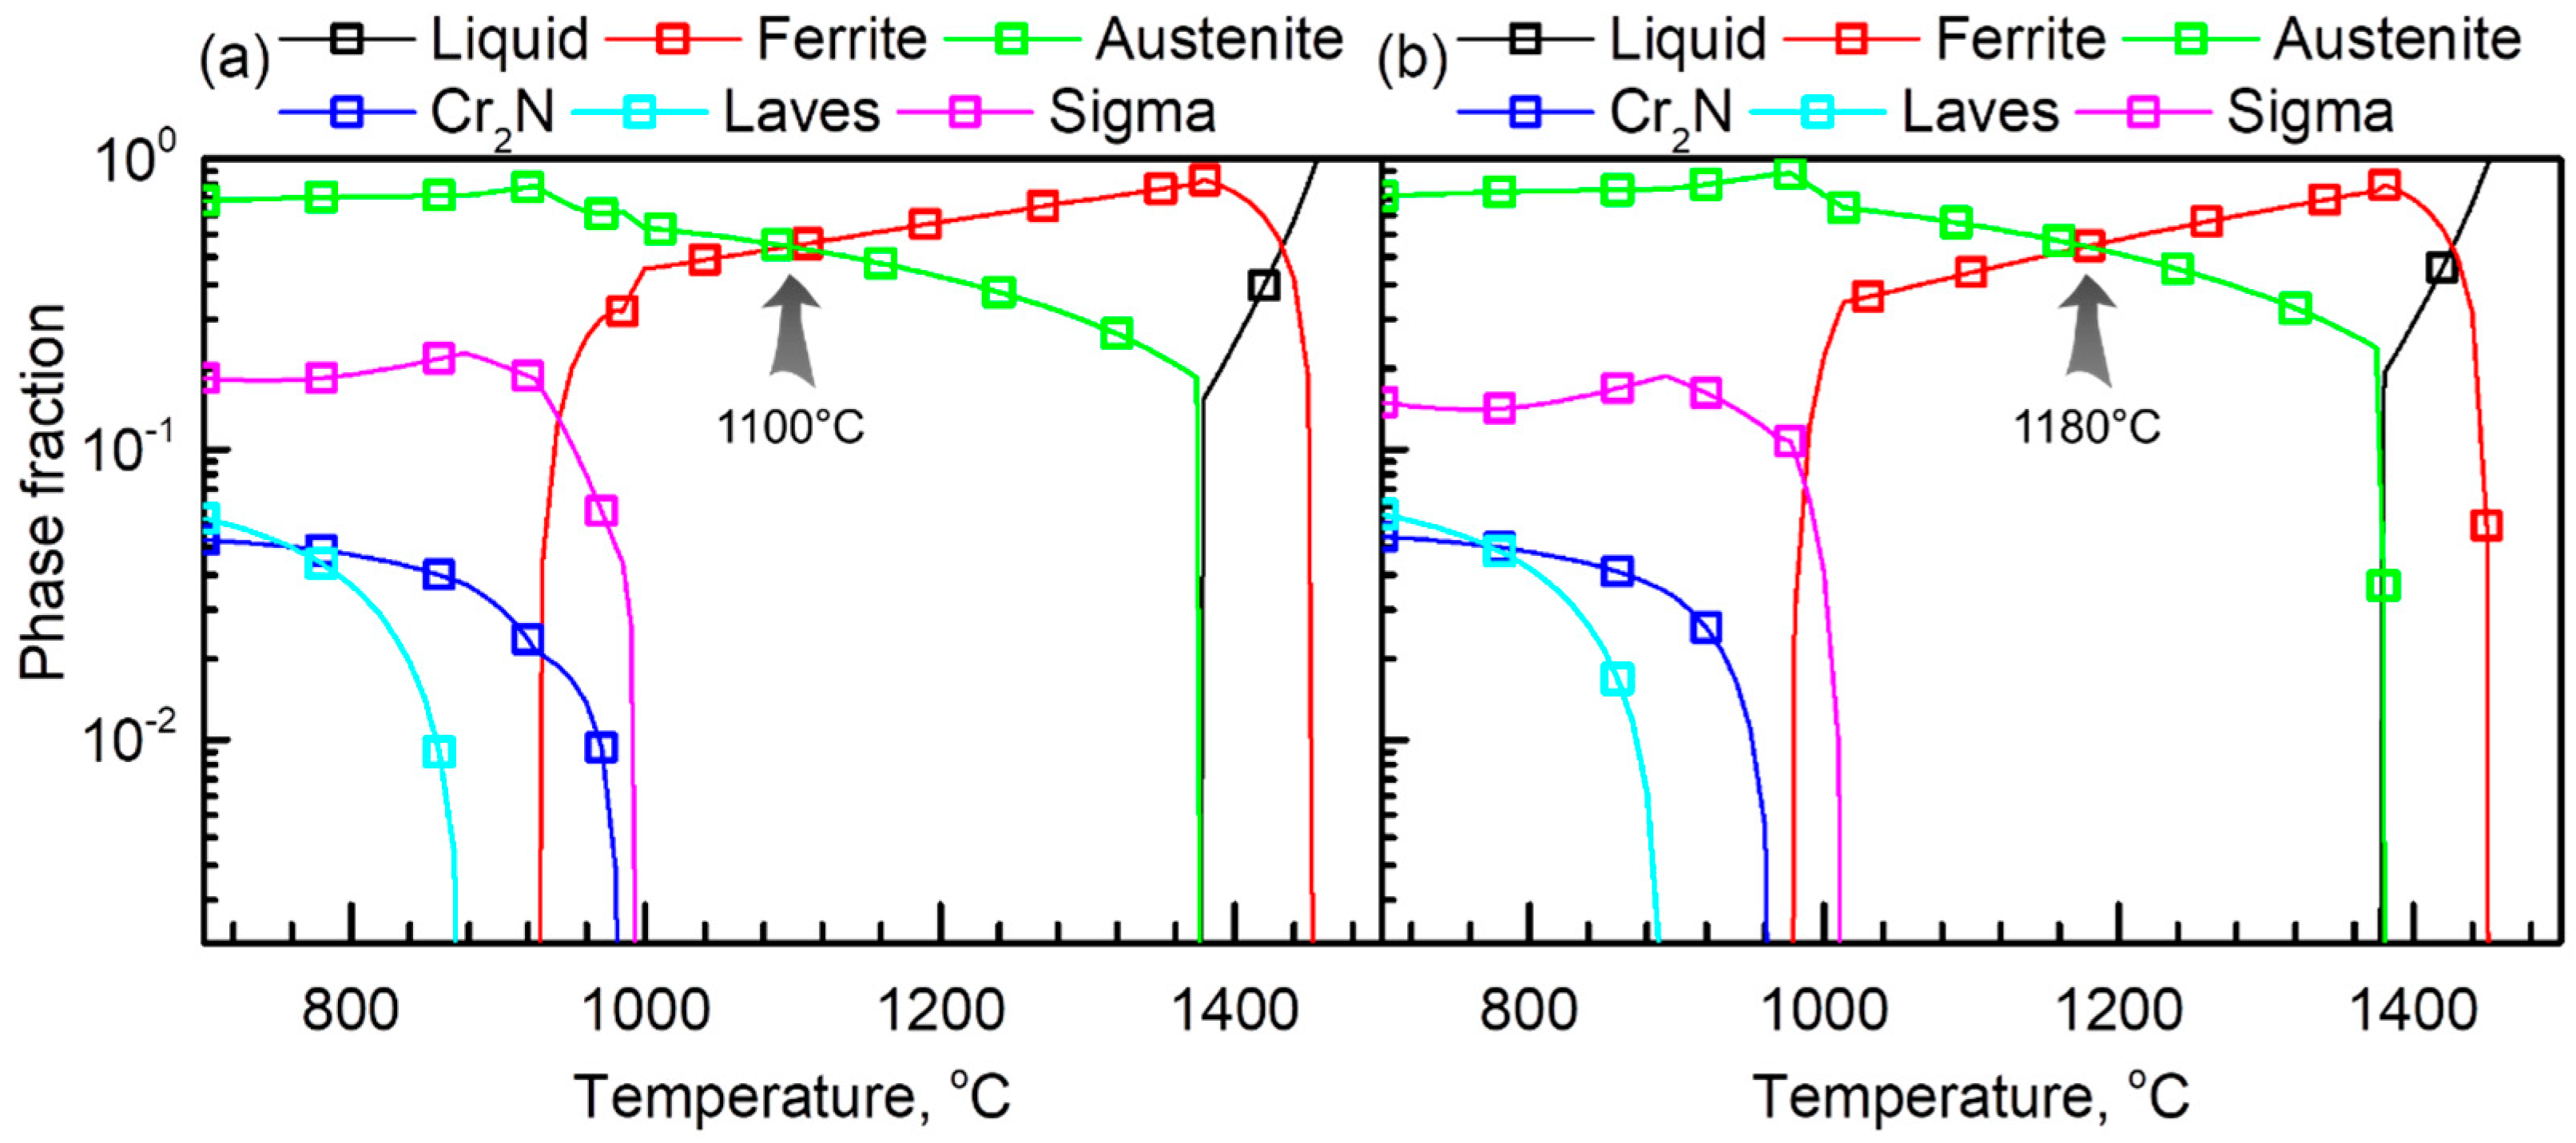
2 atmosphere. The ingots were homogenized at 1250 °C for 2 h and hot-rolled onto plates with a thickness of 4 mm, followed by water quenching. Then, the hot-rolled plates were solution-treated at 1100 and 1180 °C for 30 min, respectively, in order to obtain dual-phase structure with a phase fraction (α:γ) of approximately 1:1. The temperatures for the solution treatments were determined based on the diagrams of the equilibrium phase fraction versus temperature (
Figure 1), which were calculated using Thermo-Calc software (version 2019a, database TCFE 9.0, Thermo-Calc Software, Stockholm, Sweden (KTH)).
Microstructures of the LDSSs were examined using a scanning electron microscope (SEM, IT-300, JEOL, Akishima, Japan) and electron backscatter diffraction (EBSD, HKL Nordlys Channel 5, Oxford Instruments, Abingdon, UK) in a SEM (JSM-7001F, JEOL, Akishima, Japan). For the SEM analyses, the LDSS specimens (10 mm × 10 mm × 4 mm) were polished using suspension with 1 µm-sized diamond particles, and chemically etched in an acid mixture (20 mL HNO3 + 30 mL HCl + 50 mL deionized water) for 1–3 min. For the EBSD analyses, the specimens were polished using colloidal silica with a particle size of 0.02 µm. The EBSD analysis was performed on a scanning area 150 µm × 120 µm with a step size of 0.5 µm, and the grain boundaries were identified with the critical misorientation angle of 10°. From the EBSD images taken at 5 different locations, average values of the phase fractions (α:γ, in vol%) and grain sizes were measured. Then, the chemical compositions of the α and γ phases in the LDSSs were examined through an electron probe microanalysis (EPMA, SX100, CAMECA, Gennevilliers, France). For each alloy and each phase, 10 points were analyzed using the EPMA, and the average values were calculated.
Corrosion properties of the Ni03 and Ni57 alloys were evaluated through electrochemical tests. All of the electrochemical tests were performed using a three-electrode glass cell consisting of a saturated calomel reference electrode (SCE), a Pt plate counter electrode, and a specimen serving as a working electrode. For the working electrode, the LDSS specimens were mounted in cold epoxy resin and ground using SiC emery paper of up to 1500 grit. The exposed area for the test was controlled to be 0.2 cm2 using electroplating tape. The tests were controlled by a potentiostat (Reference600+, GAMRY, Warminster, PA, USA).
The pitting corrosion resistance and repassivation tendencies of the LDSSs were evaluated through cyclic polarization tests in a 2 M NaCl solution at 40 °C. Based on our previous experiments, the LDSSs were immune to pitting corrosion, even in a 2 M NaCl solution at room temperature; thus, the polarization tests were performed in a 2 M NaCl solution and the solution temperature was controlled to be 40 °C. The specimens were immersed in the solution for 20 min prior to the potentiodynamic polarization tests for stabilization, from which the stable open circuit potential (OCP) was measured. After that, the potential was anodically increased from −0.1 V versus OCP to the potential at which the current density exceeded 0.1 mA cm−2, and then, lowered to the repassivation potential (Erp), with a potential sweep rate of 0.17 mV s−1. Then, the dissolution rate after the stable pit formation was measured through potentiostatic tests. In the same condition (2 M NaCl solution at 40 °C), anodic constant potentials of 0.10 and 0.35 VSCE were applied to the specimen for 20 min, and the current versus time curves were recorded.
For the two LDSSs, the sites for the pitting corrosion were observed using the SEM after immersion in a 2 M NaCl+1 M HCl solution at 40°C under the OCP for 30 min. The strong acid containing Cl− was needed for this experiment in order to simultaneously identify the phase boundary and the pit sites.
Uniform (or general) corrosion behavior of the LDSSs was examined through polarization tests in a 1 M HCl solution at 40 °C. After the OCP reached a steady state, the potential was scanned at a rate of 0.17 mV s
−1 in the potential range for the active–passive transition. Then, the galvanic corrosion rate between the α and γ phases in the LDSS was quantified by measuring the corrosion depth between the two phases [
10,
17,
23,
24,
25]. The polished specimens were immersed in a 1 M HCl solution at 40 °C, and after 20 min of immersion, the three-dimensional corroded morphology and the corrosion depth were examined using a surface optical profiler (Wyko NT8000, Veeco, Plainview, NY, USA). All of the potentiodynamic and potentiostatic tests were repeated at least five times for each specimen to verify reproducibility.
4. Discussion
In the present paper, the Fe
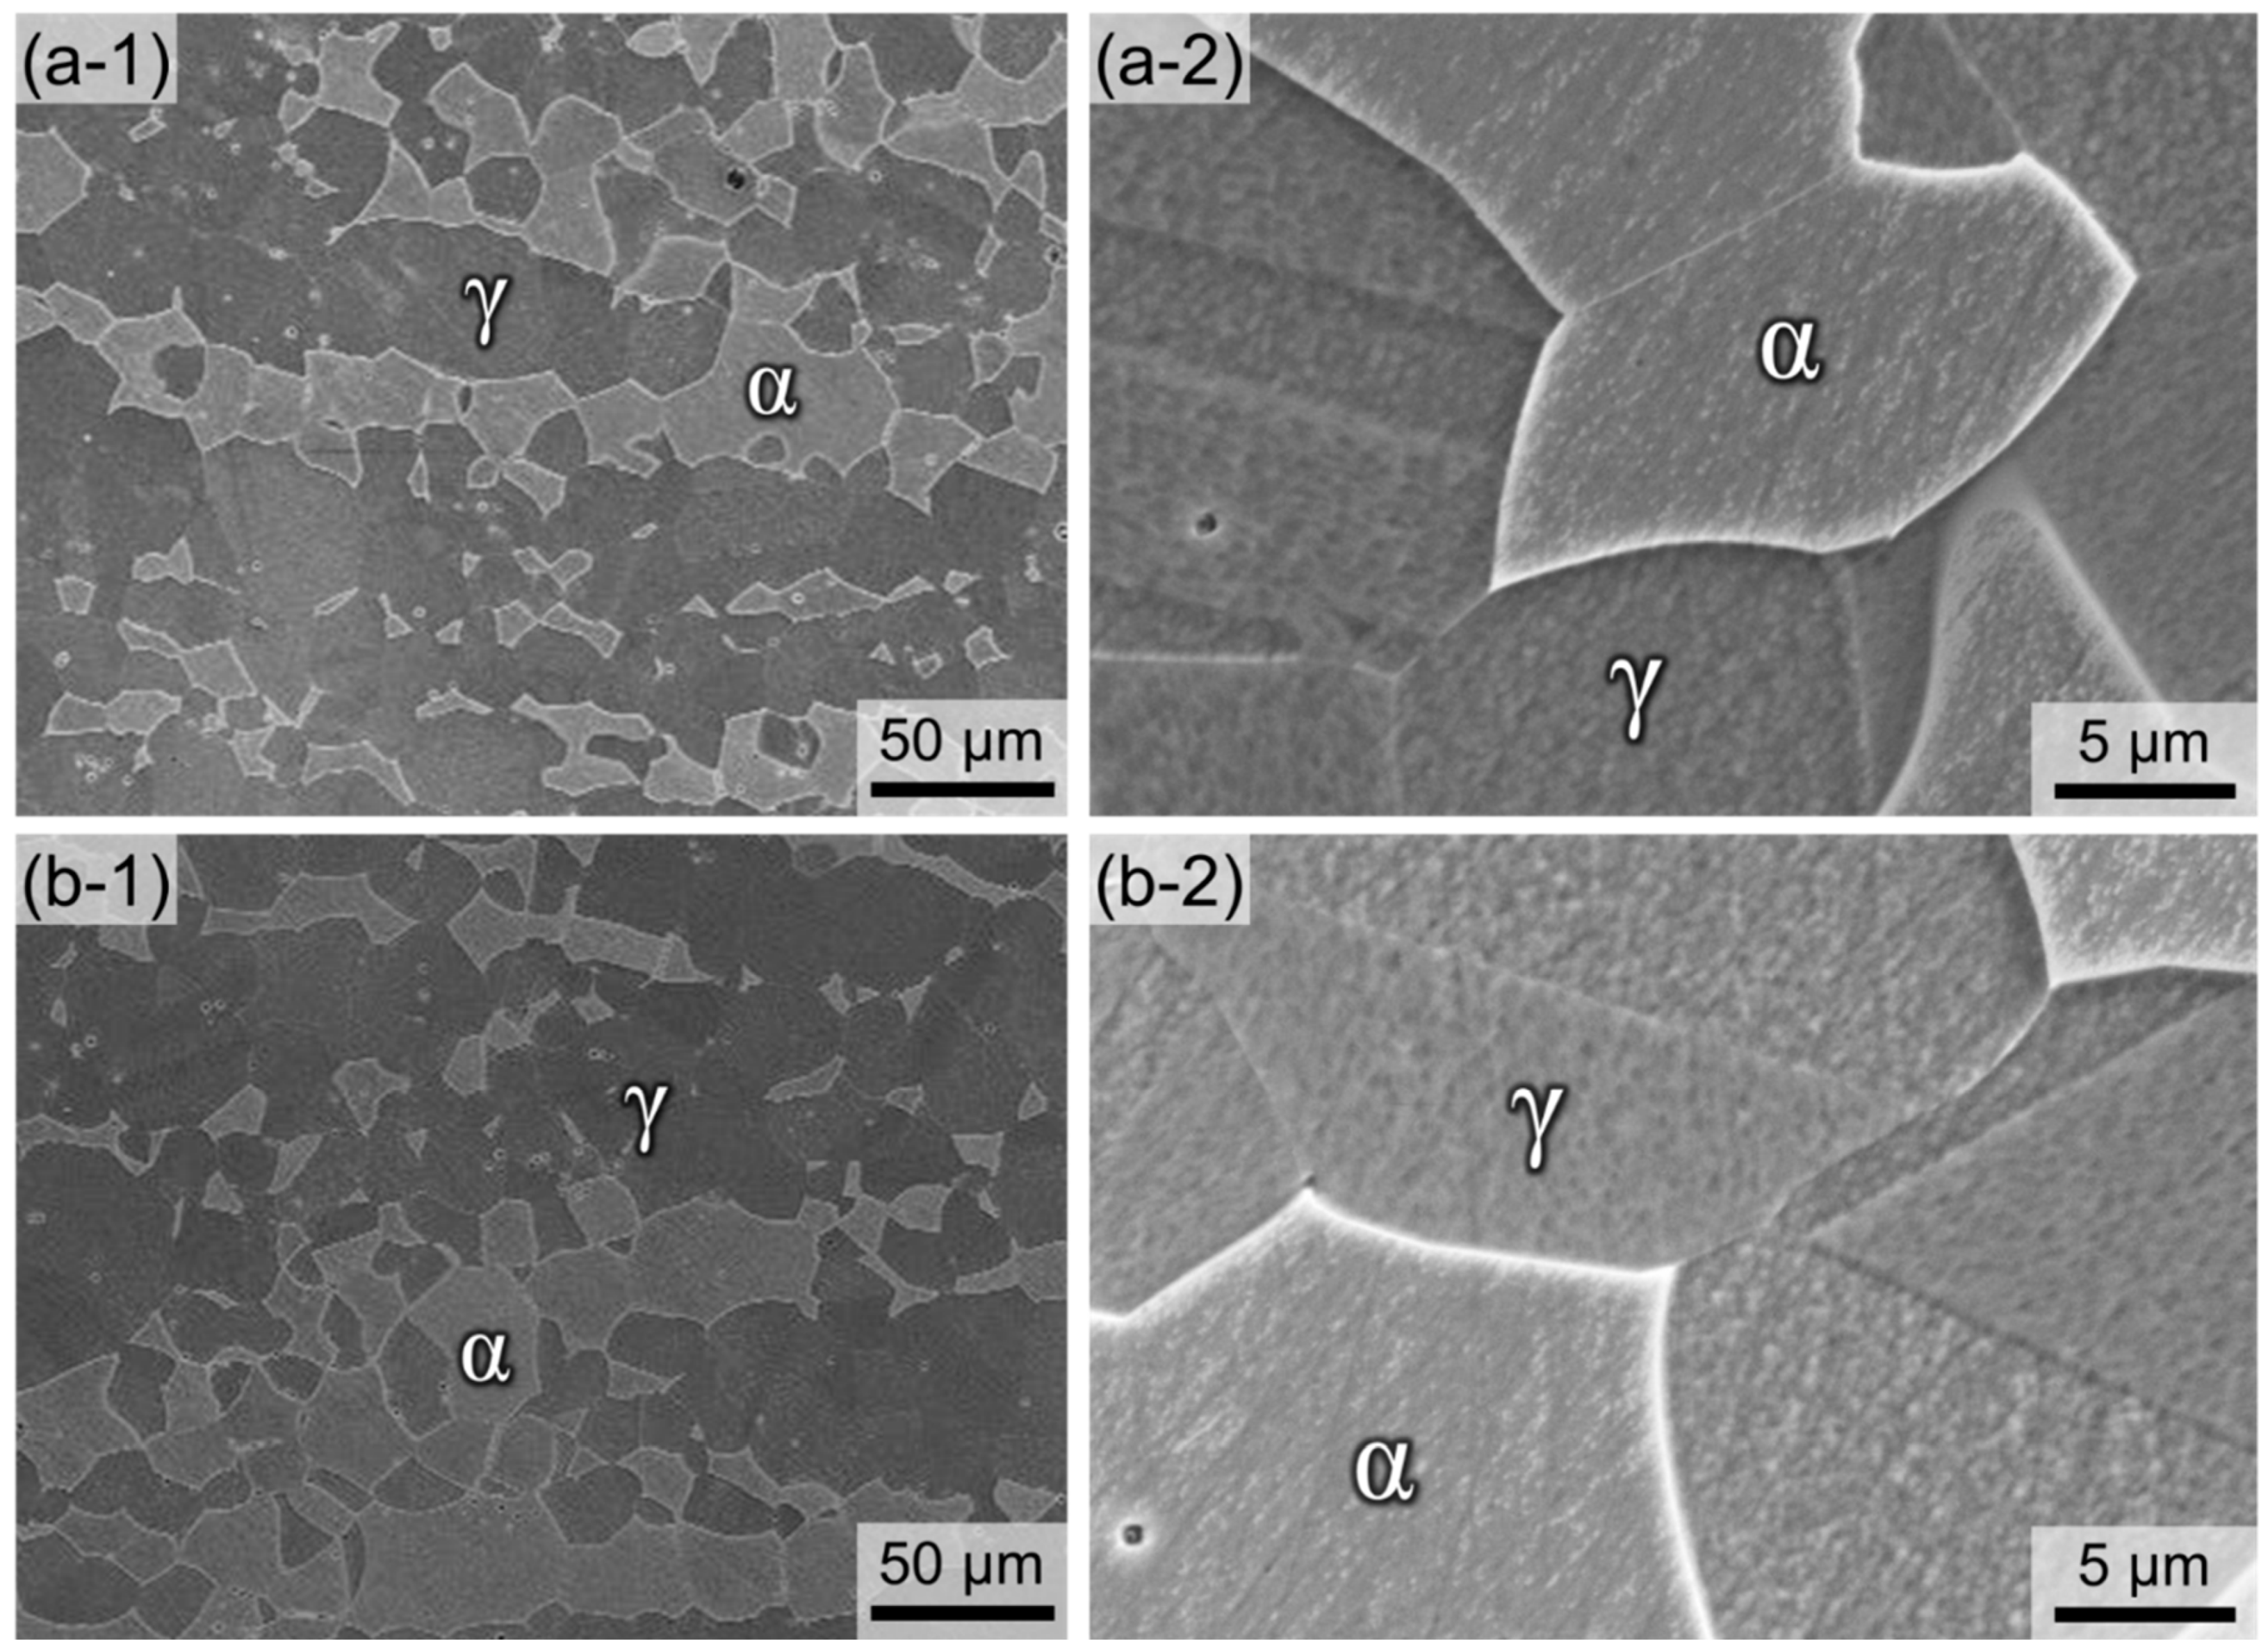
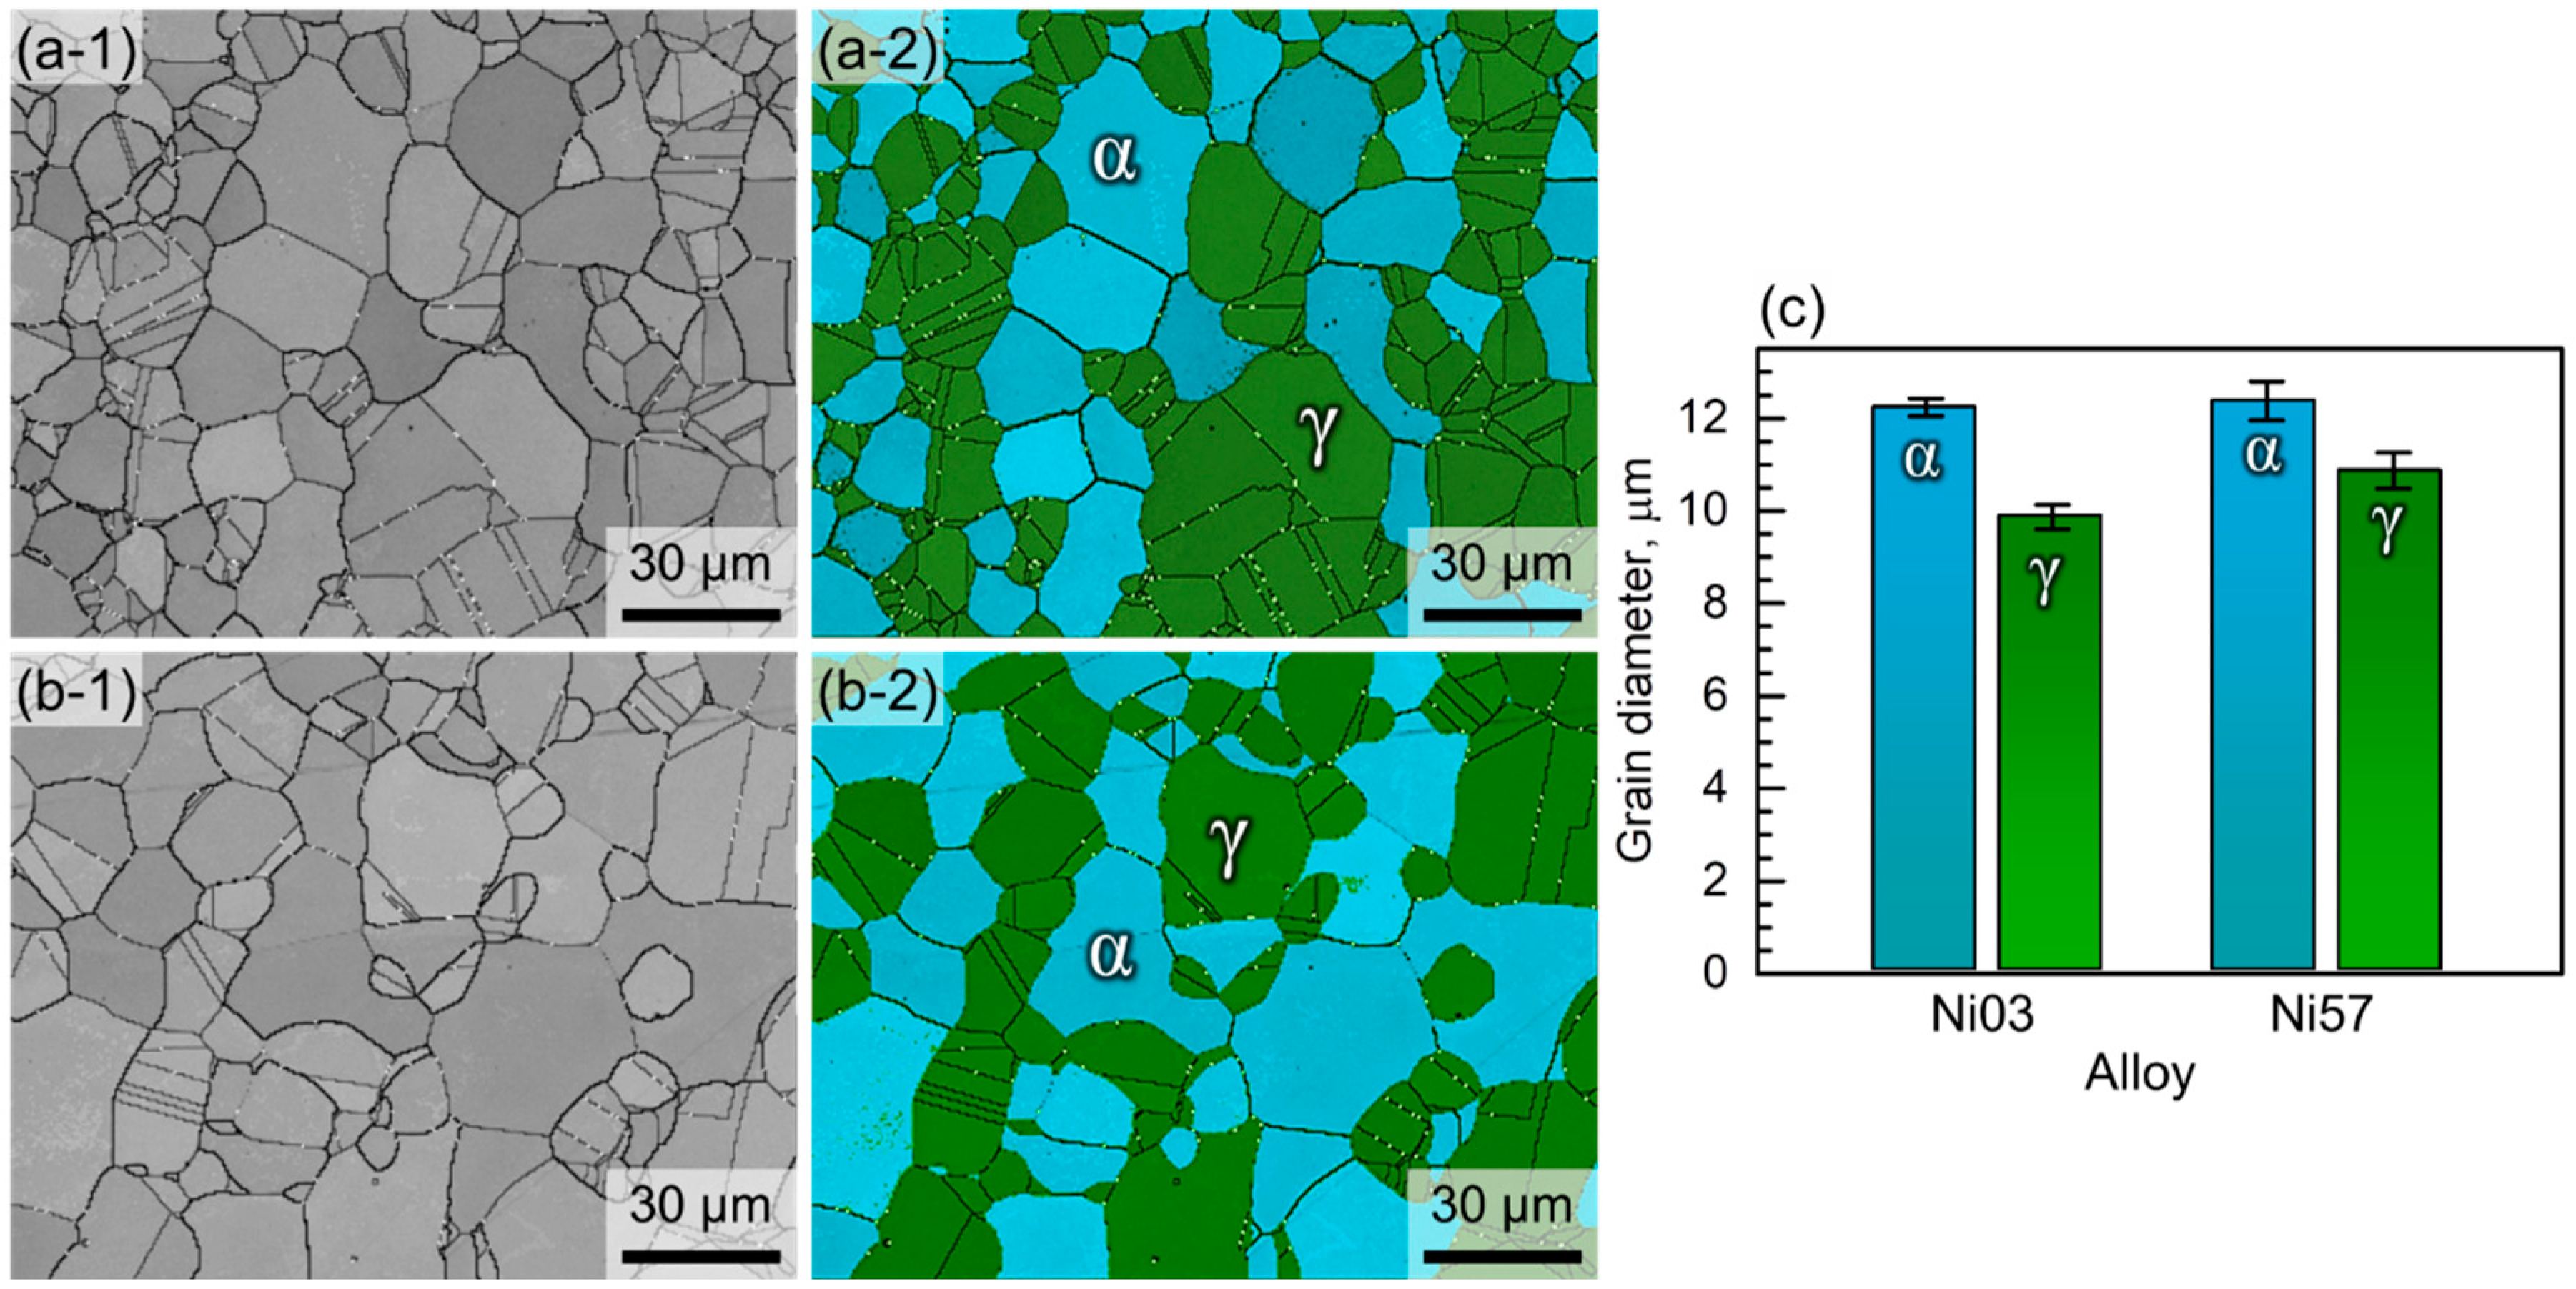
balance-18Cr-7Mn-3Mo -3W-0.4N-(0.03, 0.57)Ni (in wt%) LDSSs were carefully fabricated and solution-treated. As shown in
Figure 2 and
Figure 3, the two alloys exhibited similar microstructural characteristics, in terms of the grain size and the phase fraction. In addition, the second phases, such as Cr
2N and σ, were not observed in both LDSSs after the solution treatment.
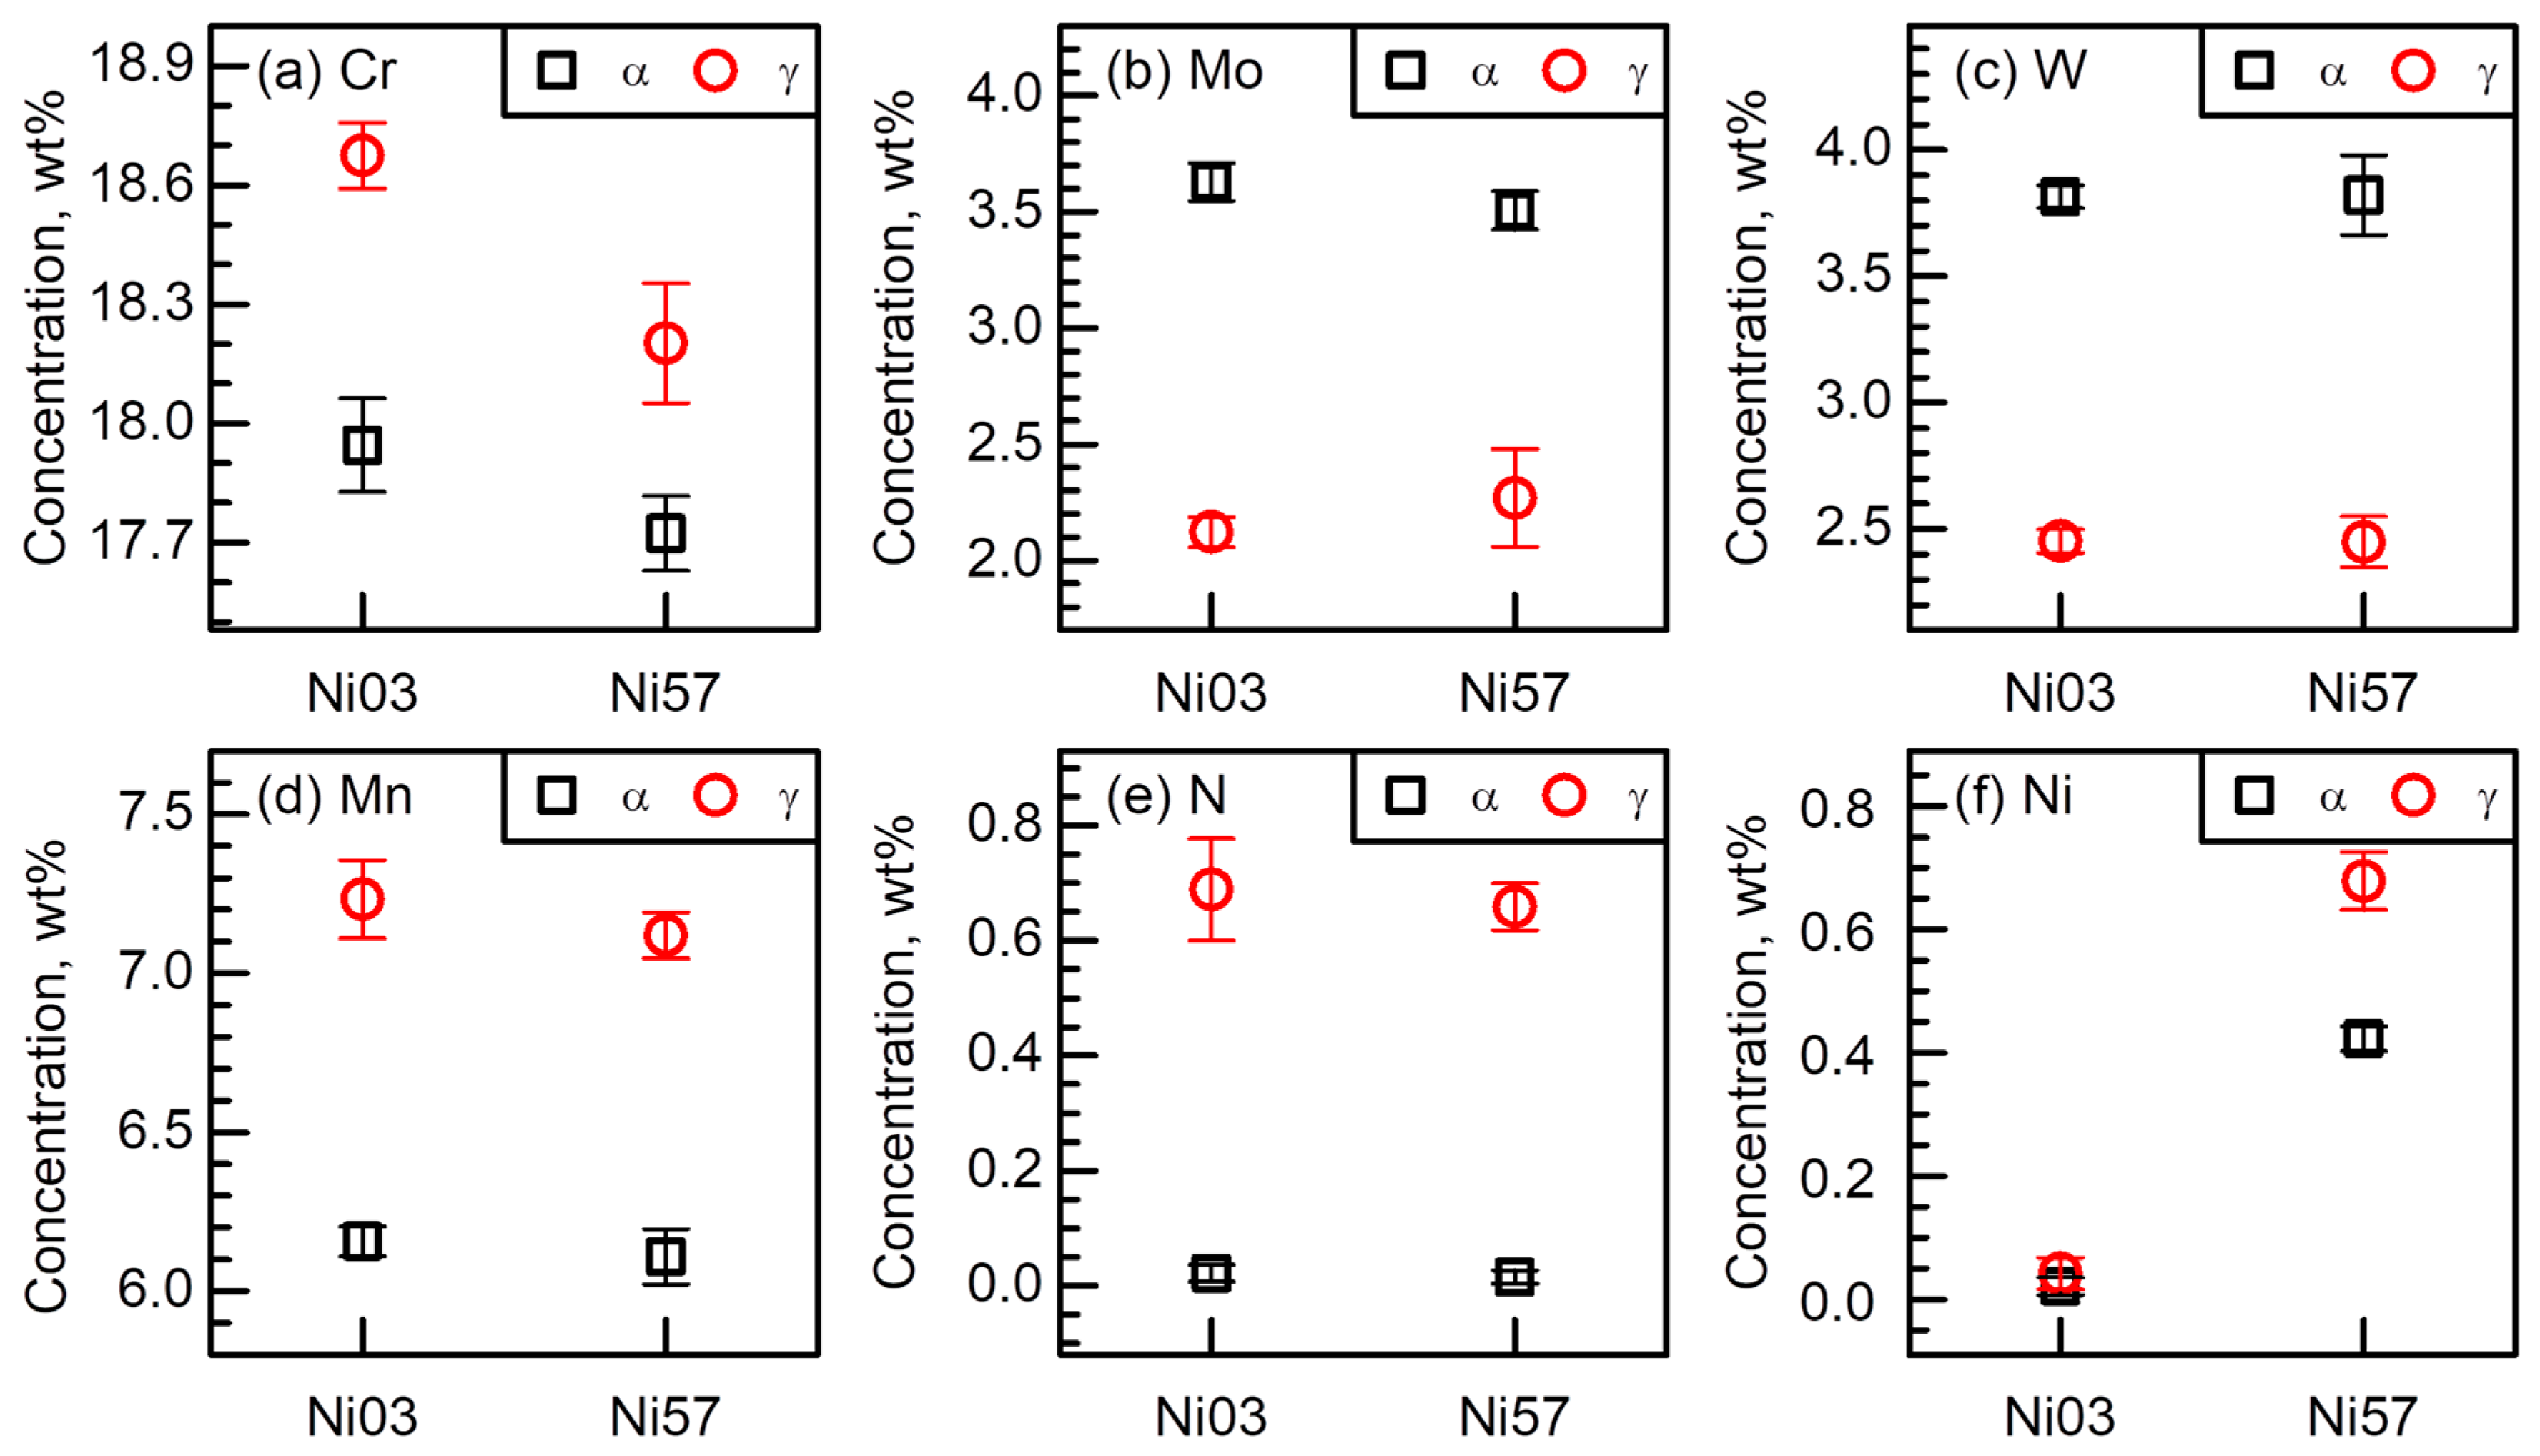
Figure 4 and
Table 2 exhibited alloying element partitioning behavior into the α and γ phases in both LDSSs. It was shown that the Ni addition to the bulk Ni03 matrix had negligible effect on the partitioning behavior of Mo, W, Mn, and N, and the difference in Cr concentrations between the α and γ phases was slightly reduced in the Ni57 alloy comparing with the Ni03 alloy. In addition, Ni was preferentially partitioned into the γ phase of the Ni57 alloy. The microstructural analyses suggested that the corrosion behavior of the Ni03 and Ni57 alloys were primarily affected by the chemical compositions of the constituent phases.
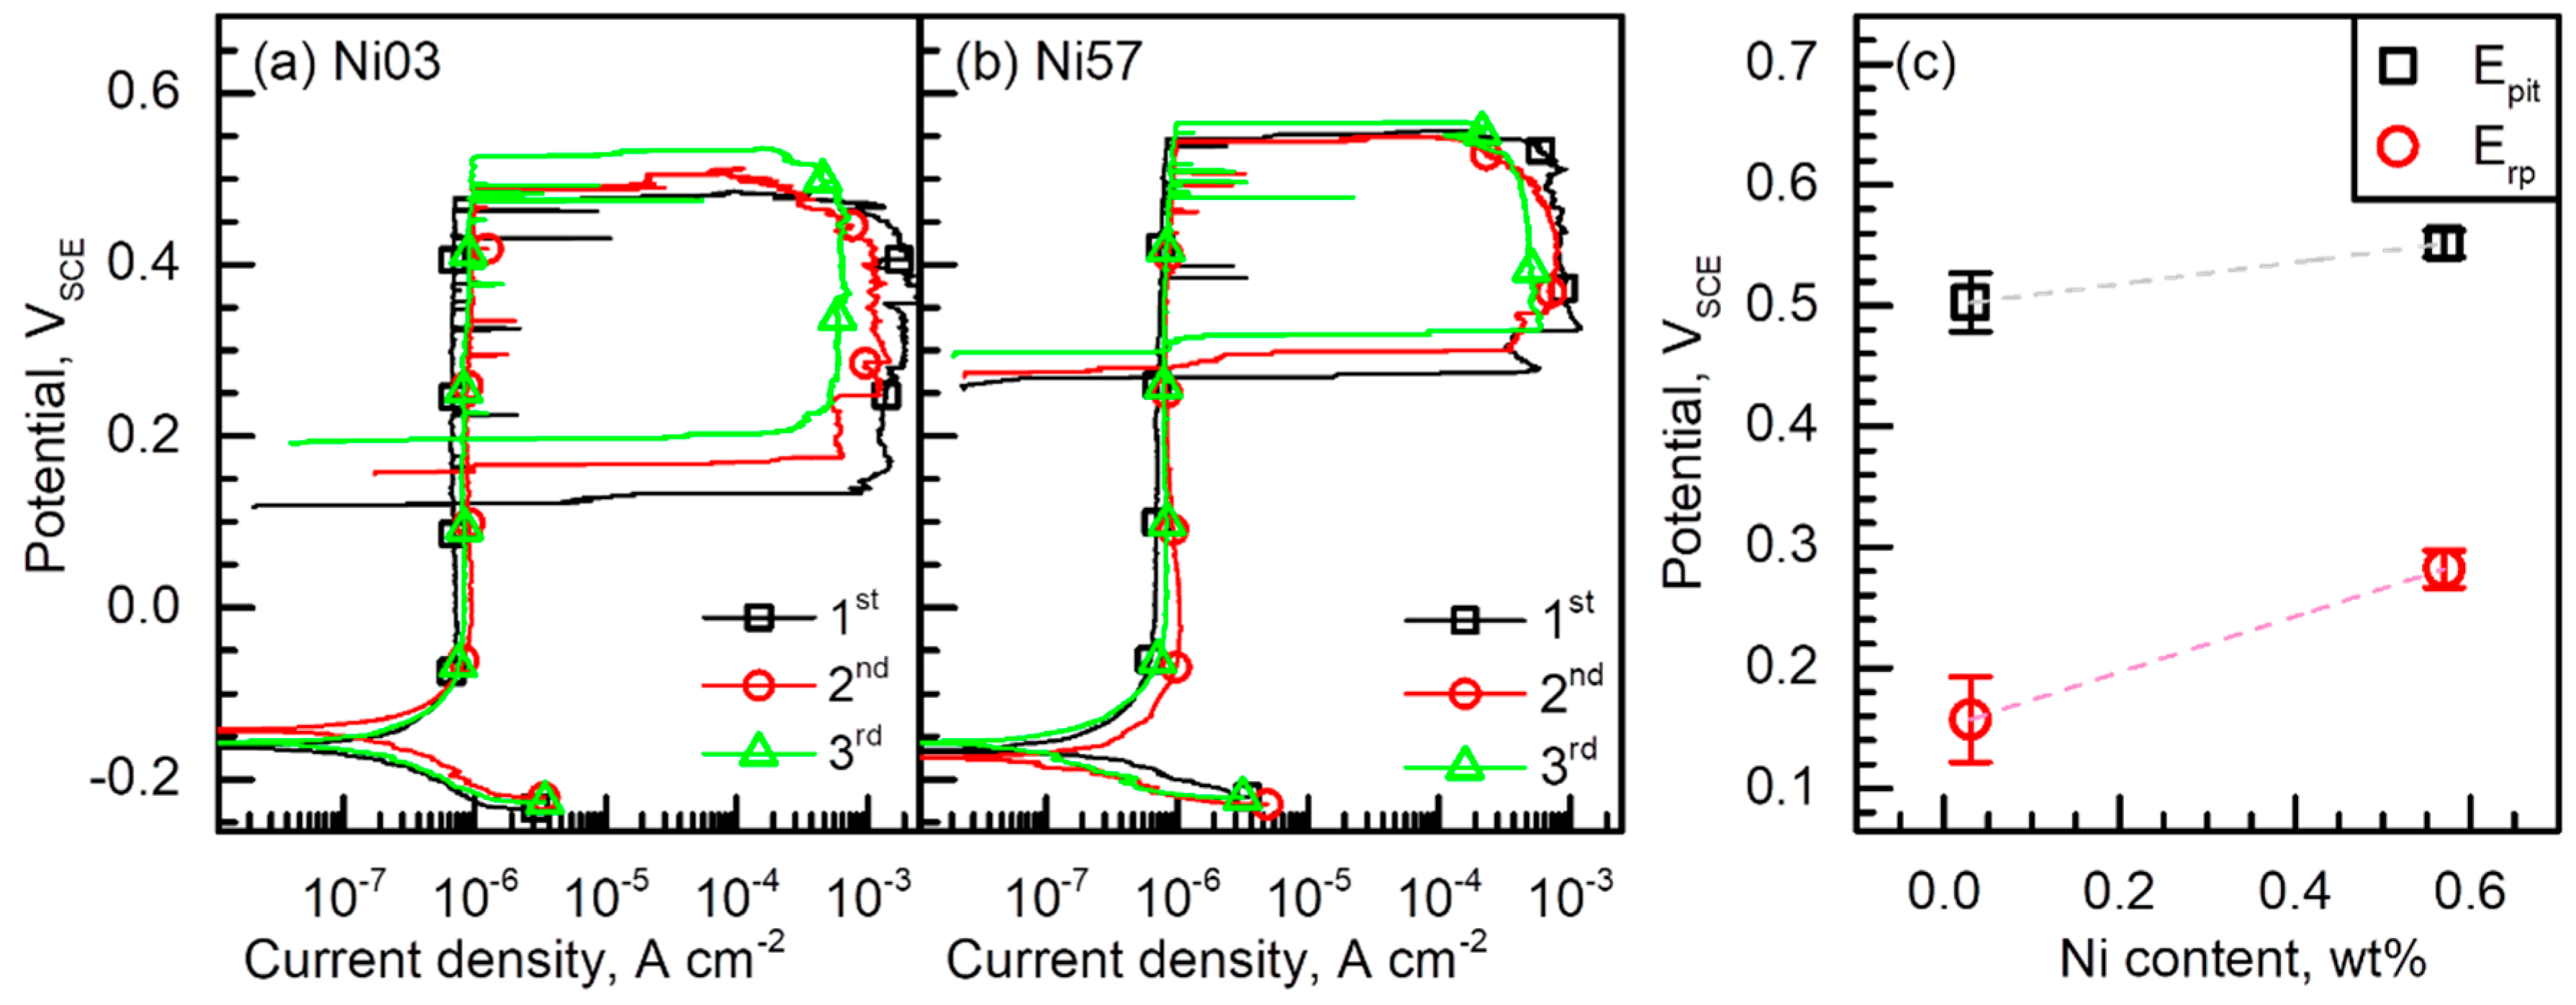
The pitting corrosion resistance of the two LDSSs was assessed by measuring the E
pit and E
rp through the polarization tests in a 2 M NaCl solution at 40 °C.
Figure 5 indicated that the Ni addition to the Ni03 alloy increased both E
pit and E
rp, and the positive effect of Ni was more pronounced in the increase in E
rp. Since higher E
pit indicates higher resistance to the stable pit formation, and higher E
rp means greater tendency for the pit extinction (i.e., repassivation),
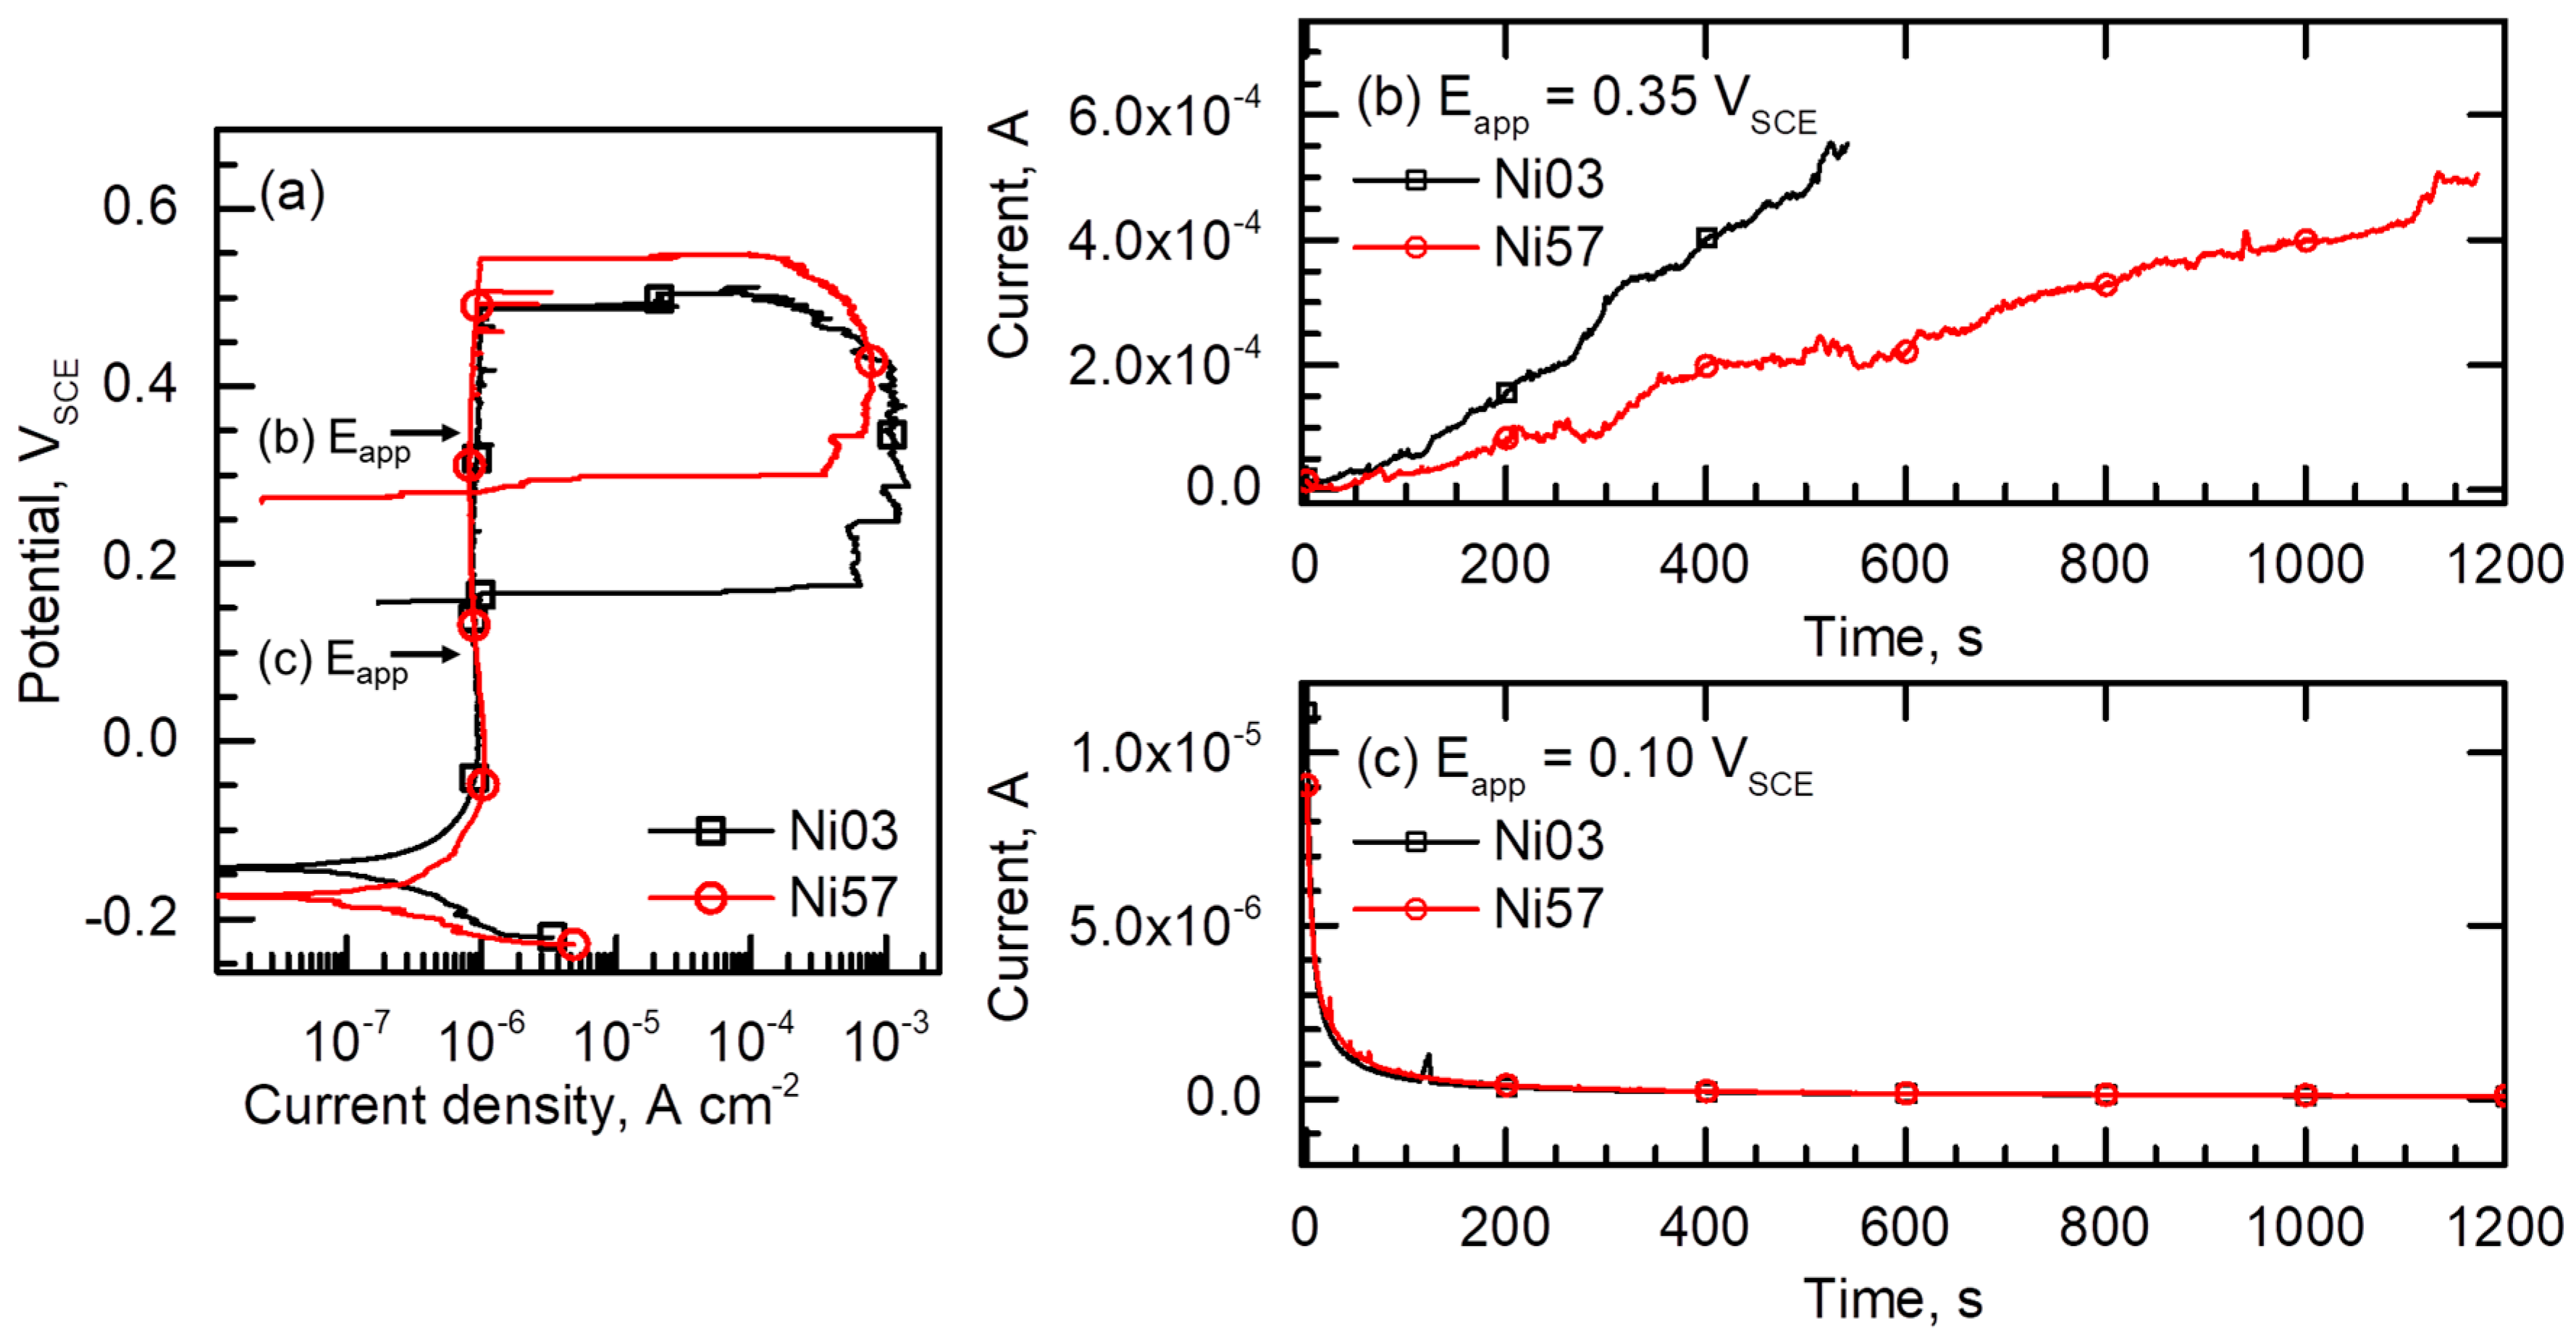
Figure 5 demonstrated that the Ni57 alloy possessed better resistance to pitting corrosion than the Ni03 alloy. In addition, it was also shown that the Ni addition reduced the size of the loop in the cyclic polarization curve, which implied that the alloying Ni retarded the pit growth rate. This observation was confirmed again by the measurement of the dissolution current after stable pit initiation of the two LDSSs (
Figure 6b).
The uniform corrosion rate of the matrix has a strong correlation with the pit growth rate, and the uniform corrosion of dual-phase steel inside the pit is accompanied by the galvanic corrosion between the two phases. Thus, the uniform and galvanic dissolution rates between the two constituent phases were measured in the simulated solution inside the pit, that is, the acidified chloride solution, through the polarization tests (
Figure 8) and immersion tests (
Figure 9).
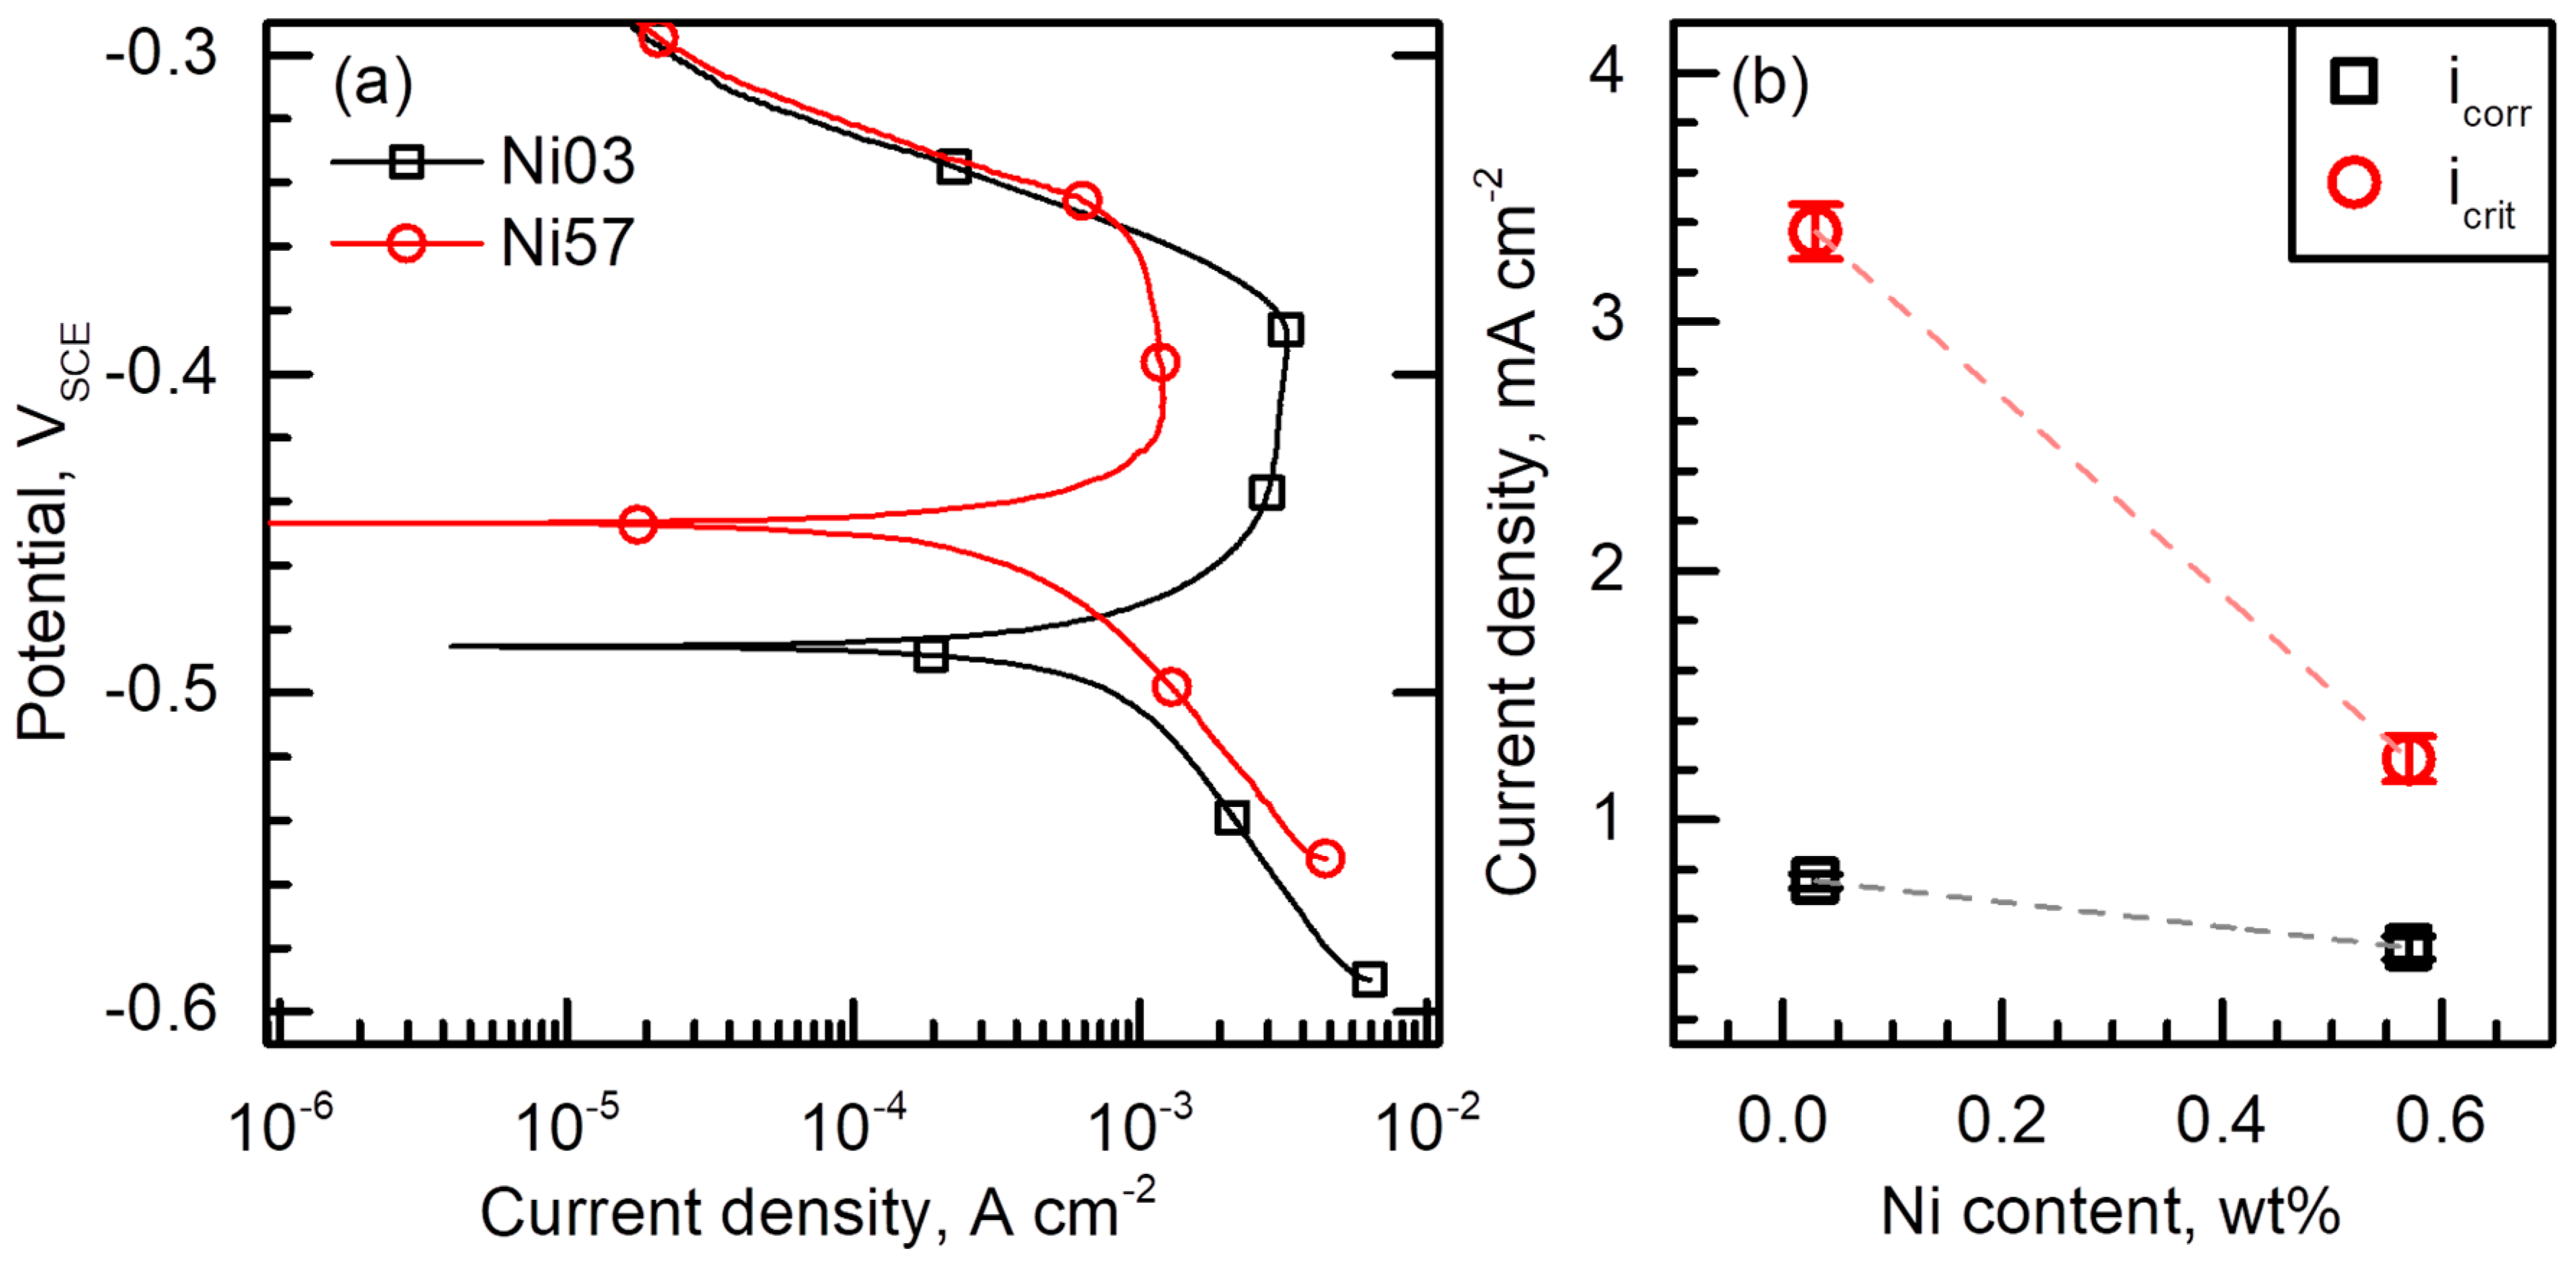
The polarization curves obtained in a 1 M HCl solution at 40 °C (
Figure 8) indicated that the Ni addition to the Ni03 matrix enhanced the resistance to uniform corrosion, which was confirmed by reduced i
corr and i
crit, and increased E
corr. That is, the dissolution rate of the Ni03 alloy in a strong acid containing chloride ions was faster than that of the Ni57 alloy under anodic polarization as well as under open circuit conditions. In addition, it was noted that the decrease in i
crit more sensitively depended on the [Ni] than i
corr, as shown in
Figure 8b. During the pit growth, the matrix inside the pit cavity exposed to the acidified chloride solution behaves as a local anode and the metal surface around the pit mouth behaves as a local cathode. Thus, in the pit cavity, active dissolution of the matrix under anodic polarization continues until the onset of the repassivation. For this reason, the significant decrease in the i
crit by the addition of Ni (
Figure 8b) implied that the pit growth rate was slowed down by the addition of Ni, which consequently assisted repassivation of both stable and metastable pits. Therefore,
Figure 8b well explained the results from
Figure 5c, that is, the Ni addition retarded the dissolution of the Ni03 matrix and consequently, increased the both E
pit and E
rp.
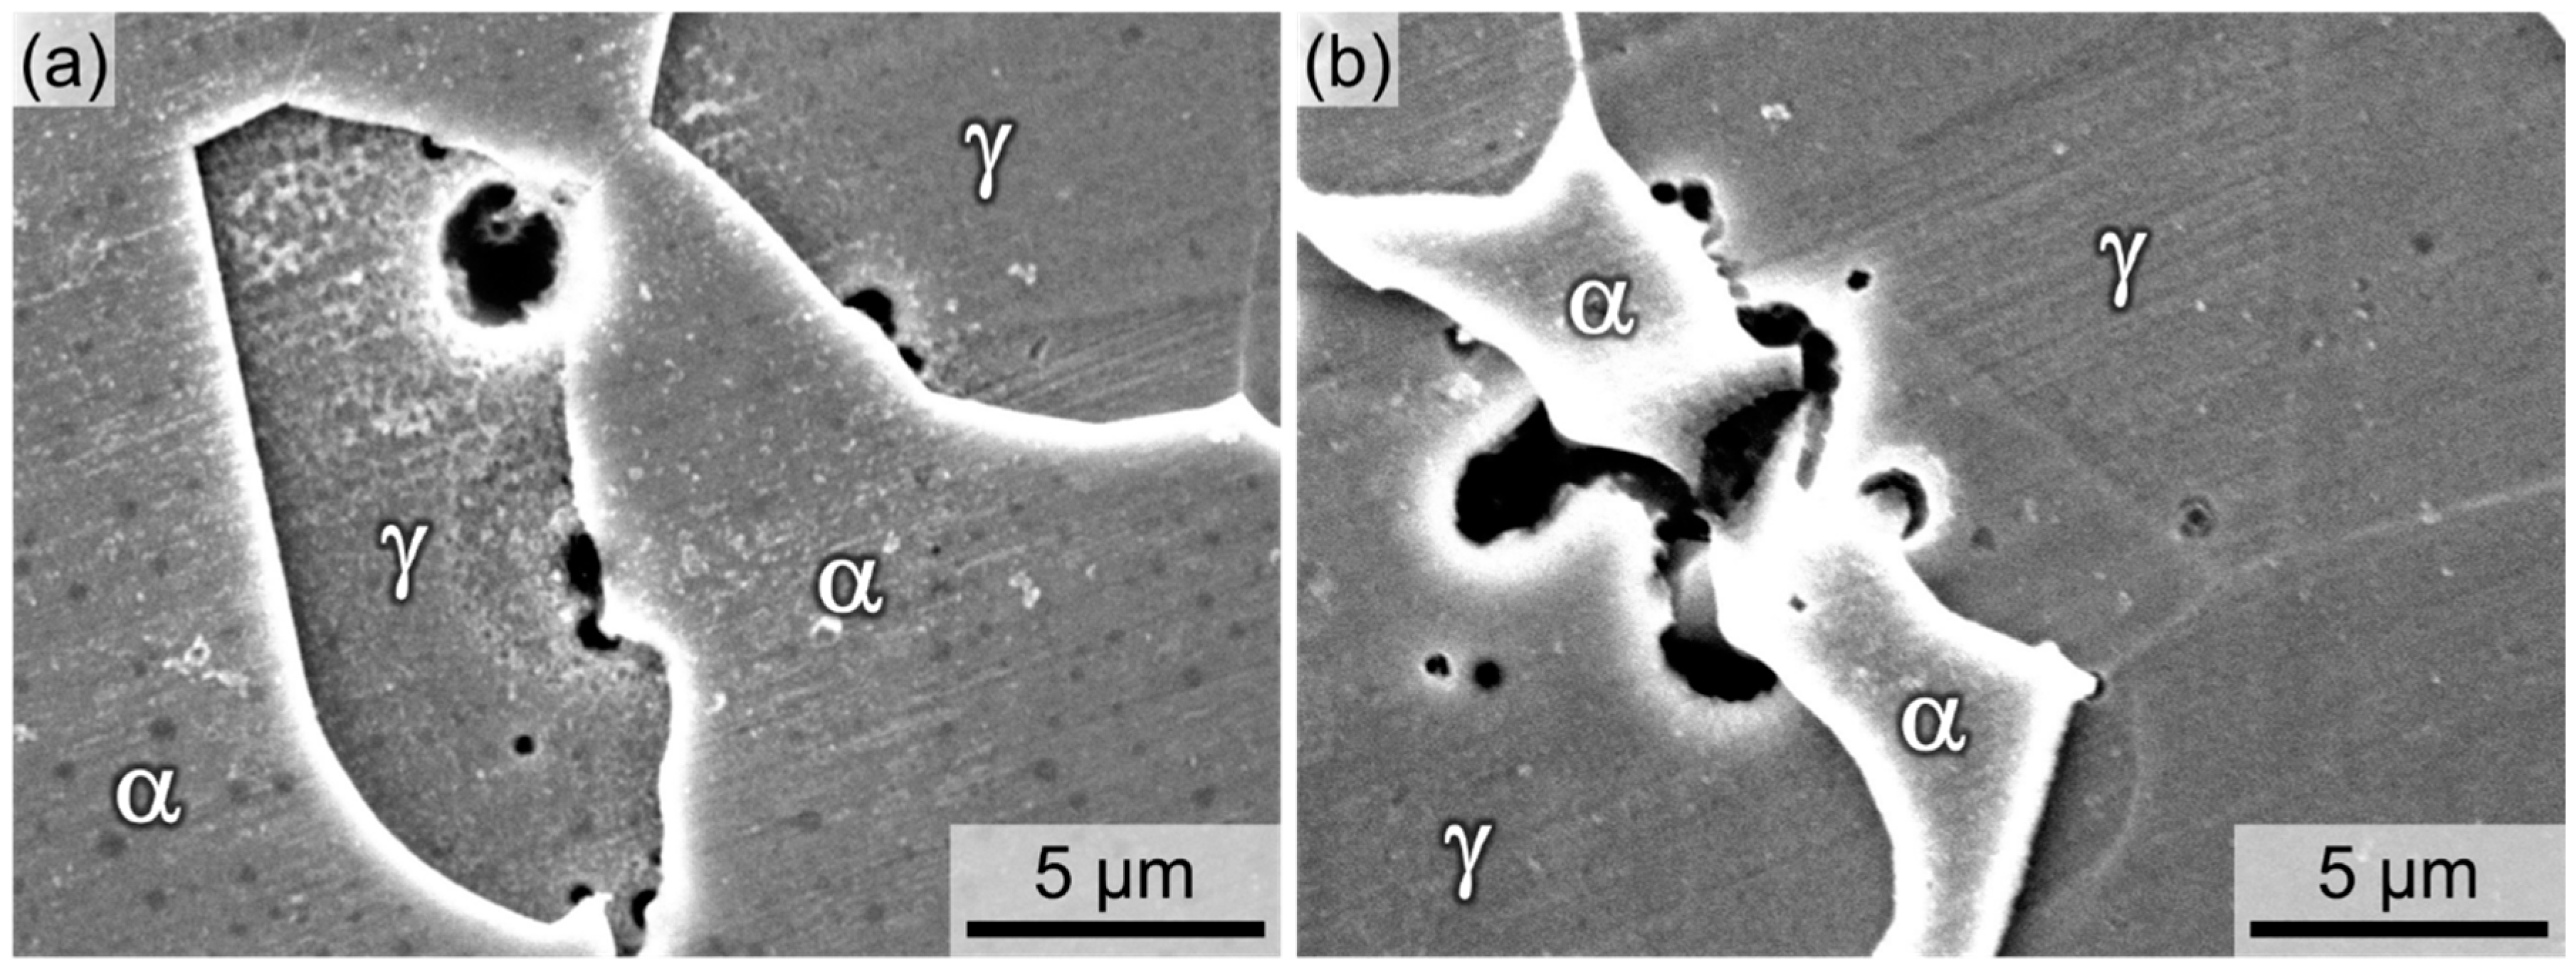
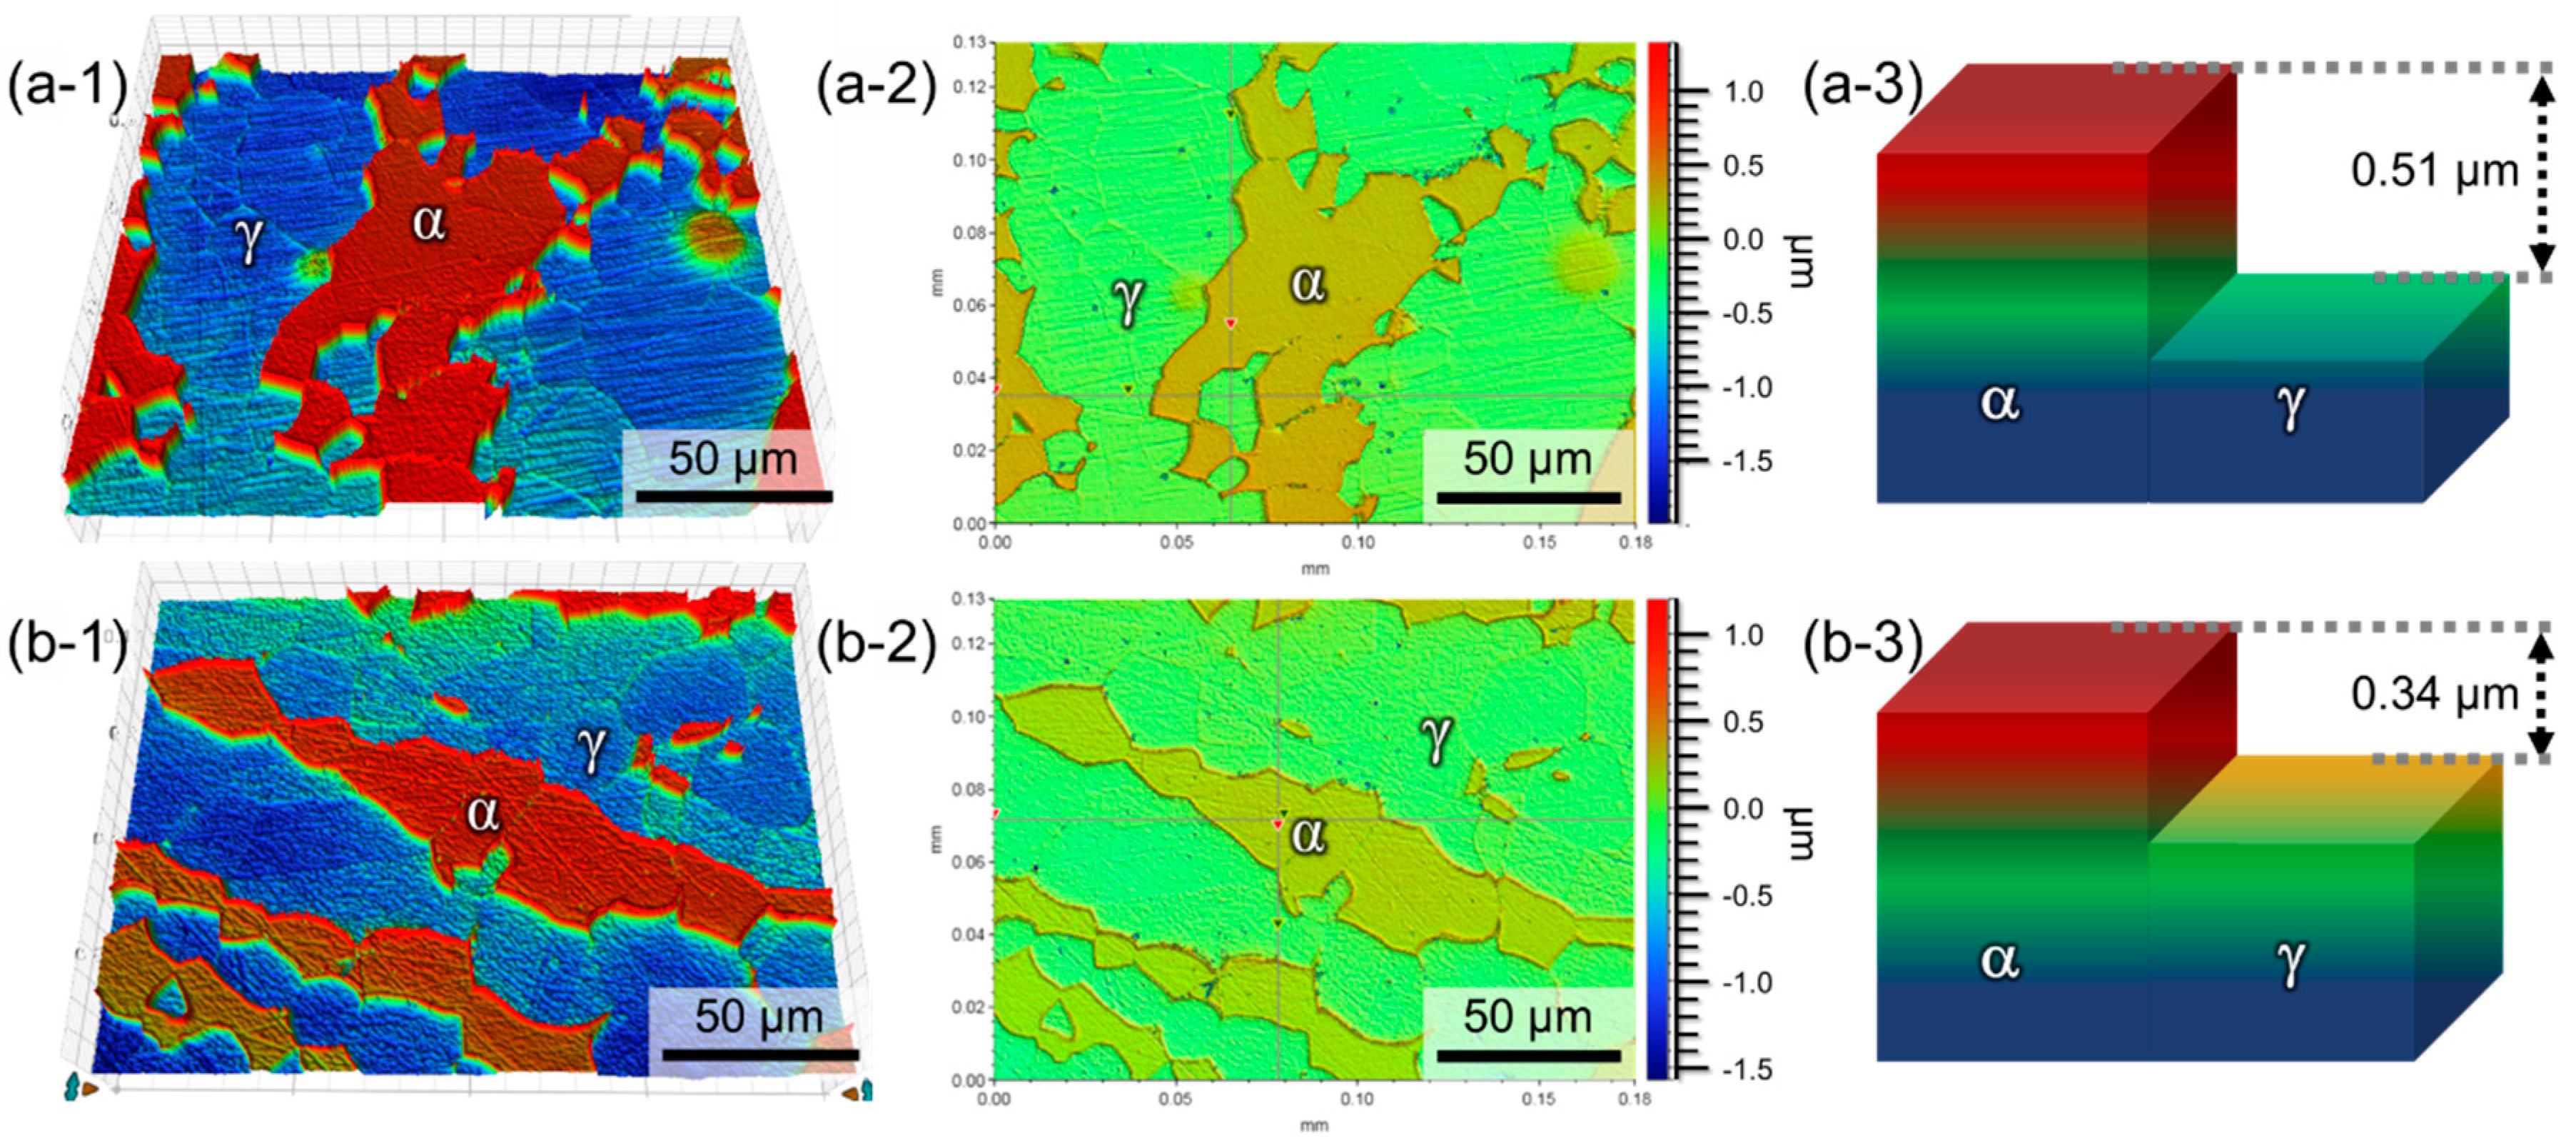
The reduced i
corr was found to be due to the suppressed galvanic corrosion rate between the α and γ phases (
Figure 9). From
Figure 9, it was firstly noted that dissolution rates of the γ and α phases were different, and the γ phase was the more active phase than the α phase. Nobility of the α and γ phases is determined by the chemical composition. The EPMA analysis results (
Figure 4) showed that the γ phases of both LDSSs contained higher Cr, Mn, and N concentrations than the α phase, and Cr and Mn are thermodynamically and galvanically more active than Fe. In addition, alloying N is reported to decrease the nobility of the FeCr-based alloy [
31]. Thus, the γ phase enriched with Cr, Mn, and N in the LDSSs dissolved more preferentially when it was in contact with the nobler phase, α. For the Ni57 alloy, the added Ni was partitioned into the two phases, and the γ phase contained 0.68 wt% Ni, while the α phase had only 0.42 wt% Ni. Still, the γ phase of the Ni57 alloy was the relatively more active phase, but the Ni addition changed the corrosion depth. Thus,
Figure 9 secondly indicated that the enrichment of Ni in the γ phase of the Ni57 alloy resulted in reducing the dissolution rate of γ galvanically coupled with the α. The decreased galvanic corrosion rate of the Ni57 alloy showed a good agreement with the reduced i
corr value of the Ni57 alloy shown in
Figure 8.
Consequently, the reduced galvanic corrosion rate between the α and γ phases and the increased resistance to uniform corrosion of the Ni57 alloy implied the decrease in the growth rate of the pit cavity, which was responsible for the increase in the potentials for the stable pit initiation (i.e., Epit) and the pit extinction (i.e., Erp) to the higher values accordingly.
The present study strongly suggests that controlling the galvanic corrosion rate between the constituent phases for DSSs is helpful to improve the resistance to pitting corrosion, and one of the effective ways to achieve the favorable resistance to pitting corrosion for the LDSS would be the use of small amount of Ni. The findings of this paper could be extended to other similar alloy systems.
Author Contributions
Conceptualization, H.-Y.H. and T.-H.L.; methodology, H.-Y.H. and T.-H.L.; software, J.H.J.; validation, S.-D.K., J.H.J., and J.M.; investigation, S.-D.K., J.M., and H.-Y.H; writing—original draft preparation, H.-Y.H. and S.-D.K.; writing—review and editing, T.-H.L.; funding acquisition, H.-Y.H. All authors have read and agreed to the published version of the manuscript.
Funding
This study was supported by the Basic Science Research Program of the National Research Foundation (NRF), funded by the Ministry of Science & ICT (NRF-2019R1C1C1010246) and the Ministry of Trade, Industry & Energy (MI, Korea) under Strategic Core Materials Technology Development Program (No. 10067375).
Conflicts of Interest
The authors declare no conflict of interest.
References
- Lo, K.H.; Shek, C.H.; Lai, J.K.L. Recent developments in stainless steels. Mater. Sci. Eng. R 2009, 65, 39–104. [Google Scholar] [CrossRef]
- Chail, G.; Kangas, P. Super and hyper duplex stainless steels: Structures, properties and applications. Procedia Struct. Integr. 2016, 2, 1755–1762. [Google Scholar] [CrossRef]
- Ornek, C.; Engelberg, D.L. Towards understanding the effect of deformation mode on stress corrosion cracking susceptibility of grade 2205 duplex stainless steel. Mater. Sci. Eng. A 2016, 666, 269–279. [Google Scholar] [CrossRef]
- Rossi, B. Discussion on the use of stainless steel in constructions in view of sustainability. Thin Walled Struct. 2014, 83, 182–189. [Google Scholar] [CrossRef]
- Santos, T.F.A.; Torres, E.A.; Lippold, J.C.; Ramirez, A.J. Detailed Microstructural Characterization and Restoration Mechanisms of Duplex and Superduplex Stainless Steel Friction-Stir-Welded Joints. J. Mater. Eng. Perform. 2016, 25, 5173–5188. [Google Scholar] [CrossRef]
- Boillot, P.; Peultier, J. Use of Stainless Steels in the Industry: Recent and Future Developments. Procedia Eng. 2014, 83, 309–321. [Google Scholar] [CrossRef]
- Knyazeva, M.; Pohl, M. Duplex steels: Part I: Genesis, formation, structure. Metallogr. Microstruct. Anal. 2013, 2, 113–121. [Google Scholar] [CrossRef]
- Mohammed, G.R.; Ishak, M.; Aqida, S.N.; Abdulhadi, H.A. Effects of Heat Input on Microstructure, Corrosion and Mechanical Characteristics of Welded Austenitic and Duplex Stainless Steels: A Review. Metals 2017, 7, 39. [Google Scholar] [CrossRef]
- Vannevik, H.; Nilsson, J.-O.; Frodigh, J.; Kangas, P. Effect of elemental partitioning on pitting resistance of high nitrogen duplex stainless steels. ISIJ Int. 1996, 36, 807–812. [Google Scholar] [CrossRef]
- Ha, H.-Y.; Lee, T.-H.; Lee, C.-G.; Yoon, H. Understanding the relation between pitting corrosion resistance and phase fraction of S32101 duplex stainless steel. Corros. Sci. 2019, 149, 226–235. [Google Scholar] [CrossRef]
- He, L.; Wirian, L.; Singh, P.M. Effects of Isothermal Aging on the Microstructure Evolution and Pitting Corrosion Resistance of Lean Duplex Stainless Steel UNS S32003. Metall. Mater. Trans. A 2019, 50, 2103–2113. [Google Scholar] [CrossRef]
- Baddoo, N.R. Stainless steel in construction: A review of research, applications, challenges and opportunities. J. Constr. Steel Res. 2008, 64, 1199–1206. [Google Scholar] [CrossRef]
- Kang, D.H.; Lee, H.W. Study of the correlation between pitting corrosion and the component ratio of the dual phase in duplex stainless steel welds. Corros. Sci. 2013, 74, 396–407. [Google Scholar] [CrossRef]
- Zhao, Y.; Zhang, W.; Liu, Z.; Wang, G. Development of an easy-deformable Cr21 lean duplex stainless steel and the effect of heat treatment on its deformation mechanism. Mater. Sci. Eng. A 2017, 702, 279–288. [Google Scholar] [CrossRef]
- Choi, J.Y.; Ji, J.H.; Hwang, S.W.; Park, K.-T. Strain induced martensitic transformation of Fe–20Cr–5Mn–0.2Ni duplex stainless steel during cold rolling: Effects of nitrogen addition. Mater. Sci. Eng. A 2011, 528, 6012–6019. [Google Scholar] [CrossRef]
- Guo, Y.; Sun, T.; Hu, J.; Jiang, Y.; Jiang, L.; Li, J. Microstructure evolution and pitting corrosion resistance of the Gleeble-simulated heat-affected zone of a newly developed lean duplex stainless steel 2002. J. Alloy. Compd. 2016, 658, 1031–1040. [Google Scholar] [CrossRef]
- Ha, H.-Y.; Lee, T.-H.; Kim, S. Effect of W on Stress Corrosion Cracking Susceptibility of Newly Developed Ni-Saving Duplex Stainless Steels. Met. Mater. Int. 2017, 23, 115–125. [Google Scholar] [CrossRef]
- Ha, H.-Y.; Lee, C.-H.; Lee, T.-H.; Kim, S. Effects of Nitrogen and Tensile Direction on Stress Corrosion Cracking Susceptibility of Ni-Free FeCrMnC-Based Duplex Stainless Steels. Materials 2017, 10, 294. [Google Scholar] [CrossRef]
- Ha, H.-Y.; Lee, T.-H.; Hwang, B.C. High-Performance High-Nitrogen Duplex Stainless Steels Excellent in Pitting Corrosion Resistance. U.S. Patent 9,663,850, 30 May 2017. [Google Scholar]
- Ha, H.-Y.; Lee, T.-H.; Kim, S.-J. Synergistic effect of Ni and N on improvement of pitting corrosion resistance of high nitrogen stainless steels. Corros. Eng. Sci. Technol. 2014, 49, 82–86. [Google Scholar] [CrossRef]
- Azuma, S.; Kudo, T.; Miyuki, H.; Yamashita, M.; Uchida, H. Effect of nickel alloying on crevice corrosion resistance of stainless steels. Corros. Sci. 2004, 46, 2265–2280. [Google Scholar] [CrossRef]
- Yoon, Y.-S.; Ha, H.-Y.; Lee, T.-H.; Kim, S. Comparative study of stress corrosion cracking susceptibility of Fe18Cr10Mn- and Fe18Cr10Mn1Ni-based high nitrogen stainless steels. Corros. Sci. 2014, 88, 337–348. [Google Scholar] [CrossRef]
- Ha, H.-Y.; Jang, M.-H.; Lee, T.-H.; Moon, J. Interpretation of the relation between ferrite fraction and pitting corrosion resistance of commercial 2205 duplex stainless steel. Corros. Sci. 2014, 89, 154–162. [Google Scholar] [CrossRef]
- Ha, H.-Y.; Jang, M.-H.; Lee, T.-H.; Moon, J. Understanding the relation between phase fraction and pitting corrosion resistance of UNS S32750 stainless steel. Mater. Charact. 2015, 106, 338–345. [Google Scholar] [CrossRef]
- Yoon, H.; Ha, H.-Y.; Lee, T.-H.; Kim, S.-D.; Jang, J.H.; Moon, J.; Kang, N. Pitting Corrosion Resistance and Repassivation Behavior of C-Bearing Duplex Stainless Steel. Metals 2019, 9, 930. [Google Scholar] [CrossRef]
- Park, J.H.; Kang, Y. Inclusions in Stainless Steels—A Review. Steel Res. Int. 2017, 88, 1700130. [Google Scholar] [CrossRef]
- Ha, H.Y.; Park, C.J.; Kwon, H.S. Effects of non-metallic inclusions on the initiation of pitting corrosion in 11% Cr ferritic stainless steel examined by micro-droplet cell. Corros. Sci. 2007, 49, 1266–1275. [Google Scholar] [CrossRef]
- Ha, H.Y.; Park, C.J.; Kwon, H.S. Effects of misch metal on the formation of non-metallic inclusions and the associated resistance to pitting corrosion in 25% Cr duplex stainless steels. Scr. Mater. 2006, 55, 991–994. [Google Scholar] [CrossRef]
- Newman, R. Pitting corrosion of metals. Electrochem. Soc. Interface 2010, 19, 33–38. [Google Scholar] [CrossRef]
- Frankel, G.S. Pitting corrosion of metals a review of the critical factors. J. Electrochem. Soc. 1998, 145, 2186–2198. [Google Scholar] [CrossRef]
- Ha, H.-Y.; Lee, T.-H.; Kim, S.-J. Role of nitrogen in the active-passive transition behavior of binary Fe–Cr alloy system. Electrochim. Acta 2012, 80, 432–439. [Google Scholar] [CrossRef]
© 2020 by the authors. Licensee MDPI, Basel, Switzerland. This article is an open access article distributed under the terms and conditions of the Creative Commons Attribution (CC BY) license (http://creativecommons.org/licenses/by/4.0/).


