3.1. Sensitivity Analysis of Braking Speed on Tribological Properties of Cu-MMC
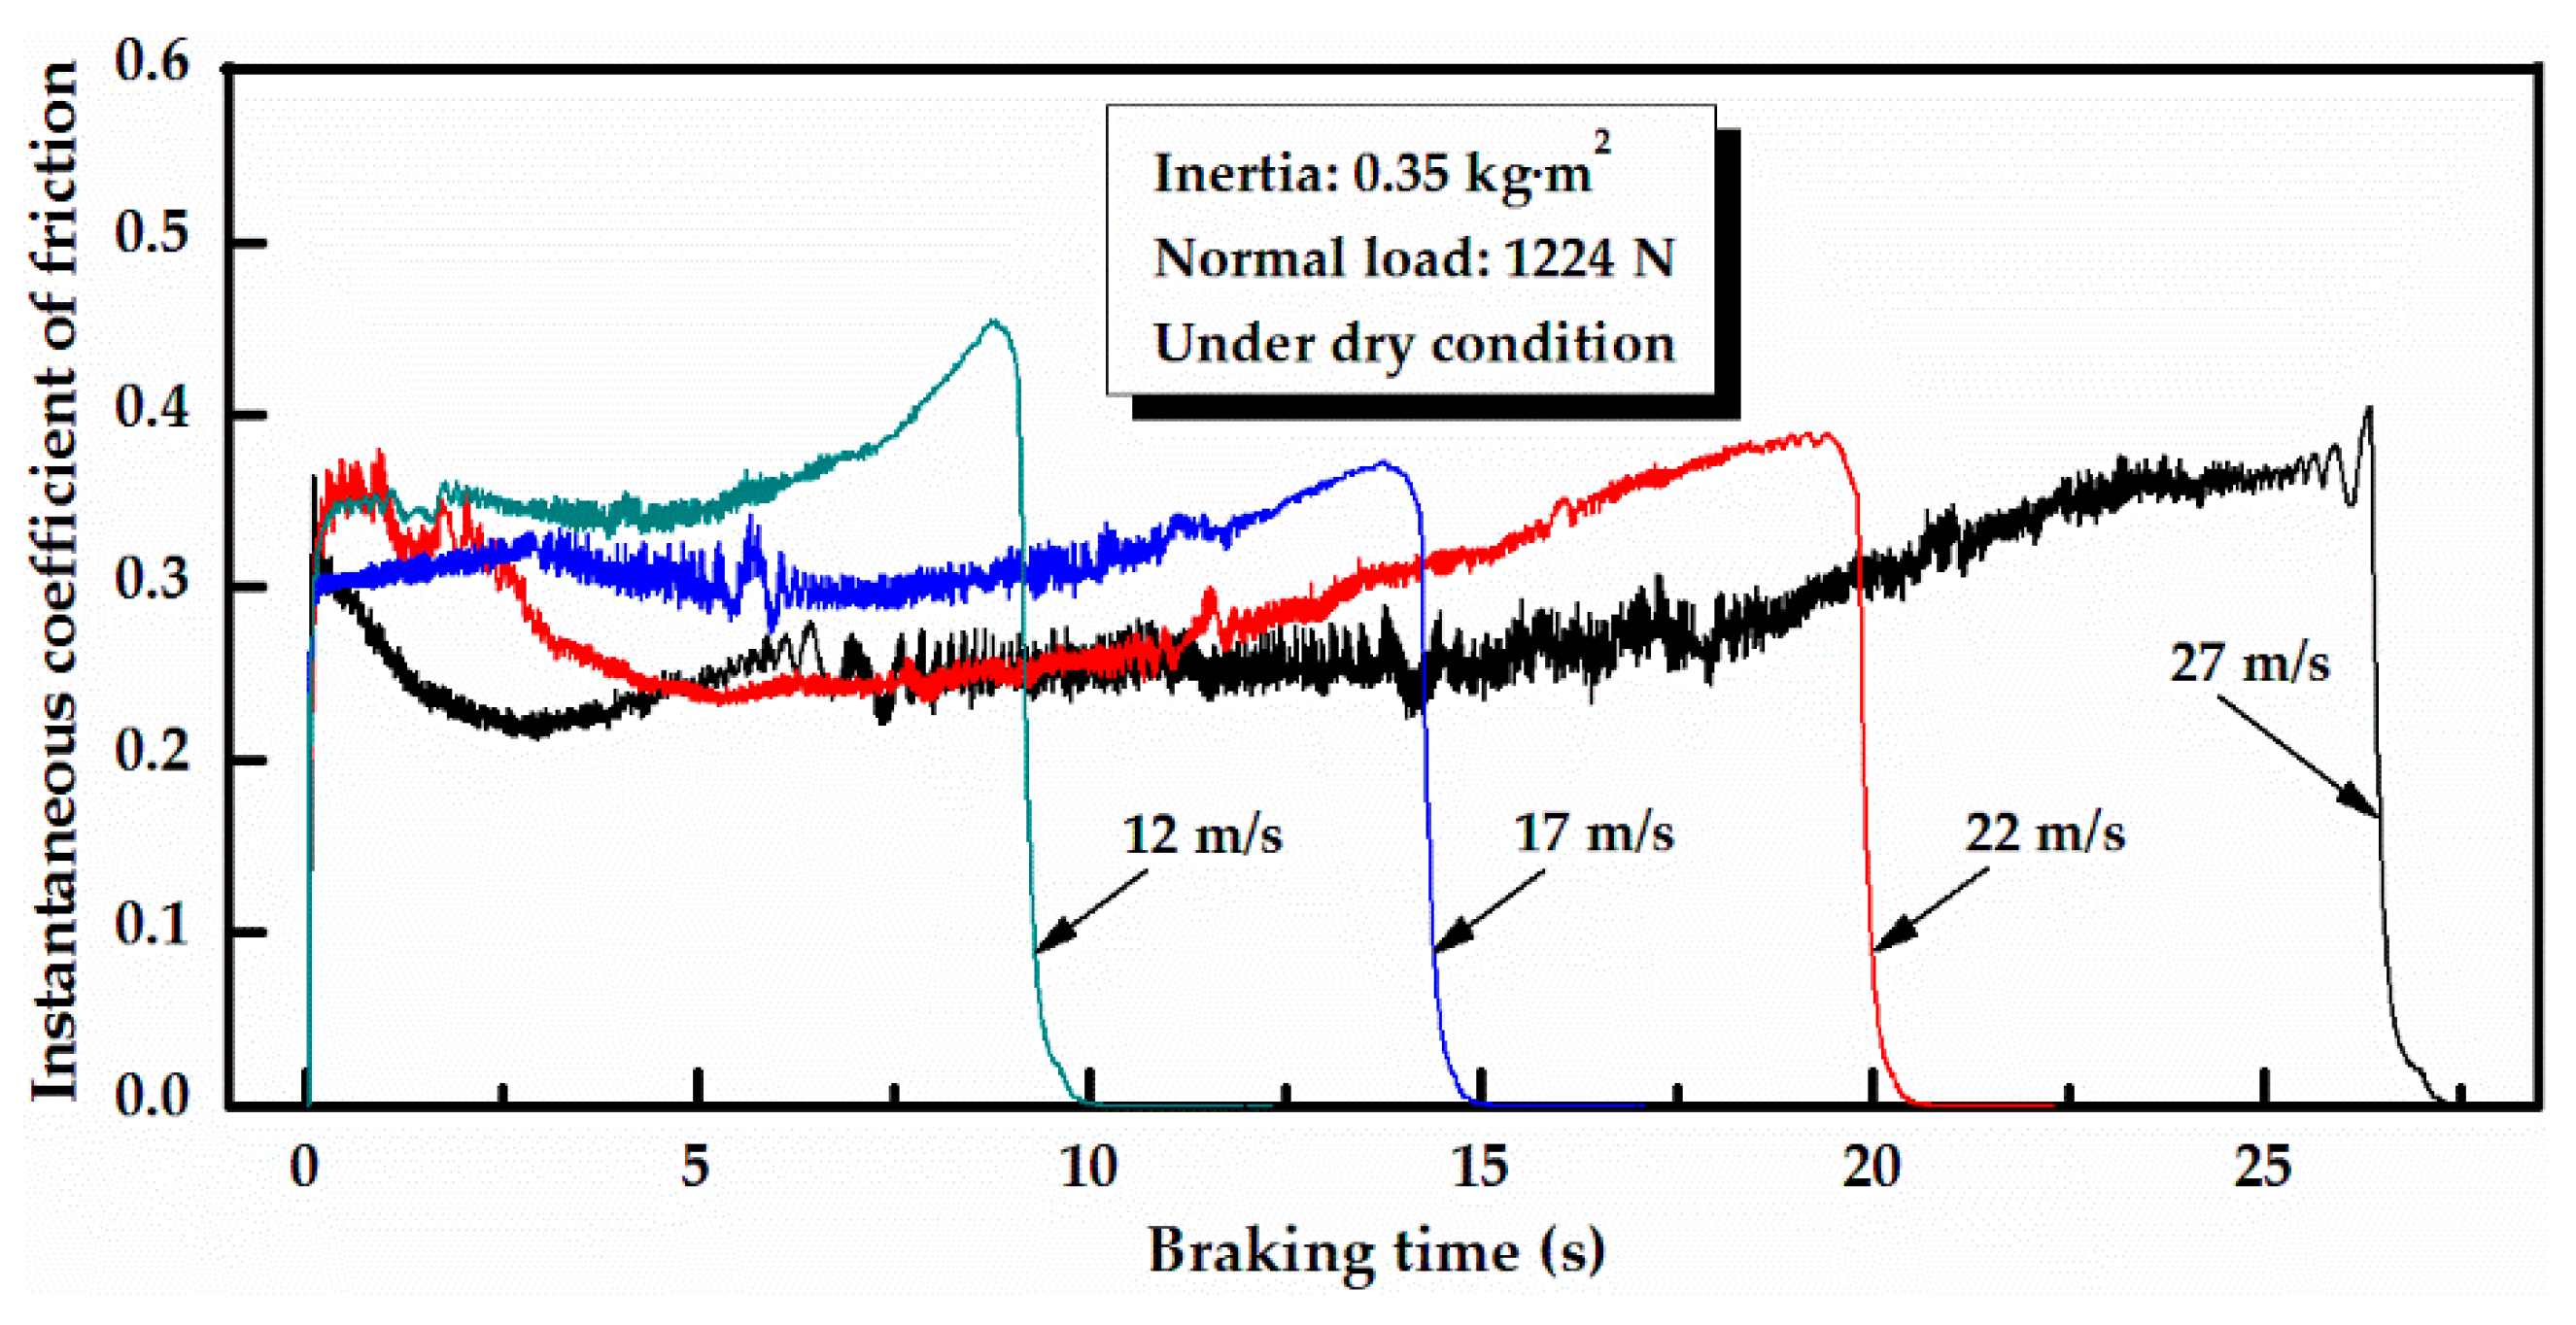
To ascertain the braking speed dependency of the friction and wear properties, Cu-MMC was tested at braking speeds in the range of 12–27 m/s under a fixed normal load of 1224 N. The representative braking curves of Cu-MMC at various braking speeds are presented in
Figure 3. On these curves, the braking operation started from the left and braking speed decreased down to zero at the right. During a braking cycle, the braking moment was recorded, calculated, and transformed to the instantaneous coefficient of friction by the computer. Thus, the braking curve had to be followed backwards. This indicates that the braking curves exhibited the typical “saddle shape”, and the braking time increased with the increase of the braking speed. At the braking speed of 12 m/s,
μa rapidly rose during the later period of braking, and the “rooster tailed torque trace” was obviously presented [
14]. The braking curve became smooth and steady at 17 m/s, and sequentially evolved into a distinct concave shape at 22 m/s. Compared with that at 22 m/s,
μa experienced a large fluctuation during braking at 27 m/s.
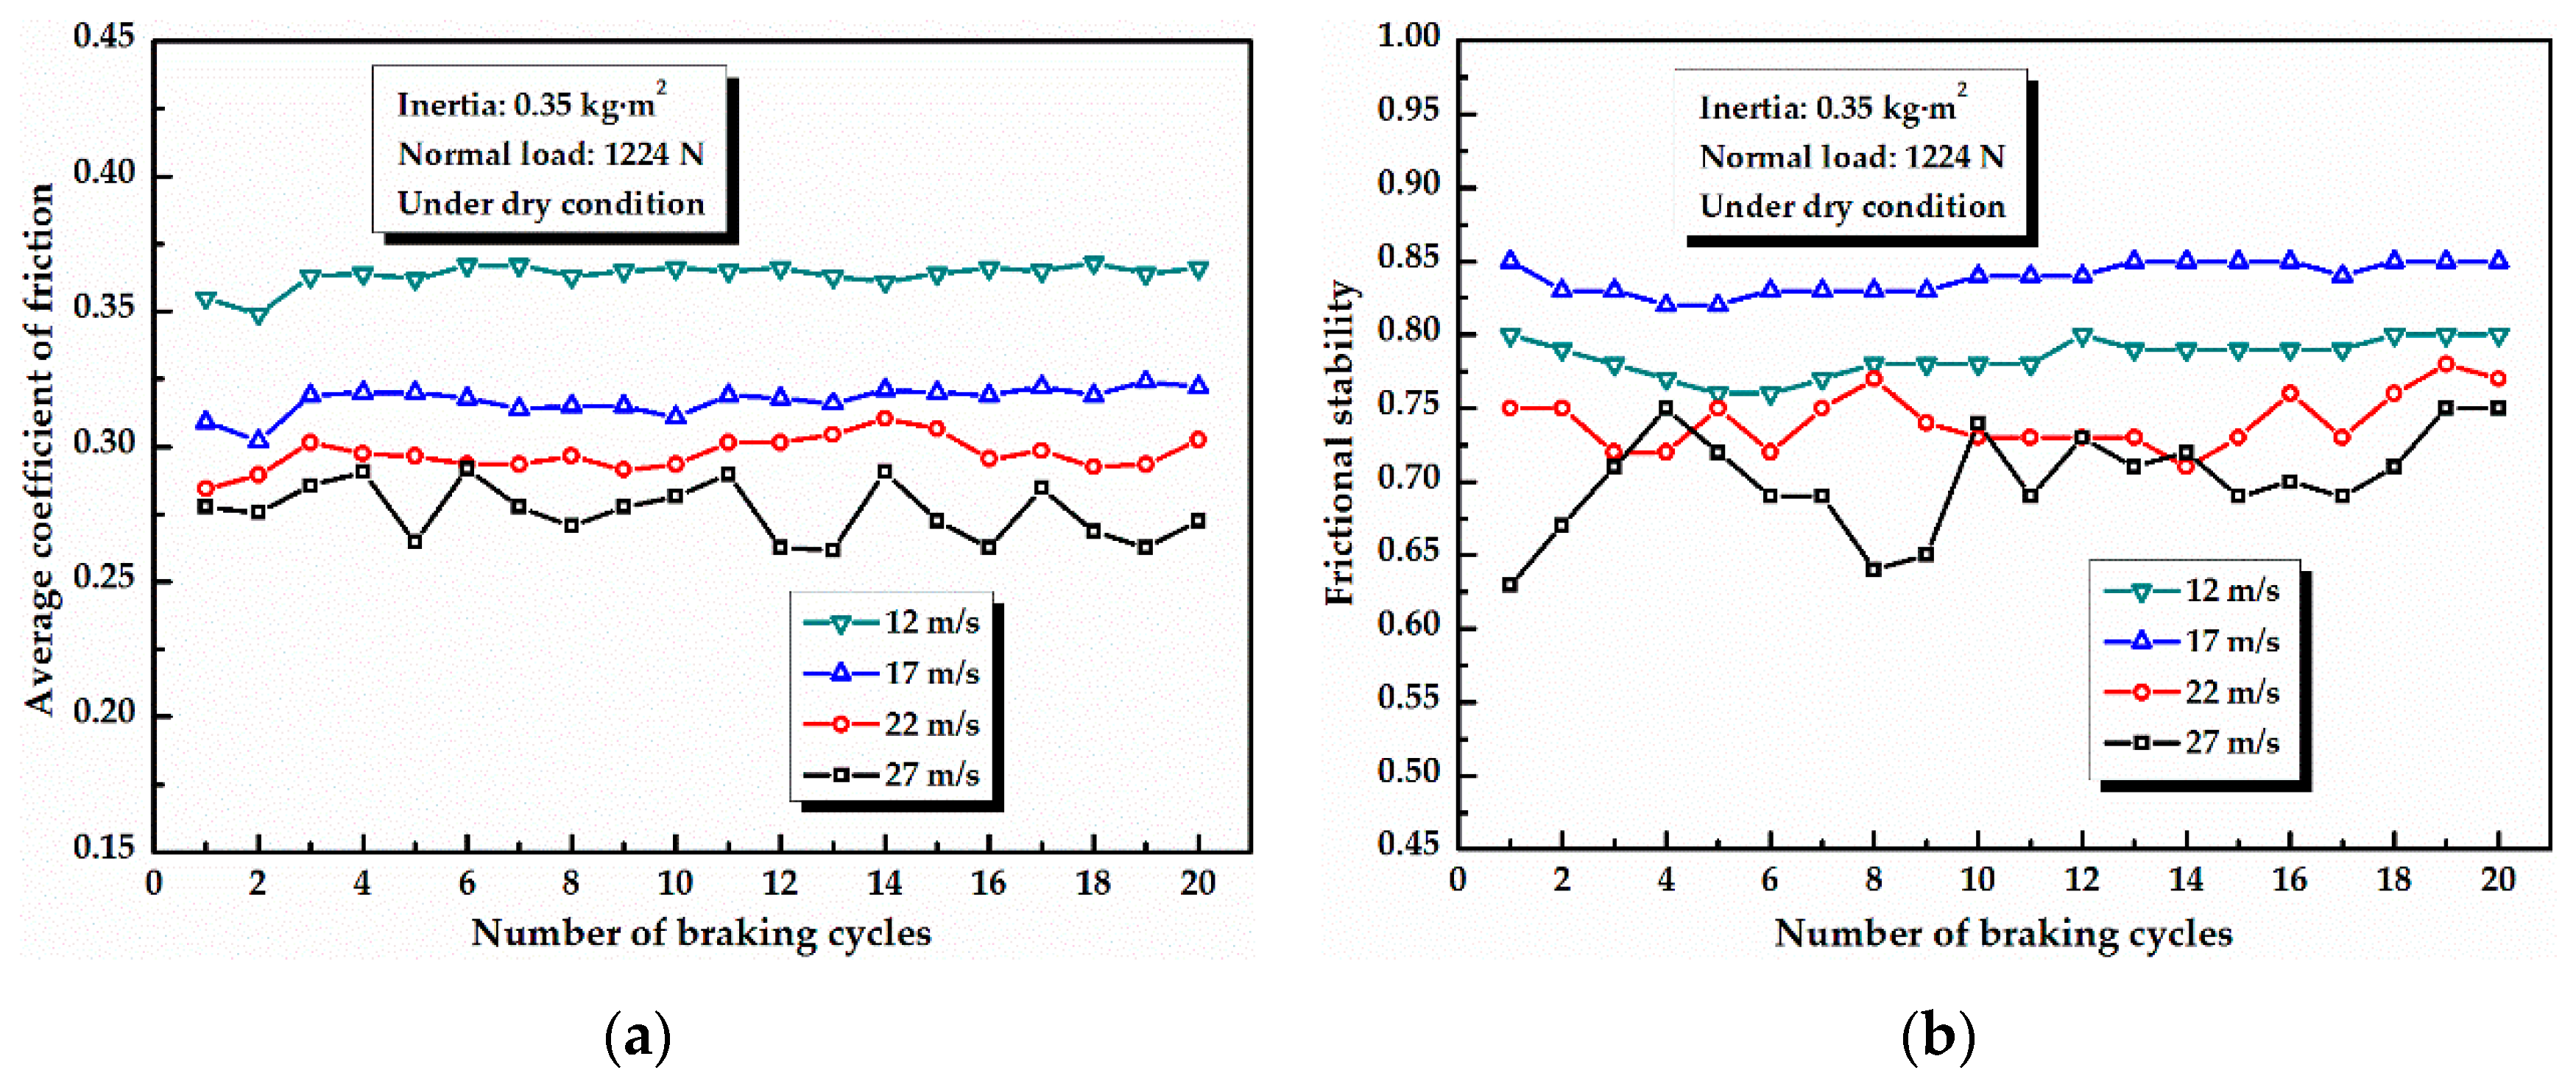
Figure 4 presents the variations of
μm and
FS with the number of braking cycles during 20 cycles of braking operation at various braking speeds. As can be seen in
Figure 4a,
μm abruptly decreased as the braking speed varied from 12 m/s to 17 m/s, and then gradually reduced to the minimum value at 27 m/s. At the braking speeds of 12 m/s and 17 m/s, as the number of braking cycles increased,
μm fluctuated initially, and then slightly reached the steady-state values and remained relatively stable.
μm exhibited little sensitivity to braking cycles at 22 m/s. A large fluctuation in
μm was evident when the braking speed increased up to 27 m/s.
Figure 4b shows that
FS presented different features at various braking speeds.
FS slightly varied around a relatively high value at 12 m/s with increasing the number of braking cycles. As the braking speed reached 17 m/s,
FS reached the maximum value that was almost constant.
FS at 22 m/s was smaller and more unstable than that at 12 m/s. At 22 m/s and 27 m/s, similar changes in
FS can be observed, but the fluctuation in the curve at 27 m/s became more remarkable than that at 22 m/s.
Figure 5 shows the influences of changes in the braking speed on the wear rate and maximum temperature on the worn surface of Cu-MMC. There was a slight decrease in the wear rate with increasing the braking speed up to 17 m/s after which a clear increasing trend was observed. In addition, the wear rate of Cu-MMC tested at 27 m/s was about twice more than that at 22 m/s. It indicated that temperature on the worn surface of Cu-MMC increased almost linearly from 97 °C to 344 °C with increasing the braking speed.
Figure 6 shows the comparison of the typical worn surfaces of Cu-MMC at different braking speeds after braking operations. The worn surface of Cu-MMC tested at the braking speed of 12 m/s, exhibited some scratch tracks parallel to the sliding direction, and was smeared by a thin and uncompleted friction layer, as illustrated in
Figure 6a, many graphite particles remained visible on the worn surface. At 17 m/s, a fairly smooth and continuous tribo-film, along with a few exiguous pits, was formed on the surface. There is no evidence of ploughed furrows on the worn surfaces at 17 m/s and 22 m/s, as shown in
Figure 6b,c, and many wide and deep hollows occurred on the worn surface at 22 m/s. The surface at 27 m/s presented the similar feature in comparison with that at 22 m/s, parts of the worn surface were covered by smooth tribo-films. Additionally, parts of the worn surface were occupied with a large number of large spalling grooves, and were split into separate fragments at 27 m/s.
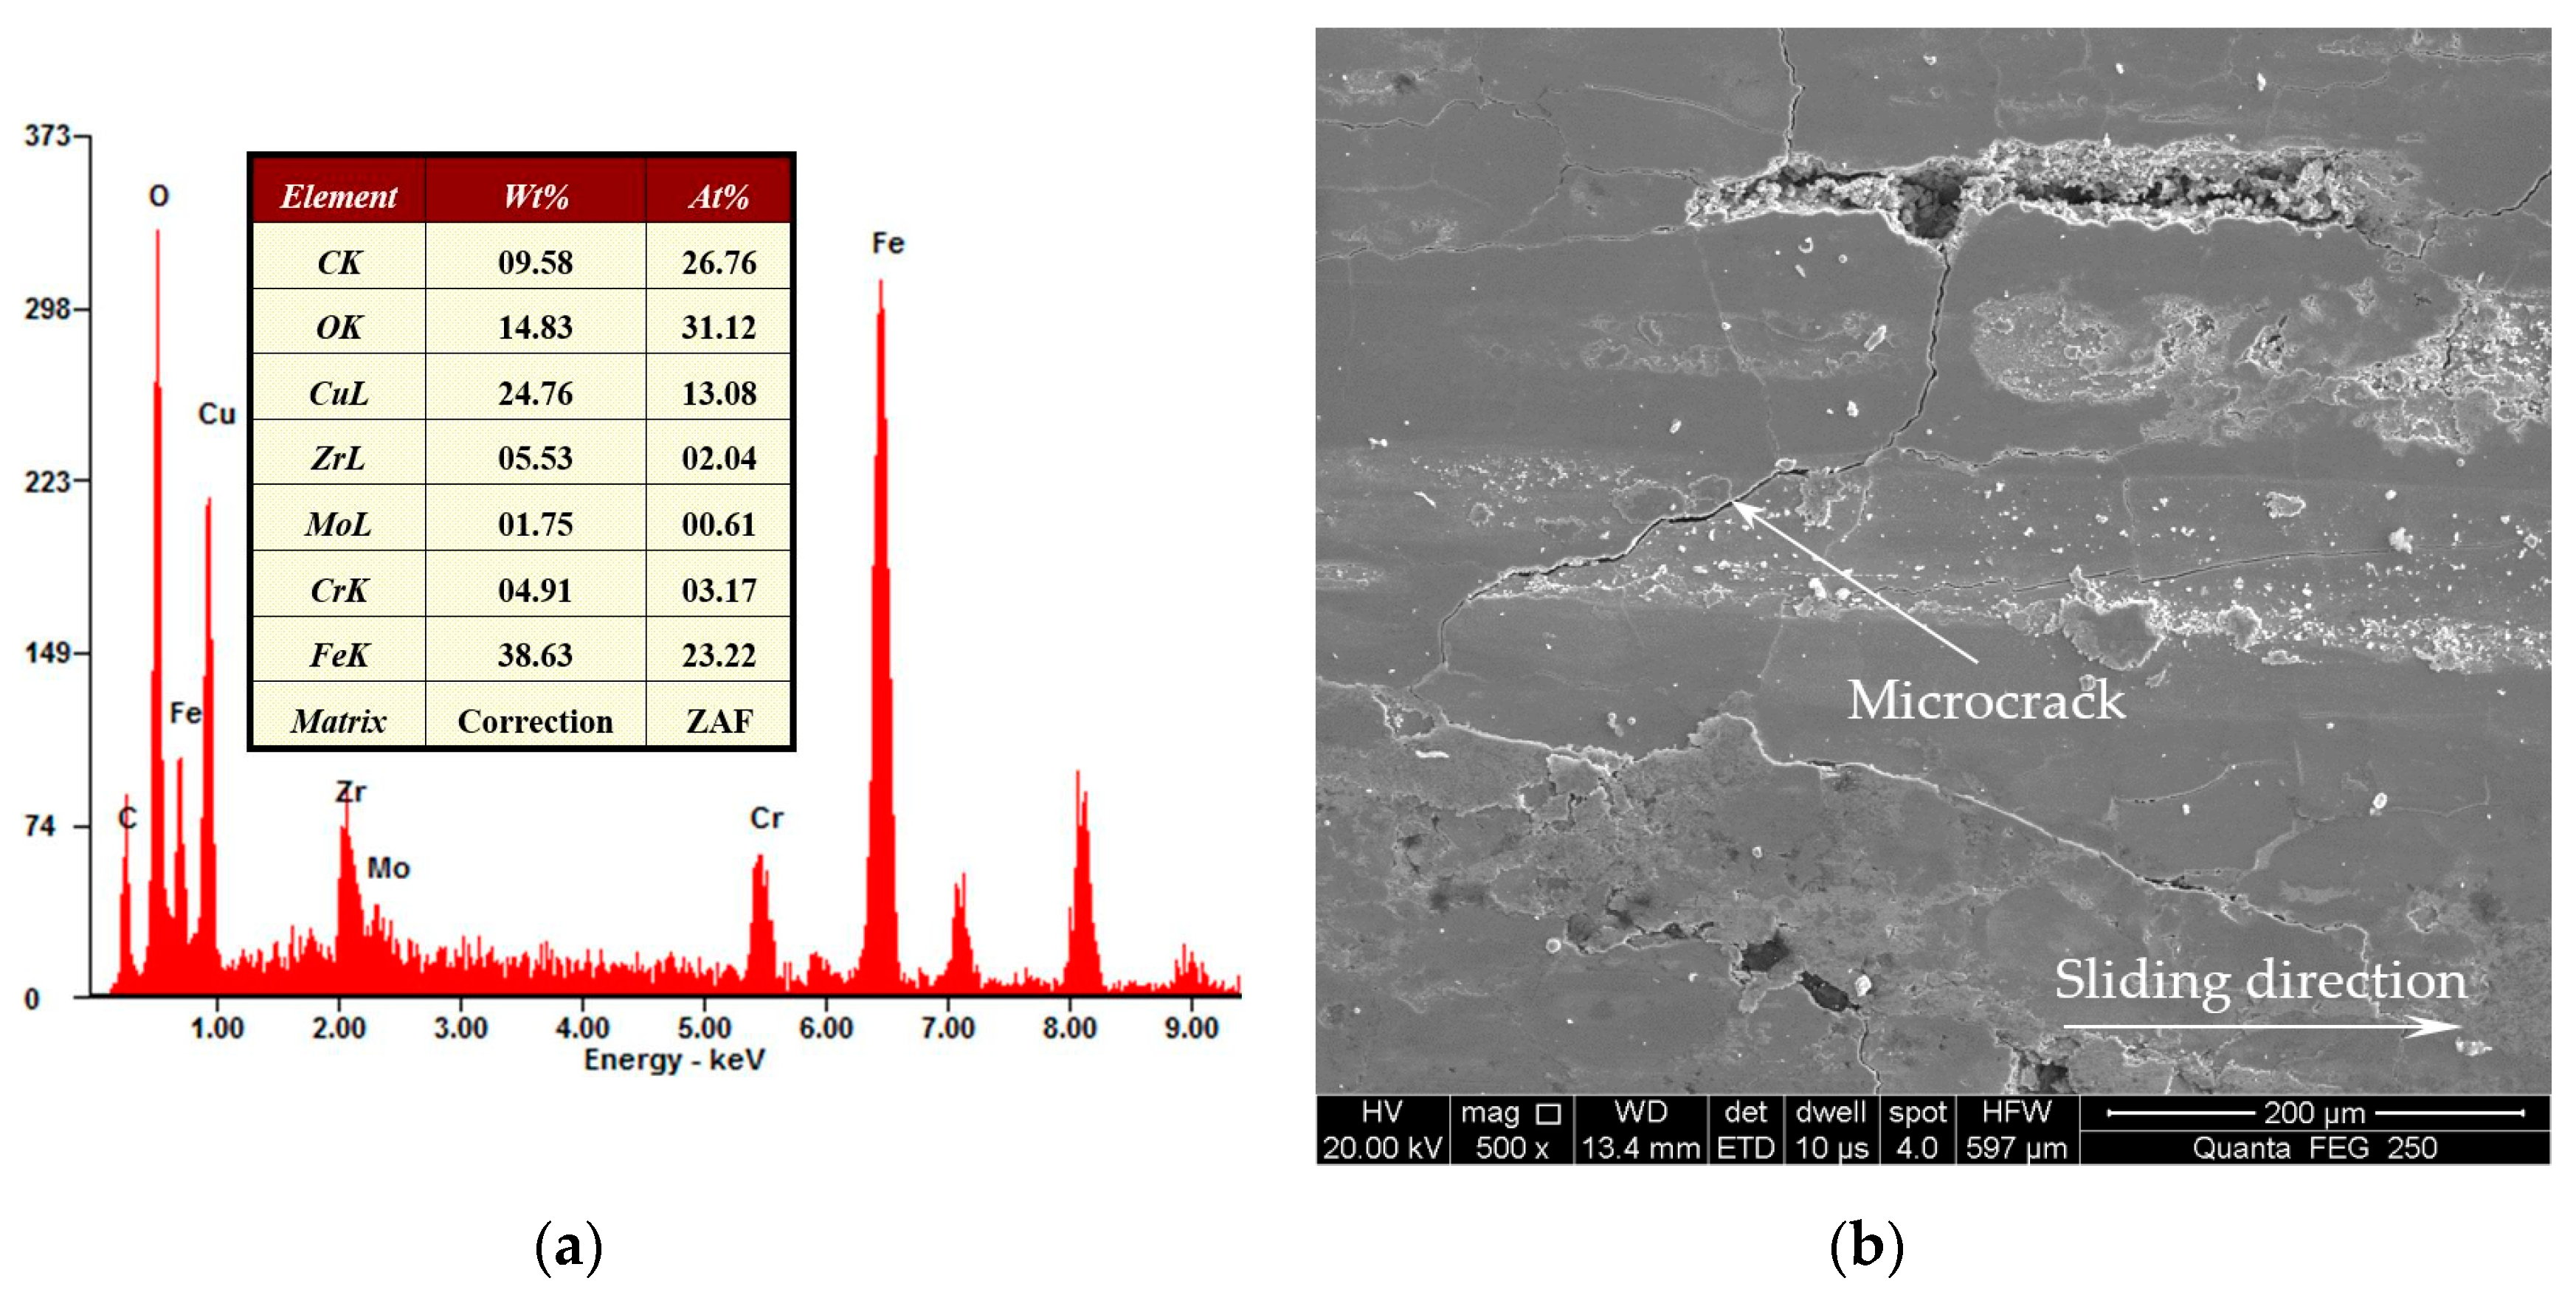
EDS analysis of the entire region in
Figure 6b and the surface observation at higher magnification were performed to identify the nature of the worn surface.
Figure 7a presents the primary peak of the O element as proof of the formation of oxide. Besides Cu, Zr and C elements were the main components of Cu-MMC, a considerable amount of Fe exceeding the Fe content in Cu-MMC was presented, indicating that some material transferred from the steel counterpart to the Cu-MMC surface. As shown in
Figure 7b, it can be noted that microcrack appeared on the worn surface at the braking speed of 27 m/s.
To reveal the variations of the surface morphologies and roughness with the braking speed, the three-dimensional surface characterizations of Cu-MMC after braking operations were intuitively analyzed by a 3D video microscope (KH-7700, HIROX, Tokyo, Japan). As shown in
Figure 8, the worn surface became smoother, and the surface roughness steeply decreased when the braking speed increased from 12 m/s to 17 m/s. Subsequently, the worn surface of Cu-MMC evolved to become uneven and rugged, and the surface roughness gradually increased as the braking speed increased up to 27 m/s.
In order to investigate the damages induced by friction in the vicinity of the worn surface (namely the subsurface), cross sections of Cu-MMC after braking operations were made parallel to the sliding direction and perpendicular to the worn surface. The mechanically mixed layer (hereafter referred to simply as “MML”) in the subsurface region, playing a vital role in the braking process, derives from the accumulation and compaction of the oxides as well as absorption and wear debris [
2,
15].
Figure 9 displays the microstructures of the typical subsurface regions of Cu-MMC tested at various braking speeds after braking operations. Clearly, there was almost no plastic deformation in the subsurface regions. At 12 m/s, the MML layer was very indistinct or even absent, indicating that a thin tribo-film or even no tri-film was formed on the worn surface. Although the exiguous pit existed, the surface of Cu-MMC was covered by a dense and continuous MML layer at a certain thickness at 17 m/s, as presented in
Figure 9b. The MML layer displayed a progressive decrease at increasing braking speed up to 22 m/s of both the coverage of the worn surface and relevant thickness, and the hollow became wide and deep. At 27 m/s, it is evident from
Figure 9d that some microcracks perpendicular to the worn surface were generated in parts of the subsurface region. As the braking process proceeded, the microcracks extended to the worn surface, resulting in the peeling of the friction layer. Therefore, the MML layer was hard to find and severely damaged in parts of the subsurface region exhibiting the rough and fluctuant morphology, as shown in
Figure 9e.
According to the molecular-mechanical theory of friction [
16,
17], the friction force can be represented as the sum of tangential resistance caused by mechanical engagement and attractive interactions between molecules at all contact points on friction surfaces. Though the surfaces were polished, it is inevitable that all engineering surfaces were covered with hills (asperities) and valleys. The mechanical component of the friction force included actions, such as the asperities and valleys meshed with each other, and the asperities embedded in the sliding surfaces, resulting in deformation, breaking, and ploughing on the engaging surfaces.
During braking process, the Cu-MMC/steel friction pairs converted most of the kinetic energy into thermal energy via friction acting. All other things being equal, with increasing the braking speed, the thermal energy gradually increased, leading to an increase in temperature on the worn surface of Cu-MMC (
Figure 5). At the braking speed of 12 m/s, the thermal energy generated during braking was insufficient to soften the asperities, and oxidation of the Cu-MMC surface did not occur. The asperities without the plastic deformation cannot be easily sheared off from the surface, and the oxidation film was produced on the surface with difficulty, resulting in a rough and uneven worn surface (
Figure 8a). Therefore, the asperities and valleys intensely meshed with each other, and the asperities embedded in the dual surfaces, inducing the high friction coefficient and unstable braking curve with the severe “tail peak”. Meanwhile, the worn surface smeared by a thin and uncompleted friction film exhibited little sensitivity to braking cycles and was slightly ploughed by the hard asperities on the mating surface, so Cu-MMC exhibited the low wear rate,
μm and
FS were stable with increasing braking cycles. It displays a typical feature of two-body abrasive wear at 12 m/s.
As the braking speed increased to 17 m/s, the increased thermal energy could lead to sufficiently high surface temperature that resulted in the generation of oxides on the worn surface (
Figure 7a), and the asperities started to deform, soften and break during braking. Many asperities were sheared off from the surface, causing the formation of wear debris and small adhesive pits. The accumulation and compaction of the oxides as well as the wear debris gave rise to the formation of the dense and continuous MML layer (
Figure 9b), leading to a significant decrease in surface roughness and the smooth worn surface. The MML layer reduced the ploughing effects of the asperities, increased in the actual contact area of the worn surface and gave sustained wear protection to Cu-MMC. So compared with those at 12 m/s, Cu-MMC displayed the lower friction coefficient and wear rate, the braking curve became more stable, braking cycles had less impacts on
μm and
FS at 17 m/s. The main wear mechanism of Cu-MMC was mild adhesive wear and oxidation.
Owing to large amounts of thermal energy generated during braking, temperature rapidly on the worn surface increased as the braking speed reached 22 m/s. The high flash temperature caused the deformation, softening and melting of the asperities, and a significant amount of material transfer occurred, resulting in the adhesion between the two counterfaces [
18]. When the two counterfaces moved relative to each other, the adhesive junctions with high strength were broken by frictional shearing actions, leaving behind deep and wide hollows on the Cu-MMC surface. In addition, the rupture was serious for surface oxide films that was susceptible to the high temperature. Hence, the worn surface of Cu-MMC displayed a rough and fluctuant morphology (
Figure 6c). Consequently, the friction coefficient and braking curve at 22 m/s became unstable, and the wear rate of Cu-MMC was very high. Furthermore, parts of the worn surface were covered by smooth tribo-films, and melting of the asperities appeared, leading to the low friction coefficient and the braking curve in distinct concave shape. The severe adhesive wear and oxidation were considered as the dominant wear mechanism.
An enormous increase in temperature on the Cu-MMC surface occurred at 27 m/s in comparison with that at 22 m/s, promoting the deformation, softening, and melting of the asperities, as well as oxidation of the Cu-MMC surface. The thick MML layer was generated by accumulating and compacting the wear debris and oxides under the normal load, and the molten thin film was formed on the surface at elevated temperature, thus causing a decrease in the friction coefficient. As the braking process proceeded, due to the synergistic effects of the high temperature, tangential stress and the normal load, microcracks originated from the MML layer (
Figure 9c), then extended beyond the worn surface and interconnected with each other, leading to the occurrence of delamination and large spalling grooves on the worn surface [
19]. Accordingly, Cu-MMC exhibited the highest wear rate, and the most unstable friction coefficient and barking curve at 27 m/s among these experiments. The dominant wear mechanism of Cu-MMC was delamination wear and oxidation.
3.2. Sensitivity Analysis of Normal Load on Tribological Properties of Cu-MMC
To evaluate the effect of the normal load on the tribological properties of Cu-MMC, the braking tests were conducted under different normal loads at the braking speed of 27 m/s.
Figure 10 shows the typical braking curves of Cu-MMC tested under various normal loads. Clearly, the braking time for one braking cycle obviously decreased as the normal load increased, and the braking curves were also in the shape of horse saddle. There is a substantial fluctuation in
μa under the normal load of 612 N, while that for 1224 N was comparatively stable. Under the normal load of 1836 N, Cu-MMC exhibited the most stable friction coefficient among these experiments, and
μa remained almost constant during the braking process.
Figure 11 shows
μm and
FS of Cu-MMC as a function of the number of braking cycles under various normal loads. In general, a significant decrease in
μm occurred as the normal load increased from 612 N to 1224 N, and then a slight decreasing trend under the normal load of 1836 N was observed in
Figure 11a. As mentioned in the previous subsection, both
μm and
FS obviously fluctuated within a considerable range as the braking cycles increased under the normal load of 1224 N. Compared with those under 1224 N,
μm and
FS became significantly larger and more stable, and braking cycles had less impact on
μm and
FS under 612 N. Under 1836 N,
μm gradually decreased with an increasing number of braking cycles and then slightly fluctuated around 0.26. The stable
FS retained the highest value, as illustrated in
Figure 11b.
Figure 12 presents the dependences of the wear rate and maximum temperature on the worn surface of Cu-MMC on the normal load. It is clear that the normal load had significant effect on the wear rate of Cu-MMC. The wear rate under 1224 N was approximately twice that of Cu-MMC under 612 N, and then promptly decreased when the normal load rose to 1836 N. The maximum temperature on the worn surface of Cu-MMC suddenly increased from 232 °C under 612 N to 344 °C under 1224 N, and then slowly increased to 365 °C under 1836 N.
Figure 13 shows SEM photographs and 3D morphologies of the typical worn surfaces of Cu-MMC tested under different normal loads after braking operations. The worn surface, covered by a non-continuous friction film along with some big pits, displayed a relatively rough morphology under 612 N. When the normal load reached 1836 N, the worn surface appeared some scratch tracks parallel to the sliding direction, and was completely covered by a smooth friction layer, leading to the lowest surface roughness.
Figure 14 presents SEM micrographs of the typical subsurface regions of Cu-MMC under various normal loads after braking operations. Apparently, there was no evidence of severe plastic deformation in the subsurface regions. Besides the big pit, an inhomogeneous coverage of the MML layer under 612 N was observed in
Figure 14a. Under the normal load of 1836 N, a dense and continuous MML layer at a certain thickness was formed, and no pit was visible.
Figure 14c shows the EDS spectrum of the region A marked in
Figure 14b. Compared with those of Cu-MMC, Fe and O levels of the MML layer were much higher, but Cu content was lower, Zr element was not detected. Obviously, many components of the MML layer transferred from the steel counterpart.
According to the classic law of friction [
20], the friction force is directly proportional to the normal load. The higher the normal load is, the greater the friction force is. All other things being equal, compared with those under 1224 N and 1836 N, Cu-MMC under 612 N obtained the minimum value of the friction force, so it required more braking time to achieve a complete stop. The thermal energy generated during braking reduced due to the windage resistance, and it took a long time to dissipate the thermal energy, resulting in significant decreases in the braking power and the surface temperature (
Figure 12). Thereby, the compressive stress and surface temperature were insufficient to cause the deformation of the asperities under 612 N, and the asperities cannot be easily sheared off. The asperities and valleys intensely meshed with each other during braking, inducing the high friction coefficient and severe fluctuation in the braking curve. The fluctuation that occurred during braking process was an indication of the thermoelastic friction instability [
4,
21]. In comparison with those under 1224 N, the adhesion between the two counterfaces and oxidation of the Cu-MMC surface were impaired under 612 N, so Cu-MMC presented the lower wear rate and higher
FS, and
μm and
FS exhibited little sensitivity to braking cycles. The main wear mechanism was mild adhesive wear and oxidation.
As the normal load reached 1836 N, a large amount of thermal energy rapidly accumulated on the surface within a short time, leading to a remarkable increase in temperature on the surface. Under considerable compressive stress, many broken asperities and severe oxidation of the Cu-MMC surface as well as significant amount of material transfer appeared at elevated temperature, and almost all the wear debris and oxides produced were densely compacted onto the surface. Eventually, a dense and continuous MML layer at a certain thickness tribo-film was formed on the worn surface, which resulted in the lowest surface roughness and a significant increase in the actual contact area, so Cu-MMC captured the lowest friction coefficient and the most steady-state friction characteristics among these experiments. Oxidation loss caused by high temperature led to the wear rate, and the ploughing effect on the worn surface occurred. However, compared those under 1224 N, Cu-MMC under 1836 N exhibited the lower wear rate, and braking cycles had less impact on μm and FS. Oxidation and abrasive wear mechanism were operative.
It is very expensive and time-consuming to conduct the full-scale dynamometer tests that simulate the real operating conditions of Cu-MMCs. So, lots of fundamental studies on the properties of Cu-MMCs should be performed using the subscale dynamometer under different conditions prior to the full-scale dynamometer tests. Therefore, this work provides a guide for material designs and practical applications of Cu-MMCs. Based on the results gained in this paper, a newly Cu-MMC that holds great promise for brake pads in high-speed trains was developed, as shown in our previous report [
4].


