Article

The Polythermal Section of Ti-22Al-xNb (30-78at.%Ti) in Ti–Al–Nb System

1
School of Materials Science and Engineering, Central South University, Changsha 410083, China
2
State Key Laboratory of Powder Metallurgy, Changsha 410083, China
3
Key Laboratory of Non-ferrous Metallic Materials Science and Engineering, Ministry of Education, Changsha 410083, China
4
Faculty of Mechanical Engineering, Koszalin University of Technology, ul. Śniadeckich 2, 75-453 Koszalin, Poland
5
Technallium Engineering & Consulting, Fliederweg 6, D-92449 Steinberg am See, Germany
*
Authors to whom correspondence should be addressed.
Metals 2020, 10(7), 871; https://doi.org/10.3390/met10070871
Submission received: 24 May 2020 / Revised: 21 June 2020 / Accepted: 24 June 2020 / Published: 30 June 2020

Abstract

:
The polythermal section of Ti-22Al-xNb (30–78 at.% Ti) in the Ti-Al-Nb system was studied using X-ray diffraction analysis (XRD), differential thermal analysis (DSC), and electron probe micro-analysis (EPMA). No new ternary compounds were found in this work. The polythermal section has five three-phase regions, nine two-phase regions, and three single-phase regions. The O phase transition is confirmed to occur below 1000 °C. A four-phase invariant reaction β + σ → O + δ was found at 931 °C.

Graphical Abstract

1. Introduction

Because of their light weight, promising mechanical properties and good oxidation resistance [1], titanium–aluminum intermetallic alloys have become very important for the development of high-performance engines for airplanes [2]. The addition of an appropriate amount of niobium can significantly improve the oxidation resistance, the thermal deformation and hot creep properties of these alloys [3]. Ti2AlNb alloys are typical representatives of them [4,5]. The general composition of these alloys is usually Ti-(18–30 at.%) Al-(12.5–30 at.%) Nb. Many research works have been undertaken to fully understand the relationship between the composition, process, microstructure, mechanical properties, and performance of these alloys [6,7]. Among them, Ti-22Al-25Nb and Ti-22Al-27Nb have shown excellent potential for aeronautic applications [8,9]. To further improve the properties of these alloys, it is necessary to have a deeper understanding of the microstructure evolution during the thermomechanical processing. Therefore, the phase equilibrium information of the Ti-Al-Nb system is indispensable to model and to monitor the microstructure evolution of these alloys by accurately selecting the process temperatures.
Previous studies of Ti-Al-Nb systems have mostly focused on isothermal sections or the phase transformation of specific alloys [10,11,12,13,14,15,16]. Subsequently, calculations of the phase diagram (Calphad method) [17,18] were carried out by several researchers. In 1989, Kaltenbach et al. [10] obtained the first isothermal section of Ti-Al-Nb at 1200 °C experimentally. In 1992, Kattner and Boettinger [19] optimized the ternary system for the first time based on the existing information of the binary system. Due to the lack of thermodynamics data and phase equilibria, their results are questionable. In 1995, Miracle et al. [20] obtained a partial polythermal section of Ti-22Al, but the Ti-Al boundary and the O phase region of the polythermal section are quite different from those reported later [21,22]. For example, Muraleedharan et al. [23] found that the upper temperature limit for the stability of the O phase is about 1000 °C. Above 1000 °C, the O phase disappears. However, in Miracle’s research [20], the O phase did not disappear until 1050 °C. In 2005, Raghavan [15] reviewed the phase relationships in the ternary system reported in the previous literature, and experimentally obtained a liquid surface projection diagram and the 1200, 1100, 1000 °C isothermal sections. In 2009, Witusiewicz et al. [17,18] re-evaluated the binary systems in the Ti-Al-Nb ternary system and re-optimized the ternary parameters of this ternary system. The calculated phase diagrams are consistent with the experimental results at that time. The same year, Cupid et al. [24] also independently completed the optimization of the Ti-Al-Nb ternary system. The calculated isothermal sections were in good agreement with the experimental results obtained at 1100 °C and 1200 °C, but differed from those of Witusiewicz’s work [18] in the β, the α, and the O phase regions. Raghavan [25] summarized the recent results again in 2010. In 2018, Li et al. [21] updated the isothermal sections at 1000 °C and 1150 °C again, and studied the phase relationship at 1100°C completely. They verified that the O phase was only stable below 1000 °C and the β0 phase was found to be stable at 1000 °C. However, the γ1 phase reported by Ding et al. [26] and Chen et al. [12] was not confirmed at 1000 °C. Table 1 lists the accepted phase names and crystal structures of the Ti-A1-Nb ternary system [18].
Although significant progress has been made in the phase diagram research of the Ti-Al-Nb ternary system, the existing phase diagram is not completely correct. For example, according to the polythermal section calculated by Witusiewicz et al. [18], the α2 phase does not appear in the Ti-22Al-23Nb alloy. However, after solution treatment at 1050, 1100 and 1150 °C for 2 h, and aging at 815 °C for 8 h, Rollett et al. [27] found α2 in this alloy. The composition range of the existing phase regions in the polythermal section are inconsistent with each other [18,20,24,28]. The purpose of this work is to determine the polythermal section of Ti-22Al-xNb (30–78 at.% Ti). The results will be useful for determining the heat treatment or hot working process of Ti-22Al-xNb alloys and to provide more accurate data for the optimization of the Ti-Al-Nb ternary system.

2. Materials and Method

Nine alloy components (listed in Table 2), 27 samples (listed in Table 3), each with a mass of approximately 12 g, were prepared by arc melting on a water-cooled copper crucible under high purity argon (99.99%). Single metals, Ti (purity of 99.99 at.%), Al (purity of 99.99 at.%), and Nb (purity of 99.99 at.%), were supplied by China Jinyu Materials Technology Co. All samples were weighed out to a precision of 0.001 g and formulated to contain 22 at.% Al. At the same time, to ensure the uniformity of the alloys, the sample buttons were melted, turned over and re-melted at least six times. The mass loss of each sample was less than 1%. Then, the obtained samples were evenly divided into four parts, three of which were sealed into different evacuated quartz capsules back-filled with high purity argon (99.99%) together with Ti chips as oxygen getters. Then, one of three parts was annealed at 1000 °C for 720 h. Another part was annealed at 900 °C for 1440 h and the last part was annealed at 800 °C for 2160 h in laboratory muffle furnaces. After annealing, samples were quenched in ice water to freeze the microstructure obtained during the annealing at the considered temperatures.
The annealed samples were mechanically polished to remove contaminated surface layers. Electron Probe Microanalysis (EPMA) (JEOL JXA-8530F, Japan Electron Optics Laboratory CO., Ltd, Tokyo, Japan) was used to observe their microstructure and to determine the chemical compositions of single phases. Based on the EPMA composition results, the existing phases in the alloys were preliminarily identified.
To further confirm the phases in each sample, X-ray diffraction analysis (XRD) was carried out on powder and bulk materials using an X-ray diffractometer (Rigaku D-MAX/2550 VB, Japan Rigaku Co., Tokyo, Japan) with Cu Kα radiation (40 kV and 250 mA). The scanning range was 10−90° with a speed of 8°/min. The XRD results were analyzed using the program Jade 6.0 (Materials Data Inc., California Grown, CA, USA).
Differential scanning calorimetric (DSC) analysis was conducted either on a Labsys EVO (Setaram Inc., Lyon, France) or a Netzsch 449 F3 (Nettzsch-Gerätebau GmbH, Selb, Germany) to determine the temperature of phase transformations. The experiments were performed under high purity argon (99.99%), using Al2O3 crucibles and platinum crucibles. The heat rate of 20 °C/min was selected as it ensures the best phase transition initiation during thermal analysis, as the driving force is higher in a shorter time. The choice of the crucibles was discussed by Kostov et al. [29], who showed that the crucible stability depends on the titanium activity and temperature. As the activity of Al and Ti in the alloy is lower than one, the oxidation pressure is then higher compared to those of the Al/Al2O3 and Ti/TiOx equilibria, respectively [30]. Therefore, the alloy does not react with the crucible. The DSC curve remains stable throughout the heating process. Before the measurements, the apparatus was calibrated using high purity calibration standards including low-melting pure metals (Sn (213.9 °C), Zn (419.53 °C), etc.), medium-melting metals (Al (660 °C), Ag (961.78 °C), etc.) and high-melting metals (Au (1064.18 °C), Cu (1083.4 °C), etc.). Since the Ti-Al-Nb system was studied in this work, pure Ti metal was also used during the calibration process. Unlike other pure metals, with pure Ti metal, careful attention was paid to check whether it could have been contaminated by an unwanted reaction with the crucible materials. It was proven that pure Ti and crucibles remained stable during the experiments, and no reaction occurred.

3. Results

3.1. Analysis of DSC Results

Prior to DSC analysis, all samples were annealed at 1000 °C for 720 h, 10–20 mg thin slices were cut from the ingots, and placed with forceps in the DSC instrument and it was subsequently flushed with argon. The DSC heating curves are shown in Figure 1. The temperature that corresponds to the intersection of the horizontal baseline and the tangent line of the endothermal peak is marked as the phase transformation temperature.
As shown in Figure 1, only one endothermal effect was found in the temperature heating curves of alloy #5. According to the results of Miracle et al. [20], this was ascribed to the phase transformation O + β → β. In alloys #6, #7, #8, and #9, an endothermic reaction was observed at the same temperature (931 °C). According to the experiment and calculation results of Witusiewicz et al., it is preliminarily speculated that this reaction is a four-phase reaction of β + σ O + δ. The subsequent EPMA and XRD experimental results also support this inference.

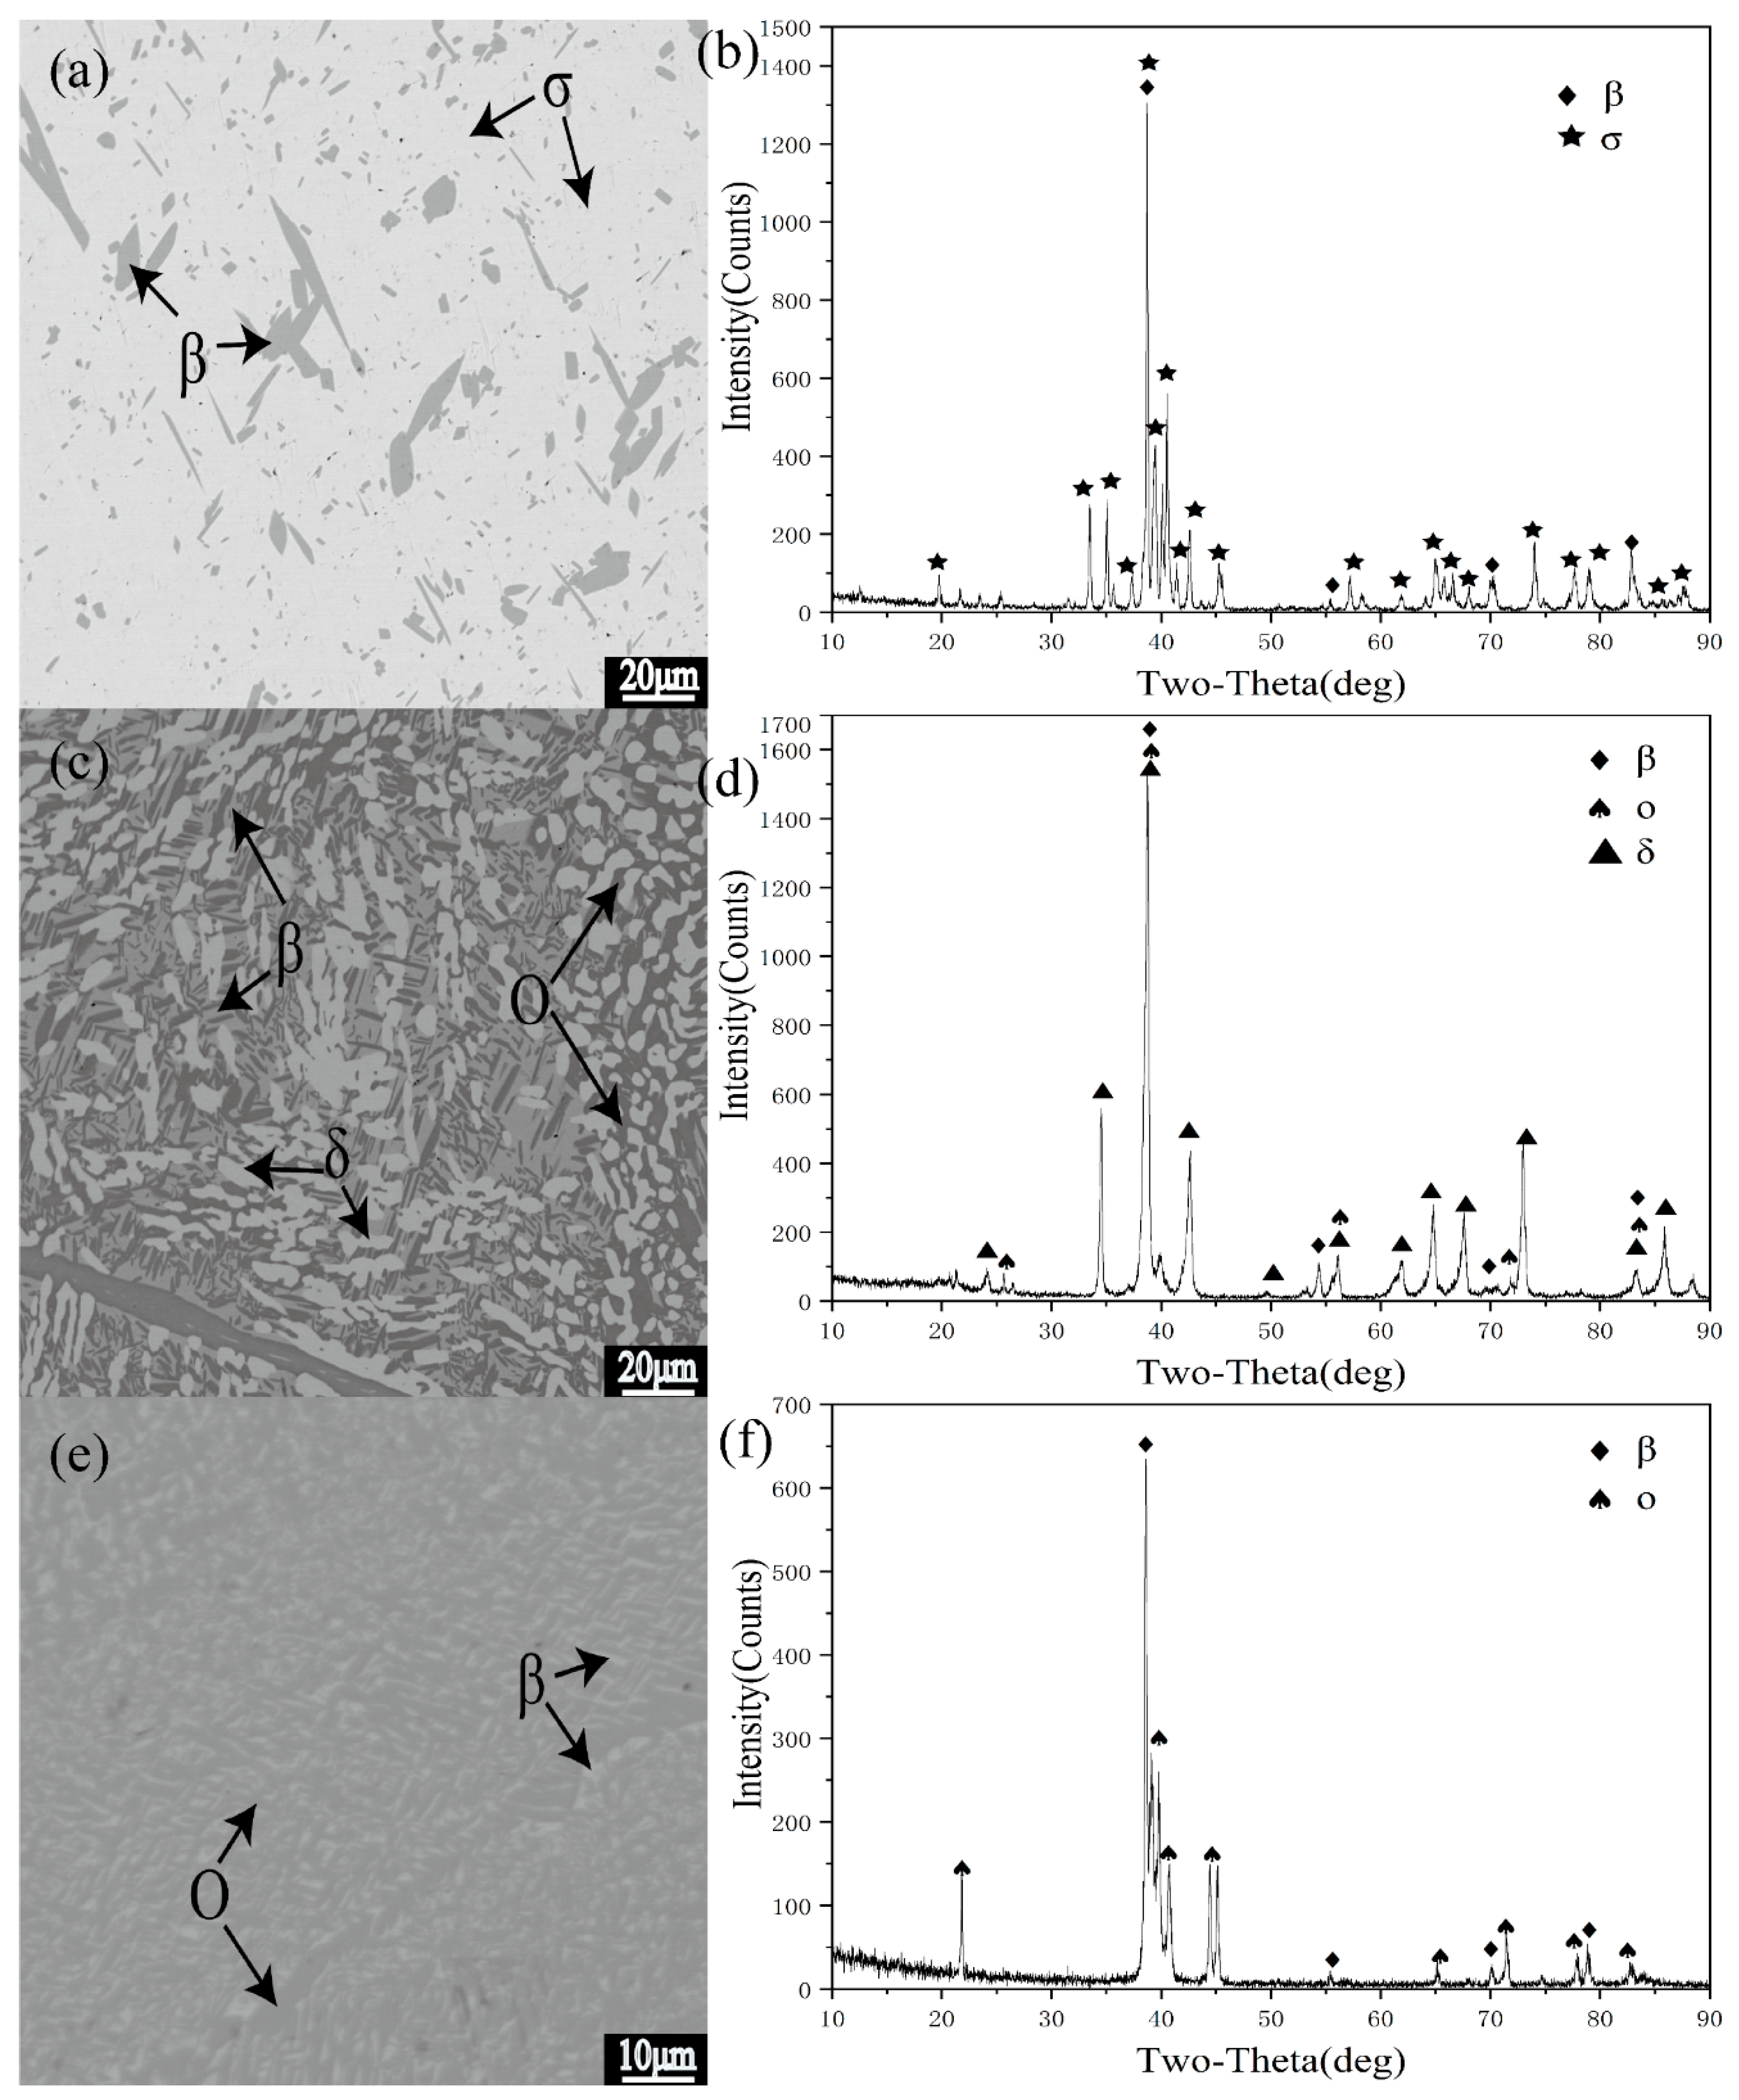
3.2. Analysis of Typical Alloys in Polythermal Section

To accurately analyze the phase transformation which occurred at each temperature peak observed in the DSC curves, alloys were annealed at 800, 900, and 1000 °C for 720, 1440, and 2160 h, respectively. The corresponding microstructures and phase compositions were investigated by means of EPMA, and the phases were identified by XRD analysis.
Based on the experimental data obtained by EPMA and XRD, Table 3 summarizes the phase constitution and corresponding phase compositions in all equilibrium alloys at 800, 900, 1000 °C, respectively. Meanwhile, we used imagetool to roughly calculate the phase percentage in the samples. These are also listed in Table 3. The phase relationships and transformations of several key alloys are discussed below.
The Nb concentration in each phase can be calculated as 100 (Al concentration in at.%+ Ti concentration in at.%).
Alloy #1 was used to verify the transformation process of α2 α2 + β. According to the DSC measurements (Figure. 1 #1), the phase transformation should occur at 950 °C. The microstructure of annealed alloy #1 and the corresponding XRD analysis results after heat treating at 900 and 1000 °C are shown in Figure 2a,b and Figure 2c,d, respectively. If we compare (a)/(c) and (b)/(d) in Figure 2, the α2 phase transforms into the α2 + β phase between 900 and 1000 °C. Therefore, it can be concluded that the phase transformation of α2 to α2 + β occurs at 950 °C.
Alloy #4 was designed to confirm the transformation of the ternary β + α2 + O phase region. The DSC results (see Figure 1, #4) show that the alloy phase transformations took place at 821, 932, and 976 °C. Figure 3 shows the corresponding microstructures and XRD patterns of this alloy after annealing at 800, 900 and 1000 °C. The alloy is composed of three phases: the dark α2 phase, the gray O phase and the white β phase at 800 and 900 °C. When the temperature reaches 1000 °C, the gray O phase disappears, whereas the dark α2 and the white β phases remain.
At 800 °C, the α2 and the O phases are formed as a small litter of ellipsoids and fine needles, respectively, and are homogeneously dispersed across the β matrix. They exhibit the classic microstructures of α2-based titanium alloys [31]. After annealing at 900 °C, the α2 phase gathers in a lamellar shape at the grain boundaries. At the same time, the O phase was changed into short rods and distributed throughout the β matrix. It can be seen that the decomposition of O phase into β + α2 occurs at 900 and 1000 °C.
The annealed microstructure of alloy #5 at 800 and 900 °C (Figure 4) exhibits the β and O phases. Moreover, when the annealing temperature was raised from 800 to 900 °C, the volume fraction of the β phase increased significantly and the O phase gradually changed into a short, rod-like shape. However, at 1000 °C (Figure 4), only the β single phase was observed in the annealed microstructure. This means that the phase transformation occurred in the 900–1000 °C temperature range. Combining the DSC results, the phase transformation in alloy #5, β + O β, was confirmed. The phase transformation temperature was found to be close to 966 °C.
According to the DSC results, alloys #6, #7, #8, and #9 experienced the same phase transformation at 931 °C. The annealed microstructure of alloy #7 is shown in Figure 5. The annealed microstructure at 800 °C contains only the β and O phases, in which the two phases are interweaved and the β phase is the matrix phase. A three-phase equilibrium composed of the gray β phase, dark O phase, and the white δ phase was found in the annealed structure at 900 °C, where the O phase was distributed at the grain boundary or in the β phase. Equally, the annealed structure at 1000 °C is made of black β and white δ phases and the black β phase is dispersed in the white δ phase matrix. It can be ascertained that the four-phase reaction β + σ O + δ takes place between 900 and 1000 °C. Xu [22] et al. measured the isothermal cross sections at 980 and 900 °C. Through their analysis of the isothermal sections, they also found the four-phase reaction of β + σ O + δ, which is in agreement with the current experimental results. At the same time, since the alloy undergoes a four-phase reaction of β + σ O + δ at 931 °C and the σ phase is clearly seen at 1000 °C, the phase transition peak at 986 °C should include the transformation of the β + σ and β + σ + O peaks. The β + σ/β transition peak should be at a higher temperature and β + O δ should occur at 878 °C.
Figure 6 show the annealed microstructures and XRD diffraction analysis patterns of alloy #8. The annealed structures of alloy #8 more directly prove the existence of the β + σ O + δ four-phase reaction. At 900 °C, the alloy is in the gray β phase, dark black O phase and white δ phase; while, at 1000 °C, the alloy structure has changed to the black β phase, dark gray O phase and white σ phase. The changes in the two structures indicate that there is a phase transformation. Combined with the changes in alloy #7, it can be confirmed that there is a β + σ O + δ four-phase reaction at 931 °C.

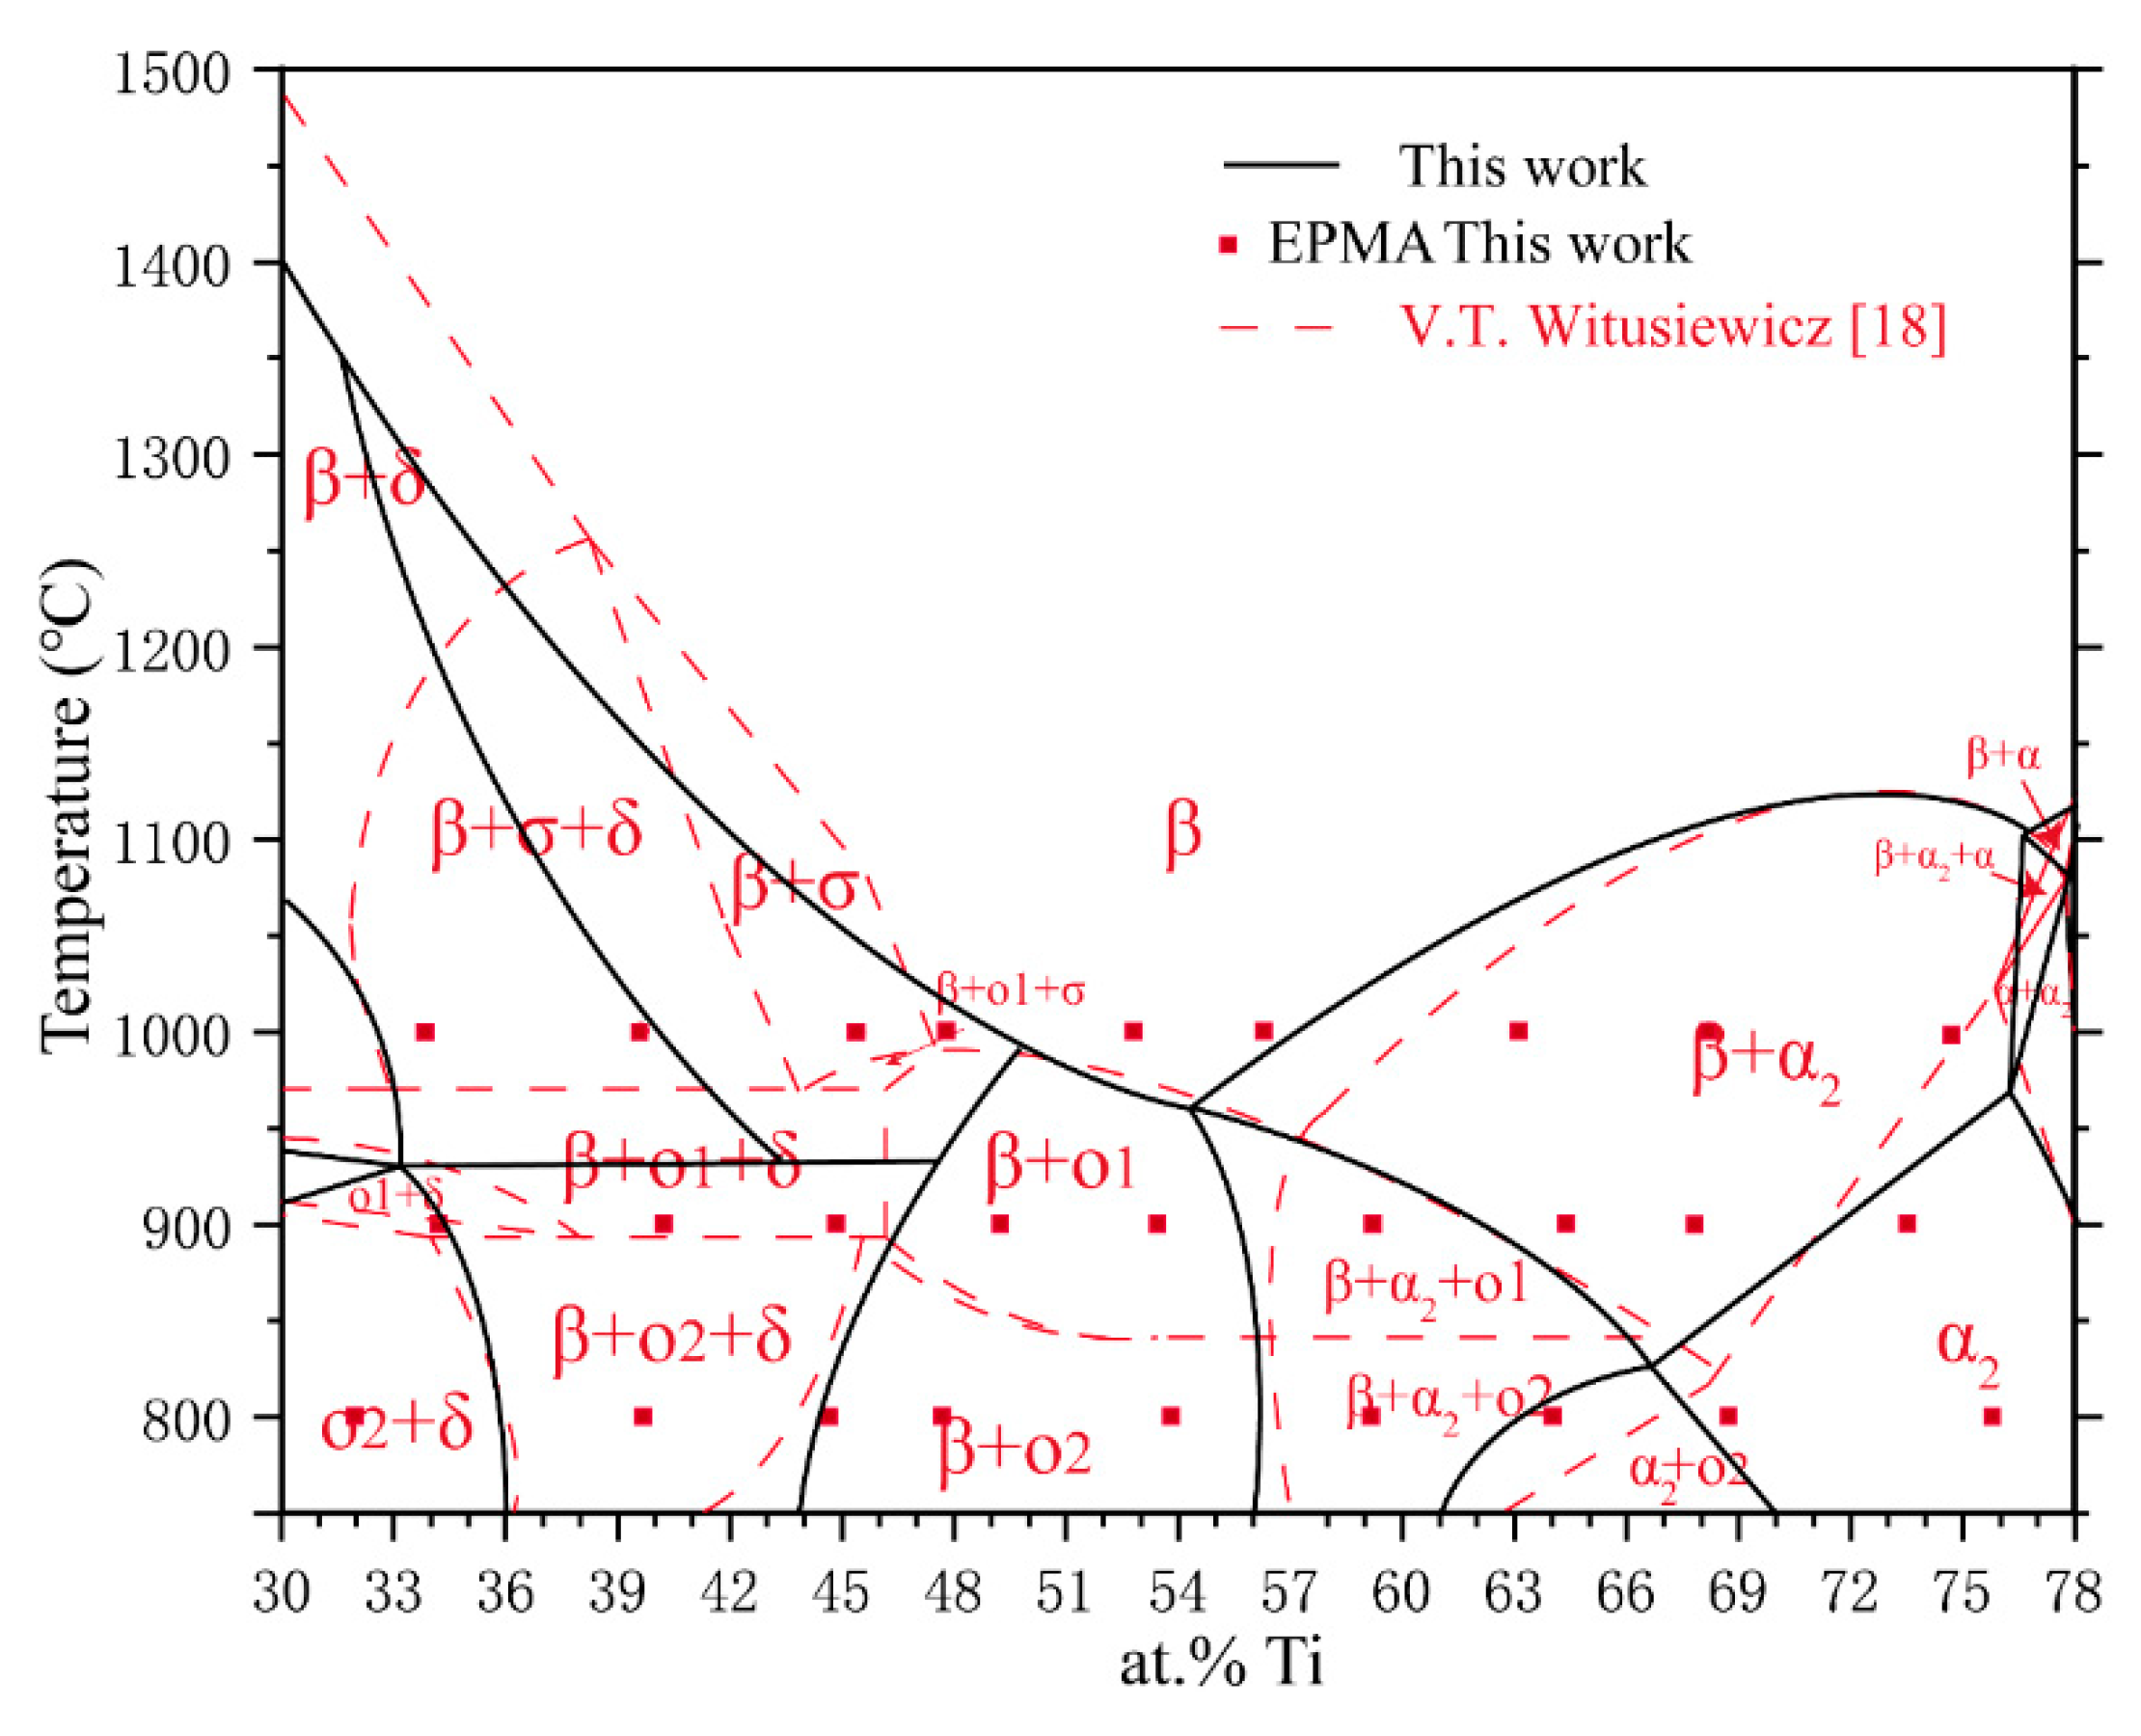
3.3. Polythermal Section

Based on the above experimental results, the polythermal section in the Ti-Al-Nb ternary system covering the composition range of 30–78 at.% Ti was established and is illustrated in Figure 7. The experimental data in this work are highlighted in red and compared with some reported ones from the literature [17,21,22] (in blue). The phase-transformation temperatures in our experiments were derived from the DSC and symbolled using red dots. The experimental alloy compositions are indicated by red dotted lines. The BCC_A2-BCC_B2 phase transition could not distinguished in the present work and is therefore not drawn in the diagram. The polythermal section consists of five three-phase regions: α + β + α2, α2 + β + O, β + O + δ, β + O + σ, and δ + β + σ; nine two-phase regions: α + β, α + α2, α2 + β, O + α2, β + O, β + σ, O + δ and δ+β; three single-phase regions: α, α2 and β.

4. Discussion

Combining the microstructure and XRD results, the phase transformation at different temperatures were ascribed. The results are summarized in Table 4.
Figure 8 shows a comparison of the experimental results of the Ti-22Al polythermal section of Miracle et al. [14] with the results of this work. As shown in the results of Miracle et al. [20], when the Nb content is zero (the binary boundary conditions of Ti-Al), the precipitation temperature of the α phase from the β phase is 1120 °C. The temperature at which β transforms into α and α2 is 1075 °C whereas the α phase is converted into α2 at 1000 °C. However, this is quite different from the recent research results of Witusiewicz et al. [18]. The experimental results of this work exhibit good agreement with those of Witusiewicz [18]. Explicitly, this means that the α single-phase region appears in the section and the temperature at which the α2 is completely converted to the α phase drops to 900 °C. Thus, the position of the three-phase region of α + β + α2 is closer to the binary boundary. The boundary between the two-phase region of β+α2 and the three-phase region is steeper.
The O phase was not observed at 1000 °C in this work. The phase region containing the O phase will not appear at this temperature, that is, the β + O, α2 + β + O phase region should be shifted to lower temperatures. This result is consistent with the experimental results of Chen et al. [12], Ding et al. [26], and Li et al. [21] obtained at 1000 °C and Xu et al. [22] measured at 980 °C.
Figure 9 shows the calculated polythermal section from Witusiewicz’s work [18] compared with the present results. However, the calculated results differ from the current experimental results in terms of the four-phase reaction temperature, the size of the δ + β + σ three-phase region and the location of the α2 + β + O three-phase region. The four-phase reaction temperature calculated by Witusiewicz et al. [18] is 954 °C, whereas the temperature we experimentally measured is 931 °C. Compared with the Ti-22Al-48Nb boundary calculated by Witusiewicz et al. [18], it was found that the phase region above 921 °C is not only the δ + β phase region, but also the δ + β + σ and the δ + σ phase regions. According to the experimental data of Li et al. [21], Xu et al. [22], the Ti-22Al-48Nb alloy is located in the δ + σ phase region at 1000 °C, in the δ + β + σ phase region for temperatures between 1100 and 1300 °C. When the temperature is raised to 1400 °C, it is converted to the single β phase. This work is consistent with their results. In addition, it was also determined in this work that the α2 phase does not disappear until the Nb content in the alloy is increased up to 24 at.%, instead of the 21 at.% Nb in Witusiewicz’s calculations [18]. At the same time, Witusiewicz et al. described the O phase as the O1 and O2 phases and optimized the two phases independently during the optimization process. However, in their experiments, they failed to distinguish the two O phases. In this work, the two phases cannot be distinguished, so the O phase is also used as a unified representation.

5. Conclusions

The polythermal section of the Ti-22Al-Nb (30–78 at.% Ti) in the Ti-Al-Nb ternary system was determined using electron probe microanalysis (EPMA), X-ray diffraction (XRD) and differential scanning calorimetric (DSC).
The polythermal section has five three-phase regions, nine two-phase regions, and three single-phase regions. Compared with the literature results, the α2 + β + O three-phase region moves to a lower temperature and the α + β + α2 three-phase region is shifted to the Ti-Al binary boundary. As a result, all the phase boundaries change. The O phase is confirmed to occur below 1000 °C. There are differences between the present experimental work and Witusiewicz’s calculated results. A four-phase invariant reaction was found at 931 °C: β + σ → O + δ. This polythermal section will help in the thermodynamic evaluation of the Ti-Al-Nb system and the practical application of O-phase alloys.

Author Contributions

Conceptualization, Y.Z., L.-B.L. and L.-G.Z.; data curation, Y.Z.; formal analysis, Y.Z.; funding acquisition, L.-B.L.; investigation, Y.Z. and L.-G.Z.; methodology, Y.Z. and L.-G.Z.; project administration, L.-B.L. and L.-G.Z.; resources, L.-B.L. and L.-G.Z.; software, Y.Z. and J.-J.Y.; supervision, L.-B.L. and L.-G.Z.; validation, Y.Z.; visualization, Y.Z.; writing—original draft, Y.Z.; writing—review & editing, Y.Z., L.-B.L., L.-G.Z., J.-J.Y. and P.J.M. All authors have read and agreed to the published version of the manuscript.

Funding

This research was funded by the National Key Technologies R&D Program of China, grant number 2016YFB0701301. This research was funded by National Natural Science Foundation of China, grant number No.51671218 and 51871248.

Conflicts of Interest

The authors declare no conflict of interest. The funders had no role in the design of the study; in the collection, analyses, or interpretation of data; in the writing of the manuscript, or in the decision to publish the results.

References

  1. Kumpfert, J. Intermetallic Alloys Based on Orthorhombic Titanium Aluminide. Adv. Eng. Mater. 2010, 3, 851–864. [Google Scholar] [CrossRef]
  2. Pollock, T.M. Alloy design for aircraft engines. Nat. Mater. 2016, 15, 809–815. [Google Scholar] [CrossRef]
  3. Ding, X.F.; Lin, J.P.; Zhang, L.Q.; Su, Y.Q.; Chen, G.L. Microstructural control of TiAl–Nb alloys by directional solidification. Acta Mater. 2012, 60, 498–506. [Google Scholar] [CrossRef]
  4. Wang, S.; Xu, W.; Sun, W.; Zong, Y.; Chen, Y.; Shan, D. Study on Microstructure Evolution and Mechanical Properties of Ti2AlNb-Based Alloy under Canning Compression and Annealing. Metals 2019, 9, 980. [Google Scholar] [CrossRef] [Green Version]
  5. Bian, H.; Lei, Y.; Fu, W.; Hu, S.; Song, X.; Feng, J. Diffusion Bonding of Ti2AlNb Alloy and High-Nb-Containing TiAl Alloy: Interfacial Microstructure and Mechanical Properties. Metals 2018, 8, 1061. [Google Scholar] [CrossRef] [Green Version]
  6. Boehlert, C.J. The effects of forging and rolling on microstructure in O+BCC Ti-Al-Nb alloys. Mater. Sci. Eng. A 2000, 279, 118–129. [Google Scholar] [CrossRef]
  7. Polozov, I.; Sufiiarov, V.; Popovich, A.; Masaylo, D.; Grigoriev, A. Synthesis of Ti-5Al, Ti-6Al-7Nb, and Ti-22Al-25Nb alloys from elemental powders using powder-bed fusion additive manufacturing. J. Alloys Compd. 2018, 763, 436–445. [Google Scholar] [CrossRef]
  8. Hagiwara, M.; Emura, S.; Araoka, A.; Yang, S.J.; Nam, S.W. The effect of lamellar morphology on tensile and high-cycle fatigue behavior of orthorhombic Ti-22Al-27Nb alloy. Metall. Mater. Trans. A 2004, 35, 2161–2170. [Google Scholar] [CrossRef]
  9. Wang, W.; Zeng, W.; Xue, C.; Liang, X.; Zhang, J. Microstructure control and mechanical properties from isothermal forging and heat treatment of Ti–22Al–25Nb (at.%) orthorhombic alloy. Intermetallics 2015, 56, 79–86. [Google Scholar] [CrossRef]
  10. Kaltenbach, K.; Schulze, K.; Henig, E.T.; Gama, S.; Pinatti, D.G. A Contribution to the Ternary System Al-Nb-Ti. Z. Metallkd. 1989, 80, 535–539. [Google Scholar]
  11. Bendersky, L.A.; Boettinger, W.J.; Burton, B.P.; Biancaniello, F.S.; Shoemaker, C.B. The formation of ordered ω-related phases in alloys of composition Ti4Al3Nb. Acta Metall. Mater. 1990, 38, 931–943. [Google Scholar] [CrossRef]
  12. Chen, G.L.; Wang, X.T.; Ni, K.Q.; Hao, S.M.; Cao, J.X.; Ding, J.J.; Zhang, X. Investigation on the 1000, 1150 and 1400 °C isothermal section of the Ti-Al-Nb system. Intermetallics 1996, 4, 13–22. [Google Scholar] [CrossRef]
  13. Jewett, T.J. Comment on ‘Investigation on the 1000, 1150 and 1400 °C isothermal section of the Ti-Al-Nb system’. Intermetallics 1997, 5, 157–159. [Google Scholar] [CrossRef]
  14. Boehlert, C.J. The phase evolution and microstructural stability of an orthorhombic Ti-23Al-27Nb alloy. J. Phase Equilibria 1999, 20, 101–108. [Google Scholar] [CrossRef]
  15. Raghavan, V. Al-Nb-Ti (Aluminum-Niobium-Titanium). J. Phase Equilibria Diffus. 2005, 26, 360–368. [Google Scholar] [CrossRef]
  16. Raghavan, V. ChemInform Abstract: Al—Nb—Ti (Aluminum-Niobium-Titanium). Cheminform 2012, 43. [Google Scholar] [CrossRef]
  17. Witusiewicz, V.T.; Bondar, A.A.; Hecht, U.; Rex, S.; Velikanova, T.Y. The Al–B–Nb–Ti system: III. Thermodynamic re-evaluation of the constituent binary system Al–Ti. J. Alloys Compd. 2008, 465, 64–77. [Google Scholar] [CrossRef]
  18. Witusiewicz, V.T.; Bondar, A.A.; Hecht, U.; Velikanova, T.Y. The Al–B–Nb–Ti system: IV. Experimental study and thermodynamic re-evaluation of the binary Al–Nb and ternary Al–Nb–Ti systems. J. Alloys Compd. 2009, 472, 133–161. [Google Scholar] [CrossRef]
  19. Kattner, U.R.; Boettinger, W.J. Thermodynamic calculation of the ternary Ti-Al-Nb system. Mater. Sci. Eng. A 1992, 152, 9–17. [Google Scholar] [CrossRef]
  20. Miracle, D.B.; Rhodes, C.G.; Foster, M.A. In Titanium ’95. M; The Cambridge University Press: Cambridge, UK, 1996; pp. 372–379. [Google Scholar]
  21. Li, L.; Liu, L.; Zhang, L.; Zeng, L.; Zhao, Y.; Bai, W.; Jiang, Y. Phase Equilibria of the Ti-Al-Nb System at 1000, 1100 and 1150 °C. J. Phase Equilibria Diffus. 2018, 39, 549–561. [Google Scholar] [CrossRef] [Green Version]
  22. Xu, S. Study on the Phase Equilibria and Typical Phase Transformations of Ti-Al-Nb Ternary System. Ph.D. Thesis, University of Science and Technology, Beijing, China, 2019. [Google Scholar]
  23. Muraleedharan, K.; Nandy, T.K.; Banerjee, D.; Lele, S. Phase stability and ordering behaviour of the O phase in Ti-Al-Nb alloys. Intermetallics 1995, 3, 187–199. [Google Scholar] [CrossRef]
  24. Cupid, D.M.; Fabrichnaya, O.; Rios, O.; Ebrahimi, F.; Seifert, H.J. Thermodynamic re-assessment of the Ti-Al-Nb system. Int. J. Mater. Res. 2009, 100, 218–233. [Google Scholar] [CrossRef]
  25. Raghavan, V. Al-Nb-Ti (Aluminum-Niobium-Titanium). J. Phase Equilibria Diffus. 2010, 31, 561. [Google Scholar] [CrossRef]
  26. Ding, J.J.; Hao, S.M. Reply to the “comment on ‘investigation on the 1000, 1150 and 1400 °C isothermal section of the Ti-Al-Nb system’ ”—Part II. Modification of 1000 and 1150 °C isothermal sections of the Ti-Al-Nb system. Intermetallics 1998, 6, 329–334. [Google Scholar] [CrossRef]
  27. Rollett, A.D.; Smith, P.R.; James, M.R. Texture and anisotropy of Ti-22Al-23Nb foil. Mater. Sci. Eng. A 1998, 257, 77–86. [Google Scholar] [CrossRef]
  28. Ohnuma, I.; Fujita, Y.; Mitsui, H.; Ishikawa, K.; Kainuma, R.; Ishida, K. Phase equilibria in the Ti–Al binary system. Acta Mater. 2000, 48, 3113–3123. [Google Scholar] [CrossRef]
  29. Kostov, A.; Friedrich, B. Selection of crucible oxides in molten titanium and titanium aluminum alloys by thermo-chemistry calculations. J. Min. Metall. 2005, 41, 113–125. [Google Scholar] [CrossRef]
  30. Masset, P.J.; Schütze, M. Thermodynamic Assessment of the Alloy Concentration Limits for the Halogen Effect of TiAl Alloys. Adv. Eng. Mater. 2008, 10, 666–674. [Google Scholar] [CrossRef]
  31. Berghof-Hasselbächer, E.; Diliberto, S.; Gawenda, P.; Masset, P.J.; Schmidt, G.; Schütze, M. Metallographische Untersuchungen der Mikrostrukturen von technischen TiAl-Legierungen. Pract. Metallogr. 2010, 47, 65–83. [Google Scholar] [CrossRef]
Figure 1. Differential scanning calorimetric (DSC) curves of alloys #1–#9.
Metals 10 00871 g001
Figure 2. Electron probe micro-analysis (EPMA) images and XRD results of alloy #1 after annealing at 1000 °C, 900 °C. (a) The microstructure of alloy #1 at 1000 °C; (b) the XRD result of alloy #1 at 1000 °C. (c) The microstructure of alloy #1 at 900 °C; (d) the XRD result of alloy #1 at 900 °C.
Metals 10 00871 g002
Figure 3. EPMA images and XRD results of alloy #4 after annealing at 1000, 900, 800 °C. (a) The microstructure of alloy #4 at 1000 °C; (b) the XRD result of alloy #4 at 1000 °C. (c) The microstructure of alloy #4 at 900 °C; (d) the XRD result of alloy #4 at 900 °C. (e) The microstructure of alloy #4 at 800 °C; (f) the XRD result of alloy #4 at 800 °C.
Metals 10 00871 g003
Figure 4. EPMA images and XRD results of alloy #5 after annealing at 1000, 900, 800 °C. (a) The microstructure of alloy #5 at 1000 °C; (b) the XRD result of alloy #5 at 1000 °C. (c) The microstructure of alloy #5 at 900 °C; (d) the XRD result of alloy #5 at 900 °C. (e) The microstructure of alloy #5 at 800 °C; (f) the XRD result of alloy #5 at 800 °C.
Metals 10 00871 g004
Figure 5. EPMA images and XRD results of alloy #7 after annealing at 1000 °C, 900 °C, 800 °C. (a) The microstructure of alloy #7 at 1000 °C; (b) the XRD result of alloy #7 at 1000 °C. (c) The microstructure of alloy #7 at 900 °C; (d) the XRD result of alloy #7 at 900 °C. (e) The microstructure of alloy #7 at 800 °C; (f) the XRD result of alloy #7 at 800 °C.
Metals 10 00871 g005
Figure 6. EPMA images and XRD results of alloy #8 after annealing at 1000 °C, 900 °C, 800 °C. (a) The microstructure of alloy #8 at 1000 °C; (b) the XRD result of alloy #8 at 1000 °C. (c) The microstructure of alloy #8 at 900 °C; (d) the XRD result of alloy #8 at 900 °C. (e) The microstructure of alloy #8 at 800 °C; (f) the XRD result of alloy #8 at 800 °C.
Metals 10 00871 g006
Figure 7. Overview of the polythermal section of the Ti-Al-Nb ternary system using data from this work and from [18,21,22].
Metals 10 00871 g007
Figure 8. Experimentally determined the polythermal section of the Ti-Al-Nb ternary system compared with the result of Miracle et al. [20].
Metals 10 00871 g008
Figure 9. Experimentally determined the polythermal section of the Ti-Al-Nb ternary system compared with the calculated results of Witusiewicz et al. [18].
Metals 10 00871 g009
Table 1. Crystal structure data of different phases in Ti-Al-Nb system.
PhasePearson SymbolSpace GroupStrukturbericht DesignationPrototype
(Al)(αAl), fcc_AlcF4Fm-3mA1Cu
α, (αTi), hcp_A3hp2P63/mmcA3Mg
α2, Ti3AlhP8P63/mmcD019Ni3Sn
β, (βTi), bcc_A2cI2Im-3mA2W
β0, bcc_B2cI2Pm-3mB2CsCl
γ, γTiAl, TiAltP4P4/mmmL10AuCu
δ, Nb3AlcP8Pm-3nA15Cr3Si
ℇ, (Ti1−xNbx)Al3, TiAl3(h), NbAl3tI8I4/mmmD022TiAl3(h)
ε(l), TiAl3(l)tI32I4/mmmTiAl3(l)
ζ, Ti2+xAl5−xtP28P4/mmmTi2Al5
η, TiAl2tI24I41/amdHfGa2
σ, Nb2AltP30P42/mnmD8bσCrFe
Ti3Al5tP32P4/mbmTi3Al5
O1, O, O1(h), Ti2NbAloC16CmcmNaHg
O2, O2(r), Ti2NbAloC16CmcmNaHg
τ, Ti4NbAl3hP6P63/mmcB82Ni2In
γ1-Ti4Nb3Al9tP16P4/mmmγ1-Ti4Nb3Al9
Table 2. The designed alloy compositions in the present work.
No.Alloy Compositions
TiAlNb
173225
2682210
3632215
4582220
5532225
6482230
7432235
8382240
9332245
Table 3. Equilibrium compositions and phases determined in the present work.
No.Heat TreatmentPhase ConstitutionPhase Composition, at.%Phase Fraction
Phase 1/2/3Phase 1Phase 2Phase 3Phase1:2:3
AlTiAlTiAlTi
11000 °C 720 hβ/α216.775.923.774.3--0.53:0.47
900 °C 1440 hα221.673.7----1
800 °C 2160 hα221.675.8----1
21000 °C 720 hβ/α218.468.323.368.3--0.58:0.42
900 °C 1440 hβ/α214.367.923.467.9--0.59:0.41
800 °C 2160 hα2/O22.568.918.068.9--0.42:0.58
31000 °C 720 hβ/α220.461.924.665.3--0.60:0.40
900 °C 1440 hβ/α215.761.323.464.7--0.62:0.38
800 °C 2160 hα2/O22.764.915.361.2--0.43:0.57
41000 °C 720 hβ/α220.553.524.561.2--0.63:0.37
900 °C 1440 hβ/α2/O15.656.823.562.923.560.00.6:0.03:0.37
800 °C 2160 hβ/α2/O18.352.123.059.413.056.00.58:0.02:0.4
51000 °C 720 hβ22.553.2----1
900 °C 1440 hβ/O23.953.915.752.3--0.57:0.43
800 °C 2160 hβ/O23.954.519.452.8--0.6:0.4
61000 °C 720 hβ/σ22.347.026.857.8--0.64:0.36
900 °C 1440 hβ/O23.150.015.247.0--0.55:0.45
800 °C 2160 hβ/O24.849.518.646.7--0.61:0.39
71000 °C 720 hβ/σ21.544.827.256.8--0.67:0.33
900 °C 1440hβ/O/δ23.352.114.647.719.733.40.04:0.4:0.56
800 °C 2160 hβ/O22.645.117.742.1--0.58:0.42
81000 °C 720 hβ/σ/δ19.546.725.059.120.431.00.11:0.37:0.52
900 °C 1440 hβ/O/δ14.746.923.652.820.134.50.02:0.41:0.57
800 °C 2160 hβ/O/δ23.735.324.842.521.829.30.01:0.41:0.58
91000 °C 720 hβ/σ/δ19.342.422.654.319.630.30.52:0.09:0.39
900 °C 1440 hO/δ22.850.120.332.5--0.41:0.59
800 °C 2160 hO/δ25.843.319.333.2--0.40:0.60
Table 4. The phase transformation and temperature of Ti-22Al-xNb polythermal section annealed at 1000 °C.
No.CompositionCrucible TypeMass (mg)Rate (°C/min)Phase TransformationTemperature (°C)
1Ti74.8Al21.6Nb3.6Al2O313.5620α2 ↔ α2 + β950(±10)
α2 + β ↔ β1110(±10)
2Ti68.3Al22.2Nb9.5Al2O317.7520α2 ↔α2 + β821(±10)
α2 + β ↔ β1112(±10)
3Ti63.2Al22Nb14.8Al2O314.4520O + α2 ↔α2 + β+ O748(±10)
α2 + β + O ↔ α2 + β882(±10)
α2 + β ↔ β1060(±10)
4Ti56.4Al22Nb21.6Al2O318.7320β + O ↔ α2 + β + O821(±10)
α2 + β + O ↔ α2 + β932(±10)
α2 + β ↔ β976(±10)
5Ti53.2Al22.5Nb24.3Al2O326.6720β + O ↔ β966(±10)
6Ti47.8Al22.4Nb29.8Al2O322.2320β + O + δ ↔ β + O + σ931(±10)
β + O + σ ↔ β + σ978(±10)
β + σ ↔ β-
7Ti45.5Al21.4Nb33.1Pt14.7820β + O ↔ β + O + δ878(±3)
β + O + δ ↔ β + O + σ931(±3)
β + O + σ ↔ β + σ986(±3)
β + σ ↔ β-
8Ti39.7Al21.2Nb39.1Pt15.6720Β +O + δ ↔ δ + β + σ931(±3)
δ + β + σ ↔ β + σ969(±3)
β + σ ↔ β1151(±3)
9Ti33.9Al21.1Nb45Al2O311.9620O + δ ↔ β + O + δ873(±10)
β + O + δ ↔ δ + β + σ931(±10)
δ + β + σ ↔ β + σ1191(±10)
β + σ ↔ β1273(±10)

