Abstract
Hypoeutectic white cast irons containing 25% Cr are used in ore-processing industries due to their high resistance to erosive wear. Applying a Design of Experiments (DoE), the aim of this study is to analyse the influence of thermal processing factors on the microstructural variation of a white cast iron containing 25% Cr and 0.6% Mo. The carbides present in the as-cast state are of the M7C3, M2C, and M3C types. M2C carbides precipitate on the eutectic M7C3 carbides favoured by heterogeneous nucleation conditions. Two kinetics compete during the destabilisation of austenite. One dissolves those eutectic carbides precipitated as a result of non-equilibrium solidification (M7C3 and M2C), while the other enables the precipitation of secondary M7C3 and M23C6 carbides. The M7C3 carbides begin to precipitate first. Low destabilisation temperatures and short dwell times are insufficient to dissolve the precipitated eutectic carbides from non-equilibrium conditions, thus favouring the presence of M2C carbides, which are associated with Mo. The factor that has the greatest influence on hardness is the tempering temperature. The optimal tempering temperature is found to be 500 °C. Short tempering times maintain the distortion of the ferrite unit cell. The precipitation of Cr carbides during tempering requires a temperature of 500 °C and the prior dissolution of the carbon precipitated during the initial stages of said tempering. With short tempering times, the Cr atoms still remain dissolved in the ferrite, distorting its unit cell and increasing the hardness of the matrix constituent of the alloy.
1. Introduction
The microstructure of hypoeutectic white cast irons containing between 15% and 30% Cr is mainly composed of eutectic carbides in an austenite matrix, or of any of the phases or constituents resulting from their transformation [,]. The austenite will be supersaturated mainly in Cr and C. This austenite can be destabilised by means of a high-temperature heat treatment, causing the precipitation of Cr-rich carbides. This precipitation results in an increase in the Ms temperature, thus reducing the risk of cracking during cooling [,]. Wiengmoon et al. [] conclude that the secondary carbides which precipitated during the destabilisation of austenite at 1000 °C are M7C3-type carbides in cast irons containing 20% Cr. However, secondary carbides with M7C3 and M23C6 stoichiometries would be jointly present in cast irons containing 27% Cr. Guitar et al. [] conclude that M7C3 carbides are the first to precipitate during the destabilisation of the austenite heating process. During the dwell time at the destabilisation temperature, they would transform into M23C6 carbides. Furthermore, Guitar et al. [] state that additional precipitation of secondary carbides takes place during cooling in the 980–750 °C range. Hardness increases when M7C3 secondary carbides predominate over M23C6 carbides []. Bedolla et al. conclude that the volume fraction of secondary carbides increases at low destabilisation temperatures (900 °C) and high dwell times (8 h) []. Excessive dwell times at the destabilisation temperature lead to thickening of the secondary carbides and a reduction in hardness []. Khanitnantharak et al. conclude that high destabilisation temperatures favour the presence of retained austenite []. The presence of Mo in the chemical composition favours the precipitation of eutectic M2C carbides [,,,,], leading to an increase in both hardness and wear resistance [,,]. Mo can also dissolve in mixed carbides of the M7C3 type [], replacing the Fe atoms and producing a distortion of their unit cell without having a significant influence on hardness. A suitable tempering temperature favours the reduction in retained austenite via a second destabilisation of this austenite [,,]. However, an excessive tempering temperature could result in the redissolution of the C atoms in the tempered martensite matrix []. This carbon would come from carbides precipitated at the lowest tempering temperatures. The optimal tempering temperature to increase the hardness and wear resistance appears to be around 500 °C []. The presence of hard carbides gives these cast irons a high resistance to wear, which is why they are widely used in ore-processing industries [,]. Alloys in the 25–30% Cr range have a very high hardness []. The tempering temperature is decisive in both the wear resistance and hardness of the constituent matrix of these cast irons. Low tempering temperatures do not completely destabilise the austenite []. Solidification and thermal processing parameters can alter the microstructure of the material and its properties and hence influence its in-service performance []. The aim of this study is to analyse the influence of thermal processing factors on the microstructural variation of a white cast iron containing 25% Cr and 0.6% Mo via the application of a Design of Experiments (DoE), analysing how the modifications of those factors that affect the destabilisation of austenite influence the percentage of the different carbides that are formed, the percentage of martensite, and the percentage of retained austenite. A secondary goal is to determine how the variation of these processing factors would affect the hardness of the material. Five factors were analysed, performing eight experiments []. The results will allow the manufacturers of these alloys containing 25% Cr to correlate the parameters of thermal processing with the microstructure and hardness of the material.
2. Materials and Methods
Applying a DoE, the aim is to modify certain thermal processing parameters in a deliberate and controlled manner so as to analyse the microstructural variations produced in the material. In other words, it is a matter of determining which factors have a significant influence on this microstructure and in what way the variation of these factors exerts an influence. Table 1 shows the analysed factors and the levels of analysis. The proposed dwell times for the destabilisation of austenite, Factor B, are higher than those usually employed. These longer dwell times are intended to promote the precipitation of secondary carbides and an increase in the Ms Temperature so as to avoid the presence of retained austenite after quenching as far as possible.

Table 1.
Factors and Levels.
The effect of a factor is measured as the consequence of its variation on a certain microstructural feature of the material. This type of effect is called a main effect. The effect of one factor may possibly depend on the value that another takes. When this occurs, these factors are said to interact. The influence of the main effects is greater than that of the 2-factor interactions. In turn, the influence of the 2-factor interactions is greater than that of the 3-factor interactions, and so on successively. In practical terms, it is sufficient to consider only the main effects and the 2-factor interactions, which allows the number of experiments to be reduced []. In this study, the effect of 5 factors performing 8 experiments has been analysed. If the aim were to analyse all the possible interactions with these 5 factors, it would be necessary to perform 32 experiments (25 = 32). However, in this case, only 8 effects (25−2) have been estimated, which therefore means a 1/4 (32/4 = 8) fractional factorial design. Table 2 shows the array of experiments. Columns D and E have been respectively constructed from the product of columns A × B and A × C []. The “Confounding Pattern” column indicates only the main effects and those 2-factor interactions whose effects are confounded with the main effects.
Table 2.
Array of Experiments.
The effects are linear combinations of the analysed responses or features. Therefore, according to the Central Limit Theorem, they will follow a normal law. The representation of the distribution function of the N(0,σ) law on a normal probabilistic plot scale will be a straight line that passes through the coordinate point (0,50). If any of the effects followed a different normal law, it would not appear aligned along this straight line. Those factors associated with effects that do not follow the distribution function of the N(0,σ) law are considered significant and will hence be found at a certain distance from the straight line on the normal probabilistic plot. If any effect deviates to the right of this straight line, that would mean that this factor would produce an increase in the analysed feature when placed at its +1 level. Likewise, if any effect deviates to the left of this straight line, that would indicate that the factors associated with this effect produces an increase in the measured feature when placed at their −1 level. The features studied in this paper are:
- The Vickers hardness of the material. The applied load was 300 N, while the hardness value was calculated as the average value obtained from 10 indentations.
- The Vickers hardness of the constituent matrix, formed by tempered martensite and secondary carbides. In this case, the applied load was 0.5 N, while the hardness value was calculated as the average value obtained from 20 indentations.
- The following microstructural features:
- ○
- Percentage by weight of austenite
- ○
- Percentage by weight of tempered martensite (ferrite)
- ○
- Volume of the unit cell of the tempered martensite (ferrite).
- ○
- Percentage by weight of the M7C3, M23C6 and M2C carbides.
The microstructural features were determined by X-ray diffraction on a SEIFERT XRD 3000 T/T diffractometer (Baker Hughes, Celle, Germany). The radiation was emitted via a fine-focus Mo tube at a working power of 40 kV × 40 mA and monochromatised to the K α doublet: λ1 = 0.709316 Å and λ2 = 0.713607 Å. The diffracted intensity was determined in a 2θ range from 7° to 57°. The Rietveld structural refinement method was used to determine the percentage of the crystalline phases via fitting of the diffractograms []. To this end, following the recording of the diffraction figures, a structural refinement was carried out using the crystallographic information files present in the Inorganic Crystal Structure Database (ICSD), FIZ Karlsruhe, Germany. The program employed for this purpose was FullProf.2k, version 6.20 (2018). The increase in width observed in the peaks of the majority phases were modelled using Stephens’ formulation [], which is implemented in the aforementioned analysis program.
The optical microscope used was a NIKON Epiphot 200 (Nikon, Tokyo, Japan), and the images were obtained using Beuhler Omnimet Enterprise image analyser software (OmniMet Enterprise, Beuhler). The scanning electron microscope employed was a JEOL JSM-5600 (JEOL, Nieuw-Vennep, The Netherlands), equipped with the characteristic energy-dispersive X-ray (EDX) microanalysis system.
3. Results
Table 3 shows the chemical composition of the alloy under study. Figure 1 shows the microstructure in the as-cast state following solidification in a sand mould. Figure 1a,b shows that the microstructure is mainly composed of proeutectic austenite and a eutectic constituent. The proeutectic austenite presents a dendritic growth model, the presence of the eutectic constituent being observed between the dendritic “arms”. M7C3 eutectic carbides can be seen in the latter constituent. Figure 1c,d show the presence of carbides, both in the proeutectic austenite and in the austenite of the eutectic constituent. These carbides have been identified as belonging to two different types. Mixed carbides with a grey colouring and diameter greater than 1 micron are of the M7C3 type. However, carbides of the M3C type are also observed, which have a brighter colouring and a smaller size: less than 1 micron. Table 4 shows the results of the microanalysis performed on these two types of carbides (spectra 1 to 4). The hardness of the material in this state was 310 HV.
Table 3.
Chemical Composition (% by weight).
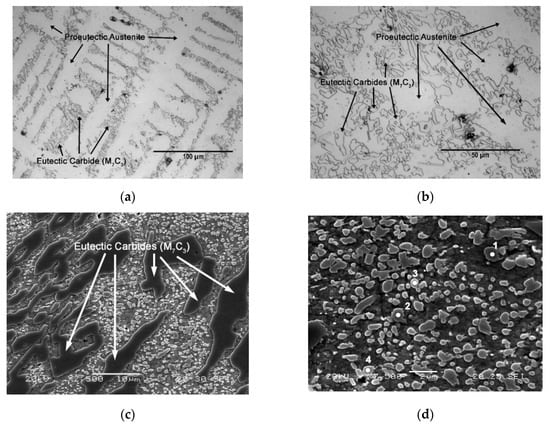
Figure 1.
As-Cast Microstructure. (a) Optical microscope (500×); (b) Optical microscope (1000×); (c) Scanning electron microscope (2500×); (d) Scanning electron microscope (7500×).
Table 4.
Results of the microanalysis performed by SEM-EDX (energy-dispersive X-ray), corresponding to Figure 1d. (at. %).
Figure 2 shows the presence of eutectic carbides of the M2C type, associated with Mo. Figure 2a was taken with secondary electrons and Figure 2b was taken with backscattered electrons. The difference in contrast in the latter image reveals the presence of M2C carbides associated with Mo. Their precipitation seems to be favoured by heterogeneous nucleation conditions from the eutectic M7C3-type carbides []. Table 5 shows the results of the microanalysis performed on this type of carbide (spectra 1)
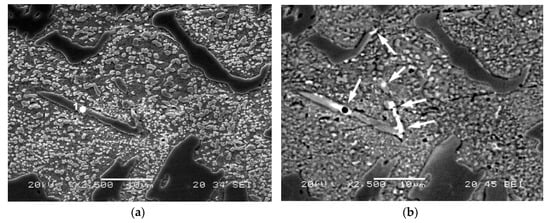
Figure 2.
As-Cast Microstructure. Presence of M2C-type eutectic carbides. Images taken under a scanning electron microscope at 2500× magnification; (a) Image taken with secondary electrons; (b) Image taken with backscattered electrons.
Table 5.
Results of the microanalysis performed by SEM-EDX, corresponding to Figure 2a (at %).
Figure 3 shows the overall fittings obtained by means of Rietveld structural refinement. The red marks indicate the observed intensities; the black line indicates the intensity calculated according to the Rietveld structural model; the blue line indicates the difference between the two; while the vertical segments indicate the angular positions of the different identified phases.
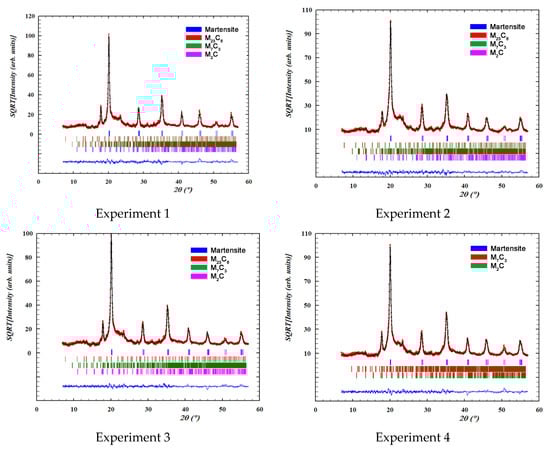
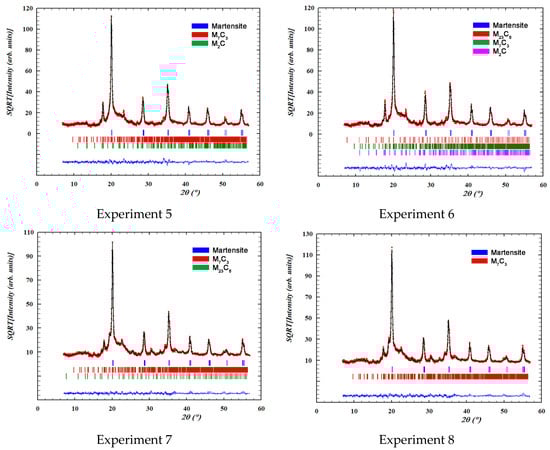
Figure 3.
Overall fittings obtained by means of Rietveld structural refinement. The red marks define the observed intensities; the black line defines the intensity calculated according to the Rietveld structural model; the blue line defines the difference between the two intensities; while the vertical segments indicate the angular positions of the different identified phases.
Table 6 shows the percentages by weight and the network parameters of the main crystalline phases detected by XRD in each of the experiments. The goodness of fit is defined by the agreement factor, Rwp, the index, Rexp, and the relationship between their squares: Chi2 = (Rwp/ Rexp)2
Table 6.
Percentage by weight of the precipitated phases and the volume of the unit cell of the tempered martensite.
Table 7 shows the results of the effects, corresponding to the confounding pattern given in the array of experiments outlined in Table 2. The row corresponding to the average shows the average value obtained considering all 8 experiments.
Table 7.
Calculation of Effects.
Figure 4 shows the representation of these effects on a normal probability plot, highlighting those that have a significant effect on these responses.
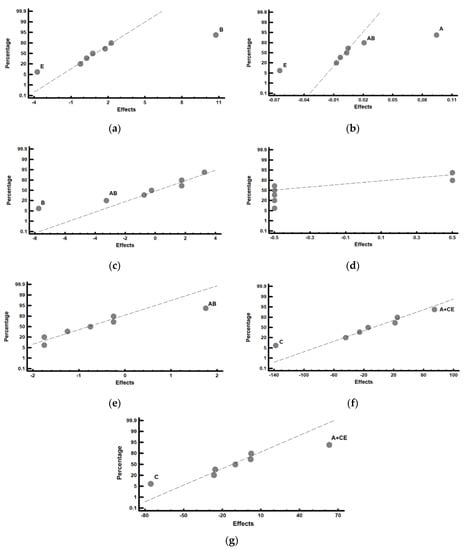
Figure 4.
Representation of the effects on a normal probability plot. Those factors with a significant effect on the analysed responses are highlighted. (a) Percentage by weight of tempered martensite; (b) volume of the unit cell of the tempered martensite; (c) percentage by weight of the M7C3 carbides; (d) percentage by weight of the M23C6 carbides; (e) percentage by weight of the M2C carbides; (f) overall hardness of the material; (g) hardness of the constituent matrix.
Figure 4a shows that the factors that have a significant effect on the percentage by weight of tempered martensite are B (dwell time at the austenisation temperature) and E (tempering time). Thus, if the aim is to increase this percentage, factor B should be placed at its +1 level (8 h) and Factor E should be placed at its −1 (2 h) level. Figure 4b shows that Factor A (austenisation temperature) and Factor E (tempering time) have a significant effect on the volume of the unit cell of the tempered martensite. An increase in the distortion of this phase would be obtained by placing Factor A at its +1 level (1000 °C) and Factor E at its −1 level (2 h). The significant effect of interaction AB is also observed, which means that the effect of the austenitisation temperature is reinforced if factor B (austenitisation time) is placed at its +1 level (8 h). It can de deduced from both these results that 2 complementary kinetics compete during the destabilisation treatment of austenite. One of them is related to the destabilisation of austenite itself, and the other is related to the dissolution of those eutectic carbides that would have precipitated as a result of a possible non-equilibrium solidification []. High austenitisation temperatures and long dwell times at this temperature favour the dissolution of these eutectic carbides, precipitated in non-equilibrium conditions. This involves the dissolution not only of C atoms, but also of Cr atoms. The former precipitate in the early stages of tempering, forming ε (cementitic) carbides. However, the latter continue to occupy substitution positions in the unit cell of the tempered martensite (ferrite). Carbon atoms need to be available for the precipitation of the Cr carbides during tempering. This requires the prior dissolution of the cementitic carbides precipitated during the tempering process following the decomposition of their constituent atoms []. The precipitation of the Cr carbides during tempering requires longer dwell times that allow the prior dissolution of the carbon precipitated during the initial stages of the tempering process and their subsequent precipitation as M7C3 carbides. All this takes time, which justifies the finding that the tempered martensite presents network distortions due to Cr atoms which have not precipitated during this tempering when short tempering times are employed.
Figure 4c shows that Factor B (dwell time at the destabilisation temperature of austenite) has a significant effect on the percentage by weight of the M7C3 carbides: placing this factor at its −1 level (4 h) leads to an increase in the content in these carbides. Dwell times at the austenitisation temperature of 4 h may be too short for dissolution of the eutectic carbides, solidified under non-equilibrium conditions, to be observed. Therefore, it turns out that the dwell time of 4 h would be sufficient for the destabilisation of the austenite, but it is too short for the dissolution of the precipitated carbides in non-equilibrium conditions. This evidences that the first carbides formed by the destabilisation of austenite are of the M7C3 type. This effect is reinforced by interaction AB: placing Factor A (austenitisation temperature) at its +1 level (1000 °C) would lead to an increase in the rate of precipitation of M7C3 carbides. These results are in line with the recent conclusions reached by Guitar et al. [].
Figure 4d shows that no effect is found to significantly influence the percentage by weight of M23C6-type carbides. This does not contradict the previous results reported by Guitar et al. [] or by Wiengmoon et al. Rather, it is possible that the redissolution of eutectic carbides precipitated due to a possible non-equilibrium solidification, observed with long dwell times at the austenitisation temperature, does not enable us to verify the partial transformation of M7C3 carbides into M23C6 carbides, or their precipitation.
Figure 4e shows the significant influence of interaction AB on the precipitation of M2C eutectic carbides. Table 8 shows the analysis of this interaction. It is concluded that their presence is favoured when Factor A (austenitisation temperature) and Factor B (dwell time at said temperature) are simultaneously placed at their −1 levels. It is probable that the M2C eutectic carbides were formed as a result of non-equilibrium solidification and that higher dwell times or higher temperatures enable the dissolution of these carbides.
Table 8.
Analysis of the effects of interaction AB on the percentage by weight of the M2C carbides.
Figure 4f shows the significant effect of Factor C (tempering temperature) on the overall hardness of the material: placing this factor at its −1 level (500 °C) produces an increase in hardness. This figure also shows the significant effect of Factor A (austenisation temperature) and of interaction CE. Table 9 simultaneously analyses both possibilities; placing Factor E (tempering time) at its −1 level (2 h) is found to reinforce the effect of Factor C at its −1 level (500 °C). That is, short tempering times reinforce the effect of the tempering temperature of 500 °C. It is precisely at this temperature that the precipitation of M7C3 carbides occurs during tempering []. With shorter tempering times, the tempered martensite (ferrite) maintains a greater distortion of its network.
Table 9.
Analysis of the effects of Factor A and the interaction CE on the hardness of the material.
Figure 4g shows the significant effect of Factor C (tempering temperature) on the overall hardness of the constituent matrix, which is formed by tempered martensite and secondary carbides. Placing this factor at its −1 level (500 °C) leads to an increase in this hardness. The significant effect of Factor A and of interaction CE can also be seen in this figure. Similar to the previous analysis, Table 10 simultaneously analyses both possibilities; placing Factor E (tempering time) at its −1 level (2 h) is found to reinforce the effect of factor C at its −1 level (500 °C). On the other hand, high temperatures, or excessively long tempering times, can lead to the coalescence of secondary carbides precipitated during tempering, thereby negatively affecting hardness [].
Table 10.
Analysis of the effects of Factor A and the interaction CE on the hardness of the matrix constituent.
Figure 5 shows a representative micrograph of each experiment that allows us to appreciate the general microstructure of these cast irons.
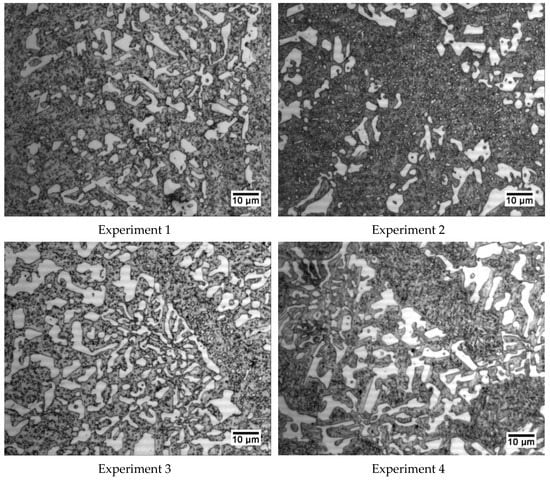
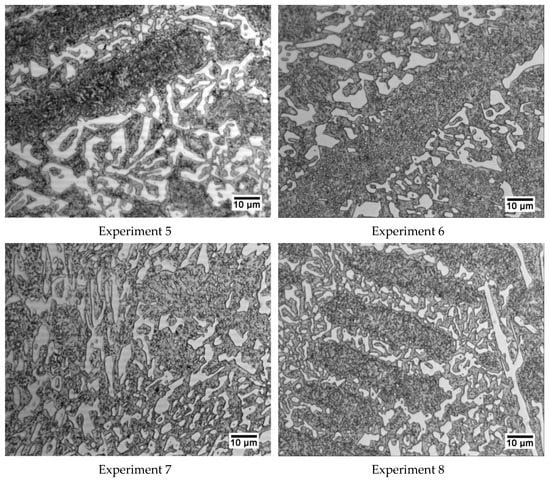
Figure 5.
Representative micrographs of each of the 8 experiments. All were obtained at 600× magnification.
4. Conclusions
This paper has analysed the influence of different thermal processing factors on the microstructural variation of a white cast iron containing 25% Cr and 0.6% Mo via the application of a Design of Experiments (DoE). The main conclusions may be summarised as follows:
- The carbides present in the microstructure are of the M7C3, M23C6 (both associated with Cr), and M2C (associated with Mo) types. The M7C3 and M2C carbides form part of the eutectic constituent. Part of this eutectic constituent was formed as a result of non-equilibrium solidification.
- Two complementary kinetics compete during the high-temperature destabilisation treatment of the austenite. One of them is related to the destabilisation of austenite itself, via the precipitation of secondary carbides, and the other is related to the dissolution of those eutectic carbides that would have precipitated as a result of possible non-equilibrium solidification. The latter kinetics is favoured if the treatment is carried out at 1000 °C, compared to lower temperatures.
- The carbides that form during the destabilisation of austenite at high temperatures are M7C3 and M23C6 carbides. The M7C3 carbides begin to precipitate first.
- Mo tends to segregate into the eutectic fluid and to precipitate via heterogeneous nucleation on the M7C3 carbides. Low destabilisation temperatures and short dwell times are insufficient for the dissolution to take place, which means that these conditions favour the presence of M2C carbides.
- The factor that most influences hardness is the tempering temperature. A temperature of 600 °C is found to be excessive. The optimal tempering temperature is 500 °C. The highest hardness would be achieved with short tempering times (2 h).
- Short tempering times maintain the distortion of the tempered martensite unit cell. Precipitation of the Cr carbides during tempering requires longer dwell times that allow the prior dissolution of the carbon precipitated during the initial stages of the tempering process and their subsequent precipitation as M7C3 carbides.
Author Contributions
J.A.-L. and H.A.-P. conceived and designed the investigation; A.G.-P. performed all laboratory work; F.A.-A. led the investigation, analysed the data and wrote the paper. All authors have read and agreed to the published version of the manuscript.
Funding
This research received no external funding.
Conflicts of Interest
The authors declare no conflict of interest.
References
- Tabrett, C.P.; Sare, I.R.; Ghomashchi, M.R. Microstructure-property relationships in high chromium white iron alloys. Int. Mater. Rev. 1996, 41, 59–82. [Google Scholar] [CrossRef]
- Powell, G.L.F.; Bee, J.V. Secondary carbide precipitation in an 18 wt% Cr-1 wt% Mo white iron. J. Mater. Sci. 1996, 31, 707–711. [Google Scholar] [CrossRef]
- Efremenko, V.; Shimizu, K.; Chabak, Y. Effect of Destabilizing Heat Treatment on Solid-State Phase Transformation in High-Chromium Cast Irons. Metall. Mater. Trans. A-Phys. Metall. Mater. Sci. 2013, 44, 5434–5446. [Google Scholar] [CrossRef]
- Antolin, J.F.A.; Garrote, L.F.; Lozano, J.A. Application of Rietveld Refinement to the correlation of the microstructure evolution of white cast irons with 18 and 25 %-wt. Cr after oil quench and successive temper treatments, with abrasive wear and bending testing. Rev. De Metal. 2018, 54, 11. [Google Scholar] [CrossRef]
- Wiengmoon, A.; Pearce, J.T.H.; Chairuangsri, T. Relationship between microstructure, hardness and corrosion resistance in 20 wt.%Cr, 27 wt.%Cr and 36 wt.%Cr high chromium cast irons. Mater. Chem. Phys. 2011, 125, 739–748. [Google Scholar] [CrossRef]
- Guitar, M.A.; Nayak, U.P.; Britz, D.; Mucklich, F. The Effect of Thermal Processing and Chemical Composition on Secondary Carbide Precipitation and Hardness in High-Chromium Cast Irons. Int. J. Met. 2020, 11, 1–11. [Google Scholar] [CrossRef]
- Bedolla-Jacuinde, A.; Arias, L.; Hernandez, B. Kinetics of secondary carbides precipitation in a high-chromium white iron. J. Mater. Eng. Perform. 2003, 12, 371–382. [Google Scholar] [CrossRef]
- Khanitnantharak, W.; Hashimoto, M.; Shimizu, K.; Yamamoto, K.; Sasaguri, N.; Matsubara, Y.; American Foundry, S. Effects of Carbon and Heat Treatment on the Hardness and Austenite Content of a Multi-Component White Cast Iron. Trans. Am. Foundry Soc. 2009, 117, 435. [Google Scholar]
- Matsubara, Y.; Sasaguri, N.; Shimizu, K.; Yu, S.; Yu, K. Solidification and abrasion wear of white cast irons alloyed with 20% carbide forming elements. Wear 2001, 250, 502–510. [Google Scholar] [CrossRef]
- Hashimoto, M.; Kubo, O.; Matsubara, Y. Analysis of carbides in multi-component white cast iron for hot rolling mill rolls. ISIJ Int. 2004, 44, 372–380. [Google Scholar] [CrossRef]
- Scandian, C.; Boher, C.; de Mello, J.D.B.; Rezai-Aria, F. Effect of molybdenum and chromium contents in sliding wear of high-chromium white cast iron: The relationship between microstructure and wear. Wear 2009, 267, 401–408. [Google Scholar] [CrossRef]
- Li, Y.C.; Li, P.; Wang, K.; Li, H.Z.; Gong, M.Y.; Tong, W.P. Microstructure and mechanical properties of a Mo alloyed high chromium cast iron after different heat treatments. Vacuum 2018, 156, 59–67. [Google Scholar] [CrossRef]
- Opapaiboon, J.; Ayudhaya, M.S.N.; Sricharoenchai, P.; Inthidech, S.; Matsubara, Y. Effect of Chromium Content on Heat Treatment Behavior of Multi-Alloyed White Cast Iron for Abrasive Wear Resistance. Mater. Trans. 2019, 60, 346–354. [Google Scholar] [CrossRef]
- Meebupha, T.; Inthidec, S.; Sricharoenchai, P.; Matsubara, Y. Effect of Molybdenum Content on Heat Treatment Behavior of Multi-Alloyed White Cast Iron. Mater. Trans. 2017, 58, 655–662. [Google Scholar] [CrossRef]
- Yamamoto, K.; Inthidech, S.; Sasaguri, N.; Matsubara, Y. Influence of Mo and W on High Temperature Hardness of M7C3 Carbide in High Chromium White Cast Iron. Mater. Trans. 2014, 55, 684–689. [Google Scholar] [CrossRef]
- Sare, I.R.; Arnold, B.K. The influence of heat-treatment on the high-stress abrasion resistance and fracture-toughness of alloy white cast irons. Metall. Mater. Trans. A-Phys. Metall. Mater. Sci. 1995, 26, 1785–1793. [Google Scholar] [CrossRef]
- Chen, X.A.; Li, Y.X. Effect of heat treatment on microstructure and mechanical properties of high boron white cast iron. Mater. Sci. Eng. A-Struct. Mater. Prop. Microstruct. Process. 2010, 528, 770–775. [Google Scholar] [CrossRef]
- Gonzalez-Pociño, A.; Alvarez-Antolin, F.; Asensio-Lozano, J. Influence of Thermal Parameters Related to Destabilization Treatments on Erosive Wear Resistance and Microstructural Variation of White Cast Iron Containing 18% Cr. Application of Design of Experiments and Rietveld Structural Analysis. Materials 2019, 12, 3252. [Google Scholar] [CrossRef]
- Pearce, J.T.H. Structural characterisation of high chromium cast irons. In Proceedings of the International Conference on Solidification Science and Processing: Outlook for the 21st Century, Bangalore, India, 18−21 February 2001; pp. 241–247. [Google Scholar]
- Aso, S.; Tagami, M.; Goto, S. Mechanical-properties of Fe-Cr-C-B cast alloys. J. Jpn. Inst. Met. 1992, 56, 707–714. [Google Scholar] [CrossRef][Green Version]
- Gonzalez-Pociño, A.; Alvarez-Antolin, F.; Asensio-Lozano, J. Optimization of Thermal Processes Applied to Hypoeutectic White Cast Iron containing 25% Cr Aimed at Increasing Erosive Wear Resistance. Metals 2020, 10, 17. [Google Scholar] [CrossRef]
- Gonzalez-Pociño, A.; Alvarez-Antolin, F.; Asensio-Lozano, J. Erosive Wear Resistance Regarding Diferent Destabilization Heat Treatments of Austenite in High Chromium White Cast Iron, Alloyed with Mo. Metals 2019, 9, 522. [Google Scholar] [CrossRef]
- Prat-Bartés, A.; Tort-Martorell, X.; Grima-Cintas, P.; Pozueta-Fernández, L.; Solé-Vidal, I. Métodos Estadísticos, 2nd ed.; UPC: Barcelona, Spain, 2004; p. 376. [Google Scholar]
- Gasan, H.; Erturk, F. Effects of a Destabilization Heat Treatment on the Microstructure and Abrasive Wear Behavior of High-Chromium White Cast Iron Investigated Using Different Characterization Techniques. Metall. Mater. Trans. A-Phys. Metall. Mater. Sci. 2013, 44, 4993–5005. [Google Scholar] [CrossRef]
- Stephens, P.W. Phenomenological model of anisotropic peak broadening in powder diffraction. J. Appl. Crystallogr. 1999, 32, 281–289. [Google Scholar] [CrossRef]
- Pero-Sanz, J.A. Aceros; Dossat: Madrid, Spain, 2004; p. 558. [Google Scholar]
© 2020 by the authors. Licensee MDPI, Basel, Switzerland. This article is an open access article distributed under the terms and conditions of the Creative Commons Attribution (CC BY) license (http://creativecommons.org/licenses/by/4.0/).