Abstract
In this research, a comparative analysis has been carried out between a traditional sand casting process and a modern mould obtained by additive manufacturing (AM), in the context of aluminium parts production. In this case of AM, an inkjet 3D printing (3DP) process allowed us to create a ceramic mould. A numerical simulation was carried out to study the filling and cooling rates of both parts. The design freedom typical of the 3DP technique allowed us to optimize the filling system. The results showed that in sand moulding, the speed in the gate suddenly increased when the liquid metal entered the part cavity, leading to severe turbulence due to the fountain effect. The input of air is related to the speed in the gate. Nevertheless, the results showed that when using the 3DP mould, the speed in the gate remained constant and the filling process was homogenous. With regard to the dimensional precision, while the staircase effect in the surface of the 3DP mould is the most critical aspect to control, in the sand casting mould the critical aspect is the dimensional precision of the pattern. Microstructures of the cross-section of the moulded parts showed folded shapes and air input in sand casting, which could be produced by the severe turbulence and the oxide film present in the melt during the filling process. On the other hand, the porosity found in parts produced with the 3DP mould corresponds to shrinkage; during the filling process, the remaining binder is vaporized, creating nucleation points. In this way, pores are formed by shrinkage and a mixture of shrinkage and gas entrapment. With these considerations, it can be concluded that AM shows feasibility and advantages as an alternative to the sand casting method for aluminium alloys.
1. Introduction
Casting of aluminium alloys is one of the most frequently used techniques in manufacturing, especially in the automotive sector. Good mechanical properties, low density, and good corrosion resistance are the main properties of these alloys. Despite being one of the most well known and oldest manufacturing techniques, researchers are still investigating how to minimize the defects of moulded parts.
Recent decades have witnessed the inexorable improvement of AM, allowing the development of rapid prototypes and parts with complex geometries with great versatility and accuracy. Due to this fact, AM processes are being implemented to substitute for or complement most traditional processes, such as sand casting.
The main issues in casting are focused on: (i) reduction of porosity, (ii) improvement of the microstructure, and (iii) control of dimensional quality and defects.
- Porosity is the most common defect in casting. It reduces the mechanical properties and lifetime of the parts [1]. Gas entrapment and shrinkage are the main causes of porosity [2].
- The microstructure influences the mechanical properties of the moulded parts. Cooling rates during the casting and additives like lithium, beryllium, and calcium can modify the microstructure [3,4,5]. A finer dendritic structure improves the mechanical properties.
- Manufacturing an accurate part in casting is difficult due to the contraction of the metal and the possible defects. Patterns are also necessary. Patterns replicate all their defects in the final part and are also very expensive to produce. Other kinds of defects may appear, like sand inclusions, misruns, and mismatches. Some of these defects can be due to human error.
The correct design of a mould avoids the majority of these issues. Simulation software is essential because it can predict the behaviour of the mould prior to the pouring operation. The manufacturing cost of a mould with complex geometry is one of the main limitations in developing it. However, AM allows the modelling of complex designs, avoiding this limitation; for example, Sama et al. [6,7] studied gating systems to improve the pouring process. Additionally, Eisaabadi et al. [8] studied the influence of the runner height in oxide bifilm formation.
Several methods and techniques have been developed in the context of AM, such as selective laser sintering, laminated object manufacturing, fused deposition modelling, stereolithography, and 3D printing (3DP). Chen et al. [9] reviewed all the techniques that can be used in ceramic 3DP. The 3DP technique is the most suitable for manufacturing cores and inserts in moulds; it can be classified by the type of material used for the mould and the binder. For instance, three main fields of research in additive-manufacturing-based casting were identified: (i) mould properties and reaction in the casting, (ii) the design accuracy and capability, and (iii) the constraints of 3DP [10].
The 3DP technique is based on binder jetting [11,12]. In this technique, a liquid binder is injected to join ceramic-powder particles which have been previously distributed on a platform by a roller. A thermal treatment is performed at the end of the process to raise the strength of the ceramic parts..
Some researchers have studied the critical points of materials; the influence of thermal post-treatment on tensile tests and dimensional deviation [13]; the porosity and properties of parts made of different commercial materials such as ExOne and ZCast; the thermal treatment; permeability; and the ultimate tensile strength due to the evaporation of the binder [14].
Other very promising research is being carried out on shell-truss moulds to study how to control the internal temperature and cooling rate during the casting and the influence on the microstructure. The cooling rate of the casting can be controlled with a shell-truss mould [15,16]. This control has been impossible to implement in other technologies, because manufacturing of moulds with complex geometries has been unfeasible due to the high price, which is not relevant in the AM processes. A cost evaluation analysis of complex moulds has been performed [17]. However, in the research that has been done, most of the works have focused on a very specific parameter or only on the study of tests, and even though these works are useful for characterizing the process, a complete research on the parameters and the operational part is necessary. Additionally, a comparison with traditional methods is needed with regard not only to the properties but also to the manufacturing time. For these reasons, our research focuses on the feasibility of making the mould in one ceramic part and compares it with traditional sand casting.
To prove the usefulness of this modern technology, two different moulds for casting were made: the first was made as a traditional sand casting and the second was made using the 3DP technique. Once the moulds were manufactured, aluminium was poured into them. Then, we analysed the manufacturing time, cooling rate, dimensional deviation, surface quality, surface porosity, and possible defects, comparing both techniques. With this analysis, we aimed to determine whether the 3DP technique was applicable for aluminium casting, allowing more efficient designs and reducing the cost of production.
2. Materials and Methods
The methodology indicated in Figure 1 shows the main steps required to achieve the objectives stated in this work.
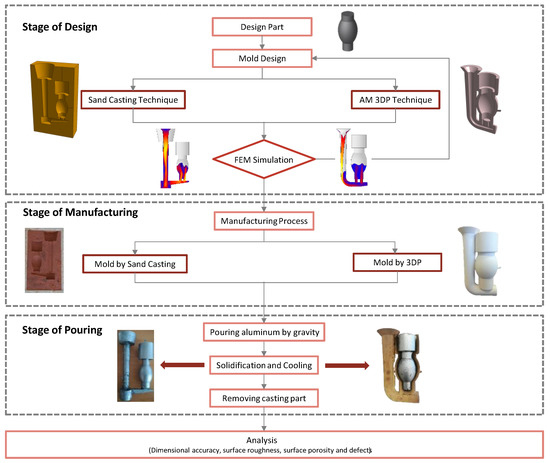
Figure 1.
Methodology for the comparison between traditional sand casting and the AM 3DP technique.
Firstly, the part was designed, as shown in Figure 2a. An AlSi series casting alloy was selected for the part. The chemical composition of the aluminium alloy is shown in Table 1.
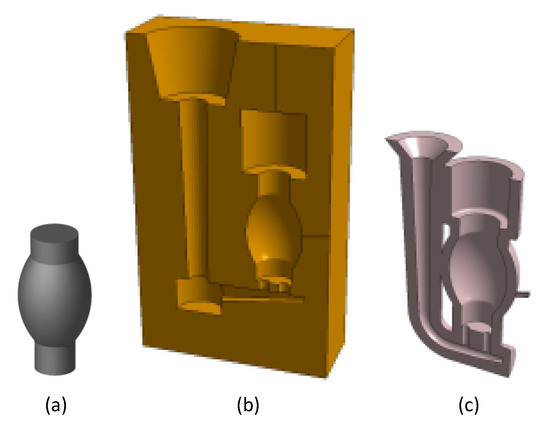
Figure 2.
(a) Casting part CAD, (b) sand mould CAD, (c) 3DP mould CAD.

Table 1.
Chemical components of AlSi series alloy.
Secondly, the filling system (sprue, well, runner, gates, and riser) was designed and calculated for both moulds. The constraints and advantages of both techniques were considered. Thirdly, a finite element analysis was used to study the behaviour of the melt flow and to optimize the filling system. Fourthly, the moulds were manufactured. To manufacture the sand casting mould, a divided pattern was made by the Fused Deposition Modelling (FDM) technique with the Ultimaker 2+ machine (Ultimaker, The Netherlands). The pattern contained the part and the filling system. The sand used was a commercial silica sand (Petrobond) with an average size between 100 and 180 μm. The ceramic mould was manufactured by the inkjet 3DP technique with a Projet CJP 660Pro machine (3D Systems, Rock Hill, SC, USA). The powder material used was Visijet PXL (hemihydrate calcium sulfate) and the binder was PXL (2-pirrolydone). Fifthly, the aluminium alloy was poured. The melting process was carried out with a Hobersal PR/400 furnace (Hobersal, Spain) at 770 ± 5 °C. The pouring temperature was 750 °C. The temperature of the mould was measured by a K-type thermal couple localized at 2 mm from the mould cavity, as shown in Figure 2b,c.
To achieve proper pouring for the sand casting, it was necessary to fix the halves of the moulds. For the 3DP technique, it was necessary to rest the mould on a sand base to prevent movement during the casting. Subsequently, the metal was poured into the different moulds. Figure 3 shows a schematic of the filling process. Finally, the aluminium alloy was solidified and the casting was extracted from both moulds by vibration and crumbling. The filling systems were cut, and the parts were cleaned with pressurized air to begin the analysis stage.
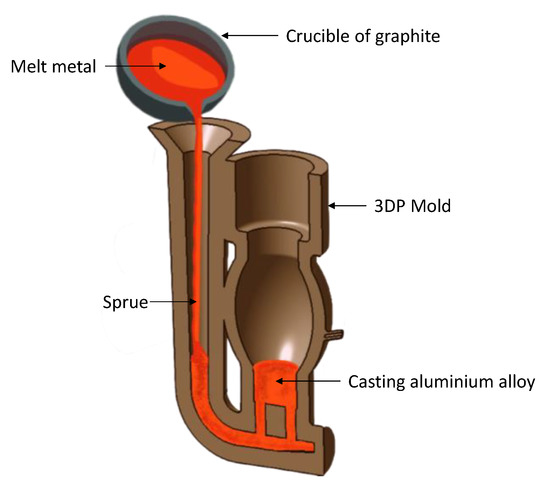
Figure 3.
Schematic of the gravity casting process.
2.1. Numerical Simulation
Finite element software was used to simulate the filling and solidification of the parts during the casting. The basic equations for the analysis are (i) the Navier-Stokes equation, (ii) the continuity equation, and (iii) the volume of fluid (VoF) method for simulating liquid metal flow of the free surface. For the convergence of the simulation, the successive over-relaxation (SOR) method was used [18,19]. This simulation predicts the filling process of the mould, the generated turbulence, the solidification process, and the distribution of the gas entrainment into the liquid. The 3D model of the part and moulds was drawn using Catia v5 r21 software (Dassault Systèmes, France). The standard triangle language (STL) files of the models were input into the simulation software. The 3D model and the main dimensions are shown in Figure 4a,b. The software automatically generated a mesh with 7,300,000 elements. The initial conditions of the real process were established as boundary conditions. The thermo-physical parameters are shown in Table 2.
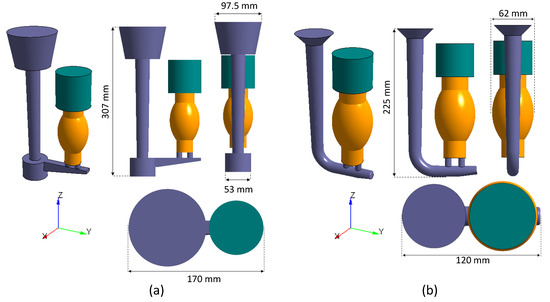
Figure 4.
(a) 3D model for sand casting system, (b) 3D model for 3DP casting system.

Table 2.
Thermophysical parameters of the cast material.
The heat transfer coefficient (HTC) between the casting and mould was chosen as a linear function based on the different thicknesses and properties of the moulds. These values were chosen from the database of the software. The result of the simulation evaluated the turbulence, the oxidation, the gas entrainment due to the filling velocity, and the possible defects created by the solidification. The simulated cooling rate was registered to verify the reliability of the process.
2.2. Characterization
To compare the two techniques, four properties were chosen: (i) dimensional quality, (ii) roughness, (iii) porosity, and (iv) general defects. To analyse the dimensional quality of both moulded parts, a Breuckmann Smart SCAN3D-HE (Breuckmann, Germany) structural light scanner with a working field of 125 mm was used. The printed pattern, the 3DP mould, and the moulded parts were scanned. The point clouds were processed by Geomagic Control X software (3D Systems, Rock Hill, SC, USA). The surface roughness was measured using a Mitutoyo Surftest SJ-500 profilometer (Mitutoyo, Japan). The cut-off was 2.5 mm and the evaluation length was 12.5 mm, in accordance with the ISO 4288:1996 standard. The measures were taken in different areas and directions of the parts. The directions were chosen in the direction of layer construction and the opposite one to evaluate the staircase effect. To evaluate the internal porosity, the moulded parts were sectioned and polished with a 3-μm diamond paste. The polished surface was swept with a Leica Kl 1500 camera (Leica, Germany). The images were analysed with ImageJ software (National Institutes of Health, Bethesda, MD, USA). A threshold filter was applied and the percentage area of porosity was obtained.
3. Results
3.1. Design, Simulation, and Manufacturing
The designed part (Figure 2a) has a rounded geometry to avoid draft angles and to obtain a proper pattern removal without damaging the sand mould. When making the mould using the 3DP technique, it is unnecessary to consider these constraints due to the design freedom of the process. The part shape has a sufficient area-to-volume ratio to compare changes in the internal morphology due to cooling and solidification rates. The volume and weight of the part were 0.6 Kg and 223.4 cm3, respectively.
The sand mould (Figure 2b) was designed following standard rules [20]. The mould incorporates a pouring cup, followed by a tapered sprue ending in a well. The runner distributes the molten material horizontally and is connected to the mould cavity by two vertical gates. The cross-section of the runner decreases linearly to distribute the flow uniformly. Finally, a top riser was placed in order to supply additional molten metal as it shrinks during solidification and to prevent porosity. The total volume of the sand mould was 1073 cm3, and the metallic yield was 20.8%. In addition, the mould was contained in a box. A large volume of sand, weighing approximately 25 kg, was needed.
The 3DP technique makes it possible to optimize the filling system in the ceramic mould. The 3DP mould is a shell of 10-mm thickness, enough to withstand the pressure of the poured metal. The filling system consisted of a single duct with a smaller filling cup. This reduction was possible thanks to the placement of an open riser that allowed the pressure to decrease. In addition, the sprue was designed with a decreasing circular section that described an arc shape sufficiently large to avoid cavitation or turbulence [21,22]. Two cylindrical gates were connected to the part cavity [23]. Due to this improvement, it was possible to eliminate the well and to decrease the dimensions of the filling system, as shown in Figure 2c. The total volume of the 3DP mould was 449 cm3, the metallic yield was 49.75%, and the weight of the mould was 0.55 kg. Compared to the sand casting, the metallic yield was optimized by 29% and the weight of the mould was 95% lower. Table 3 shows a summary of the principal parameters of the casting parts and moulds.

Table 3.
Principal parameters of the casting parts and moulds.
The gating speed is the main factor considered to avoid metal turbulence, gas entrainment, and oxide films. Campbell [24] indicated that the maximum gating speed should be 0.5 m/s during the filling process. Figure 5 shows the filling speed field for both moulds during the filling process.
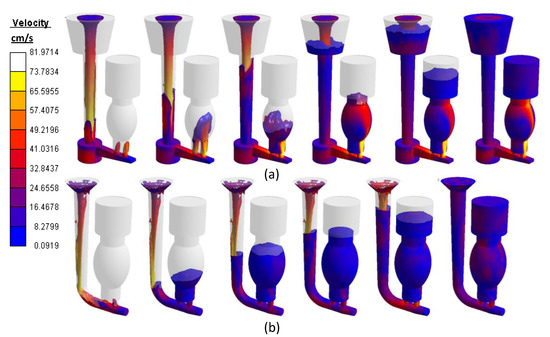
Figure 5.
(a) Sand casting filling velocity profile, (b) 3DP filling velocity profile.
At the beginning of the filling process in the sand mould (Figure 5a), the velocity of the liquid metal entering the part cavity through the gates was faster than the runner. This increase of speed produced a fountain effect. The speed in the ingates was above 0.5 m/s, producing severe turbulence. This increased the probability of gas entrainment and oxide films occurring [25]. The bigger cross-section into the cavity made the velocity decrease. Although the turbulence decreased, a chaotic field was created. Finally, while the filling process was taking place, as the metal filled the mould, the metallostatic pressure was balanced due to the weight of the metal flow decreasing the velocity on the gates. In contrast, in the 3DP mould filling process (Figure 5b), the liquid metal came into the part cavity through the gates at a lower speed than in the runner. This avoided the fountain effect inside the part cavity. The speed in the area of the gates remained stable at around 0.5 m/s throughout the filling cycle. This speed generated a moderate turbulence and minimized the risk of gas entrainment. Due to the optimization of the design and the placing of an open riser, the filling of the 3DP mould was progressive and homogeneous.
The gating speed at the cross-section of the ingate area was measured with the software during the filling process for both moulds. Figure 6 indicates different velocities at the cutting plane in the centre of the ingates. This process was divided into four steps.
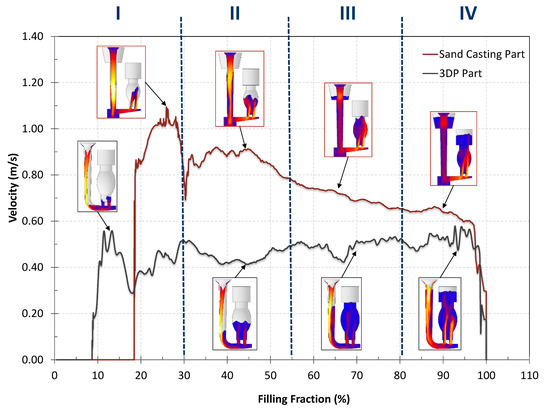
Figure 6.
Velocity profile in the gates of both moulds during the filling process.
- Stage I: A high input speed was generated for both techniques, reaching up to 1.10 m/s in sand casting and 0.55 m/s in 3DP casting.
- Stage II: The speed decreased and remained constant during most of the filling process at around 0.90 m/s in sand casting and around 0.48 m/s in 3DP casting.
- Stage III: The speed continued to decrease to 0.63 m/s in the sand casting technique. In 3DP casting, the speed remained constant at around 0.48 m/s.
- Stage IV: For both techniques, the speed remained constant with regard to the previous values and drastically diminished on completing the filling process.
During Stage I, the ingate speed was higher than 0.50 m/s for both techniques. An input speed higher than 0.5 m/s creates turbulences in the surface of the metal, causing gas entrainment in this type of process. The fountain effect generated in the sand mould gave a maximum speed of 1.10 m/s. Sanitas et al. [26] found that a high-pressure ratio along with a larger section area results in higher gate speed. Therefore, the risk of gas entrainment is very high. In contrast, the 3DP technique did not generate the fountain effect. The input speed in stage I of the filling process of the 3DP mould was 0.55 m/s, which was at the limit. It quickly descended and then became constant. Therefore, there was a very low risk of gas entrainment. The speed in the sand casting technique simulation remained at around 0.90 m/s during Stage II. In Stages III and IV, the speeds decreased with a moderate slope to 0.63 m/s. In these stages, the fountain effect disappeared but the filling was chaotic and the turbulence generated waves that overlapped each other. Bifilms, inclusion, and gas entrainment could be produced in the casting part for these turbulences. On the other hand, during the simulation of the 3DP technique, the speed in Stages II, III, and IV remained constant at around 0.5 m/s. This generated homogeneous filling with a moderate turbulence, minimizing the probability of generating gas entrainment, inclusions, or oxides. These simulations were in accordance with the porosity analysis of the manufactured parts.
The high-speed profile presented in the moulds during the filling process could generate erosion in different areas of the moulds. These areas of the moulds are ripped off, generating slag that could be trapped in the flow of molten metal. In the sand casting, the gate has a high probability of erosion due to the fountain effect (Figure 7a). However, with the 3DP mould (Figure 7b), the probability of erosion has been minimized due to better control of the velocity profile. On the other hand, in Figure 7d, a slight probability of erosion appears at the base of the gate due to the homogeneous filling rate, which does not exist for the traditional mould (Figure 7c). These simulations were in accordance with the inclusions found in the manufactured sand casting part.
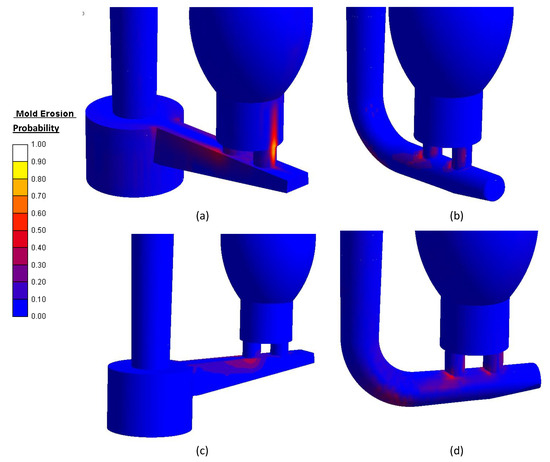
Figure 7.
Probability of mould erosion: (a,c) sand casting, (b,d) 3DP casting.
Once the filling process of the moulds was complete, the parts solidified. Figure 8 shows the temperature distribution calculated for both parts, immediately after the filling process. The liquid temperature at this moment was lower than the pouring temperature. The sand-casting temperature remained uniform in the part cavity at about 710 °C (Figure 8a). However, the 3DP mould temperature was about 675 °C (Figure 8b). The real temperature distribution measured in the moulds is shown in Figure 9. The mould temperature increased during the filling process and decreased during the solidification process. The real measured temperature confirmed the results of the simulation for both moulds. A lower cooling rate was obtained in the sand mould due to the low thermal conductivity of the sand and the greater thickness of the mould. In contrast, the lower thickness and higher thermal conductivity of the 3DP mould facilitated the flow of heat.
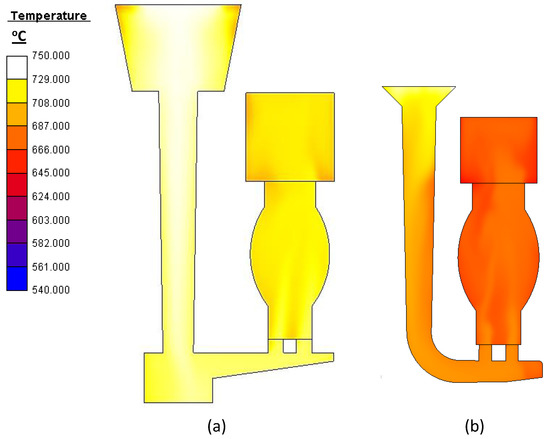
Figure 8.
Casting temperature profile for both parts after ending the filling process: (a) sand casting. (b) 3DP casting.
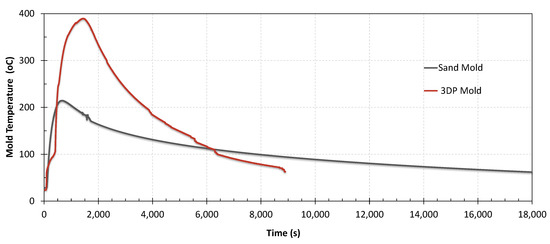
Figure 9.
Temperature profile of the moulds during filling time and cooling time.
The filling time and the solidification were very different between the two simulations due to the differences in the volumes of each cavity, in heat transmission, and in the thickness of the moulds. The filling time for the sand mould was 5.24 s and the solidification time was 541 s. For the 3DP mould, the filling time was 2.20 s and the solidification time was 378 s. A lower solidification time means a faster cooling ratio, resulting in higher productivity and better mechanical properties of castings. Table 4 shows the manufacturing time of the parts. Manufacture of the sand casting part took 23.5 h, equivalent to approximately three working days. In contrast, manufacture of the 3DP casting part took 10 h or only two working days. To manufacture the sand mould, it was necessary to design and manufacture a two-part pattern and to smooth the surface of the pattern (Figure 10a). In contrast, to manufacture the 3DP mould, it was necessary to prepare the file, print and clean the mould, and apply the heat treatment before pouring the metal (Figure 10b).

Table 4.
Time taken for each manufacturing stage.
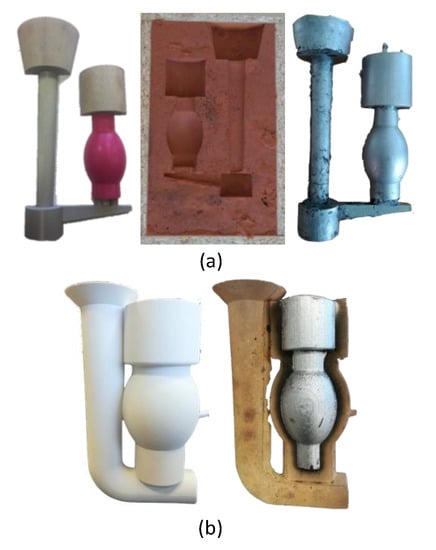
Figure 10.
(a) Stages of the sand casting manufacturing process, (b) stages of the 3DP manufacturing process.
AM is advantageous for manufacturing unique parts or short series. Table 4 shows the time taken to perform each stage in detail. In addition, the 3DP mould preparation is more advantageous due to the free-form design and the reduction of manufacturing time, avoiding the human factor and the pattern manufacture.
3.2. Roughness
The measurements were taken in different areas and directions on the surface of the parts (Figure 11) in accordance with the ISO 4288:1996 standard [27]. The directions were chosen following the direction of layer construction and the opposite one to evaluate the staircase effect. The pattern used in sand casting was treated with dichloromethane vapour [28,29]. This treatment eliminates the staircase effect, so the part does not replicate this effect. On the other hand, the 3DP mould was manufactured by adding layers 0.1 mm in thickness. With this technique, it was not possible to apply a post-treatment to smooth the surface, and therefore the mould had a staircase effect. The moulded part replicates the mould surface and therefore presents the staircase effect.
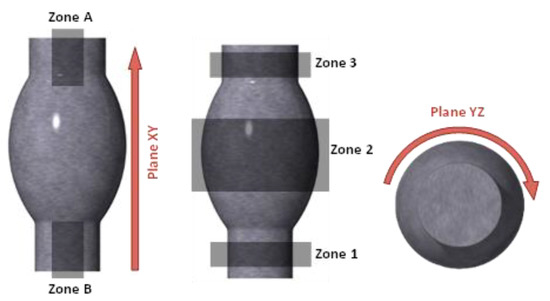
Figure 11.
Directions and roughness measurement zones for both parts.
Table 5 shows the values obtained for the Ra parameter in all the zones and directions of the parts. The roughness of the part manufactured using the sand casting technique had a mean value of Ra = 3.70 µm in the direction of the layer construction and Ra = 4.53 µm in the opposite direction. A very good value was achieved with this type of technique due to the use of PetroBond precision sand. Moreover, the difference between the Ra values in the two directions was reduced due to the smoothing of the FDM pattern. In the case of the mould created using 3DP, the average roughness value was Ra = 3.67 µm in the direction of layer construction and Ra = 7.07 µm in the opposite direction. This increase of Ra was due to the staircase effect characteristic of AM technology. Even so, the average difference between the two techniques was very small and below the normal parameters of sand casting (10 µm < Ra < 25 µm).

Table 5.
Roughness values in the different areas and directions.
3.3. Dimensional Quality
The parts were scanned and their point clouds were processed by Geomagic Control X software. The average number of points in each scan was 45,000. The standard deviation and the mean deviation were obtained. The parts manufactured by sand casting and 3DP casting were compared. The errors produced by both techniques were analysed considering the following: (i) the FDM pattern was smoothed with dichloromethane vapour to eliminate the staircase effect; (ii) the mould created by 3DP was subjected to heat treatment at 250 °C during 2 h to eliminate volatile elements.
The dimensional error induced by the FDM pattern in the sand casting technique and the heat treatment for the 3DP mould was quantified. Therefore, the real dimensional deviation is the sum of the errors produced during the casting process compared with the nominal geometry (CAD). A comparison of dimensional percentages of the surface point mesh was calculated. The tolerance range used was 0.05 mm for the upper deviation and 0.05 mm for the lower deviation, while the maximum deviation was set as 1 to −1 mm. These values were visually displayed on a colour map. The upper and lower average deviation and the percentage of total points for each type of deviation were compared.
The FDM pattern in sand casting had an average deviation of 0.12 mm, covering 63% of its surface. This error is acceptable for this type of process [30]. For the 3DP technique, the mould without heat treatments had a very uniform deviation, within the range of 0.1 to −0.1 mm. After the heat treatment, the values changed to 0.13 mm and −0.09 mm for the upper and lower deviation, respectively. In both cases, the parts had a very low percentage of points in the upper deviation (Figure 12). The percentage of points in the lower deviation was 98.6% for sand casting and 71.83% for 3DP. This may be due to the thermal contraction suffered by the parts during the casting. Consequently, only the lower average deviation is compared. Table 6 verifies that the 3DP moulded part (−0.37 mm) was closer to the nominal value than the sand casted part (−0.64 mm). In addition, the deviation of the 3DP moulded part was very close to the expected thermal contraction for this type of aluminium alloy (−0.3 mm). On the other hand, the sand casting deviation values were well centred on the value of −0.64 mm. However, the deviation values of the 3DP part were more dispersed. This may be due to the calcination of the mould in contact with the liquid metal during the filling process. This phenomenon may be the cause of the geometric error and the dispersion of the values.

Figure 12.
Dimensional deviation with respect to CAD: (a) sand casting technique, (b) 3DP technique.

Table 6.
Upper and lower deviations for both techniques.
Finally, the analysis revealed the differences in accuracy between the sand casting technique and the 3DP casting technique. In sand casting, the real average deviation between the part and the pattern was 0.76 mm. In the case of 3DP, the average deviation between the part and the mould cavity was −0.43 mm. Therefore, the 3DP casting technique can manufacture a more precise part than sand casting.
3.4. Surface Porosity and Defects
To analyse the reason for the porosity in the castings, a longitudinal cut was made in the parts. The sectioned surfaces provided useful information on the formation of defects in the casting, such as inclusions, porosity, or shrinkage.
The sand casting part had two types of porosity: (i) gas entrapment, with full spherical pores resulting from a turbulent filling; most of the porosity in this part is featured by this morphology, and (ii) bifilms due to the folding in the layers of oxides contained in the molten metal.
(i) A speed greater than 0.5 m/s generated turbulence and, consequently, gas entrapment. In addition, the high filling speed with turbulence in the liquid metal increased the speed of air drag, causing porosity in the casting parts [25]. The pores shown in Figure 13a correspond to a typical spherical bubble morphology. The partial evaporation of the binder in the ceramic mould and the severe turbulence probably generated this kind of porosity. When the local pressure of gas in a mould exceeds the local metallostatic pressure of the liquid metal, a bubble is formed. These bubbles will ascend to areas of less pressure. Most of the pores due to gas entrapment in the sand casting part occurred in the upper areas. (ii) On the other hand, entrainment of oxide films is always surrounded by a thin layer of air. The folded oxide films may come from the furnace, liquid metal transport, or turbulence during the filling process [31]. Bifilms have irregular and elongated shapes due to a repeated folding of the metal surface (Figure 13b). The porosity was due to severe turbulence generated inside the mould as a consequence of the fountain effect.
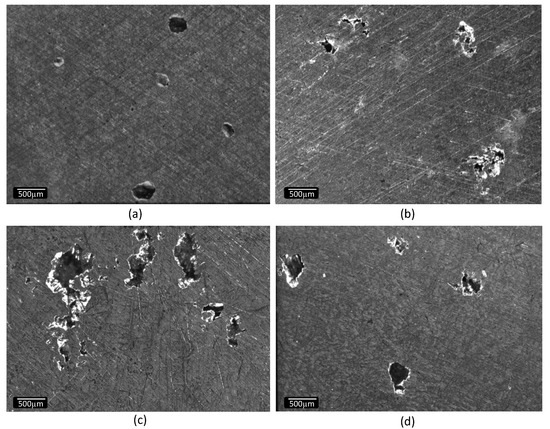
Figure 13.
Microstructure of defects: sand casting part (a,b); 3DP part (c,d).
In the case of the 3DP moulded part, two major types of pores were found: (i) a mixture between gas entrapment and shrinkage and (ii) shrinkage. Upadhyay et al. [10] reaffirmed that the binder used in the 3DP technique is around 8%. The amount of volatile elements is higher than in traditional processes (1.4%). To eliminate moisture and volatile elements, heat treatment was applied. It consisted of heating the ceramic mould to a temperature of 250 °C during 1.5 h. These values were chosen based on previous studies, so that the main sources of gas were almost supressed. However, when the mould was exposed to the pouring temperature, the pressure at the metal–mould interface increased. The air contained in the mould cavity was heated and the binder vaporized, decomposed, and heated up [32]. The open riser design helped the majority of the gas to escape. The ratio of generated gas during the filling process was very high. Therefore, the mould impeded the immediate release of gas pressure and may have caused gas entrapment. On the other hand, the design of the mould provided a very fast cooling. As pouring stopped, the metal continued to solidify and the pressure of the remaining liquid metal decreased. Nucleation points were formed due to the lower temperature of entrainment gas. In this way, pores may be formed by shrinkage and a mixture of shrinkage and gas entrainment (Figure 13c,d).
Finally, the area occupied by the pores in the sand casting had an average surface porosity of 0.95%. On the other hand, the 3DP moulded part had a higher surface porosity with an average value of 1.63%. This difference may be due to the greater gas generation produced by reactions within the 3DP mould and faster solidification of the 3DP part. This phenomenon impeded the gas evacuation and created porosity.
Surface defects were observed only in the part manufactured with the sand mould (Figure 14). One of the defects that could be found was the inclusion of sand, as can be observed in Figure 14a. Sand areas were torn off by the metal stream, floated to the surface, and were then trapped by the molten metal. The main cause of this defect was attributed to an uneven compaction of the mould or a high liquid speed capable of damaging the mould. Another defect was flow marks (Figure 14b). They were produced on the part surfaces and the defect appeared as lines which trace the flow stream of liquid metal. It could be produced by oxide films lodged at the surface. One of the advantages of manufacturing shell moulds by the 3DP technique is that mismatch errors disappear, and no joining lines are detected as occurs in the traditional sand casting technique.
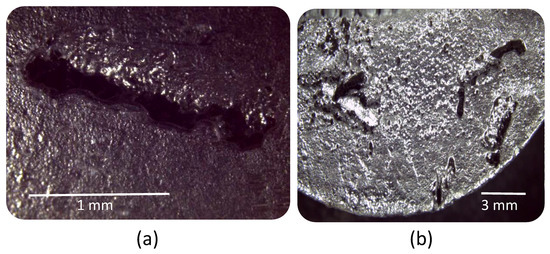
Figure 14.
(a) Inclusion of sand and (b) flow marks.
4. Conclusions
In conclusion, in this work, a 3DP moulding process was compared with traditional sand casting. Multiple aspects were investigated, such as the roughness evaluation, dimensional deviation, and defects. The main findings can be summarized as follows:
- (1)
- The freedom of designing moulds using the 3DP technique allows us to create complex geometries in the cavities and in the feeding system that can optimize the casting process. A finite element analysis allowed us to verify the behaviour during filling and solidification when using both techniques, 3DP casting and sand casting.
- (2)
- The manufacturing time of the casting was reduced by 67% with the 3DP technique. This reduction in time is advantageous for unique or short series. In addition, the 3DP technique eliminates tools such as patterns, inserts, or boxes and avoids problems such as mismatch defects.
- (3)
- The roughness of the part manufactured using the 3DP mould is of the same order as the roughness of the part obtained using sand moulds. However, Ra increases in the transversal direction due to the staircase effect of the mould. Additional research on binders may reduce the staircase effect.
- (4)
- The dimensional quality is strongly influenced by the manufacturing method. The 3DP technique eliminates the intermediate pattern and the human factor, improving the quality of the casting parts.
- (5)
- Sand casting porosity is due to gas entrainment and oxide films. A reduction of pouring speed is suggested to avoid the fountain effect. To reduce porosity in the 3DP mould, the study of mould post-treatment suggests the use heating ramps to eliminate the volatiles. Another suggestion could be to increase the pouring temperature to delay solidification, helping gas evacuation.
To conclude, the use of the 3DP technique for manufacturing aluminium casting moulds is adequate for obtaining parts in a way very similar to traditional techniques. The advantage of using 3DP to obtain a mould is the significant reduction in time and the possibility of creating more complex geometries. However, it is necessary to continue investigating the thermo-chemical-physical mechanisms that give the mechanical properties to both the moulds and the parts.
Author Contributions
Conceptualization, P.R.-G., A.I.F.-A. and M.Á.C.-S.; Formal analysis, A.I.F.-A. and M.Á.C.-S.; Investigation, P.R.-G., and P.E.R.V.; Methodology, P.R.-G.; Project administration, J.B.G.; Software, P.R.-G.; Supervision, J.B.G.; Validation, P.R.G. and P.E.R.V.; Writing—original draft, P.R.-G. and P.E.R.V.; Writing—review & editing, A.I.F.-A., M.Á.C.-S. and J.B.G. All authors have read and agreed to the published version of the manuscript.
Funding
The authors thank the Ministry of Science, Innovation and Universities of Spain for the support through the research project with reference DPI2017-89840-R.
Conflicts of Interest
The authors declare no conflict of interest.
References
- Linder, J.; Axelsson, M.; Nilsson, H. The influence of porosity on the fatigue life for sand and permanent mould cast aluminium. Int. J. Fatigue 2006, 28, 1752–1758. [Google Scholar] [CrossRef]
- Sun, J.; Le, Q.; Fu, L.; Bai, J.; Tretter, J.; Herbold, K.; Huo, H. Gas entrainment behavior of aluminum alloy engine crankcases during the low-pressure-die-casting process. J. Mater. Process. Technol. 2019, 266, 274–282. [Google Scholar] [CrossRef]
- Samuel, A.M.; Samuel, F.H. Effect of alloying elements and dendrite arm spacing on the microstructure and hardness of an Al-Si-Cu-Mg-Fe-Mn (380) aluminium die-casting alloy. J. Mater. Sci. 1995, 30, 1698–1708. [Google Scholar] [CrossRef]
- Karamouz, M.; Azarbarmas, M.; Emamy, M. On the conjoint influence of heat treatment and lithium content on microstructure and mechanical properties of A380 aluminum alloy. Mater. Des. 2014, 59, 377–382. [Google Scholar] [CrossRef]
- Wang, M.; Xu, W.; Han, Q. Study of refinement and morphology change of AlFeSi phase in A380 alloy due to addition of Ca, Sr/Ca, Mn and Mn, Sr. Mater. Trans. 2016, 57, 1509–1513. [Google Scholar] [CrossRef]
- Sama, S.R.; Badamo, T.; Lynch, P.; Manogharan, G. Novel sprue designs in metal casting via 3D sand-printing. Addit. Manuf. 2019, 25, 563–578. [Google Scholar] [CrossRef]
- Sama, S.R.; Wang, J.; Manogharan, G. Non-conventional mold design for metal casting using 3D sand-printing. J. Manuf. Process. 2018, 34, 765–775. [Google Scholar] [CrossRef]
- Eisaabadi Bozchaloei, G.; Varahram, N.; Davami, P.; Kim, S.K. Effect of oxide bifilms on the mechanical properties of cast Al-7Si-0.3Mg alloy and the roll of runner height after filter on their formation. Mater. Sci. Eng. A 2012, 548, 99–105. [Google Scholar] [CrossRef]
- Chen, Z.; Li, Z.; Li, J.; Liu, C.; Lao, C.; Fu, Y.; Liu, C.; Li, Y.; Wang, P.; He, Y.; et al. 3D printing of ceramics: A review. J. Eur. Ceram. Soc. 2019, 39, 661–687. [Google Scholar] [CrossRef]
- Upadhyay, M.; Sivarupan, T.; El Mansori, M. 3D printing for rapid sand casting—A review. J. Manuf. Process. 2017, 29, 211–220. [Google Scholar] [CrossRef]
- Derby, B. Additive Manufacture of Ceramics Components by Inkjet Printing. Engineering 2015, 1, 113–123. [Google Scholar] [CrossRef]
- ISO/ASTM 52900:2015. Additive Manufacturing—General Principles—Terminology; International Organization for Standardization: Geneva, Switzerland, 2015. [Google Scholar]
- Bassoli, E.; Atzeni, E. Direct metal rapid casting: Mechanical optimization and tolerance calculation. Rapid Prototyp. J. 2009, 15, 238–243. [Google Scholar] [CrossRef]
- Snelling, D.A.; Williams, C.B.; Druschitz, A.P. Mechanical and material properties of castings produced via 3D printed molds. Addit. Manuf. 2019, 27, 199–207. [Google Scholar] [CrossRef]
- Shangguan, H.; Kang, J.; Deng, C.; Hu, Y.; Huang, T. 3D-printed shell-truss sand mold for aluminum castings. J. Mater. Process. Technol. 2017, 250, 247–253. [Google Scholar] [CrossRef]
- Kang, J.; Shangguan, H.; Deng, C.; Hu, Y.; Yi, J.; Wang, X.; Zhang, X.; Huang, T. Additive manufacturing-driven mold design for castings. Addit. Manuf. 2018, 22, 472–478. [Google Scholar] [CrossRef]
- Almaghariz, E.S.; Conner, B.; Lenner, L.; Gullapalli, R.; Manogharan, G.P.; Lamoncha, B.; Fang, M. Quantifying the role of part design complexity in using 3d sand printing for molds and cores. Int. J. Met. 2016, 10, 240–252. [Google Scholar] [CrossRef]
- Cleary, P.; Ha, J.; Alguine, V.; Nguyen, T. Flow modelling in casting processes. Appl. Math. Model. 2002, 26, 171–190. [Google Scholar] [CrossRef]
- Esparza, C.E.; Guerrero-Mata, M.P.; Ríos-Mercado, R.Z. Optimal design of gating systems by gradient search methods. Comput. Mater. Sci. 2006, 36, 457–467. [Google Scholar] [CrossRef]
- Campbell, J. Castings Practice: The 10 Rules of Castings; Elsevier/Butterworth-Heinemann: Amsterdam, The Netherlands, 2004. [Google Scholar]
- Hsu, F.Y.; Jolly, M.R.; Campbell, J. A multiple-gate runner system for gravity casting. J. Mater. Process. Technol. 2009, 209, 5736–5750. [Google Scholar] [CrossRef]
- Dai, X.; Yang, X.; Campbell, J.; Wood, J. Effects of runner system design on the mechanical strength of Al-7Si-Mg alloy castings. Mater. Sci. Eng. A 2003, 354, 315–325. [Google Scholar] [CrossRef]
- Masoumi, M.; Hu, H.; Hedjazi, J.; Boutorabi, M.A. Effect of Gating Design on Mold Filling. AFS Trans. 2005, 113, 1–12. [Google Scholar]
- Campbell, J. Complete Casting Handbook: Metal Casting Processes, Metallurgy, Techniques and Design, 2nd ed.; Butterworth-Heinemann: Amsterdam, The Netherlands, 2011. [Google Scholar]
- Majidi, S.H.; Griffin, J.; Beckermann, C. Simulation of Air Entrainment during Mold Filling: Comparison with Water Modeling Experiments. Metall Mater. Trans. B Process. Metall Mater. Process. Sci. 2018, 49, 2599–2610. [Google Scholar] [CrossRef]
- Sanitas, A.; Bedel, M.; El Mansori, M. Experimental and numerical study of section restriction effects on filling behavior in low-pressure aluminum casting. J. Mater. Process. Technol. 2018, 254, 124–134. [Google Scholar] [CrossRef]
- ISO 4288:1996 Standard. Geometrical Product Specifications (GPS)—Surface Texture: Profile Method—Rules and Procedures for the Assessment of Surface Texture; International Organization for Standardization: Geneva, Switzerland, 1996. [Google Scholar]
- Galantucci, L.M.; Lavecchia, F.; Percoco, G. Experimental study aiming to enhance the surface finish of fused deposition modeled parts. CIRP Ann. Manuf. Technol. 2009, 58, 189–192. [Google Scholar] [CrossRef]
- Jin, Y.; Wan, Y.; Zhang, B.; Liu, Z. Modeling of the chemical finishing process for polylactic acid parts in fused deposition modeling and investigation of its tensile properties. J. Mater. Process. Technol. 2017, 240, 233–239. [Google Scholar] [CrossRef]
- Leonardi, R.; Muraglie, S.; Rugeri, M.; Barbato, E. Three-dimensional evaluations of the digital casts of morphologic maxillary teeth symmetry in patients with unilateral palatally displaced canines. Am. J. Orthod. Dentofac. Orthop. 2019, 155, 339–346. [Google Scholar] [CrossRef]
- Campbell, J. An overview of defects of bifilms on the structure and properties of cast alloys. Met. Mater. Trans. B 2006, 37, 857–863. [Google Scholar] [CrossRef]
- Monroe, R. Porosity in Castings. ChemInform 2006, 37, 1–28. [Google Scholar] [CrossRef]
© 2020 by the authors. Licensee MDPI, Basel, Switzerland. This article is an open access article distributed under the terms and conditions of the Creative Commons Attribution (CC BY) license (http://creativecommons.org/licenses/by/4.0/).