Abstract
The cleanliness of the casting blanks could seriously affect the quality of downstream products. Recently, ultrasound technology has been introduced to detect the inclusions in metal materials. However, due to the anisotropy of the material crystal, the ultrasonic wave has the characteristics of multiple scattering and refraction in its propagation process. This makes it difficult to evaluate the casting blanks cleanliness effectively, for the inclusion echoes are submerged in the background noise. Therefore, the ultrasonic microscope is innovatively proposed to carry out efficient scanning on the casting blanks. In the meantime, the morphological filtering algorithm has the advantages of fewer parameters and faster calculation speed which can be used to increase the signal-to-noise ratio of ultrasound images and extract the defect features more efficiently. In order to verify the effectiveness of the proposed method, specimens were taken from three strands of continuous caster for detection and analysis. The experimental results show that the second strand has the best quality and the cleanliness is 2.2/mm3, which is obviously better than the other two strands. This method will provide a new technology for the quantitative evaluation of the internal quality of the casting blanks.
1. Introduction
As an important intermediate product in modern steel industry, the cleanliness of cast steels impacts directly on the quality of deep-processed products. Especially, the inclusions in cast steels damage seriously the process ability and service performance of steel products. Therefore, accurate inspection and evaluation of inclusions are necessary in order to improve the technology of continuous casting and reduce the influence of inclusions [1].
There are many methods to detect and evaluate casting blanks at present. Traditional detection methods mainly include the metallographic method, standard spectrum comparison method, automatic image analysis, and scanning electron microscope method. [2] In order to further obtain the important information of inclusions such as morphology, composition, and type, many new detection methods have been applied. Janis [3] used pulse distribution analysis with optical emission spectroscopy (PDA/OES) method to detect inclusions in the casting blanks, and obtained the distribution differences of inclusions in the bottom, middle and top of the blanks and found that the inclusions mostly converged at about 1/4 of the side of the inner arc. Bengtson et al. [4] obtained the mass of various elements in the sample inclusion by means of spark analysis. Newman et al. [5] used auger electron spectroscopy (AES) to detect and analyze sulfide inclusions in carbon steel. Zhang et al. [6] combined the methods of metallography and electrolysis to study the morphological changes of MnS inclusions in U75V steel. Brandaleze et al. [7] employed liquid metal cleanliness analysis (LiMCA) to test al-6si alloy, in which various inclusions in the alloy could be effectively detected. Ren et al. [8] used automatic inclusion analysis technology (ASPEX) for low-aluminum carbon steel and combined with an electron microscope to achieve automatic identification of inclusions. Lahiri et al. [9] used alternating magnetic field assisted infrared thermal imaging to detect defects in low carbon steel. Nakai et al. [10] detected the three-dimensional topography of inclusions by X-ray inspection of 100Cr6 steel. Through above analysis, these methods can obtain information such as the size or quantity of inclusions, and provide necessary technical means for analyzing the physical and chemical characteristics of inclusions. However, the above detection methods have the problems of complex specimen preparation, destructive test, small field of view, little statistical area, etc.
In order to solve the above problems existing in the detection methods, more and more attention has been paid to the rapid evaluation method of the internal microstructure of metal materials based on ultrasonic microscope. Generally, sound waves with a center frequency of more than 20 MHz are high-frequency ultrasound. Ultrasonic wave has the characteristics of short-wave and high resolution [11], with a fast detection speed [12] and a large detection range [13]. Zhou et al. [14] used 50 MHz ultrasonic water immersion ultrasonic equipment to detect Al2O3 inclusions in galvanized steel sheets, and obtained the relationship between the depth and size of inclusions. Midroit et al. [15] applied 80 MHz ultrasonic to detect inclusions above 20 μm in bearing steel to obtain the effect of inclusions on fatigue performance. Liu [16] adopted 125 MHz high-frequency ultrasonic probe to detect the corrosion in internal cavity of hollow metallic components and obtain the thickness of the corrosion layer. Nishimura et al. [17] used a 200 MHz ultrasonic C-scan or B-scan to detect damage to pure iron plates and observe the distribution of holes and cracks. Through the mentioned analysis, it is found that the ultrasonic microscopy can effectively detect and evaluate the microstructure inside the metal material. However, since the ultrasonic waves are affected easily by the difference in acoustic impedance of various media during the transmission of the metal material, the ultrasonic signals representing the defect characteristics are usually submerged in strong background noise. How to improve the signal-to-noise ratio of ultrasonic signal through effective signal processing method is one of the current research hotspots.
To further deal with affected ultrasonic signals, many scholars have put forward their own opinions from ultrasonic signal processing. Tiwari [18] applied discrete wavelet transform, variational mode decomposition, and Hilbert transform for the analysis of disbond-type defects in the segment of wind turbine blade. Sharma et al. [19] applied ensemble empirical mode decomposition (EEMD) methodology for SNR enhancement of ultrasonic signals in coarse grain medium, and this methodology was successfully employed for detection of defects in a 50 mm thick coarse grain austenitic stainless steel. Chong et al. [20] used the method of generating statistical threshold based on noise mapping to process the ultrasonic guided wave signals in stainless steel, and successfully removed the noise in the ultrasonic guided wave signals, but the disadvantage of this method is that the signal delay time is too long, making the interface wave broaden longer which increase the blind zone range and reduce the inspection thickness. Wu et al. [21] used the sparse Bayesian learning method to extract the ultrasonic characteristics of the internal defects of 304 stainless steel, but this method could not obtain the size information of the defects. To sum up, although the existing signal processing methods can effectively extract the characteristics of ultrasonic signals, there are still some problems: The extraction results are affected by noise and cannot effectively characterize the internal defects when the detection resolution is further improved to dozens of microns; the processing algorithms are sensitive to parameters and unsuitable for processing thousands of ultrasonic signals.
In attempt to tackle this issue, this paper mainly carries out research from two aspects of detection method and processing algorithm. In terms of detection method, ultrasonic microscope is mainly used as a detection technology to detect the inclusions and statistic in a three-dimensional space range, which solves the problems of complex specimen preparation, small field of view, little statistical area, etc. In terms of processing algorithm, the mathematical morphology method is used to improve the signal-to-noise ratio of the ultrasound image to better extract the features of the ultrasonic C-scan image and to solve the problems of large amount of calculation and sensitivity to parameters in the traditional noise removal process. Specifically, it mainly includes the following steps: Firstly, the specimens are scanned by C-scan using ultrasonic microscope to obtain the ultrasonic image of inclusion; secondly, the original ultrasonic grayscale image is binarized and then processed by morphological algorithm to remove noise components; and finally, statistical analysis of the processed image is carried out to evaluate the casting blanks cleanliness. The advantages of the new method are as follows: (1) Ultrasonic microscope is used to detect the three-dimensional space inside the casting blanks, and the accuracy can reach the level of micrometer. (2) Morphological filtering has the advantages of simple signal processing algorithm, few parameters, and good robustness, which can improve the signal-to-noise ratio of ultrasonic image and obtain more accurate evaluation results of billet cleanliness.
The evaluation of the casting blanks cleanliness is completed in the following three sections: (1) Indicate the source of the sample, explain the working principle of the device, and focus on the selection of the probe and the selection of detection parameters and methods. (2) Introduce the basic role of mathematical morphology, and select the appropriate operator and structure elements to process the ultrasound image, and then complete the statistics of non-metallic inclusions in the specimen. (3) Analyze the cleanliness of the specimen from different strands and the distribution of inclusions with different sizes to obtain the best strand. The effectiveness of the algorithm is verified by analyzing the results before and after morphological filtering. By comparing the results obtained by metallographic method and ultrasonic detection method, the advantages of accurate and large-scale detection of the new method are verified.
2. Materials and Ultrasonic Detection
In this section, the specimen preparation, ultrasonic equipment, and the selection of test parameters are introduced in detail.
2.1. Test Specimen Preparation
First, the specimens of the continuous casting blanks were obtained from three different strands S1, S2, and S3, and further sampling was performed as shown in Figure 1.
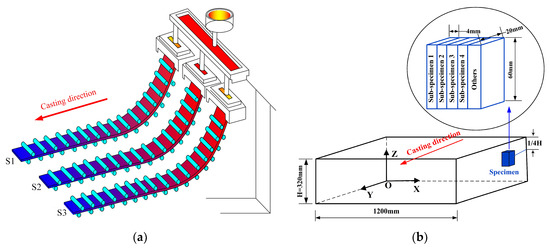
Figure 1.
Schematic diagram of experimental material sampling. (a) the schematic of casting strands; (b) the schematic of specimen from a casting strand.
Figure 1a is a schematic diagram of continuous casting, where S1, S2, and S3, respectively represent three different strands. As shown in Figure 1b, the specimens were taken on the YOZ surface of three strands, near 1/4H of the top surface, where has more inclusions gathered [3]. According to the partial enlarged view on the right side of Figure 1b, a specimen is cut into four pieces along the YOZ surface by wire cutting, and the size of each sub-specimen is 60 mm by 20 mm by 4 mm, numbered from number 1 to number 4 in the X-axis direction from the internal side of the blanks to the outer side. According to the above cutting method, a total of four sub-specimens to be tested can be obtained in each casting strands.
2.2. Ultrasonic Equipment and Detection Parameters
The equipment is SAM-300 ultrasonic microscope of German PVA Company as shown in Figure 2. The industrial computer controls the pulse generation/receiver to generate a voltage pulse signal, so that the ultrasonic probe generates ultrasonic waves, and the ultrasonic waves are transmitted into the test specimen through the coupling action of water. The ultrasonic reflection signal generated in the specimen is received by the ultrasonic probe, and then, it is converted into voltage signal which is received by the pulse generator/receiver through the piezoelectric effect. After analog-to-digital conversion of the industrial computer, the ultrasonic waveform, or detection image and other data are displayed through the monitor.
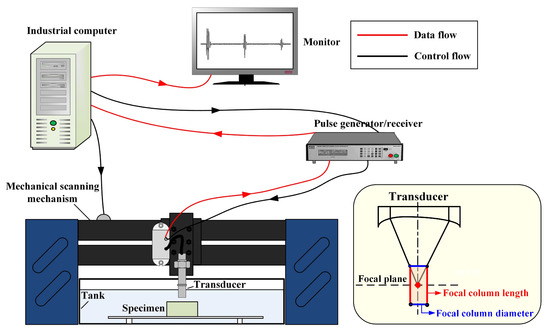
Figure 2.
The diagram of ultrasound microscope working principle.
As shown in the Figure 2, the ultrasonic focusing probe has two important parameters, namely the focal column diameter and focal column length. According to the principle of ultrasonic propagation, the smaller the focal column diameter is, the higher the lateral resolution is, and the longer the focal column length is, the larger the effective range that the probe can detect is. The thickness of the specimen we need to detect is 2 mm, and the resolution of the ultrasonic inspection is inversely proportional to the inspection depth. Under the premise of using the layered double-sided focus detection method to ensure the inspection depth, the inspection resolution is as high as possible, so we choose a 100 MHz probe, which has a focal column diameter of 40 μm and a focal column length of 106 μm.
When the scanning step is less than the focal column diameter, the focal column can completely cover the detection range without missing detection [22], so the scanning step should be less than 40 μm. Meanwhile, ideal results could be obtained when the thickness range to be detected is within two times the focal column length, so the thickness should be less than 212 μm. In addition, the theoretical resolution of the ultrasonic probe is 30 μm, which is the half-wavelength of ultrasonic waves transmitted in the medium. When the scanning step is less than the theoretical resolution, it can prevent the missing detection caused by excessive step, so we choose 20 μm as the scanning step. The experimental parameters are shown in the following Table 1.

Table 1.
Ultrasonic testing parameters for each sub-specimen.
The layered focusing of the ultrasonic probe is conducive to achieve the high-precision inspection inside the material. The layered focusing process is shown in Figure 3. Based on the principle of ultrasonic longitudinal wave inspection, there will be a blind area in the ultrasonic inspection area. Therefore, a sub-specimen is divided into eight layers after removing the 400 μm blind area when we detect the sub-specimen from side A, and the ultrasonic beam is focused in the middle of each layer in turn. The colored area in the Figure 3 is the inspection range and the positions one, three and five are the focus position of the ultrasonic probe at the second layer (600–800 μm depth), the fourth layer (1000–1200 μm depth), and the sixth layer (1400–1600 μm depth). The 1.6 mm thickness can be detected through eight layered focusing C-scans. Side B also has layered focusing inspection imaging as shown in Figure 3, so a total of 16 layers need to be detected for a sub-specimen, which means that the inspection depth reaches 3200 μm. It is noted that different colors in Figure 3 represent different focused imaging layers.
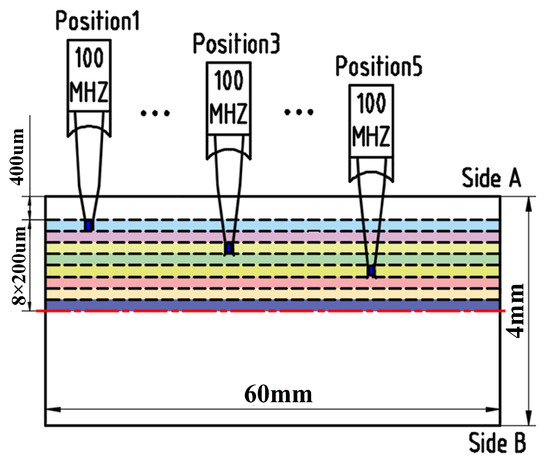
Figure 3.
Inspection diagram.
Since the pulse reflection method is used for inspection, according to Huygens’ Theorem, the ultrasonic wave will reflect and refract at the heterogeneous interface between the steel matrix and the inclusion. The greater the acoustic impedance difference between the two sides of the heterogeneous interface, the greater the sound pressure of the reflected ultrasonic wave will be. Then, the maximum value of the echo is used for C-scan imaging, so the gray value of the pixel on the obtained image is proportional to the sound pressure of the reflected sound wave. As shown in Figure 4 below, the size of the bright spot reflects the size of the inclusion, and the gray value of the bright spot is related to the type [23], size [14], and shape [24] of the inclusion.
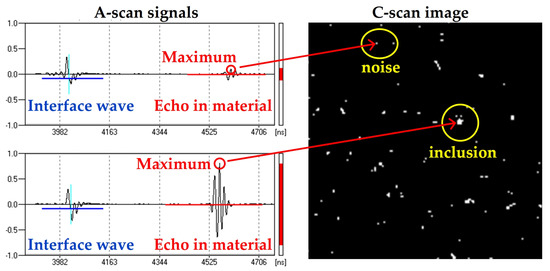
Figure 4.
Schematic diagram of imaging.
However, because the microstructure of the blanks is neither dense nor uniform, at the same time, there are coarse crystal grains and rough surface, serious scattering phenomenon of ultrasonic wave appears in the material. Generally, the echo amplitude of the noise is smaller than that of the inclusions, and the noise is more diffusely distributed. As shown in Figure 4, in this case, the information of the inclusions is submerged by the noise signal, so there are many randomly distributed Gaussian noises on the ultrasonic detection image, which interferes with the image recognition effect of the inclusions. Therefore, it is necessary to filter these images using a mathematical morphology method with good image processing capabilities.
3. Theory of Mathematical Morphology
Mathematical morphology is one of the theories of spatial structure analysis, widely used in signal processing [25], image analysis [26], fault diagnosis [27], and other fields. This section will be divided into three subsections, including the selection of structure elements, the selection of morphological operators, and the application of morphological filtering in ultrasound image processing.
3.1. Structure Element of Morphology
The shape of the structure element (SE) determines the target feature information. As shown in Figure 5 above, three different shapes of structure elements are listed, the structure element is essentially a filtering window, the target information is retained only when the structure element matches the signal feature. Therefore, the above three different shapes of structure elements are used to process the image, and the remaining image will retain the characteristics of linear, triangular, or circular. Assuming the shape of the structure elements is determined, the size of the structure elements determines the effect of feature extraction. Excessive size of the structure elements causes over filtering, ignoring the details of the target, while the small size makes it difficult to suppress the noise, and the characteristics of the target will be submerged in the noise.
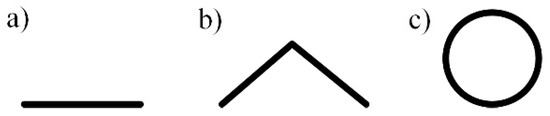
Figure 5.
Structure elements of different shapes. (a) line shape; (b) triangular shape; and (c) circular shape.
3.2. Operations of Morphology
The basic operations of morphology are corrosion and expansion operations, and the mathematical definitions of corrosion and expansion operations of two-dimensional planar images are shown in Equations (1) and (2), respectively:
where is the corrosion operation, is the expansion operation, indicates any binary image defined on the two-dimensional plane, represents any structure element defined on the two-dimensional plane, describes the pixel point where the origin of the structure element is located, and is the reflection of .
It can be found from the schematic diagram shown in Figure 6 that represents the result of corroding the image with structure element B, and the is the result of expanding the image with structure element B. In a word, the corrosion operation is to filter the interior of the image, and the expansion operation is to filter the outside of the image.
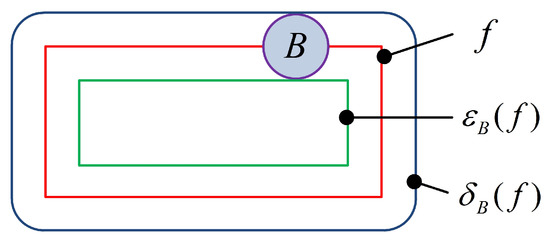
Figure 6.
Schematic diagram of corrosion and expansion operation.
Morphological operators also have open and closed operations. Based on the operation of corrosion and expansion. The open operation of morphology is defined as the operation of first corroding and then expanding the image by using the same structure elements. The closed operation is defined as the operation of first expanding and then corroding the image by using the same structure elements. The mathematical definitions are shown in Equations (3) and (4), respectively:
where γ indicates the open operation and is the closed operation.
3.3. Simulation Experiment of Morphology
The steel number of the casting blanks used in this experiment is 82B, of which silicate-based inclusions account for the majority. Different types of inclusions have different shapes, while silicate-based inclusions are mostly circular. [28] In order to analyze the influence of different structure elements and different operations combination on ultrasonic image processing, we simulated the circular inclusions and carry out the following simulation experiments. Considering that the anisotropy of crystals in the casting blanks results in the serious scattering of ultrasonic wave inside the material, there are many randomly Gaussian noises in the ultrasonic detection image. We add 15% Gaussian noise to the original Figure 7a to obtain Figure 7b, and then acquire Table 2 by using line SE (4 × 2px), triangular SE (4 × 2px), and circular SE (r: 2px) to perform open operations or closed operations on the Figure 7b.
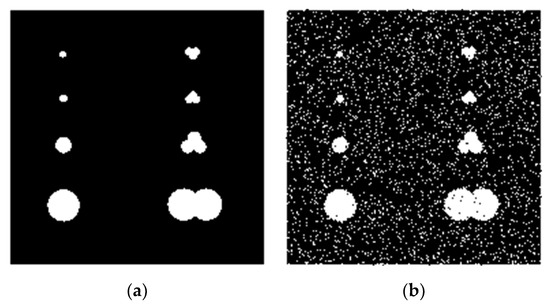
Figure 7.
Ultrasonic testing simulation images. (a) original image; (b) noised image.
Table 2.
Result of the combination of different structure element (SE) and different operations.
As can be seen from Table 2, closing operation cannot complete noise reduction at all, because closing operation fills the gap between shapes, resulting in the image pollution. However, the open operation has significant advantages in noise removal, and different structure elements have different effects on noise reduction and contour smoothing, in which the circular SE have the best effect. It can be seen from the above introduction that the shape and size of the SE should match the analyzed images. Therefore, circular SE is selected for the open operation of ultrasonic image.
3.4. Morphology Filtering of Ultrasonic Images
The morphological opening operation is performed on the ultrasonic images to get the processed images by removing noise and smoothing the target boundary. According to Table 1 the theoretical detection resolution is 30 μm, and the essence of morphological operation is set operation, so the size of the structure element should be an integer multiple of the scanning step. To ensure the highest accuracy and the best noise reduction effect, we choose 40 μm as the diameter of the circular SE, which means that inclusions with a diameter less than 40 μm will be filtered together with the noise. The results are shown in the Figure 8 below. It is noted that the size and number of bright spots in the figure reflect the size and number of inclusions, respectively.
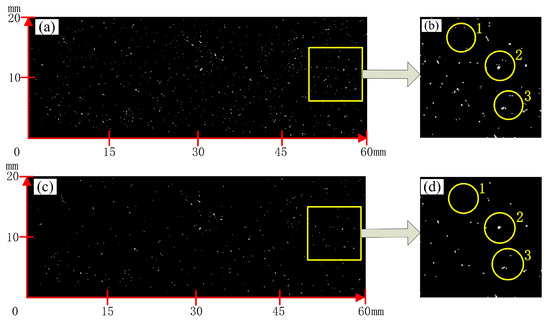
Figure 8.
Comparison images before and after morphological process. (a) original ultrasonic detection images; (b) partial enlarged view of (a); (c) ultrasonic images after morphological opening operation; and (d) partial enlarged view of (c).
Figure 8a is the original ultrasonic detection image, Figure 8b shows a partial enlarged view of Figure 8a. In Figure 8b, there are a lot of isolated noise points in circle one, while in circle two, we can see many big bright spots which are disturbed by noise. In circle three, the first two cases appear at the same time, which will lead to the misjudgment of the number and size of inclusions. Comparing Figure 8b,d, the results show that morphological processing can effectively remove the noise of ultrasonic testing, smooth the contour of inclusions, and make the distribution of inclusions clearer, which will be conducive to the accurate evaluation of casting blanks cleanliness.
4. Detection Results and Discussion
The ultrasonic images are processed to obtain the cleanliness data of each set of specimens. The optimal continuous casting process is determined by comparing the average cleanliness of the specimens taken from different strands and the distribution of inclusion size.
4.1. Comparison of Blanks Cleanliness from Different Strands
The number and size of inclusions were counted by analyzing the morphologically filtered ultrasound images. In the k (k = 1, 2, 3, 4) sub-specimen of the j (j = 1, 2, 3) strand, represents the number of inclusions in the i (i = 1, 2…8) layer on side A, and is the number of inclusions in the i layer on side B. The cleanliness of each sub-specimen was calculated in turn, as shown in Equation (5), the unit volume of the inclusion in the sub-specimen k of the j strand blank.
where represents the cleanliness of the k sub-specimen of the blank in the j strand. The greater the value is, the more inclusions there are and the worse the cleanliness is. Furthermore, 2 × 8 × (60 × 20 × 0.2) is the measured volume of each sub-specimen. indicates the number of inclusions in the measured volume of the sub-specimen.
By comparing the cleanliness of specimens from different strands, the merits of the process parameters corresponding to different strands can be explored. Each specimen has four sub-specimens, so the cleanliness of the 12 sub-specimens was calculated in all, as shown in Figure 9 below.
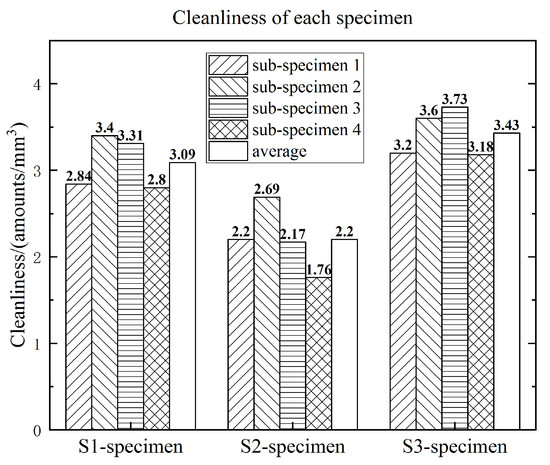
Figure 9.
Cleanliness histogram of specimen in each of strands.
It can be seen that in each sub-specimen of the three casting strands, the cleanliness of inclusions is different. The comparison of the cleanliness of the three strands shows that the cleanliness the inclusions in the second strand is the smallest, while the cleanliness of the inclusions in the third strand is the largest. So, we can draw a conclusion that the control capability of the process parameters of each strand on the cleanliness is .
4.2. Comparison of the Inclusions Size Distribution of the Specimens in Each Strand
In order to improve the quality of blanks, the size distribution of inclusions in each strand needs to be further analyzed. The data of the size distribution of the four sub-samples from the same strand are added to obtain a statistical average. Starting from the inclusion diameter of 40 μm, the distribution histograms of inclusions of different sizes in the three strand specimens shown in Figure 10 are obtained.
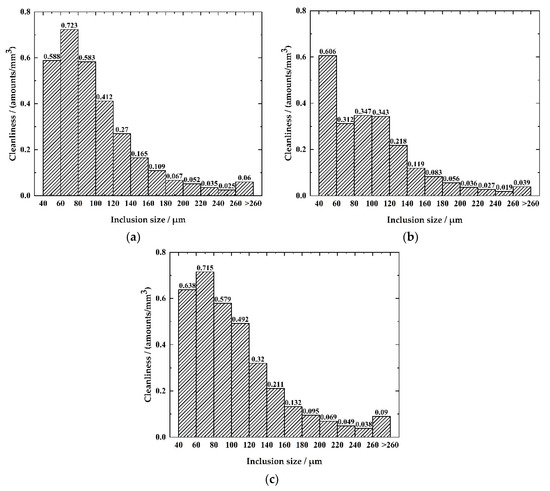
Figure 10.
Histogram of size distribution of inclusions obtained from each strand (a) statistics of inclusion size of S1 specimen; (b) statistics of inclusion size of S2 specimen; and (c) statistics of inclusion size of S3 specimen.
As can be seen from Figure 10, small-size inclusions account for the majority. With the increases of inclusion size, the number of defects gradually decreases, and is generally exponentially distributed. The results show that the cleanliness of S2 specimen in each size range is smaller than that of other strands, and the cleanliness of casting blanks is reduced nearly 60% in the range of 60–80 μm. It can be concluded that the control of process parameters of strand two is more stable, which is of benefit to reduce the number and size of inclusions.
4.3. Comparison with the Results Obtained by Metallographic Method
In order to verify and compare the distribution of inclusions obtained by ultrasonic microscopy, the metallographic experiment was used to analyze the inclusions in a certain layer of the specimen. Under the laser scanning confocal microscopy (LSCM), the inclusions corresponding to the positions on the ultrasonic images obtained by ultrasonic microscopy could be found, and the comparison figure is shown in Figure 11.
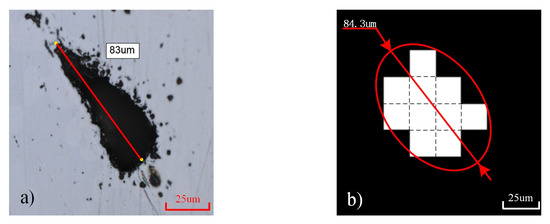
Figure 11.
Images of the same inclusions detected by different methods. (a) inclusion morphology by laser scanning confocal microscopy (LSCM); (b) inclusion image by ultrasonic microscopy after morphological filtering.
We first milled the specimen off 900 μm and used LSCM to observe the morphology of the inclusions. Figure 11a shows the morphology of the inclusion by LSCM, and the metallographic size was measured to be 83 μm. Figure 11b is an ultrasonic image of the inclusion obtained by ultrasonic microscopy after morphological filtering. The ultrasonic detection size is 84.3 μm by calculation. It can be seen that the detection results of the size of a single inclusion are in good agreement with the metallographic results.
In the traditional metallographic detection, the proportion of inclusions area is also a common evaluation method. The percentage is calculated from by dividing the area of inclusions by the area of the view fields. The larger the percentage, the worse the quality of the material. Comparing the ability of the metallographic method and the ultrasonic detection method in the identification of inclusions, 20 regions of 2.56 mm by 2.56 mm (about 130 mm2 in total) of sub-specimen-four from S3 were detected by LSCM to calculate the proportion of inclusion area. Then, the same layer (60 mm by 20 mm) detected by ultrasonic microscopy to calculate the proportion of inclusion area, the results are shown in Table 3.
Table 3.
Proportion of inclusions area by different methods.
The results show that the two methods are similar. However, compared with LSCM, ultrasonic microscope can detect a large range in a short time, which is more conducive to the overall evaluation of material quality. To further compare the characterization ability of the two methods on inclusion size, we calculated the distribution of inclusions of different sizes, as shown in Figure 12 below.
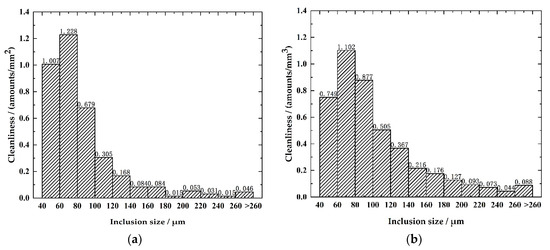
Figure 12.
Histogram of size distribution of inclusions obtained by different methods. (a) distribution of inclusions of different sizes by LSCM; (b) distribution of inclusions of different sizes by ultrasonic microscope.
As can be seen from the comparison in Figure 12, the number of inclusions of different sizes obtained by the two methods have the same trend with attenuate exponentially. In addition, the number of small-size inclusions detected by metallographic method is more than that by ultrasonic microscope, but the number of large inclusions obtained by metallographic method is less than that by ultrasonic microscope. This is because metallurgical statistics can only analyze a cross section of inclusions, which may not be the largest cross section of inclusions. Therefore, some large-size inclusions are misclassified into small-size inclusions in metallurgical statistics. However, the ultrasonic microscope can scan the three-dimensional space of the material, so it can make the inclusion statistical results more accurate.
Comparison between traditional methods and ultrasonic testing methods, from the detection area, we can easily complete the plane scanning with the size of 60 mm by 20 mm, and scan at different depths, which is much larger than the traditional metallographic area of 2.56 mm by 2.56 mm. Secondly, detection and comprehensive statistics can be carried out in depth direction, whereas traditional methods can only carry out surface layer analysis. Thirdly, in terms of time, the traditional metallographic method, it takes an average of 3 h to prepare a specimen with a size of 60 mm by 20 mm. Under the laser confocal microscope, 20 random areas with the view field of 2.56 mm by 2.56 mm are selected for statistics, which usually takes 1 to 2 h. However, using the ultrasonic microscope, a 60 mm by 20 mm single-layer scan with the scanning step of 20 μm only takes about 10 min, then perform the morphological filtering to process each image of 3000 by 1000 pixels, and its calculation time is 0.82 s with Intel® Core TM i5-7200U CPU @ 2.5GHz processor and 8G RAM in Matlab2016a. Through the above analysis, it can be seen that the blank cleanliness evaluation method based on the combination of ultrasonic microscope and morphological filtering has higher detection efficiency than the traditional method.
5. Conclusions
(1) The method for detecting inclusions in casting blanks based on ultrasonic microscopy layered focusing is proposed to overcome the problems of small field of view, and only surface can be detected by the traditional method. In addition, using mathematical morphological filtering to process the ultrasonic image can effectively avoid the influence of background noise and obtain more accurate cleanliness of specimen.
(2) The cleanliness of casting blanks from different strands are evaluated by the proposed method, respectively. The experimental results show that the best cleanliness is S2 strand, in which the cleanliness is 2.20/mm3. The new method has the advantages of three-dimensional detection inside the material and high detection efficiency, which is expected to be popularized as a new technology of casting blanks quality evaluation.
Author Contributions
Conceptualization, Q.Q., X.L. and M.L.; Data curation, H.D. and Q.Q.; Formal analysis, H.D.; Investigation, H.D.; Methodology, H.D., Q.Q., X.L. and Z.W.; Project administration, X.L. and M.L.; Resources, M.L.; Software, H.D.; Supervision, M.L.; Validation, Z.W.; Writing—original draft, H.D. and Q.Q.; Writing—review & editing, H.D. and M.L. All authors have read and agreed to the published version of the manuscript.
Funding
This work was funded by Fundamental Research Funds for the Central Universities, grant number 2302018FRF-GF-18-002A.
Conflicts of Interest
The authors declare no conflict of interest.
References
- Guan, J.; Wang, L.; Zhang, C.; Ma, X. Effects of non-metallic inclusions on the crack propagation in bearing steel. Tribol. Int. 2017, 106, 123–131. [Google Scholar] [CrossRef]
- Atkinson, H.V.; Shi, G. Characterization of inclusions in clean steels: A review including the statistics of extremes methods. Prog. Mater. Sci. 2003, 48, 457–520. [Google Scholar] [CrossRef]
- Janis, D.; Karasev, A.; Jönsson, P.G. Evaluation of inclusion characteristics in low-alloyed steels by mainly using PDA/OES method. ISIJ Int. 2015, 55, 2173–2181. [Google Scholar] [CrossRef]
- Bengtson, A.; Sedlakova, M.; Didriksson, R. Rapid inclusion characterisation by pulse distribution analysis optical emission spectroscopy-recent development. Yejin Fenxi Metall. Anal. 2013, 33 (Suppl. S1), 7–12. [Google Scholar]
- Newman, J.; Hammond, J.; Davis, B.; Suo, Z.; Beech, I.; Paul, D.; Avci, R. Auger electron spectroscopy analysis of pit initiation at MnS nano-inclusions in carbon steel. Microsc. Microanal. 2017, 23 (Suppl. S1), 2258–2259. [Google Scholar] [CrossRef]
- Zhang, X.; Zhang, L.; Yang, W. Characterization of MnS particles in heavy rail steels using different methods. Steel Res. Int. 2017, 88, 1600080. [Google Scholar] [CrossRef]
- Brandaleze, E.; Hereñú, S.; Tormo, J. Characterisation of inclusions in resulphurised microalloyed steel. Ironmak. Steelmak 2013, 40, 216–220. [Google Scholar] [CrossRef]
- Ren, Y.; Wang, Y.; Li, S. Detection of non-metallic inclusions in steel continuous casting billets. Metall. Mater. Trans. B 2014, 45, 1291–1303. [Google Scholar] [CrossRef]
- Lahiri, B.B.; Bagavathiappan, S.; Sebastian, L.T. Effect of non-magnetic inclusions in magnetic specimens on defect detection sensitivity using active infrared thermography. Infrared Phys. Technol. 2015, 68, 52–60. [Google Scholar] [CrossRef]
- Nakai, Y.; Shiozawa, D.; Kikuchi, S.; Obama, T.; Saito, H.; Makino, T.; Neishi, Y. Effects of inclusion size and orientation on rolling contact fatigue crack initiation observed by laminography using ultra-bright synchrotron radiation. Procedia Struct. Integr. 2016, 2, 3117–3124. [Google Scholar] [CrossRef][Green Version]
- Čapek, J.; Knapek, M.; Minárik, P. Characterization of deformation mechanisms in Mg alloys by advanced acoustic emission methods. Metals 2018, 8, 644. [Google Scholar] [CrossRef]
- Felice, M.V.; Fan, Z. Sizing of flaws using ultrasonic bulk wave testing: A review. Ultrasonics 2018, 88, 26–42. [Google Scholar] [CrossRef]
- Taheri, H.; Kilpatrick, M.; Norvalls, M. Investigation of nondestructive testing methods for friction stir welding. Metals 2019, 9, 624. [Google Scholar] [CrossRef]
- Zhou, P.; Qian, Q.; Li, M. Characterizing non-metallic inclusions in steel by ultrasonic spectrum. Acta Acust. United Acust. 2018, 104, 39–47. [Google Scholar] [CrossRef]
- Midroit, F.; Merchi, F.; Meheux-Millot, M. Non-metallic inclusion density in bearing steel characterized by ultrasonic testing. ASTM Int. 2015, 1, 116–125. [Google Scholar]
- Liu, H.; Zhang, L.; Liu, H.F. High-frequency ultrasonic methods for determining corrosion layer thickness of hollow metallic components. Ultrasonics 2018, 89, 166–172. [Google Scholar] [CrossRef]
- Nishimura, N.; Fujimoto, K.; Ogi, Y.; Ito, T. Evolution of spall-damage in iron caused by repeated plate impacts: Ultrasonic evaluation. Ultrasonics 2018, 83, 88–93. [Google Scholar] [CrossRef]
- Tiwari, K.A.; Raisutis, R. Post-processing of ultrasonic signals for the analysis of defects in wind turbine blade using guided waves. J. Strain Anal. Eng. Des. 2018, 53, 546–555. [Google Scholar] [CrossRef]
- Sharma, G.K.; Kumar, A.; Jayakumar, T. Ensemble Empirical Mode Decomposition based methodology for ultrasonic testing of coarse grain austenitic stainless steels. Ultrasonics 2015, 57, 167–178. [Google Scholar] [CrossRef]
- Chong, S.Y.; Lee, J.R.; Park, C.Y. Statistical threshold determination method through noise map generation for two dimensional amplitude and time-of-flight mapping of guided waves. J. Sound Vib. 2013, 332, 1252–1264. [Google Scholar] [CrossRef]
- Wu, B.; Huang, Y.; Krishnaswamy, S. A Bayesian approach for sparse flaw detection from noisy signals for ultrasonic NDT. NDT E Int. 2017, 85, 76–85. [Google Scholar] [CrossRef]
- Iyer, S.; Sinha, S.; Pedrick, M.K.; Tittmann, B.R. Evaluation of ultrasonic inspection and imaging systems for concrete pipes. Autom. Constr. 2012, 22, 149–164. [Google Scholar] [CrossRef]
- Li, X.P.; Choi, J.; Kwon, O.D.; Yim, C. Investigation of inclusion detection by acoustic microscope. Met. Mater. Int. 1999, 5, 241–249. [Google Scholar] [CrossRef]
- Jacobi, H.F. The MIDAS technique for detection of macroscopic inclusions in CC-material: Fundamentals and practical applications. Steel Res. Int. 2005, 76, 595–602. [Google Scholar] [CrossRef]
- Namdari, F.; Salehi, M. High-speed protection scheme based on initial current traveling wave for transmission lines employing mathematical morphology. IEEE Trans. Power Deliv. 2016, 32, 246–253. [Google Scholar] [CrossRef]
- Bibiloni, P.; González-Hidalgo, M.; Massanet, S. General-purpose curvilinear object detection with fuzzy mathematical morphology. Appl. Soft. Comput. 2017, 60, 655. [Google Scholar] [CrossRef]
- Hu, Z.; Wang, C.; Zhu, J. Bearing fault diagnosis based on an improved morphological filter. Measurement 2016, 80, 163–178. [Google Scholar] [CrossRef]
- Li, X.; Li, B.; Liu, Z. Detection and numerical simulation of non-metallic inclusions in continuous casting slab. Steel Res. Int. 2019, 90, 1800423. [Google Scholar] [CrossRef]


© 2020 by the authors. Licensee MDPI, Basel, Switzerland. This article is an open access article distributed under the terms and conditions of the Creative Commons Attribution (CC BY) license (http://creativecommons.org/licenses/by/4.0/).