Article

Research on Fatigue Crack Propagation of 304 Austenitic Stainless Steel Based on XFEM and CZM

1
College of Mechanical and Electronic Engineering, Shandong University of Science and Technology, Qingdao 266590, China
2
Qingdao CCS Electric Corporation, Qingdao 266400, China
3
Shandong Better Machine Co. Ltd., Linyi 276614, China
4
College of New Energy, China University of Petroleum (East China), Qingdao 266580, China
*
Author to whom correspondence should be addressed.
Metals 2020, 10(6), 727; https://doi.org/10.3390/met10060727
Submission received: 10 May 2020 / Revised: 20 May 2020 / Accepted: 25 May 2020 / Published: 1 June 2020

Abstract

:
The fatigue crack propagation of 304 austenitic stainless steel was studied both by experiments and numerical simulations. Two methods were applied to simulate the crack propagation: the extended finite element method (XFEM) and the cohesive zone model (CZM). Based on the XFEM, the direct cyclic solver was used to simulate the fatigue crack propagation. Based on the CZM, the VUMAT subroutine was used to describe the crack tip constitutive equation during fatigue crack propagation, and the mechanical properties of the crack tip were simulated. The effects of different frequency, f, and stress ratio, R, on the fatigue crack growth life were studied by XFEM and CZM separately and compared with the experimental results. Results show that the crack propagation path simulated by the XFEM agrees well with the experimental result, but the deviation of the fatigue life between the simulated results and the experimental results is large. The CZM model can predict the crack propagation life very well in comparison with the experimental data, but it has certain limitations because the crack propagation path is preset.

1. Introduction

The pressure equipment will crack under cyclic loadings, even when the loadings are lower than the yield strengths of the materials. Once a small crack occurs, the stress at the cracking position will increase significantly, directly reducing the service life of the equipment. Therefore, simulating the stress state of the crack tip, predicting the crack extension and expansion speed, and predicting the remaining life under the premise of crack have strong research significance and social value. The theoretical models applied in solving the crack fracture problem are mainly divided into two types: based on fracture mechanics and damage mechanics, respectively. At present, there are two main methods for simulating crack propagation: cohesive zone method (CZM) and extended finite element method (XFEM).
The theoretical idea of the XFEM was first proposed by the research group led by Professor Belytschko [1] in 1999. In 2000, the method was officially named by Daus et al. [2], and the method has since been widely applied to various fields, such as rock cracking, pavement asphalt cracking, and thermoelastic fracture. Sukumar et al. [3] gave a detailed process for the expansion of finite element programming. Bordas et al. [4] gave an XFEM object-oriented programming framework and gave two-dimensional linear elastic fracture mechanics problems and crack propagation analysis and application examples of complex three-dimensional industrial problems, indicating the feasibility of the design framework. Wyart et al. [5] gave a method for implementing the XFEM on a general finite element method. Giner et al. [6] gave the detailed process of the XFEM subroutine for solving the two-dimensional fracture problem and the corresponding program code through the user subroutine UEL in the ABAQUS software, so that some of the ABAQUS solving functions, such as nonlinear contact analysis, can be fully utilized. Subsequently, Shi et al. [7] implemented a three-dimensional fatigue crack propagation analysis in the ABAQUS Version 6.9 which the manufacturer was Dassault SIMULIA of France through the user subroutine UEL (User element library). Long Cheng et al. [8] established a numerical model to simulate hydraulic fracture interaction with natural cave, using the XFEM (Extended finite element method). Ranjan Mishra et al. [9] predicted fatigue-cracking behavior of piezo-electric structures in the existence of multiple geometrical discontinuities under cyclic thermal–electrical–mechanical loads, using XFEM. Based on XFEM, Nur Azam Abdullah et al. [10] presented a novel approach in assessing the structural integrity of cracked composite plates under the aeroelastic condition by using XFEM. This was the first time that aeroelastic condition is coupled in XFEM to model the crack propagations. Ahmed Y. Elruby et al. [11] developed and implemented the proposed damage initiation model in a user-defined subroutine in the finite element code Abaqus, using XFEM. Numerical results were verified with uniaxial and three-point bending tests.
The CZM model was first proposed by Leonov and Panasuk [12]. Dugdale [13] and Barenblatt [14] were used to describe the fracture process at the crack tip. They believed that crack propagation was a gradual evolutionary process in which cracking displacement occurs at the crack tip, which was again constrained by traction. The CZM is described as the relationship between the Traction and the Separation, that is, the TS curve. J.L Bouvard and J.L. Chaboche et al. [15] used CZM to simulate the fatigue and creep fatigue expansion process of single crystal superalloys and studied the crack propagation process under overload conditions and complex specimen geometry based on pure type I crack propagation. Mohamad Ghodrati et al. [16] used a crystal plasticity-based micromechanical framework for simulation of stress–strain behavior inside the grains, and cohesive elements with traction–separation law for modeling the intergranular fatigue damages. Morvarid K. Ghovanlou et al. [17] studied the fatigue crack growth of low carbon steel brazed joints and embedded the constitutive equations of damage evolution into CZM, using Python language. Yanbing Feng et al. [18] developed a CZM-based MPFEM to simulate the compaction densification process of Al and NaCl laminar composite powders. Andrés et al. [19] used the former model for three-dimensional CZM and proposed a new irreversible CZM, which can accurately and effectively track the position of the three-dimensional fatigue crack tip and calculate the fatigue life curve. Roe and Siegmund [20] were the first to apply damage mechanisms to CZM and propose damage evolution models. Saeid Enayatpour et al. [21] simulated the initiation and propagation of thermally induced fractures in tight formations, using the CZM, and demonstrated that CZM delivers results for the challenging fracture propagation problem of similar accuracy to the XFEM while reducing complexity and computational effort.
Both the CZM and the XFEM have been widely applied, and they have their own advantages and disadvantages in the simulation of crack propagation. One of the most important advantages of XFEM is that XFEM conveniently simulates any path of a crack, and a crack is able to grow based on the loading conditions, without needing to follow element boundaries [22]. The disadvantage of XFEM is that, compared with CZM, the ability to predict crack fatigue life is slightly worse. The main shortcoming of CZM is that the crack path should be determined prior to propagation, but CZM methods showed more accurate results compared to other methods [23]. The advantage of CZM is that the existence of cohesion tends to keep the crack tip closed, which reduces or even eliminates the stress singularity to some extent. In addition, CZM does not require crack initiation and expansion criteria, and it has strong adaptability, which can solve many non-linear and large deformation problems. However, the comparisons of these two methods have not been studied so far. In this study, both the XFEM and the CZM were used to simulate the fatigue crack propagation of the compact tensilespecimens, respectively. The crack propagation path, stress state, and fatigue life simulated with the two models were obtained and compared with the fatigue experimental results. Then the advantages and disadvantages of these two methods in the fatigue crack growth simulations were analyzed.

2. Experimental Conditions and Results

2.1. Preparation for Fatigue Tensile Test

The fatigue tensile tests were carried out with the MTS Landmark 370.10 hydraulic servo fatigue testing machine, which the manufacturer was MTS System Corporation of Minnesota, USA, as shown in Figure 1a. Since the clamp of the MTS tensile testing machine cannot clamp the CT specimen directly, two pins are assembled through the CT specimen and the fixtures. Then they are clamped between the MTS fatigue tensile tester wedge block clamps, as shown in Figure 1b. The axial crack opening length was measured by the MTS tester displacement sensor, and the lateral spread length of the crack was measured by the constant current source.
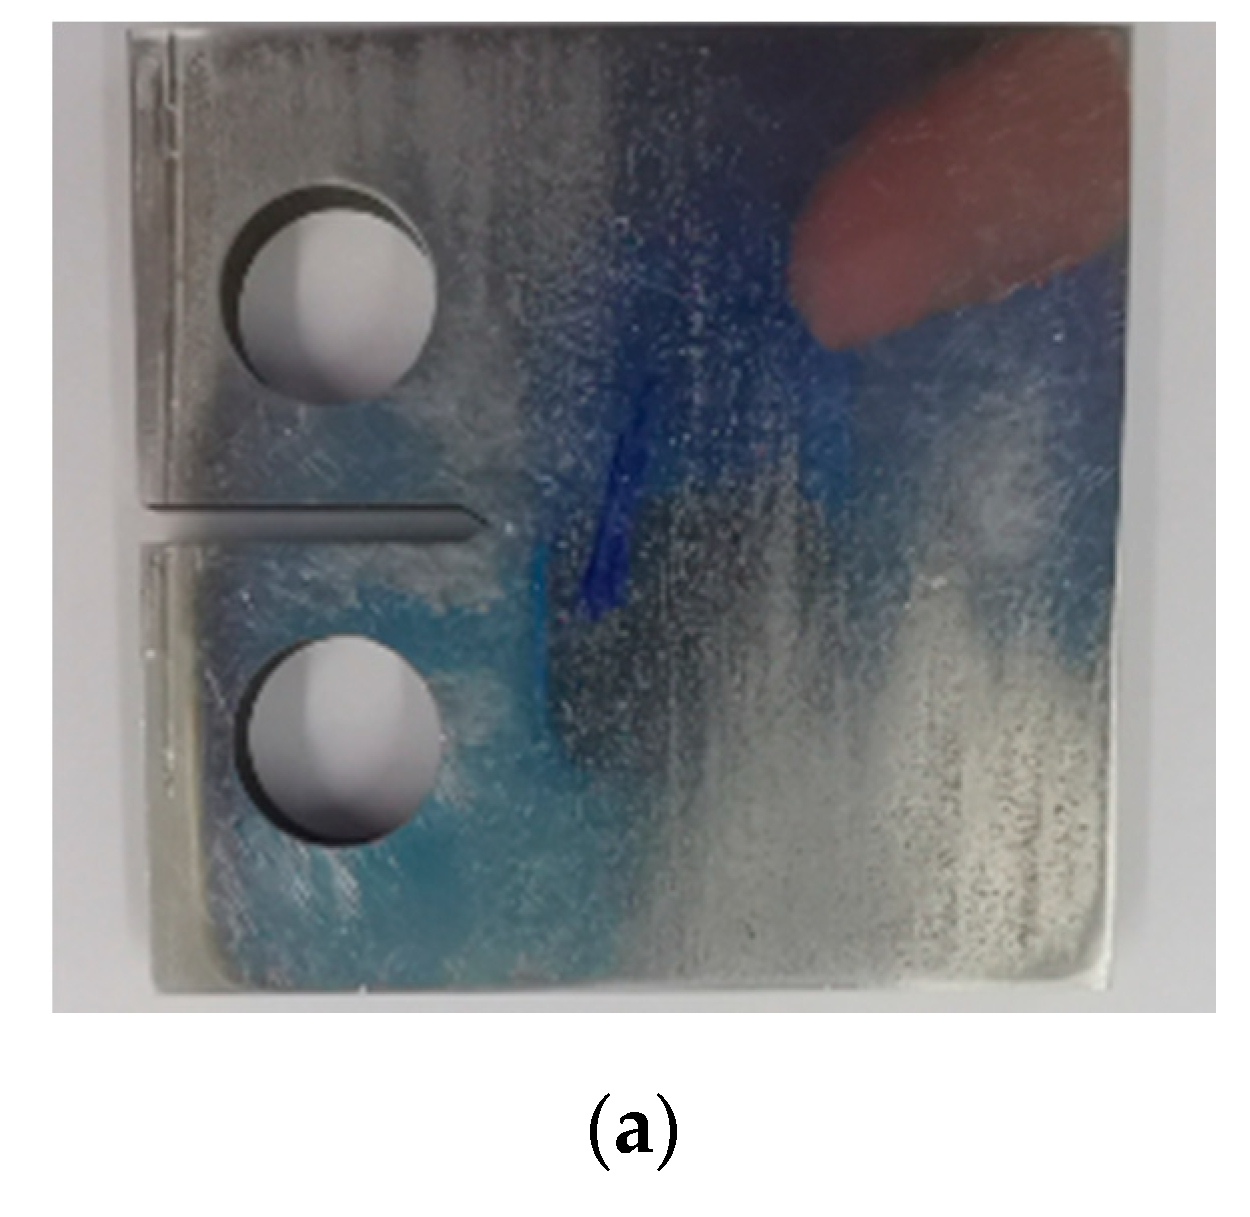
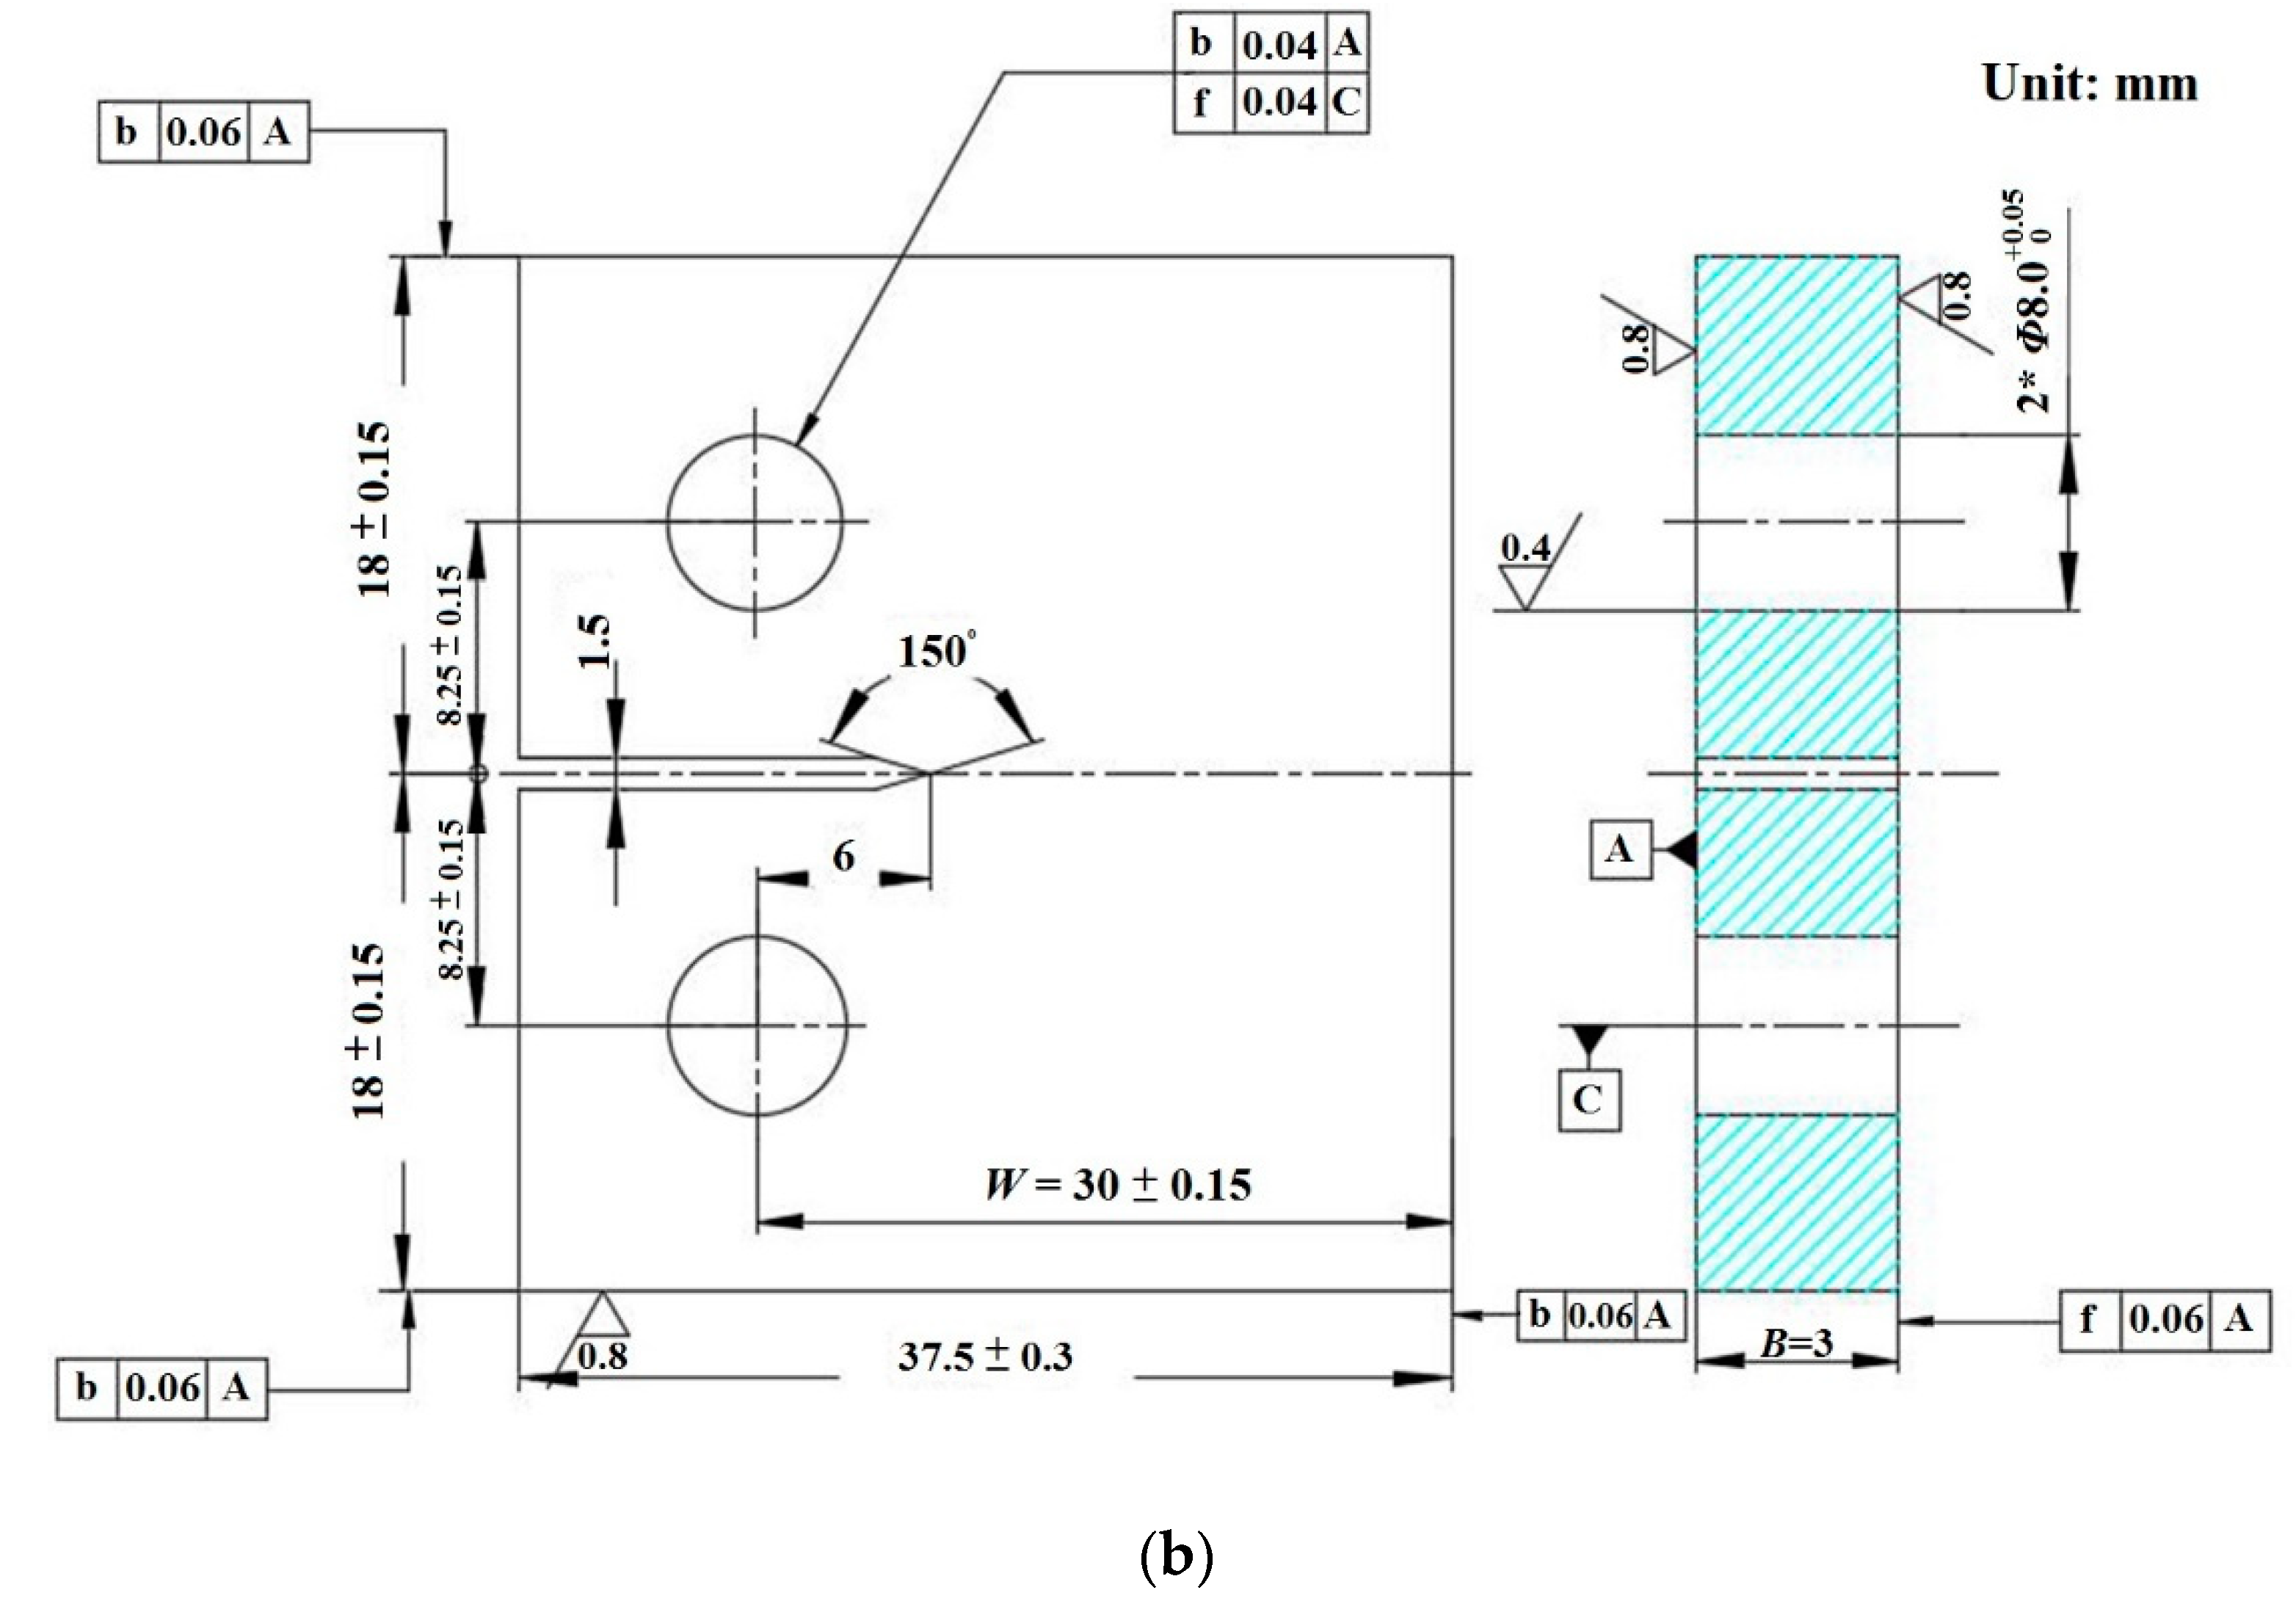
The sizes of the CT specimen are set according to GB/T 6398-2000, as shown in Figure 2. The upper and lower holes of the CT specimen have a diameter of 8 mm, W = 30 mm, and B = 3 mm. The dimension W is measured from the center of the force line, which connects the centers of the upper and lower force holes. The other dimensions are determined on the basis of W, according to the size specification of the proportional sample. The CT specimen was machined by a wire-cutting method. The tensile strength of 304 austenitic stainless steel is 590 Mpa, the yield strength is 227 Mpa, and the fracture toughness is 496.6 Mpa·m1/2.
This fatigue tensile test set up two sets of control groups, as listed in Table 1. The variable of the first group is the loading frequency, f, and 5, 2, and 1 Hz are selected as the control under the same force range of 0.5–4.5 KN. The second group takes the stress ratio, R, which denotes the minimum value of the force interval divided by the maximum as the variable, and takes 0.11, 0.22, and 0.44 at the same loading frequency of 5 Hz, and the corresponding force value interval is 0.5–4.5, 1.0–4.5, and 2.0–4.5 KN.

2.2. Experimental Results

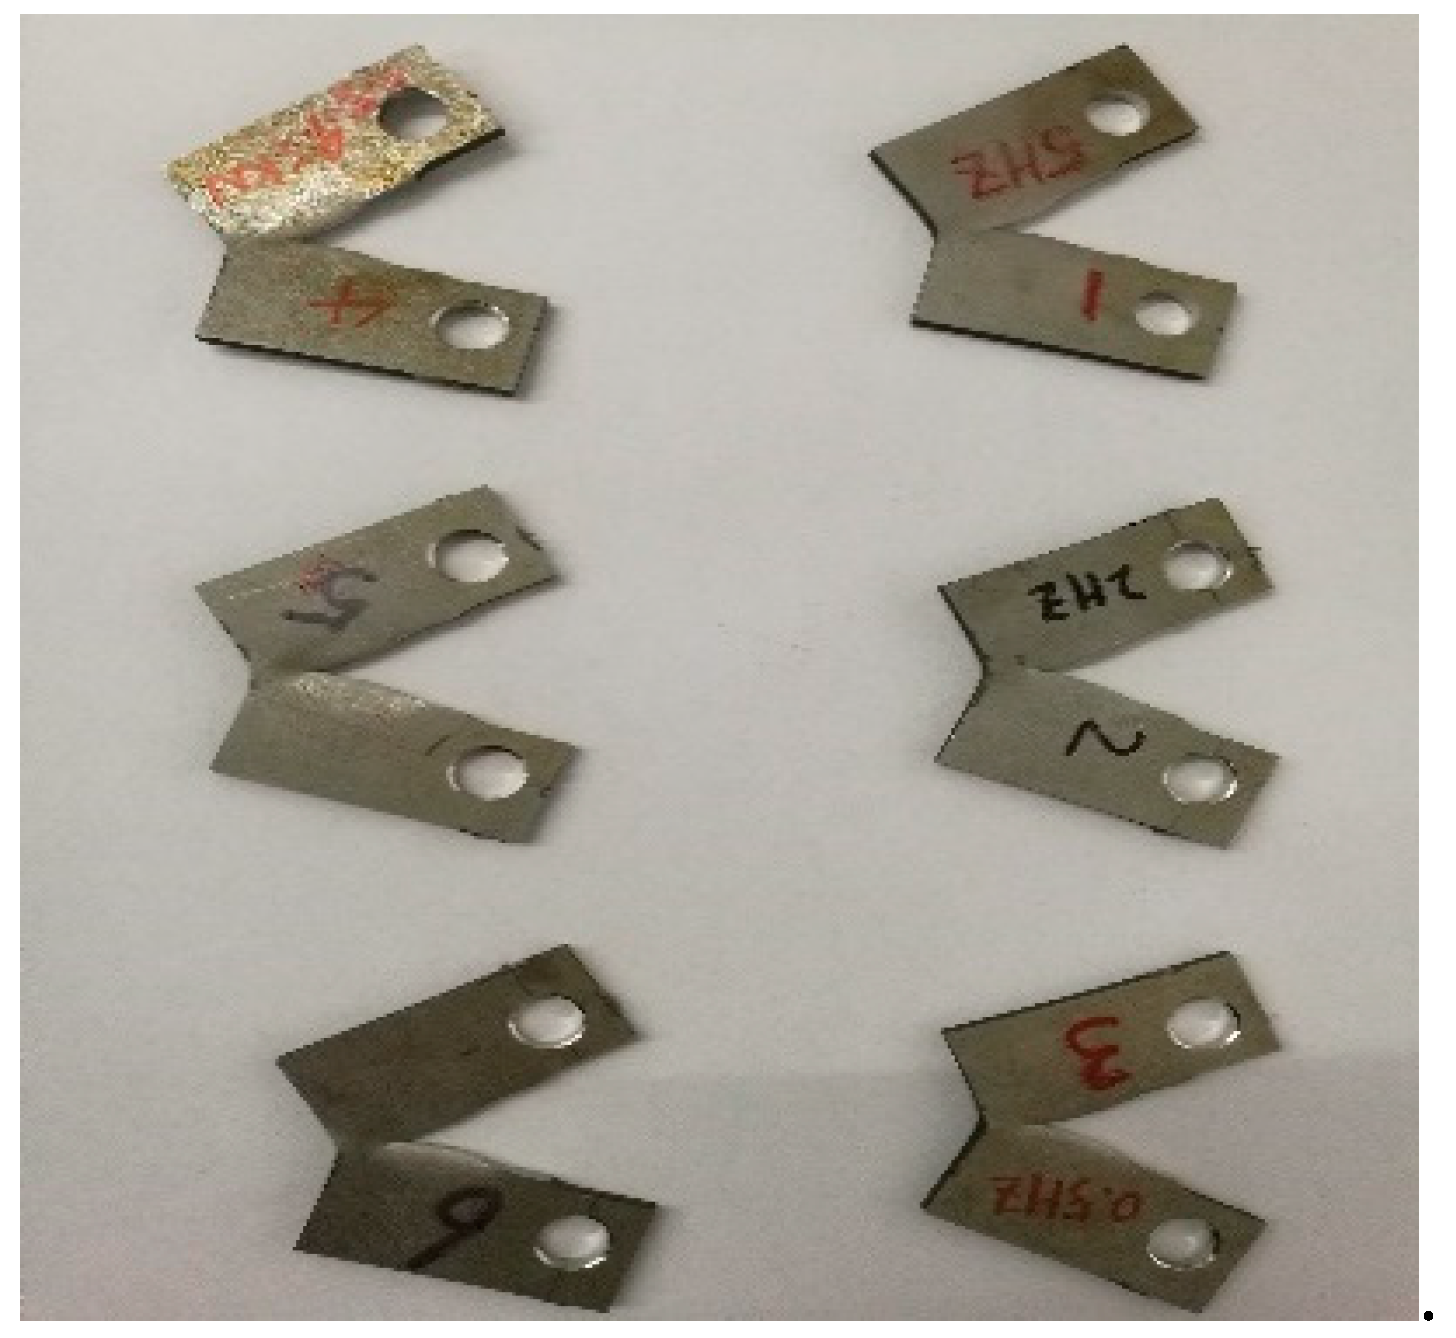
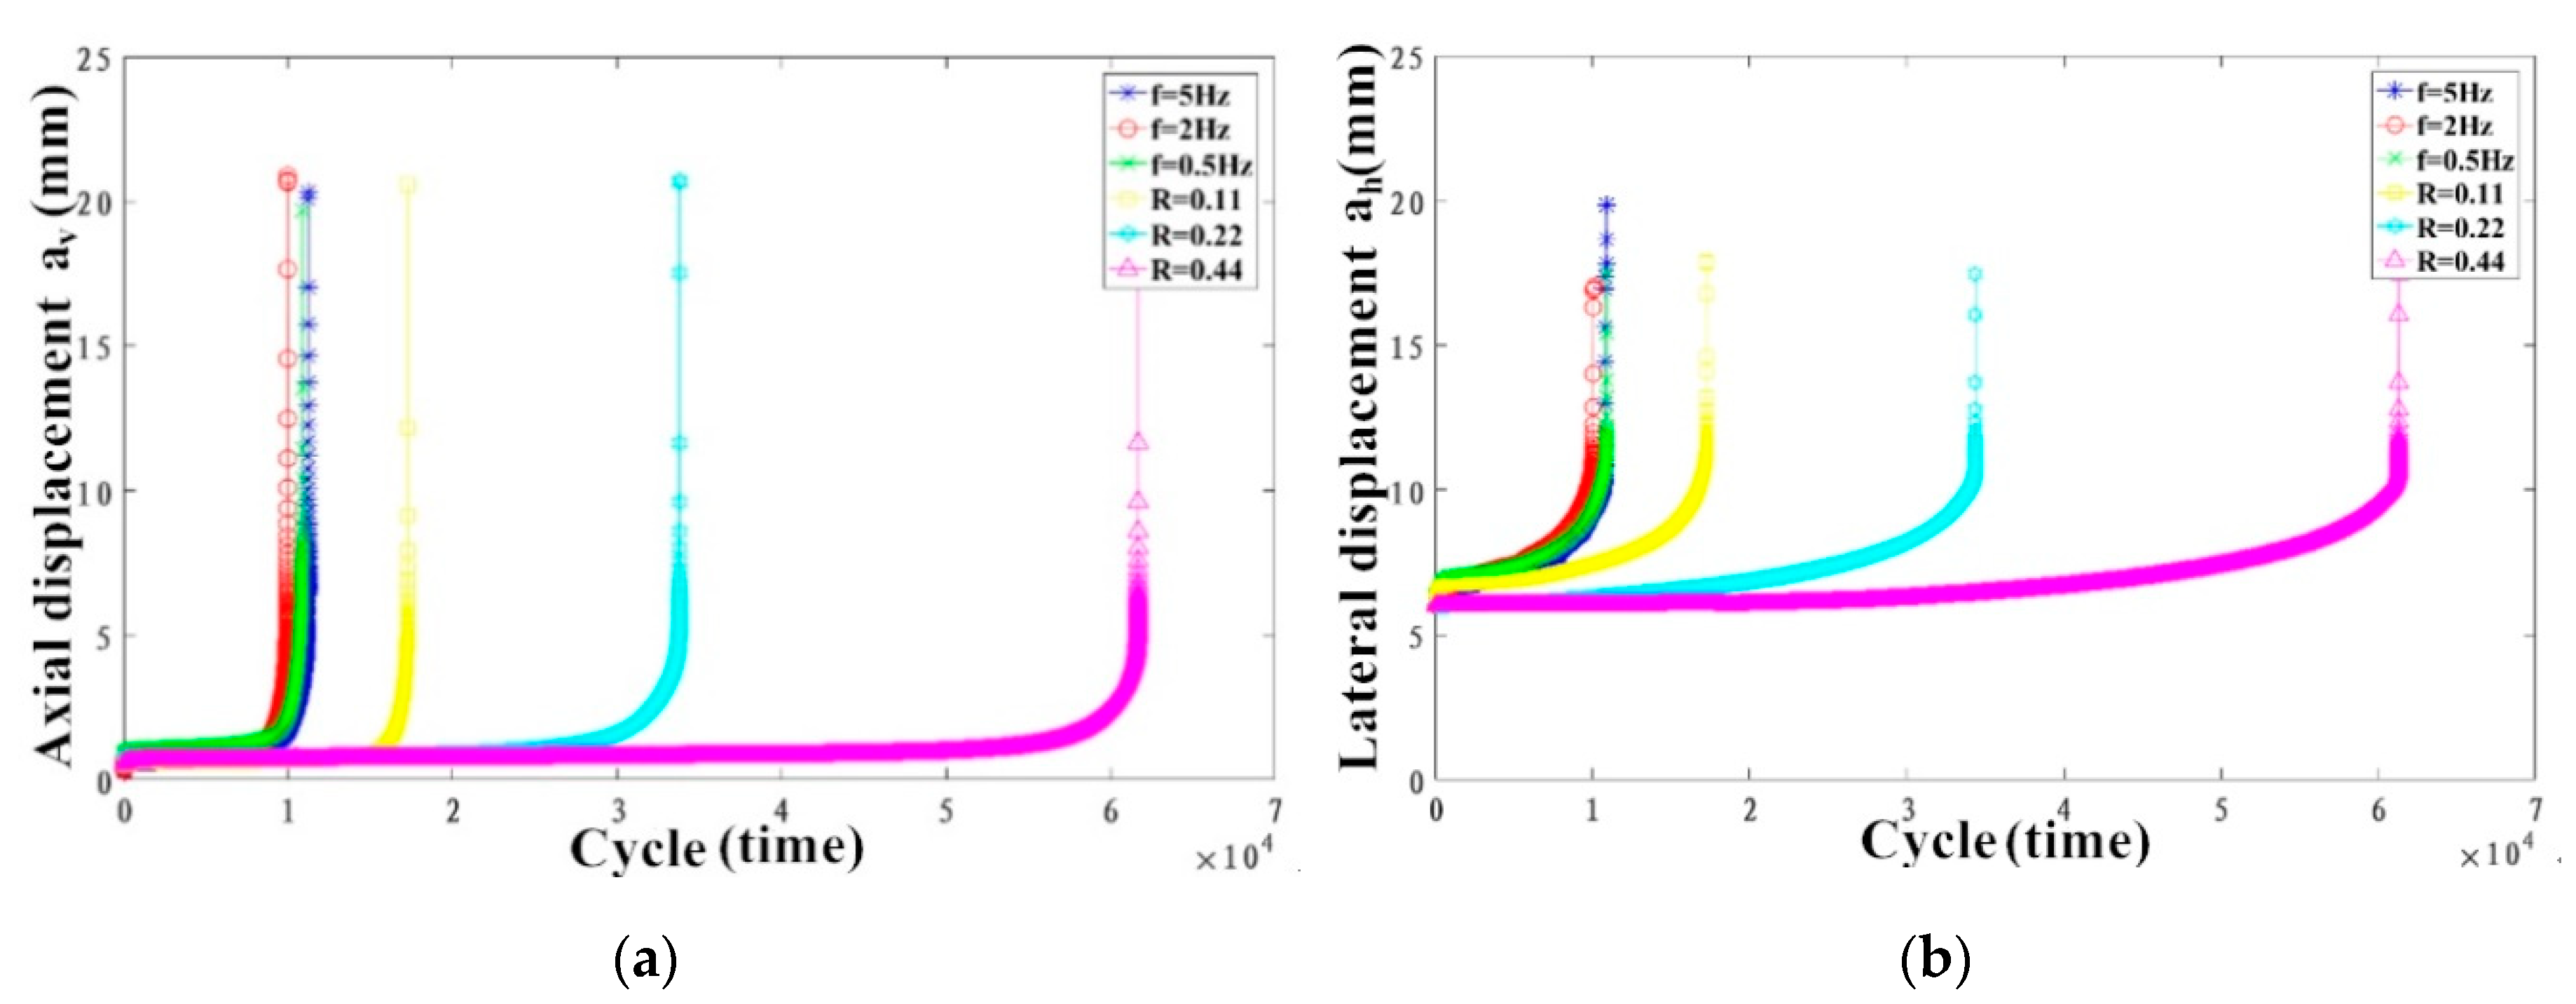
The CT specimens after the fatigue tensile testing are shown in Figure 3. Figure 3 shows that the CT specimen has broken completely. The effects of the f and the R on the axial and lateral crack propagations were obtained, as shown in Figure 4a,b, respectively. The av represents the crack length in the axial direction, and the ah represents the crack length in the lateral direction. It can be seen that the cracks propagate for a period of time and then break suddenly. Moreover, the a-N curve measured at three different frequencies has a high degree of coincidence both in the axial direction and the lateral direction.
The axial fatigue life and the lateral fatigue life were obtained from the MTS tester. The fatigue life of the two control groups was also collated, as shown in Table 2. The data in Table 2 show that the difference between fatigue life of CT specimens measured at different frequencies is small, revealing that the frequency, f, has little effect on the fatigue life in this experiment, and we do not discuss it later. It can be drawn from Figure 4 and Table 2 that the smaller the stress ratio, R, is, the faster the crack propagates steadily, and the smaller the fatigue life, N, is. This is because the reduction of the stress ratio leads to a reduction in the crack closure stress level, which in turn leads to a reduction in the crack closure effect [24]. The crack closure effect hinders the crack propagation, so the reduction of the crack closure effect results in an increase in the crack propagation rate. The cracks in this paper are open-type cracks and belong to mode Ⅰ crack. When the external force reaches a certain level, the crack suddenly expands and ruptures, that is, it reaches a critical state. This is KI = KIC. When the stress intensity factor is greater than the fracture toughness of the crack, the crack propagates, and when the stress intensity factor is less than the fracture toughness, the crack stops cracking. The value of KIC in this article is 496.6 Mpa·m1/2.

3. Simulation of Fatigue Crack Propagation Based on XFEM

3.1. Theory of Extended Finite Element

The extended finite element theory consists of two major modules: the level set function and the approximate displacement function. The level set function is a method for describing the crack face and the crack tip. The approximate displacement function is a method for describing the extended length. The essence of the approximate displacement function is to add a strengthening function to the conventional finite element displacement mode to reflect the discontinuity. For different types of discontinuities, only the enhancement functions are different. The focus of this paper is on cracks. For the strong discontinuity of cracks, the expression of the displacement approximation function is as follows [25]:
u = i N s N i ( x ) u i + i N c u t N i ¯ ( x ) [ H ( x ) H ( x i ) ] a i   + i N t i p 1 N i ¯ ( x ) j [ B j ( x ) B j ( x i ) ] b i j + i N t i p 2 N i ¯ ( x ) j [ B j ¯ ( x ) B j ¯ ( x i ) ] b i j ¯
where Ns is the set of all nodes in the discrete domain, Ncut is the set of nodes whose shape support domain is completely cut by crack, Ntip1 is the set of nodes with the crack tip 1 of the shape function support domain, and Ntip2 is the set of nodes with the crack tip 2 of the shape function support domain. Ni(x) is a conventional finite element shape function, and N i ¯ ( x ) is a unit decomposition function. H(x) is a reinforcement function through the cell node, Bj(x) is the reinforcement function of the crack tip 1 element node, and B j ¯ ( x i ) is the reinforcement function of the crack tip 2 element node. ui is the displacement of all nodes in the discrete domain, ai is the enhanced unknown through the cell node, and bi is the enhanced unknown of the crack tip unit node.
The direct cycle method can be combined with damage extrapolation technology, to perform a low cycle fatigue analysis and predict the cracking of materials. The relationship between the crack growth rate and strain energy release rate in a double logarithmic coordinate system is shown in Figure 5.
When Equations (2) and (3) are satisfied and G m a x > G t h r e s h , the cracks start to propagate.
f = N C 1 Δ G C 2 1.0
1.0 f 1.0 + f t o l
where C1 and C2 are material constants and = 0.5; C2 = −0.1; N is the number of cycles; ΔG is the relative breaking energy release rate; f t o l is the tolerance; and the default value is 0.2.
The rate of the crack growth per cycle is given by the Paris law if G t h r e s h < G m a x < G p l , as shown in Equation (4).
d a d N = C 3 Δ G C 4
where C3 and C4 are material constants, and C3 = 4.88 × 10⁻⁶, and C4 = 1.15. G t h r e s h represents the threshold of strain energy release rate, and G p l represents the upper limit of strain energy release rate.
The relationship between the strain energy release rate and the stress intensity factor is as follows [26]:
G = K 2 E
From Equation (5), we get the following:
E = { E                           , P l a n e   s t r e s s E 1 μ 2               , P l a n e   s t r a i n        
The relationship between C3, C4, and the parameters C and m in the Paris formula is as follows:
C 3 = C ( E ) c 4
C 4 = m 2

3.2. Simulated Results Based on XFEM

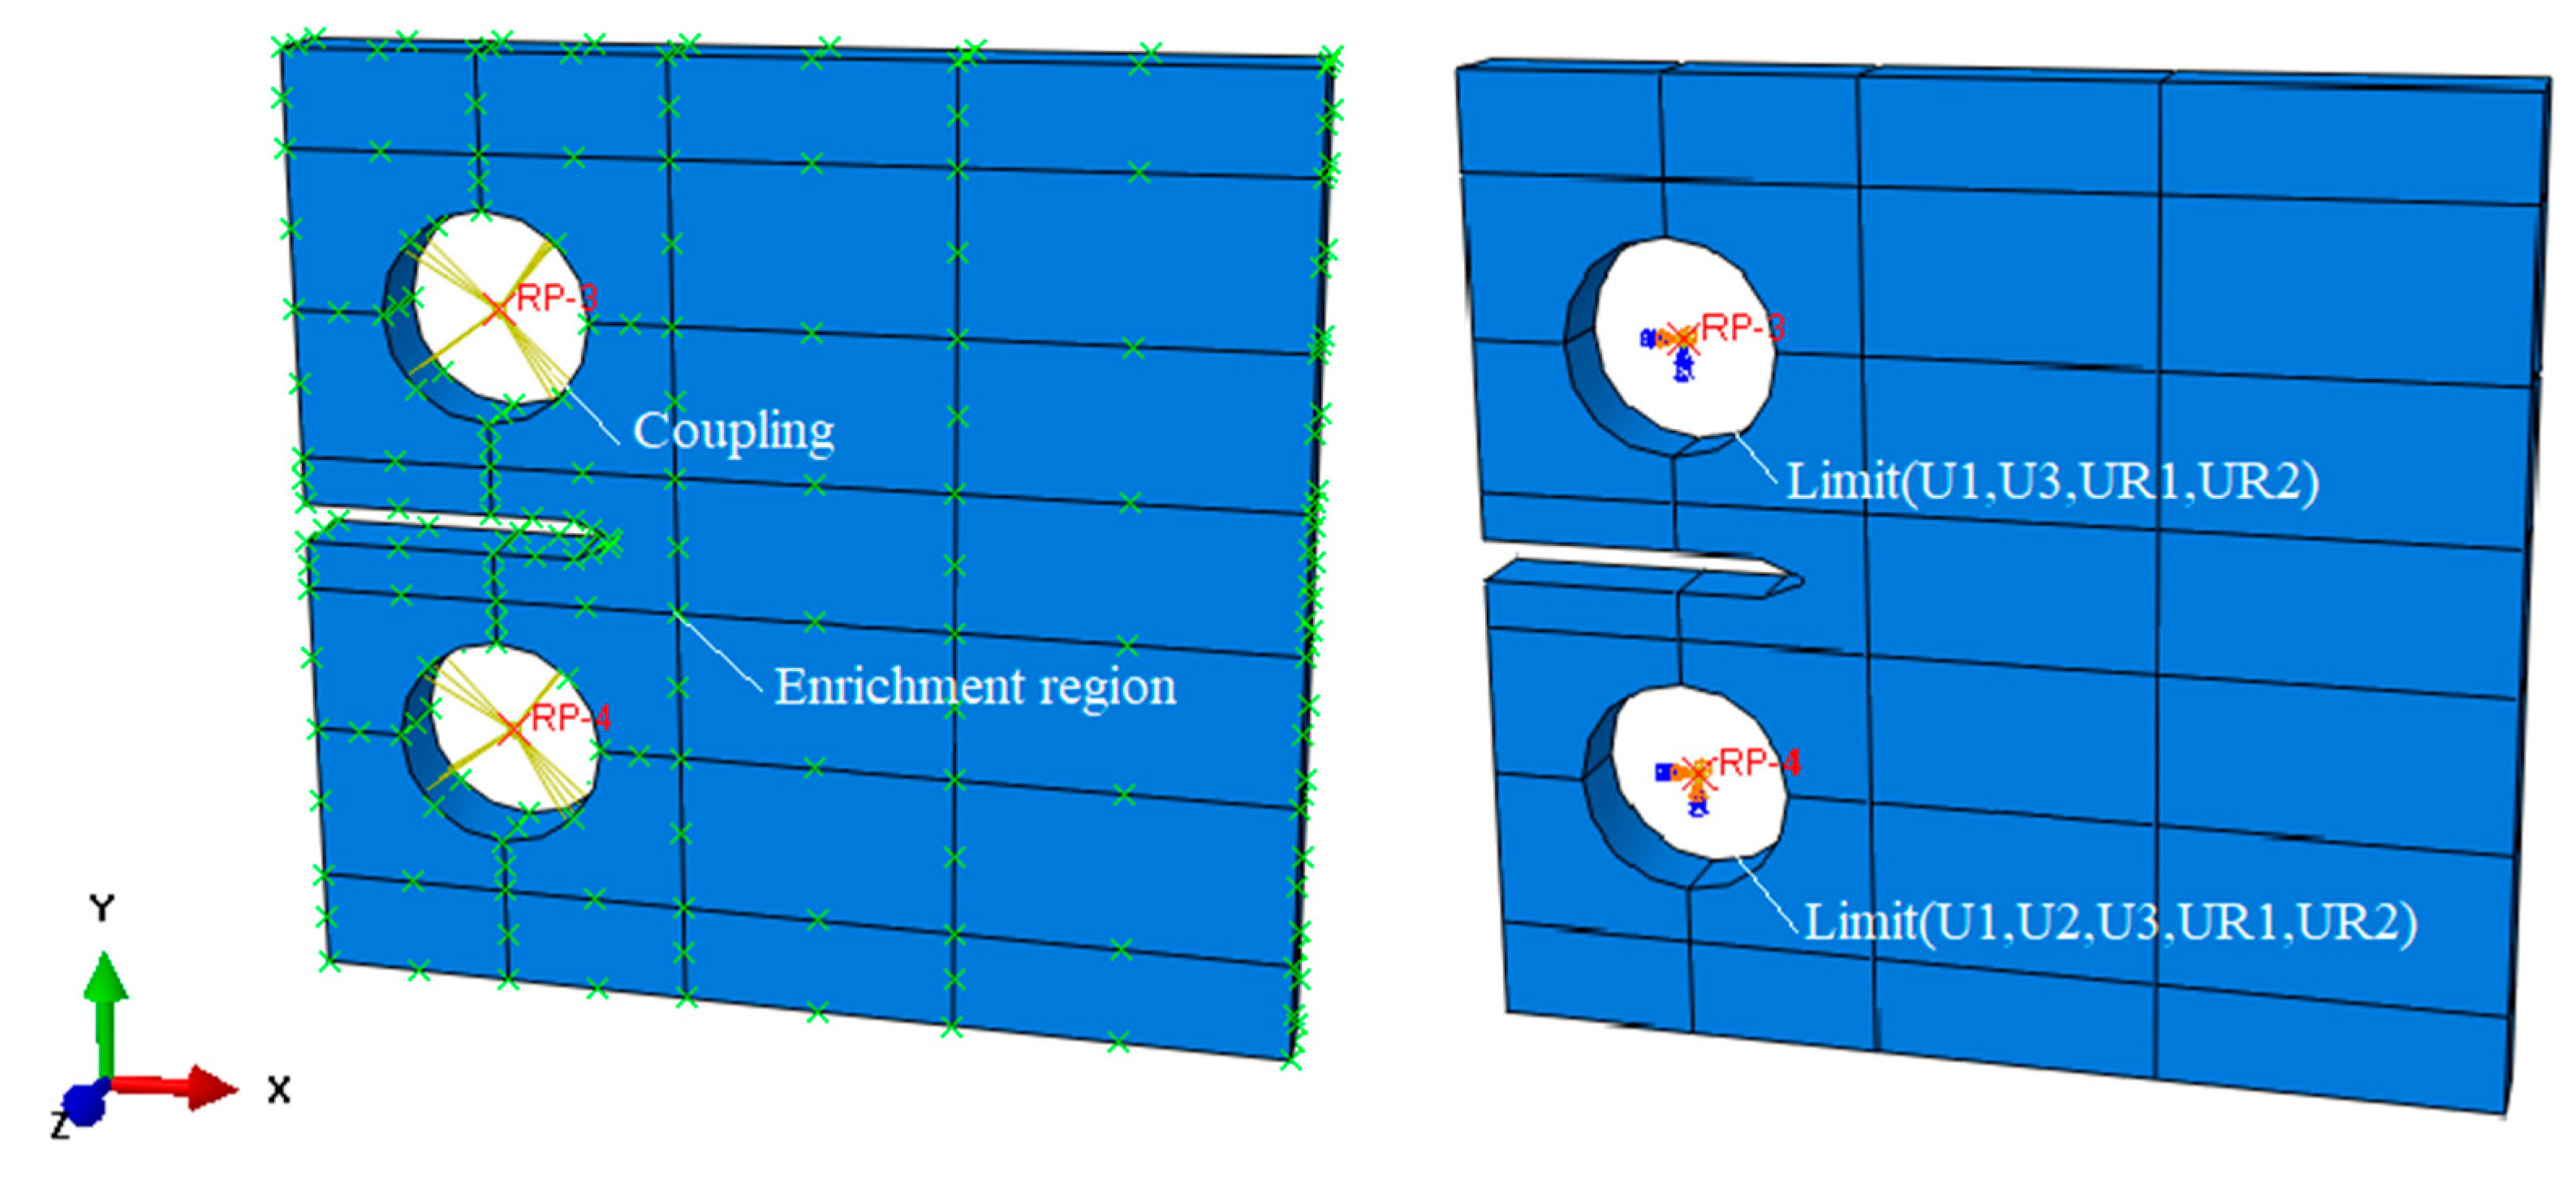
Figure 6 shows the three-dimensional finite element model, the dimensions of which are consistent with the experimental CT specimens. The upper- and lower-center reference points RP (Reference point)-1 and RP-2 are coupled with the inner surface of the circular hole, respectively, so that the subsequent boundary conditions and loadings can be directly applied to the reference points RP-1 and RP-2. For the boundary conditions, we constrained U1 (Translations along the X axe), U2, U3, UR1 (Rotations around the X axe), and UR2 of RF-1 and U1, U3, UR1, and UR2 of RP-2. U1, U2, and U3 represent translations along the X, Y, and Z axes, respectively. UR1, UR2, and UR3 represent rotations around the X, Y, and Z axes, respectively. A periodic loading along the Y direction was applied to RP-2. First, a static general analysis step was set. The role of this analysis step is to create a crack at the stress concentration. The analysis step takes 1 s. The second analysis step is a direct cycle analysis step, which is dedicated to fatigue. The value of this step is 1 s and lasts 40 cycles. The ratio of analysis step time to experimental real time is 1 to 55. The values of the applied force in two analysis steps are listed in Table 3.
Based on the XFEM, we set the crack surface and the vicinity of the crack tip as an enrichment region to achieve the requirement that the cracks can propagate in any directions. Since the CT specimen was not provided with pre-cracking, the entire model was set as the enrichment region, which is indicated by the green cross mark × in Figure 6. The maximum principal stress failure criterion was selected for damage initiation, and a mixed-mode, energy-based damage evolution law based on a power law criterion was selected for damage propagation. When the fracture criterion is met, the crack propagates in a direction perpendicular to the maximum tangential stress. The parameters of crack nucleation, initiation, and propagation are as follows: GIc = 4.22 × 10⁴ N/m, GIc = 4.22 × 10⁴ N/m, and GIc = 4.22 × 10⁴ N/m.
We performed simulations at four grid densities of 0.5, 0.6, 0.7, 0.8, 0.9, 1, 1.1, and 1.2 mm. Deviations between the fatigue life of the CT specimen and the experimental results N = 10,540 under different mesh sizes are listed in Table 4. It can be seen from Table 4 that the simulated fatigue life does not vary much with the density of the mesh. After comprehensive considerations, the mesh is divided by the seed part, and the approximate global size is 1 mm. Then we had mesh refinement on the CT specimen incision and the expansion path area and chose the grid unit type as C3D8.
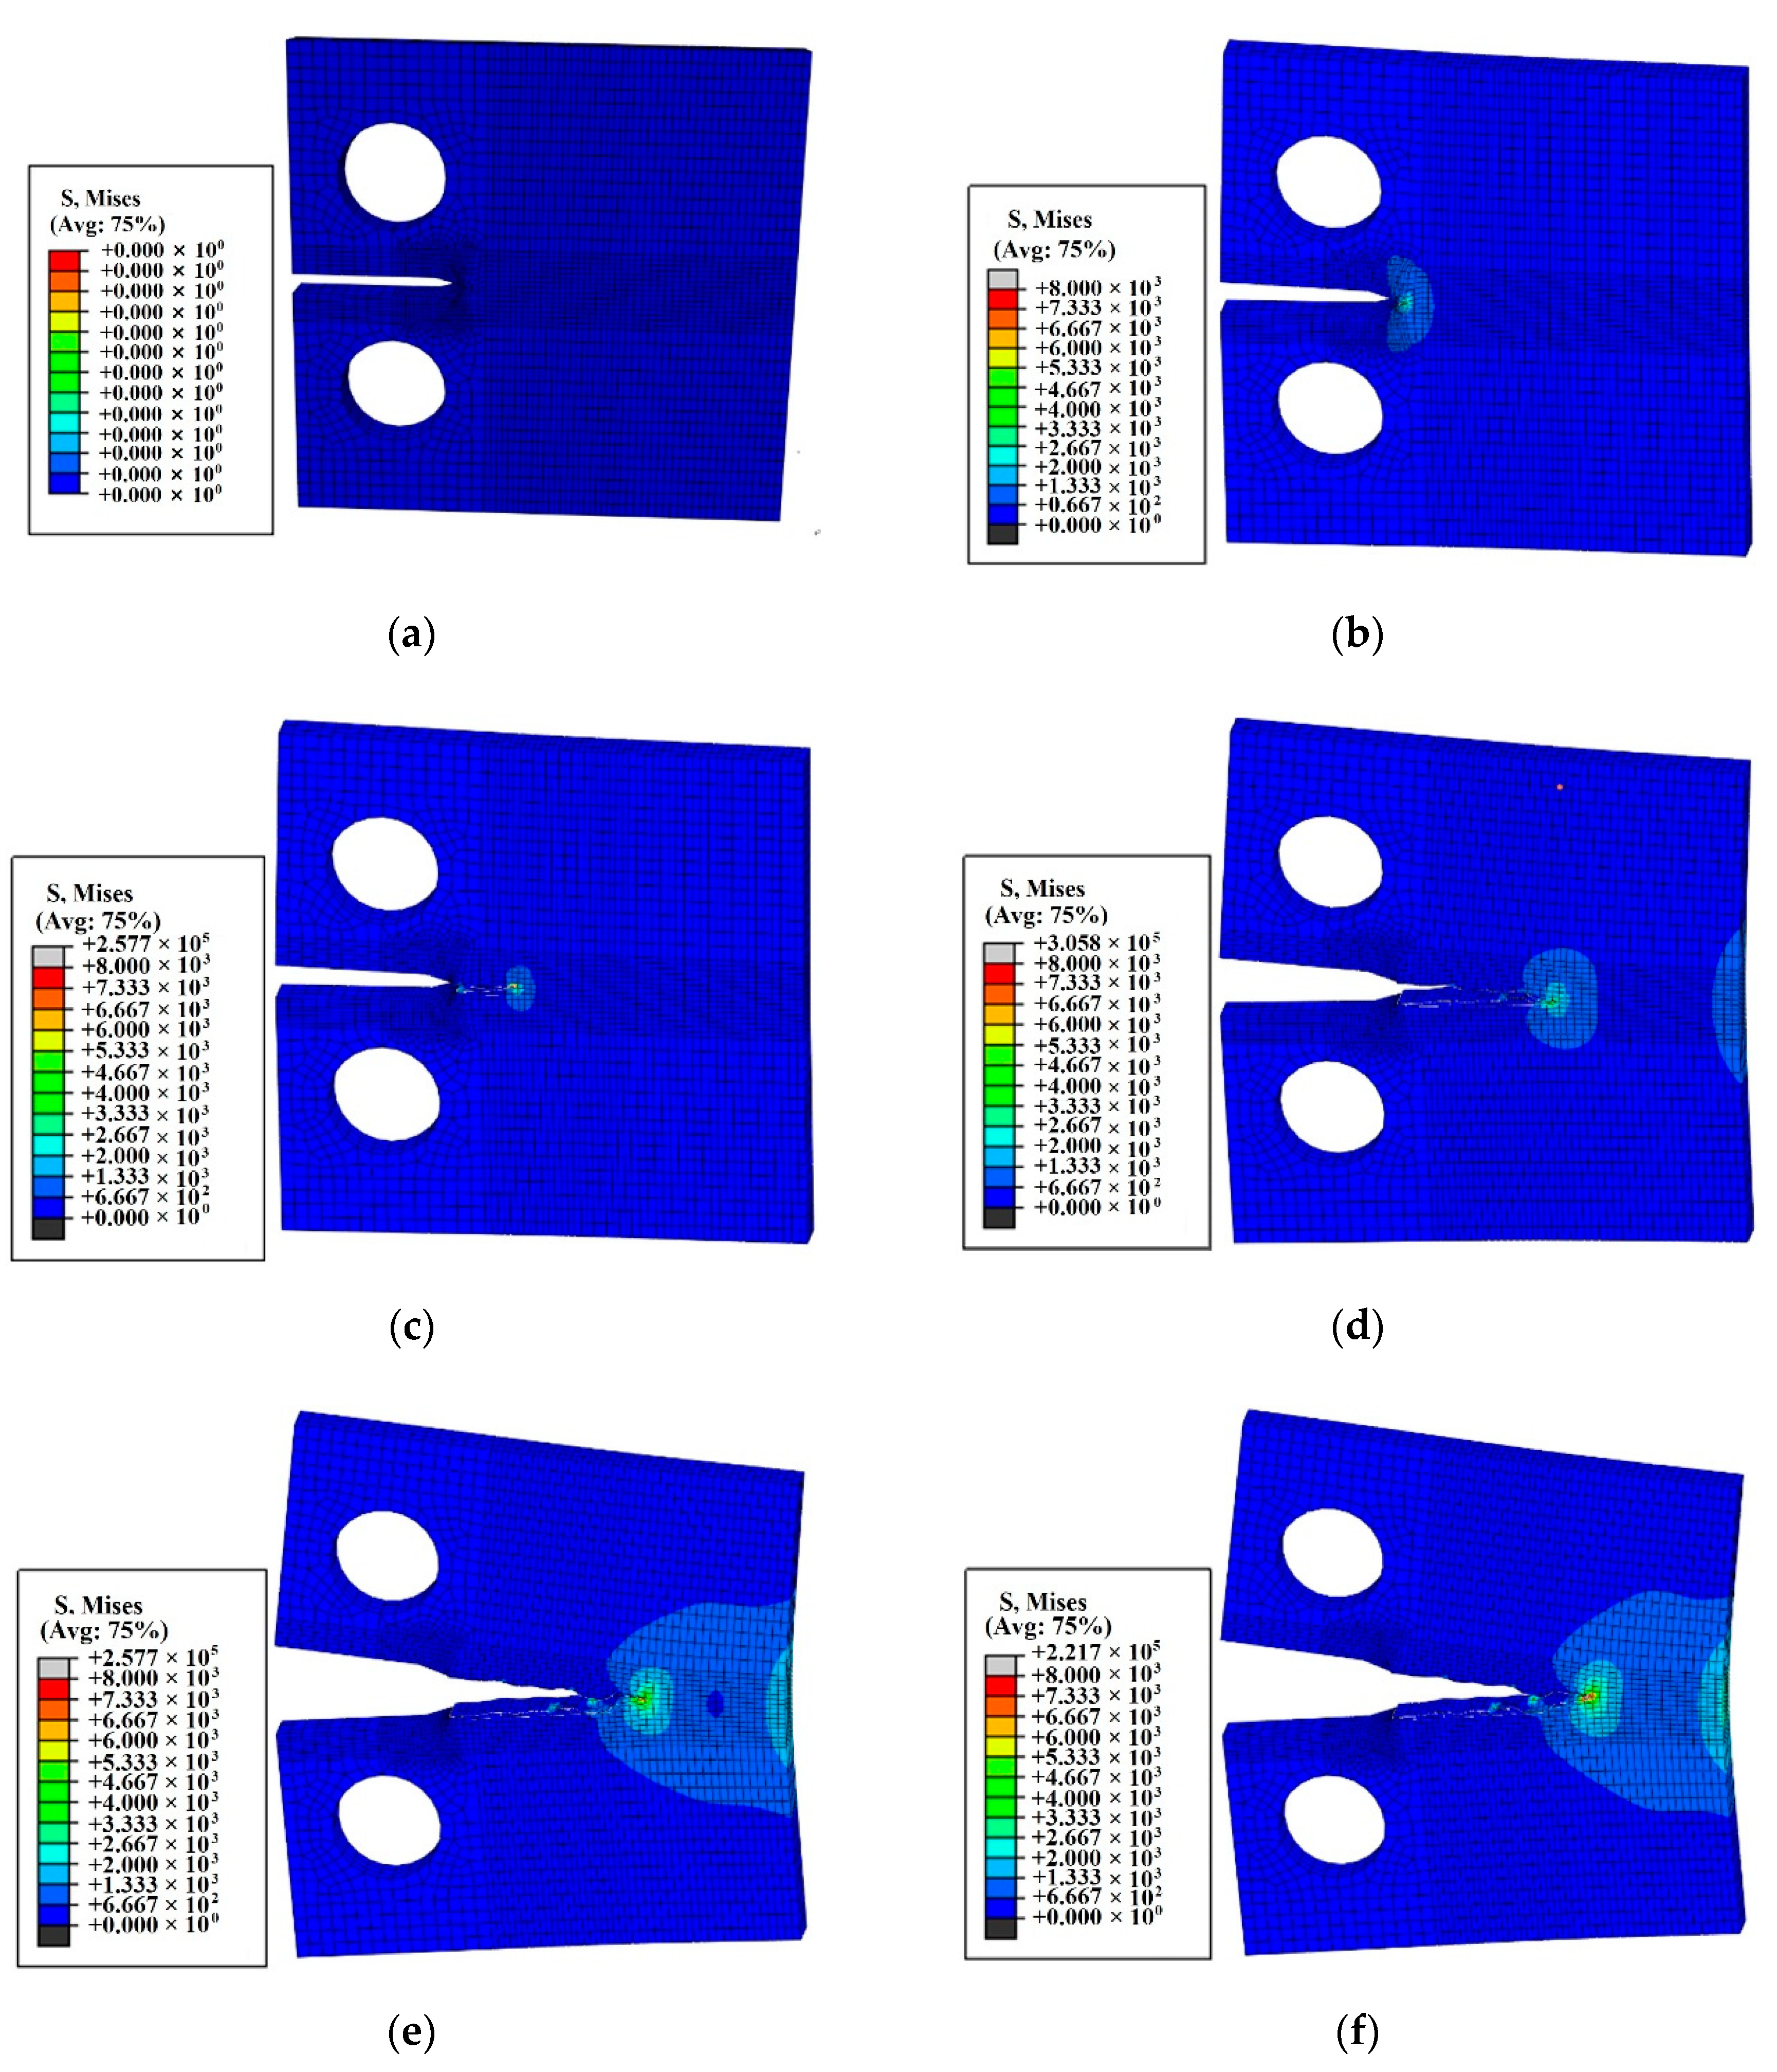
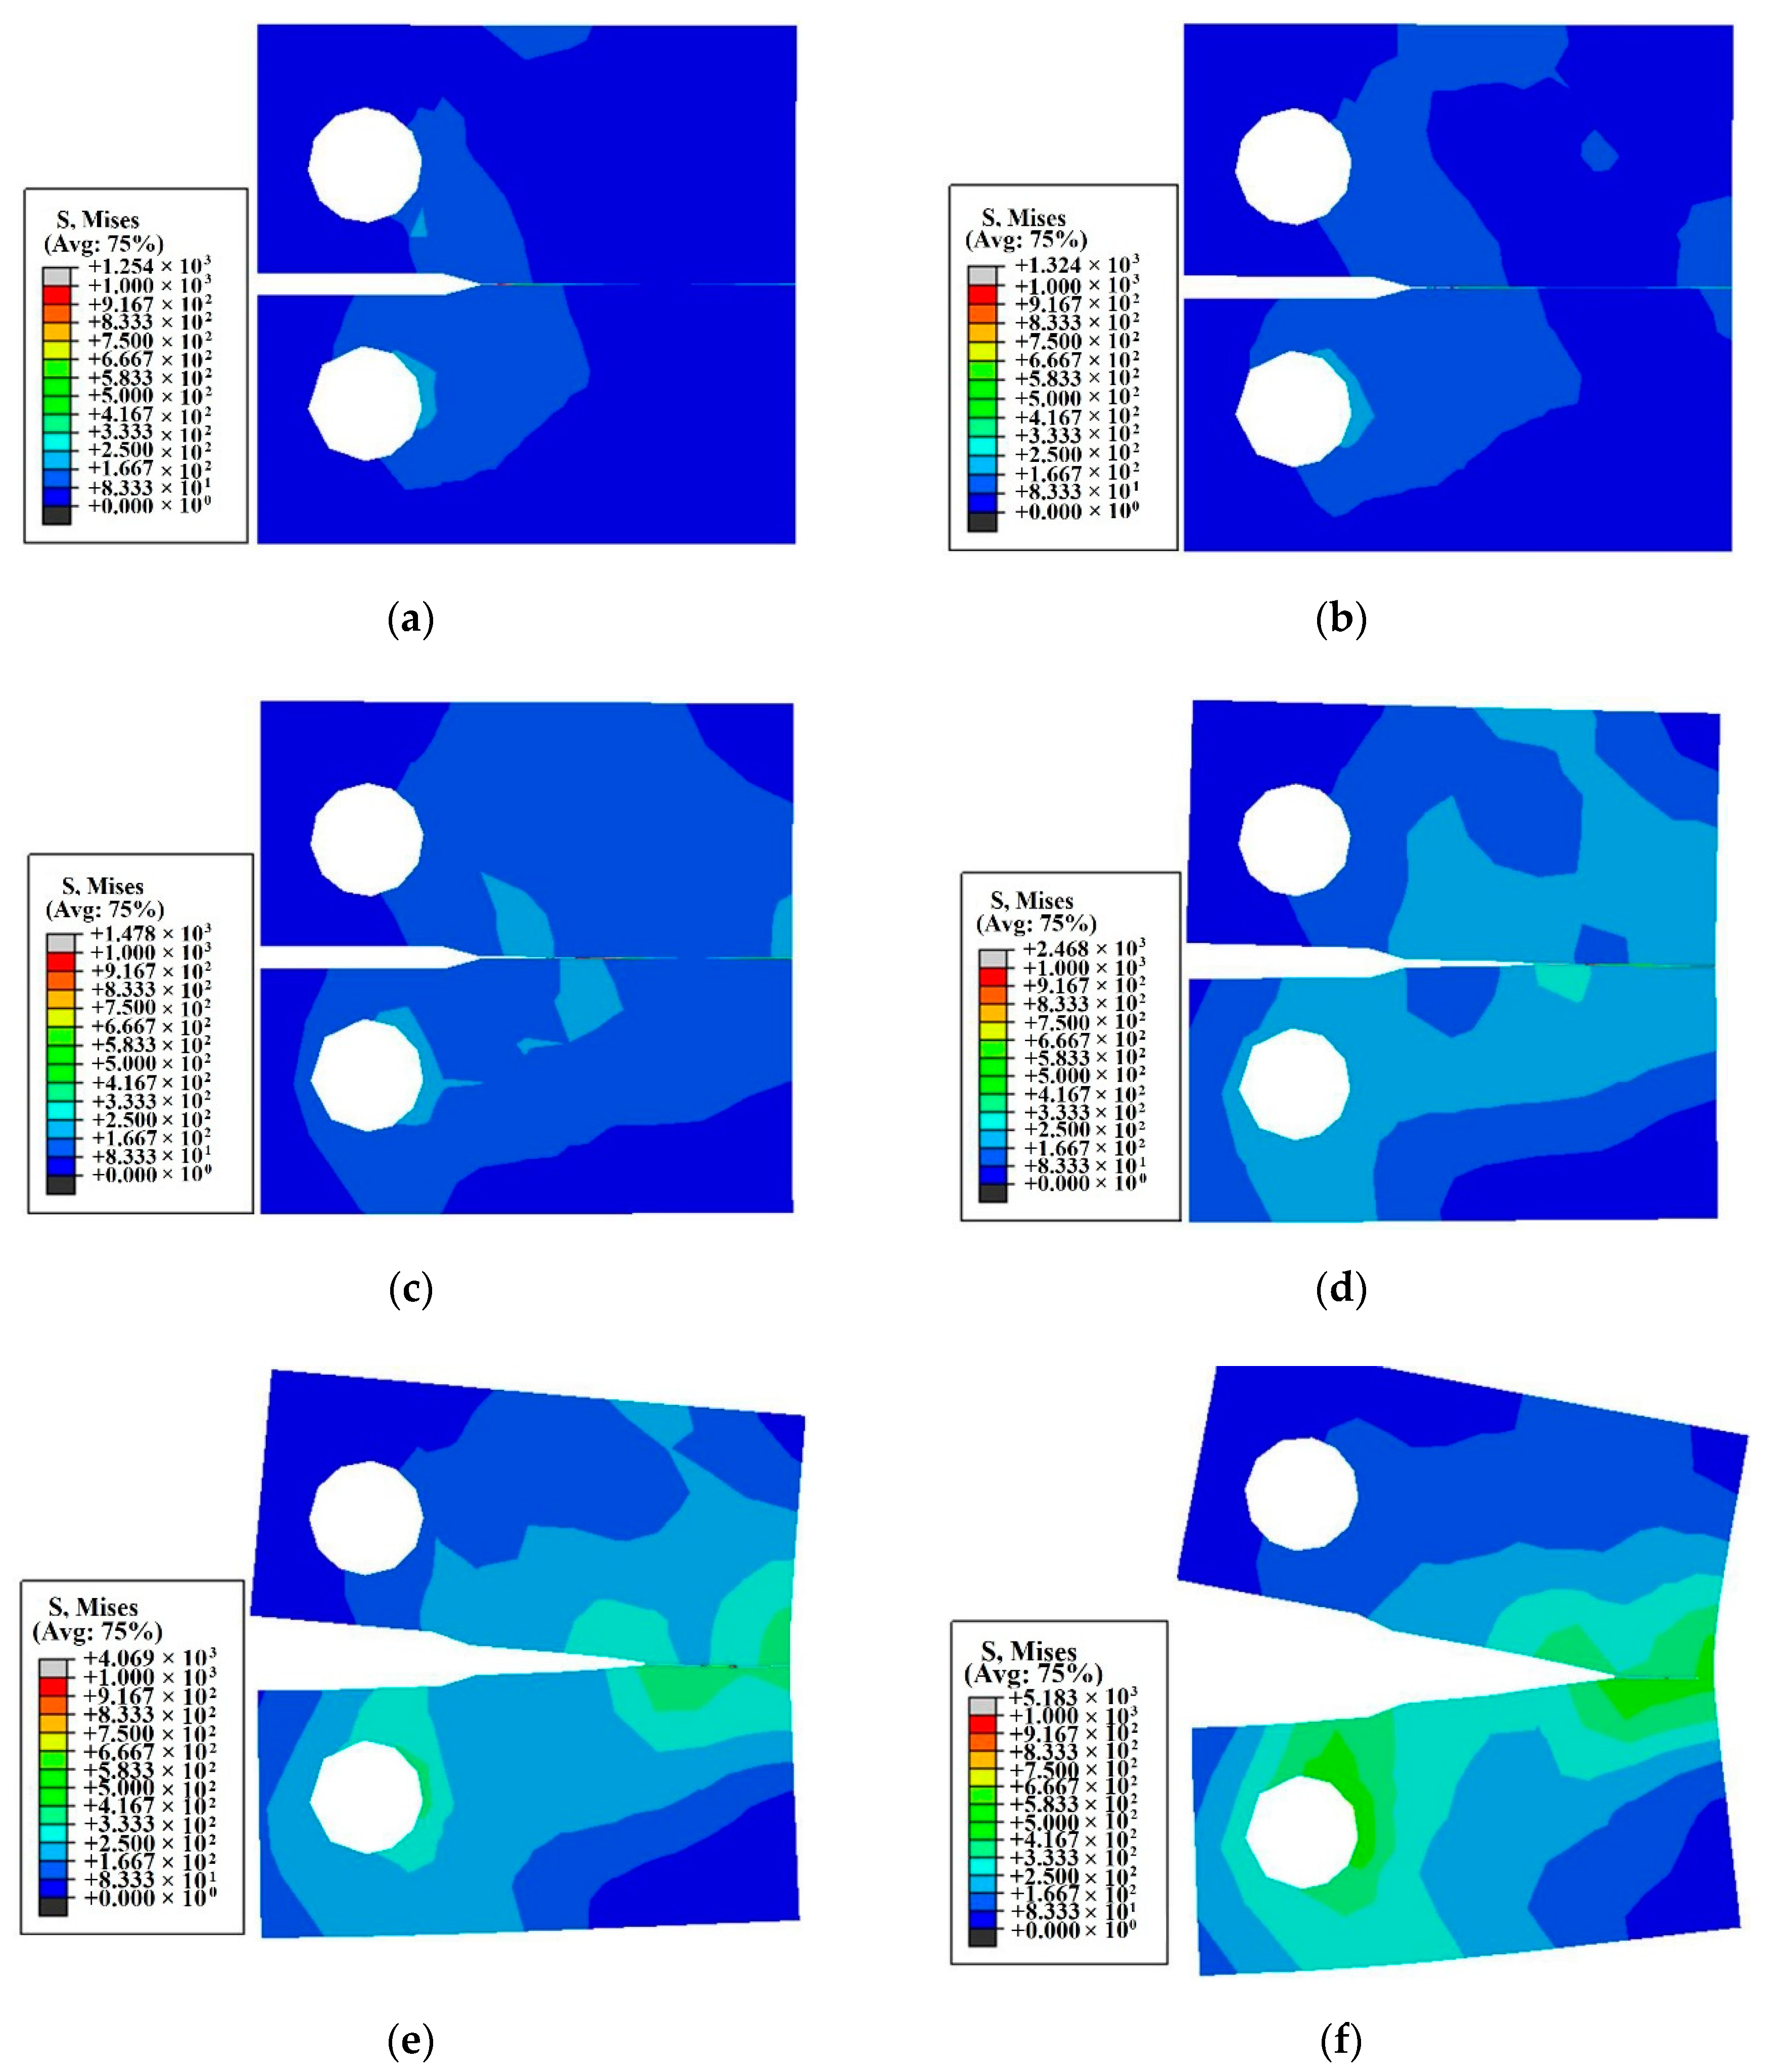
The Mises stress contours at t = 0.0, 0.5, 12.5, 31.5, 36.5, and 40.5 s were obtained and are shown in Figure 7. It can be seen that the cracks pass through the inside of the unit and propagate in an approximately horizontal direction. It can be seen from Figure 3 and Figure 7 that the crack propagation path simulated by the XFEM agrees well with the experimental result.
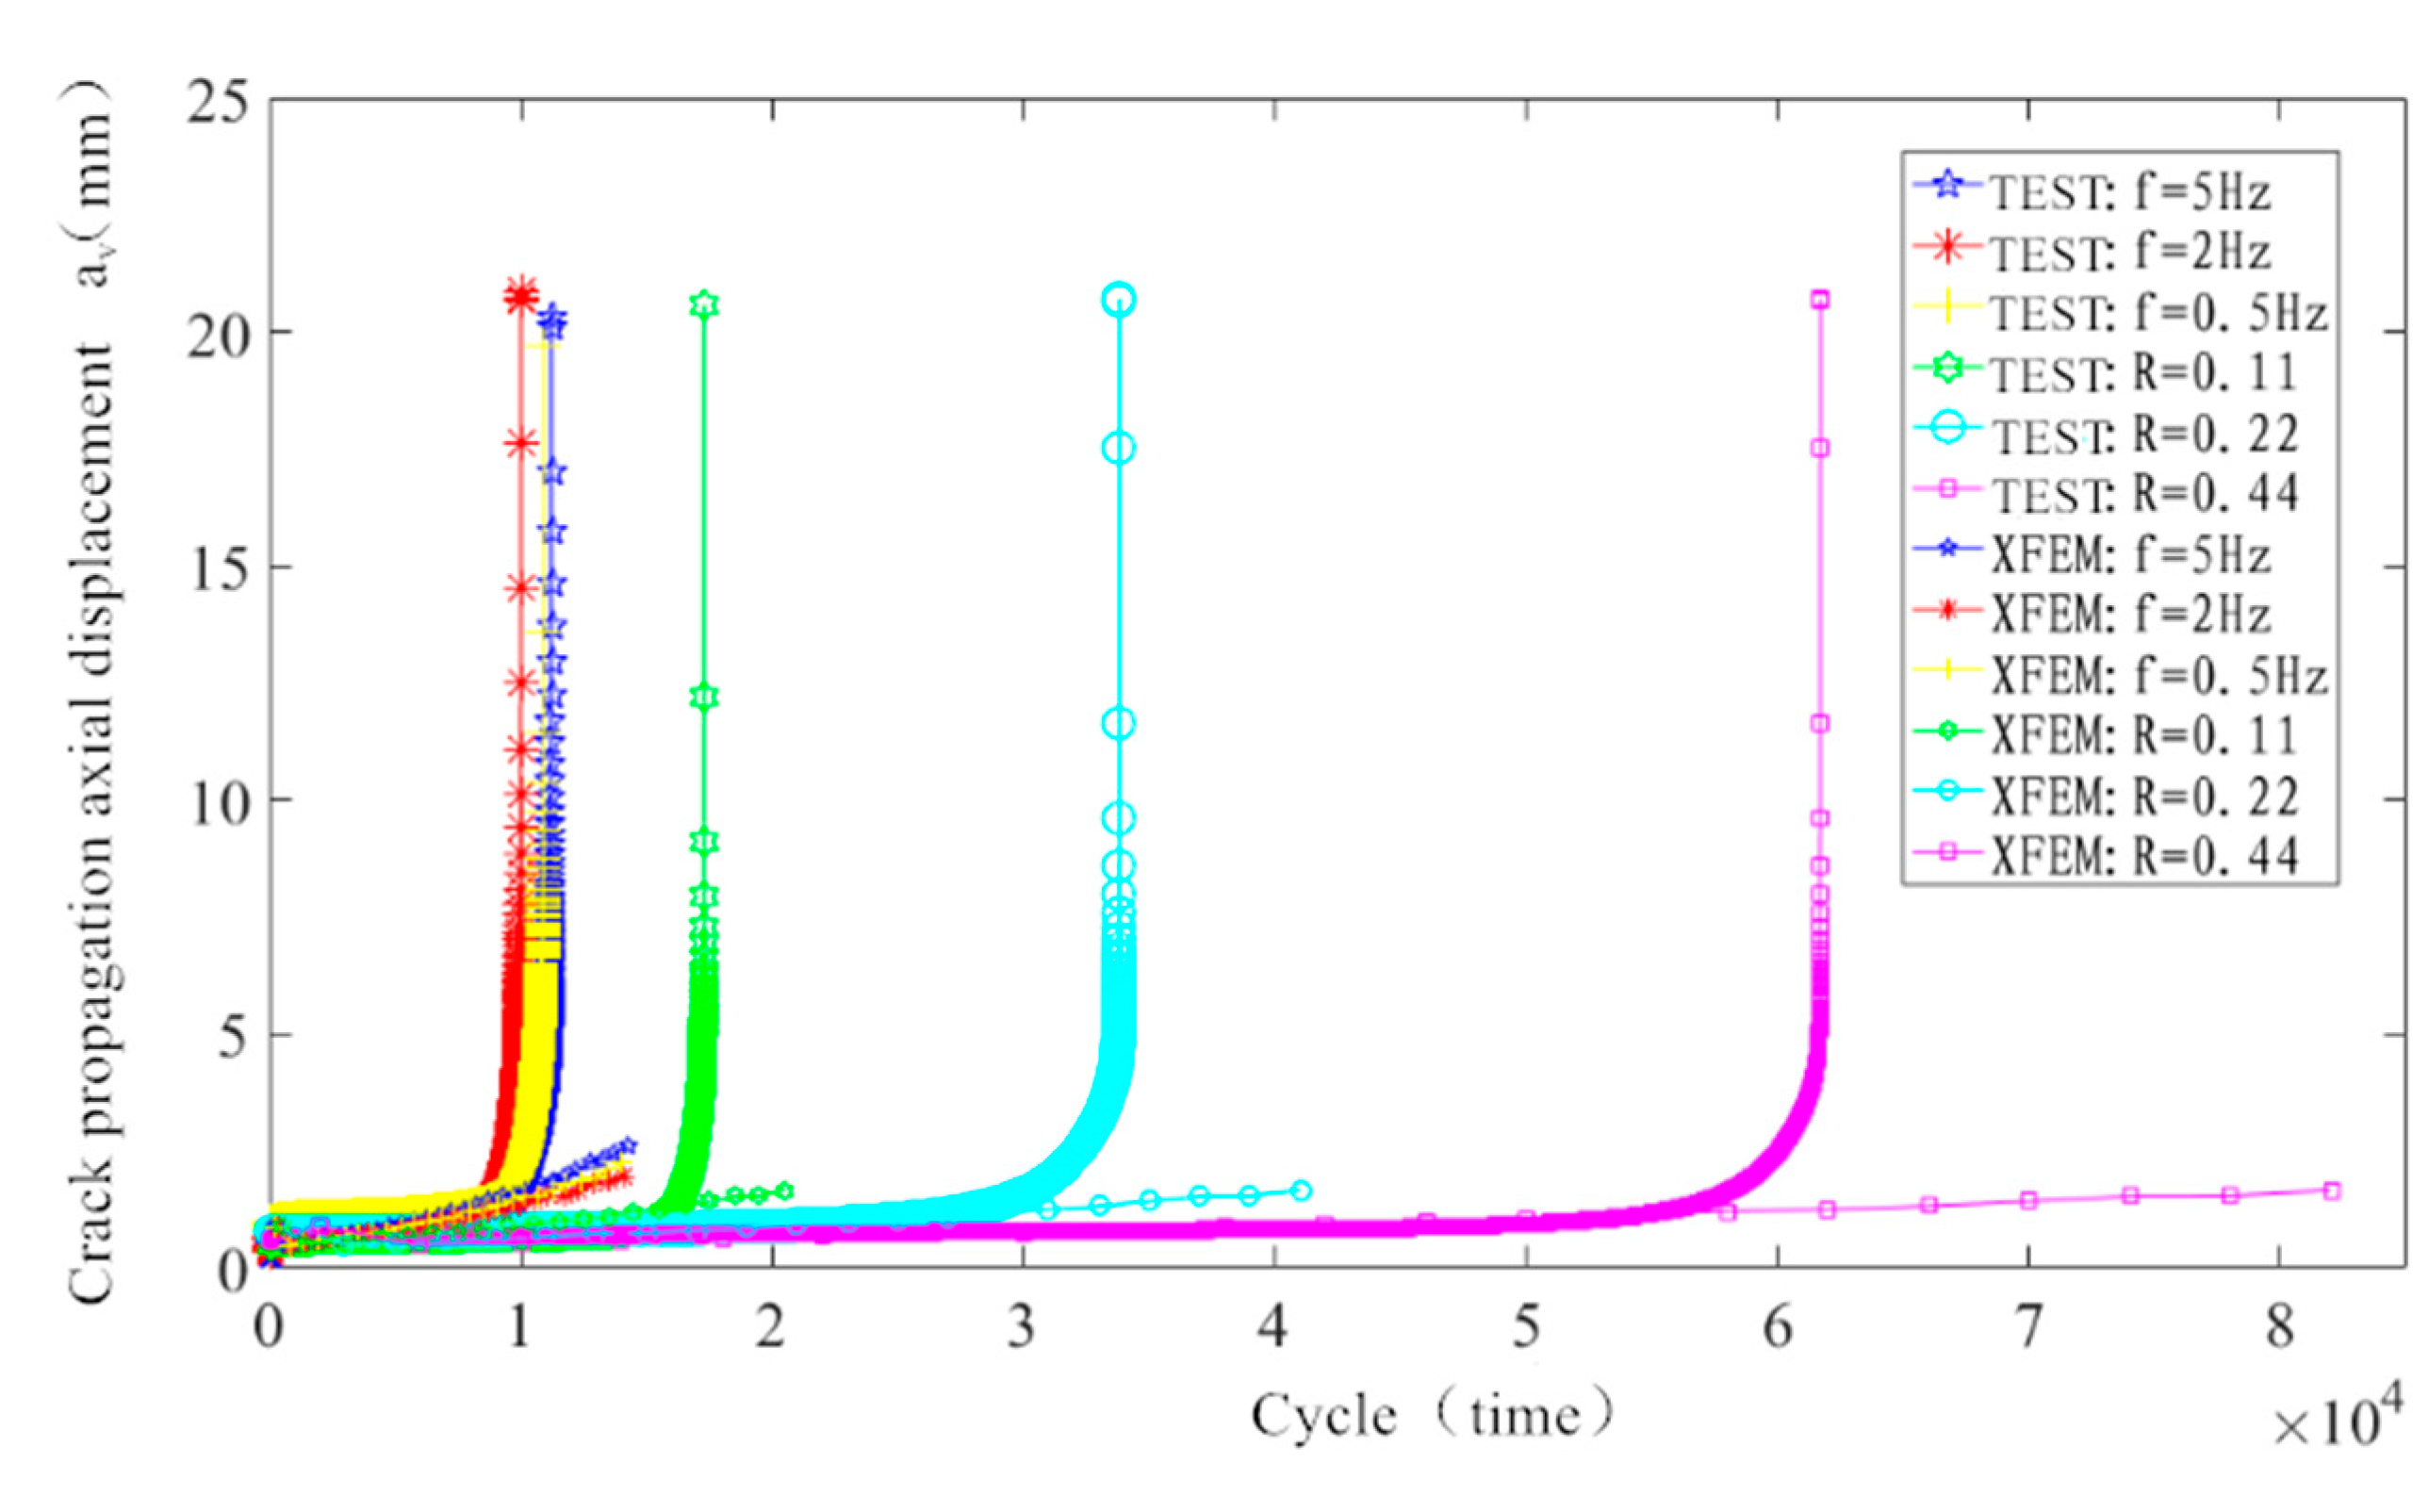
The simulated results are converted into the real displacement–periodic curves, the a-N curves. Moreover, the simulated curves are compared with the experimental curves, as shown in Figure 8. It can be seen that the simulated results in the crack stability extension period are in good agreement with the experimental data. However, there are some deviations in the crack nucleation period. Furthermore, the simulations and experimental data in the crack rapid rupture period are quite different, which would result in large differences in fatigue life. Therefore, XFEM can better predict the crack stability expansion period and cannot be used to predict the crack rapid rupture period.

4. Simulation of Fatigue Crack Propagation Based on Bilinear CZM

4.1. Bilinear CZM Theoretical Model

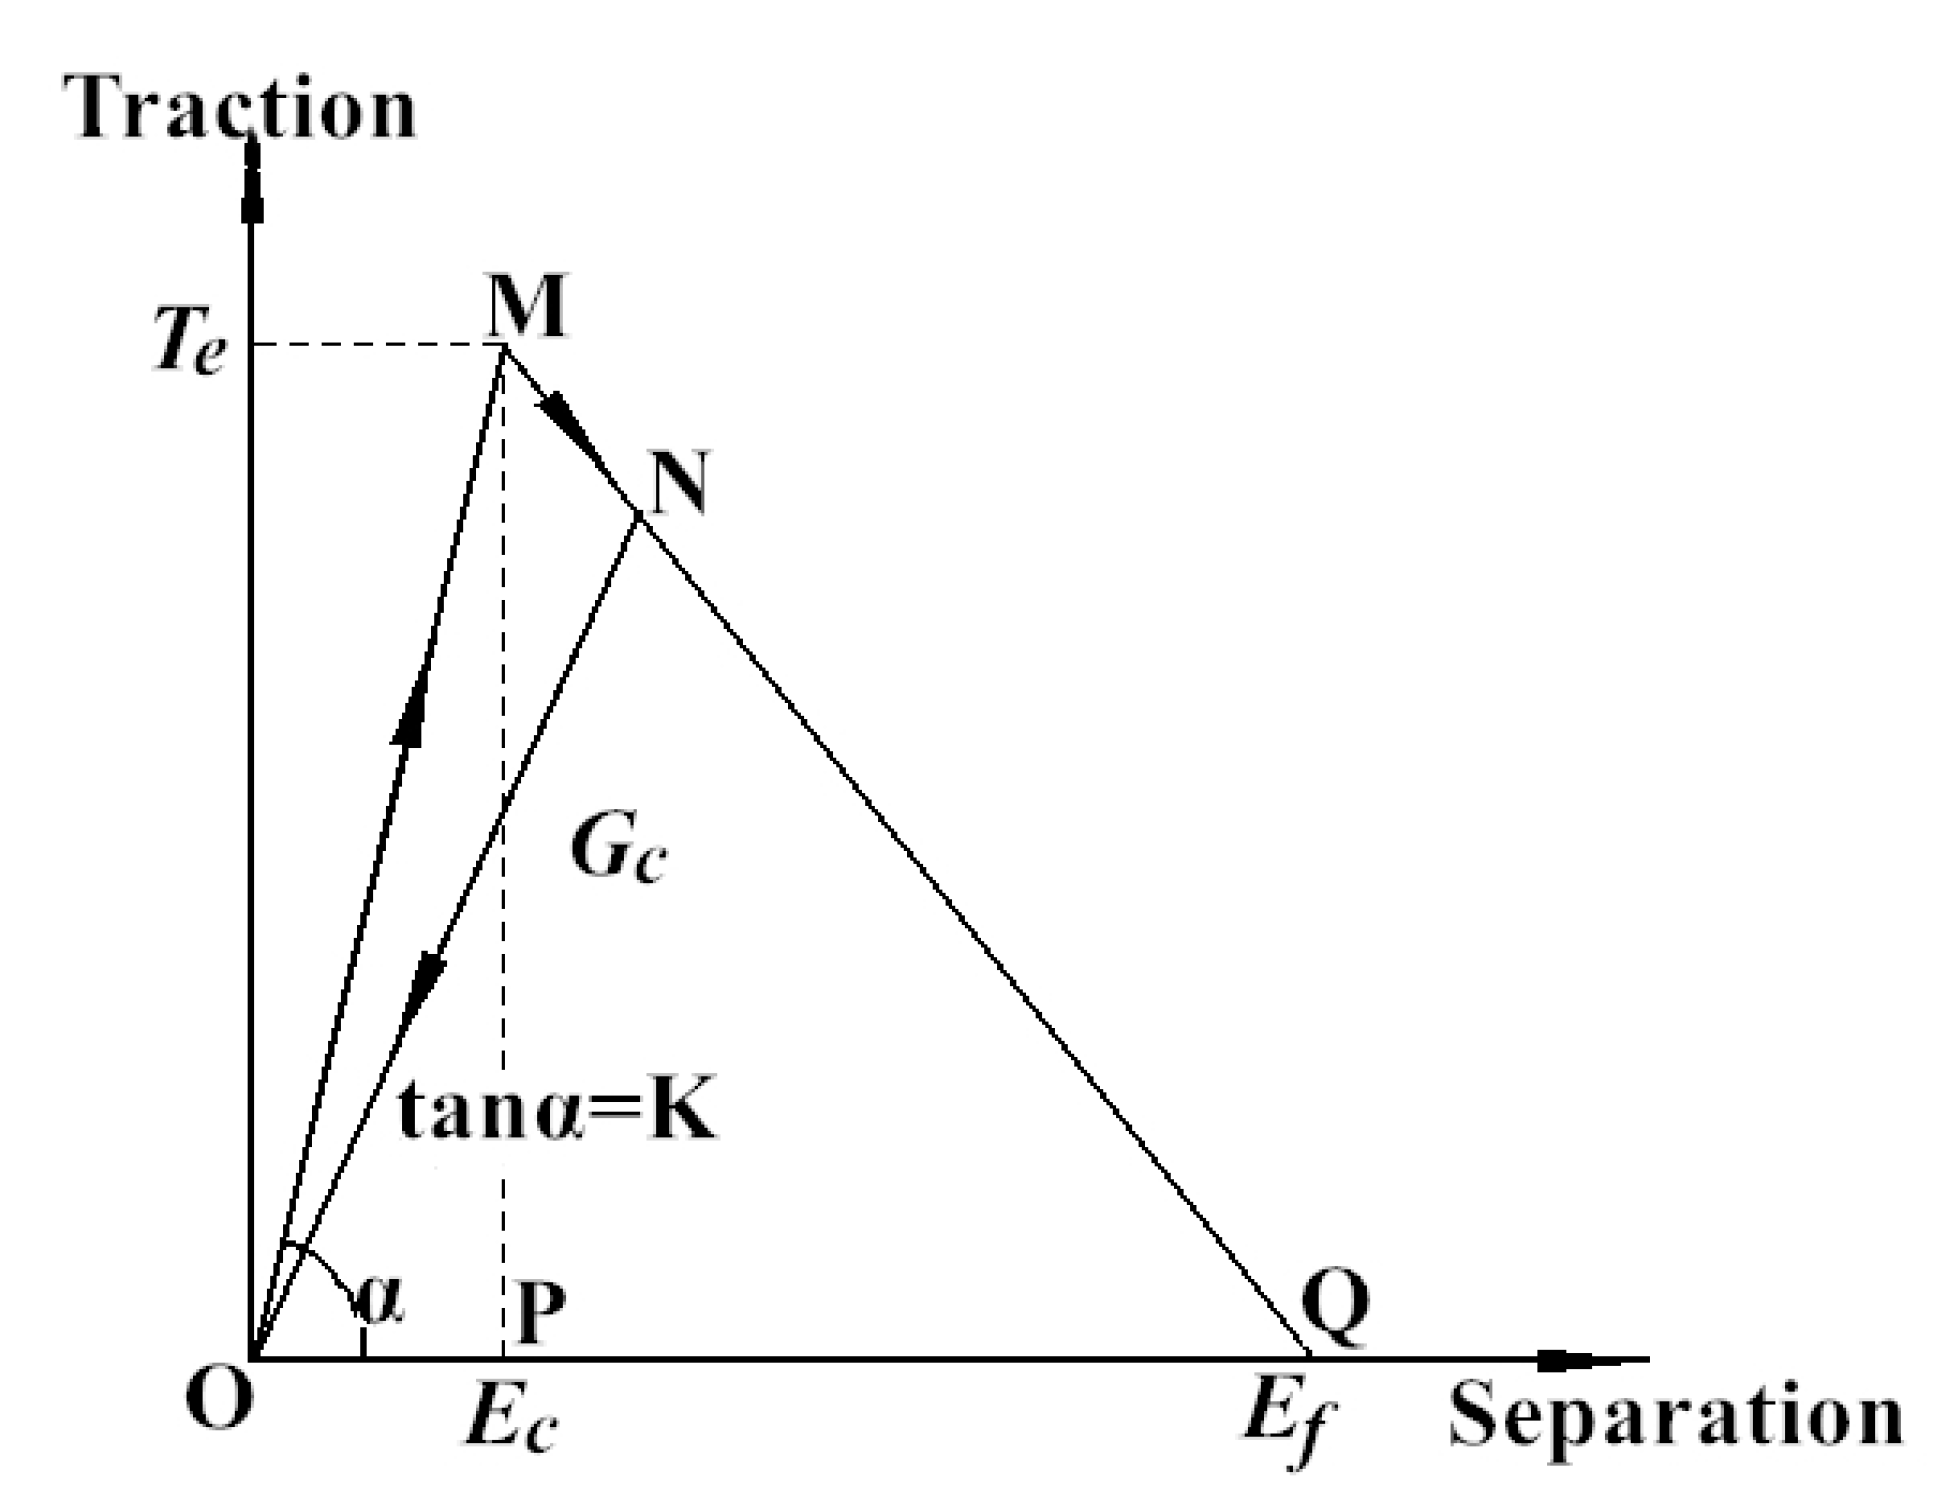
The traction–separation rule of CZM mainly includes bilinear models, trapezoidal models, polynomials models, and exponential models. Among them, the bilinear model is widely used because of its simple operation. This study used a bilinear model. The principle is shown in Figure 9.
Figure 9 shows that the abscissa indicates the opening displacement (mm) of the cohesive unit, and the ordinate indicates the traction (MPa) of the cohesive unit. The OM segment is a linear elastic stage, which coincides with a linear relationship. As the opening displacement increases to the critical point M, the material begins to produce damage, which is the beginning of the damage. The MN segment is a linear softening stage. The stress at the crack tip decreases linearly with the increase of the open displacement. The initial damage Dm is generated at this stage. Based on the damage mechanism of effective displacement, Dm is expressed as a linear function of δe, as in Equations (9) and (10). The N point marks the completion of the loading, and the NO segment represents the unloading process. The slope of the NO segment is lower than the slope of the OM segment, and the slope of NO is K’ = K*(1−Dm). After that, the material enters the stage of damage evolution, repeating the process of loading and unloading; the material damage is accumulated, the slope of the loading stage is gradually reduced, and the load carrying capacity of the material is continuously decreased, until the unit is completely damaged and the material completely loses the load carrying capacity. The displacement-based damage evolution equation is used in the cycle, and the specific damage evolution expression is as shown in Equation (11):
δ e = δ n 2 + δ s 2
D m = 1 E c δ e 1 E c E f
D c i n c = A ( 1 D c ) m T 1 D c T 0 n | | U ˙ | |
where A, m, and n are the parameters in the damage evolution formula, controlling the rate of damage evolution. D c is the damage variable, D m is the initial damage, and D c i n c is the damage increment. δ e is the effective displacement. E c is the effective displacement when the material starts to be damaged. E f is the effective displacement when the material fails completely. T0 is the threshold value of traction, or the fatigue limit, which indicates that when the value of traction is lower than the fatigue limit T0, the damage evolution process will be aborted. | | U ˙ | | represents the rate of change of the displacement of the cohesive element, and < > indicates that the value in the angle brackets is non-negative. Since Dc is between 0 and 1, Equation (11) is guaranteed to be non-negative, thus ensuring that the damage variable, Dc, increases with the increasing displacement.
The fatigue crack growth rate equation used in this model is the Paris equation, as shown in Equation (12).
d a d N = C ( Δ K ) m
where C and m are material constants. The crack length and the distance of the fatigue striation were measured by the fatigue crack growth rate tests. Then C and m are obtained by taking a double logarithm and performing a linear fit. In this paper, m = 2.2466, and C = 5.9101 × 10⁻⁶. ∆K is not a fixed value, but a value that is changing constantly. Different values of ΔK at different cycles are listed in Table 5. The calculation formula for ∆K is shown in Equation (13).
Δ K = K m a x K m i n = f Δ σ π a
where Kmax is the maximum stress intensity factor, and Kmin is the minimum stress intensity factor at the crack. Moreover, f is a function of component geometry and crack size; a is the crack length; and ∆σ is the stress amplitude at the crack.

4.2. VUMAT Subroutine Based on Bilinear CZM

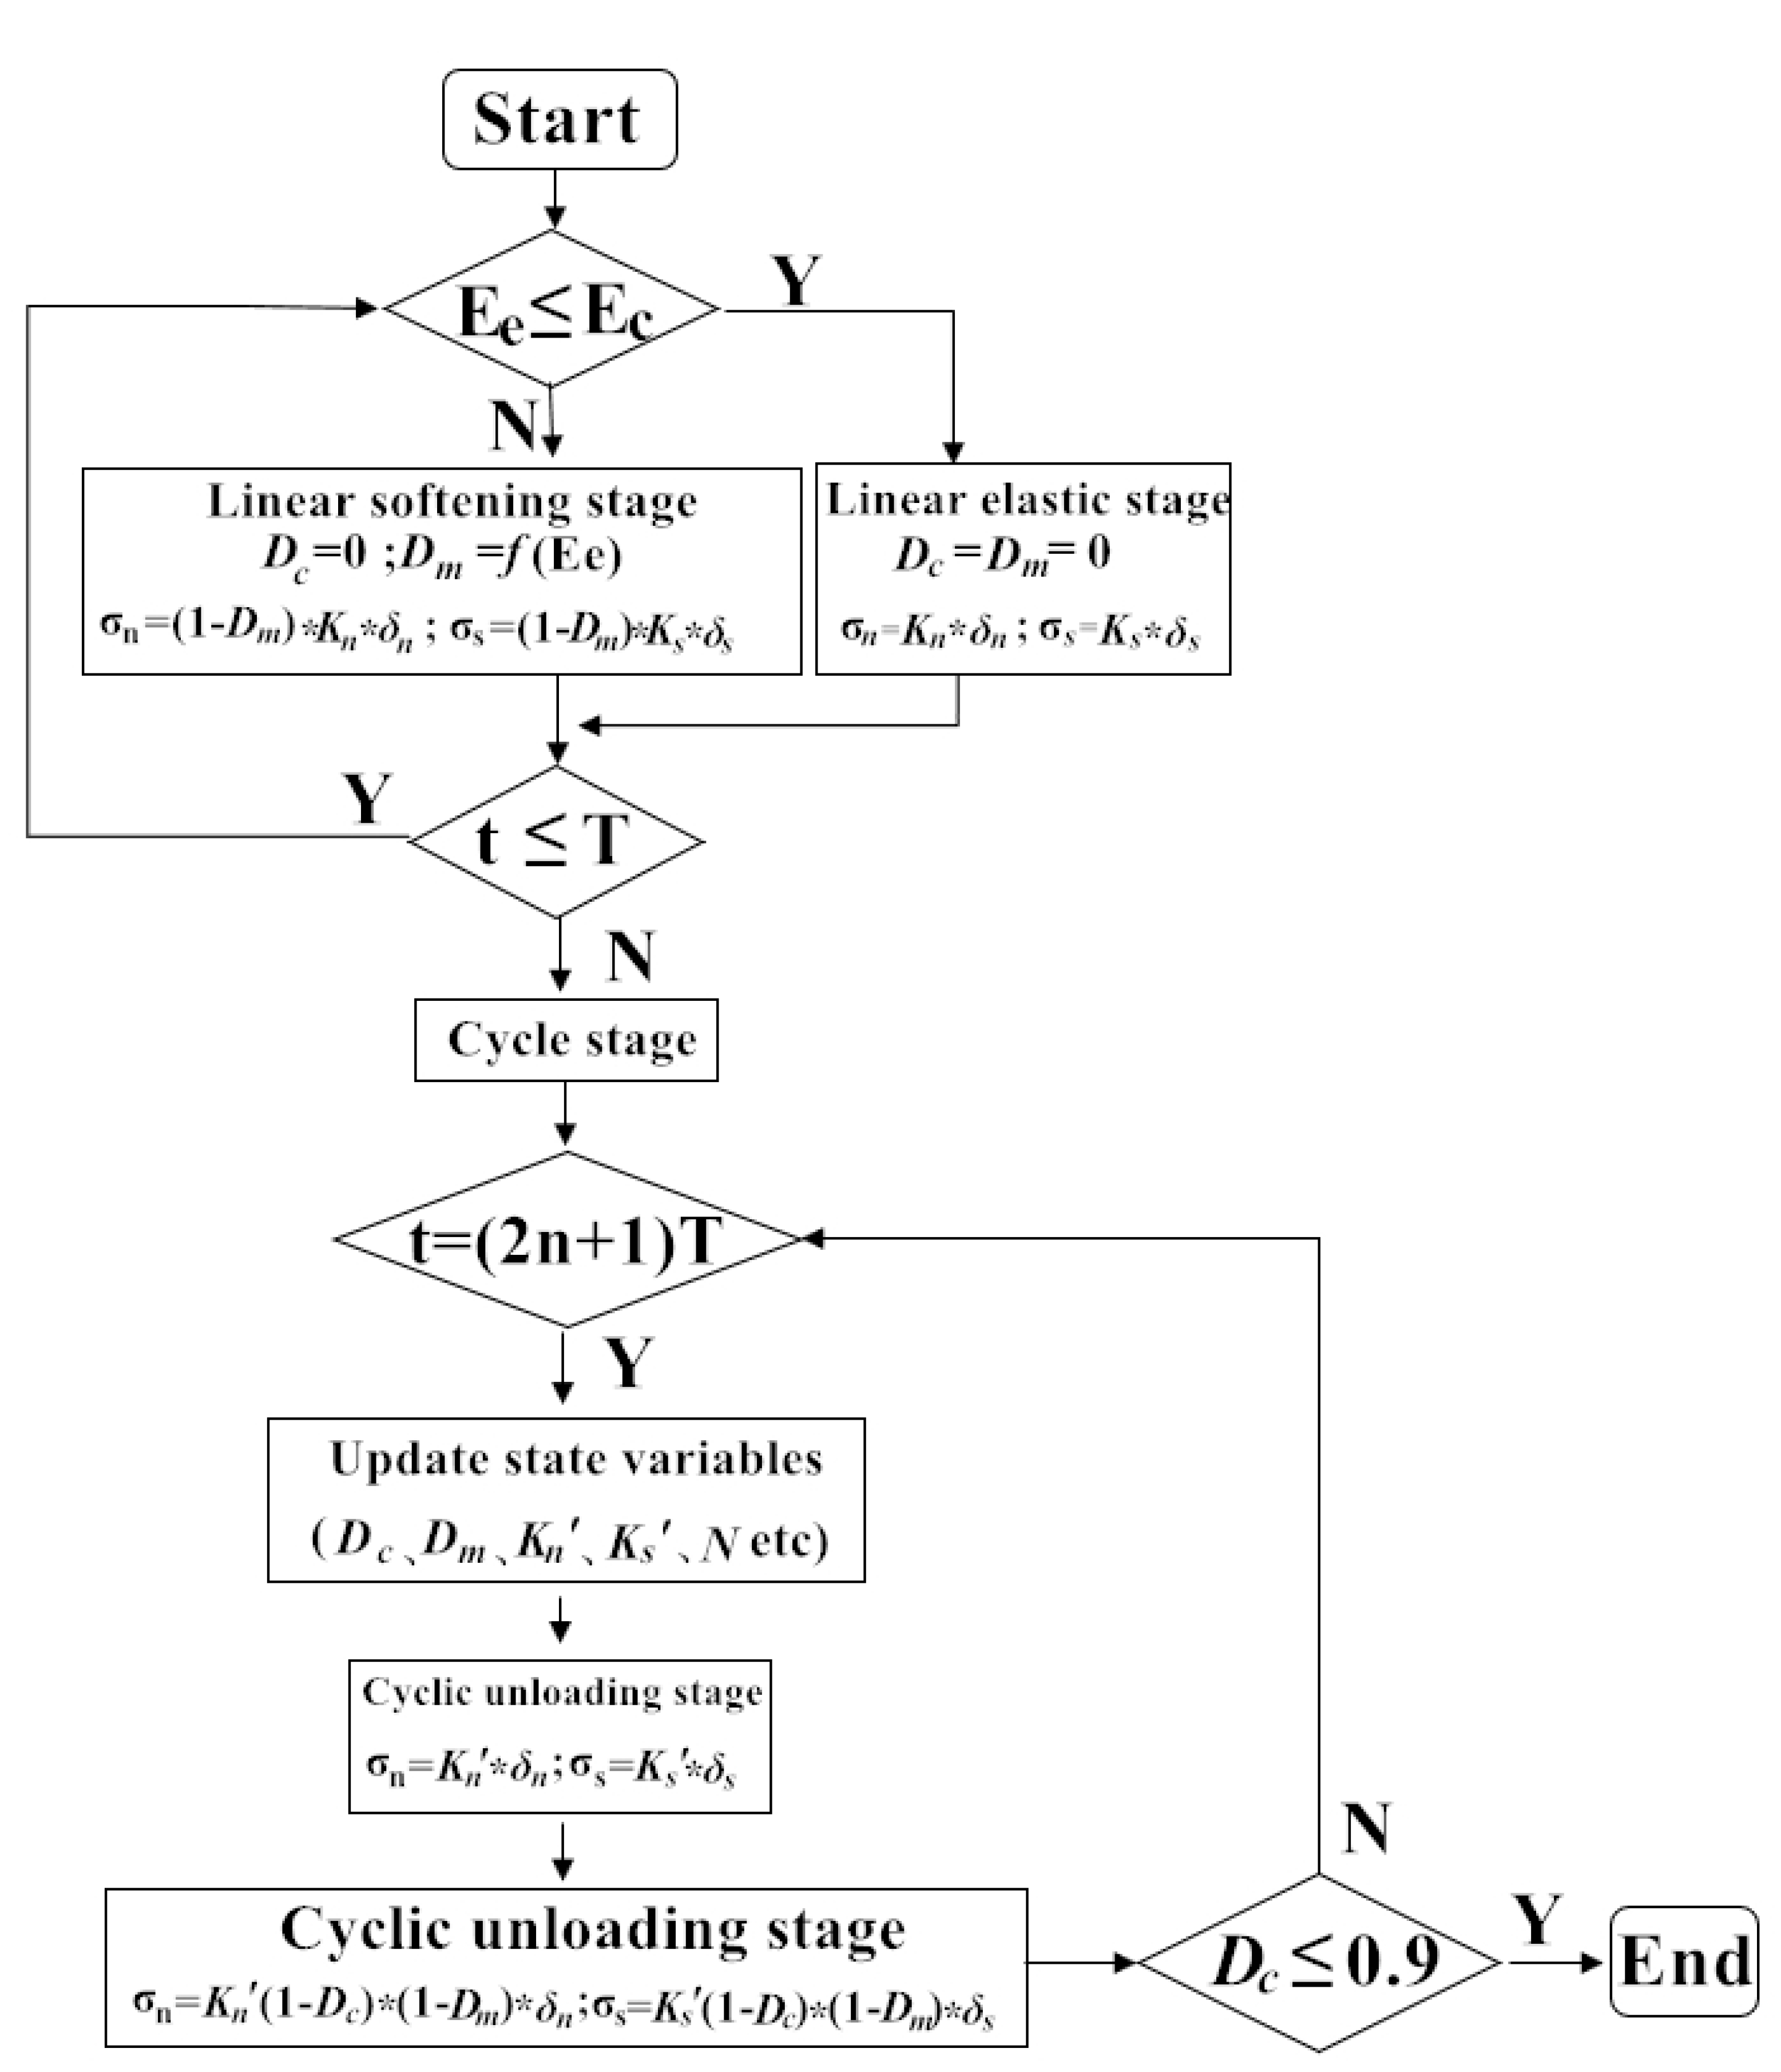
The material constitutive model considering the damage initiation process and damage evolution process of the material was implemented into ABAQUS, using the VUMAT (User subroutine to define material behavior) subroutine. For the initiation of damage, a displacement-based criterion was used. For the damage evolution, based on the damage mechanics, a damage variable, D, was embedded in the constitutive equation, and the change of the damage amount directly responds to the change of the material stiffness. The flowchart of the VUMAT subroutine is shown in Figure 10.
E e in Figure 10 is the effective displacement. σ n is the normal stress, and σ s is the tangential stress. δ n is the normal strain, and δ s is the tangential strain. K n and K s are normal interface stiffness and tangential interface stiffness, respectively. K n and K s are the updated values. T is the time of half cycle, and N is the number of cycle.

4.3. Finite Element Model

Since the properties of the cohesive unit are different from those of the base unit, the material of the CT specimen is divided into two parts: the matrix material and the cohesive material. The matrix material follows the constitutive response of an isotropic elastoplastic material. In this part, we set a mass density of 7.93 × 10⁻⁹ ton/mm3, a Young’s modulus of 2 × 10⁵ Mpa, and a Poisson’s ratio of 0.3; the relationship between yield stress and plastic strain are shown in Table 6. Cohesive materials follow the special properties of the cohesive units. In this part, we set a mass density of 7.93 × 10⁻⁹ ton/mm3, a material stiffness of 1 × 10⁹ N/mm, and a cohesive thickness of 1 × 10⁻⁴ mm. The initial displacement was set to 1.9 × 10⁻⁶ mm, and the failure displacement was set to 0.01 mm. The structural dimensions of the model are consistent with the experimental specimens. The interaction relationship, boundary conditions, and loading conditions of CT specimens are shown in Figure 11. It shows that the upper and lower circular center reference points RP-1 and RP-2 are coupled to the inner surface of the circular hole, respectively. For the boundary condition, the translational degree of freedom in the X and Y directions at RP-2 is limited, and the translational degree of freedom in the X direction at RP-1 is limited. U1 and U2 represent translations along the X and Y axes, respectively. A triangular periodic load in the Y direction is applied at RP-1. Since the number of stretching cycles N is too large, it takes too long time to set the load manually. We used the amplitude curve-specific subroutine VUAMP (User subroutine to define amplitude curve) to define the triangular periodic loading. We divided the part into three parts for meshing: upper and lower matrix zone and cohesive zone.
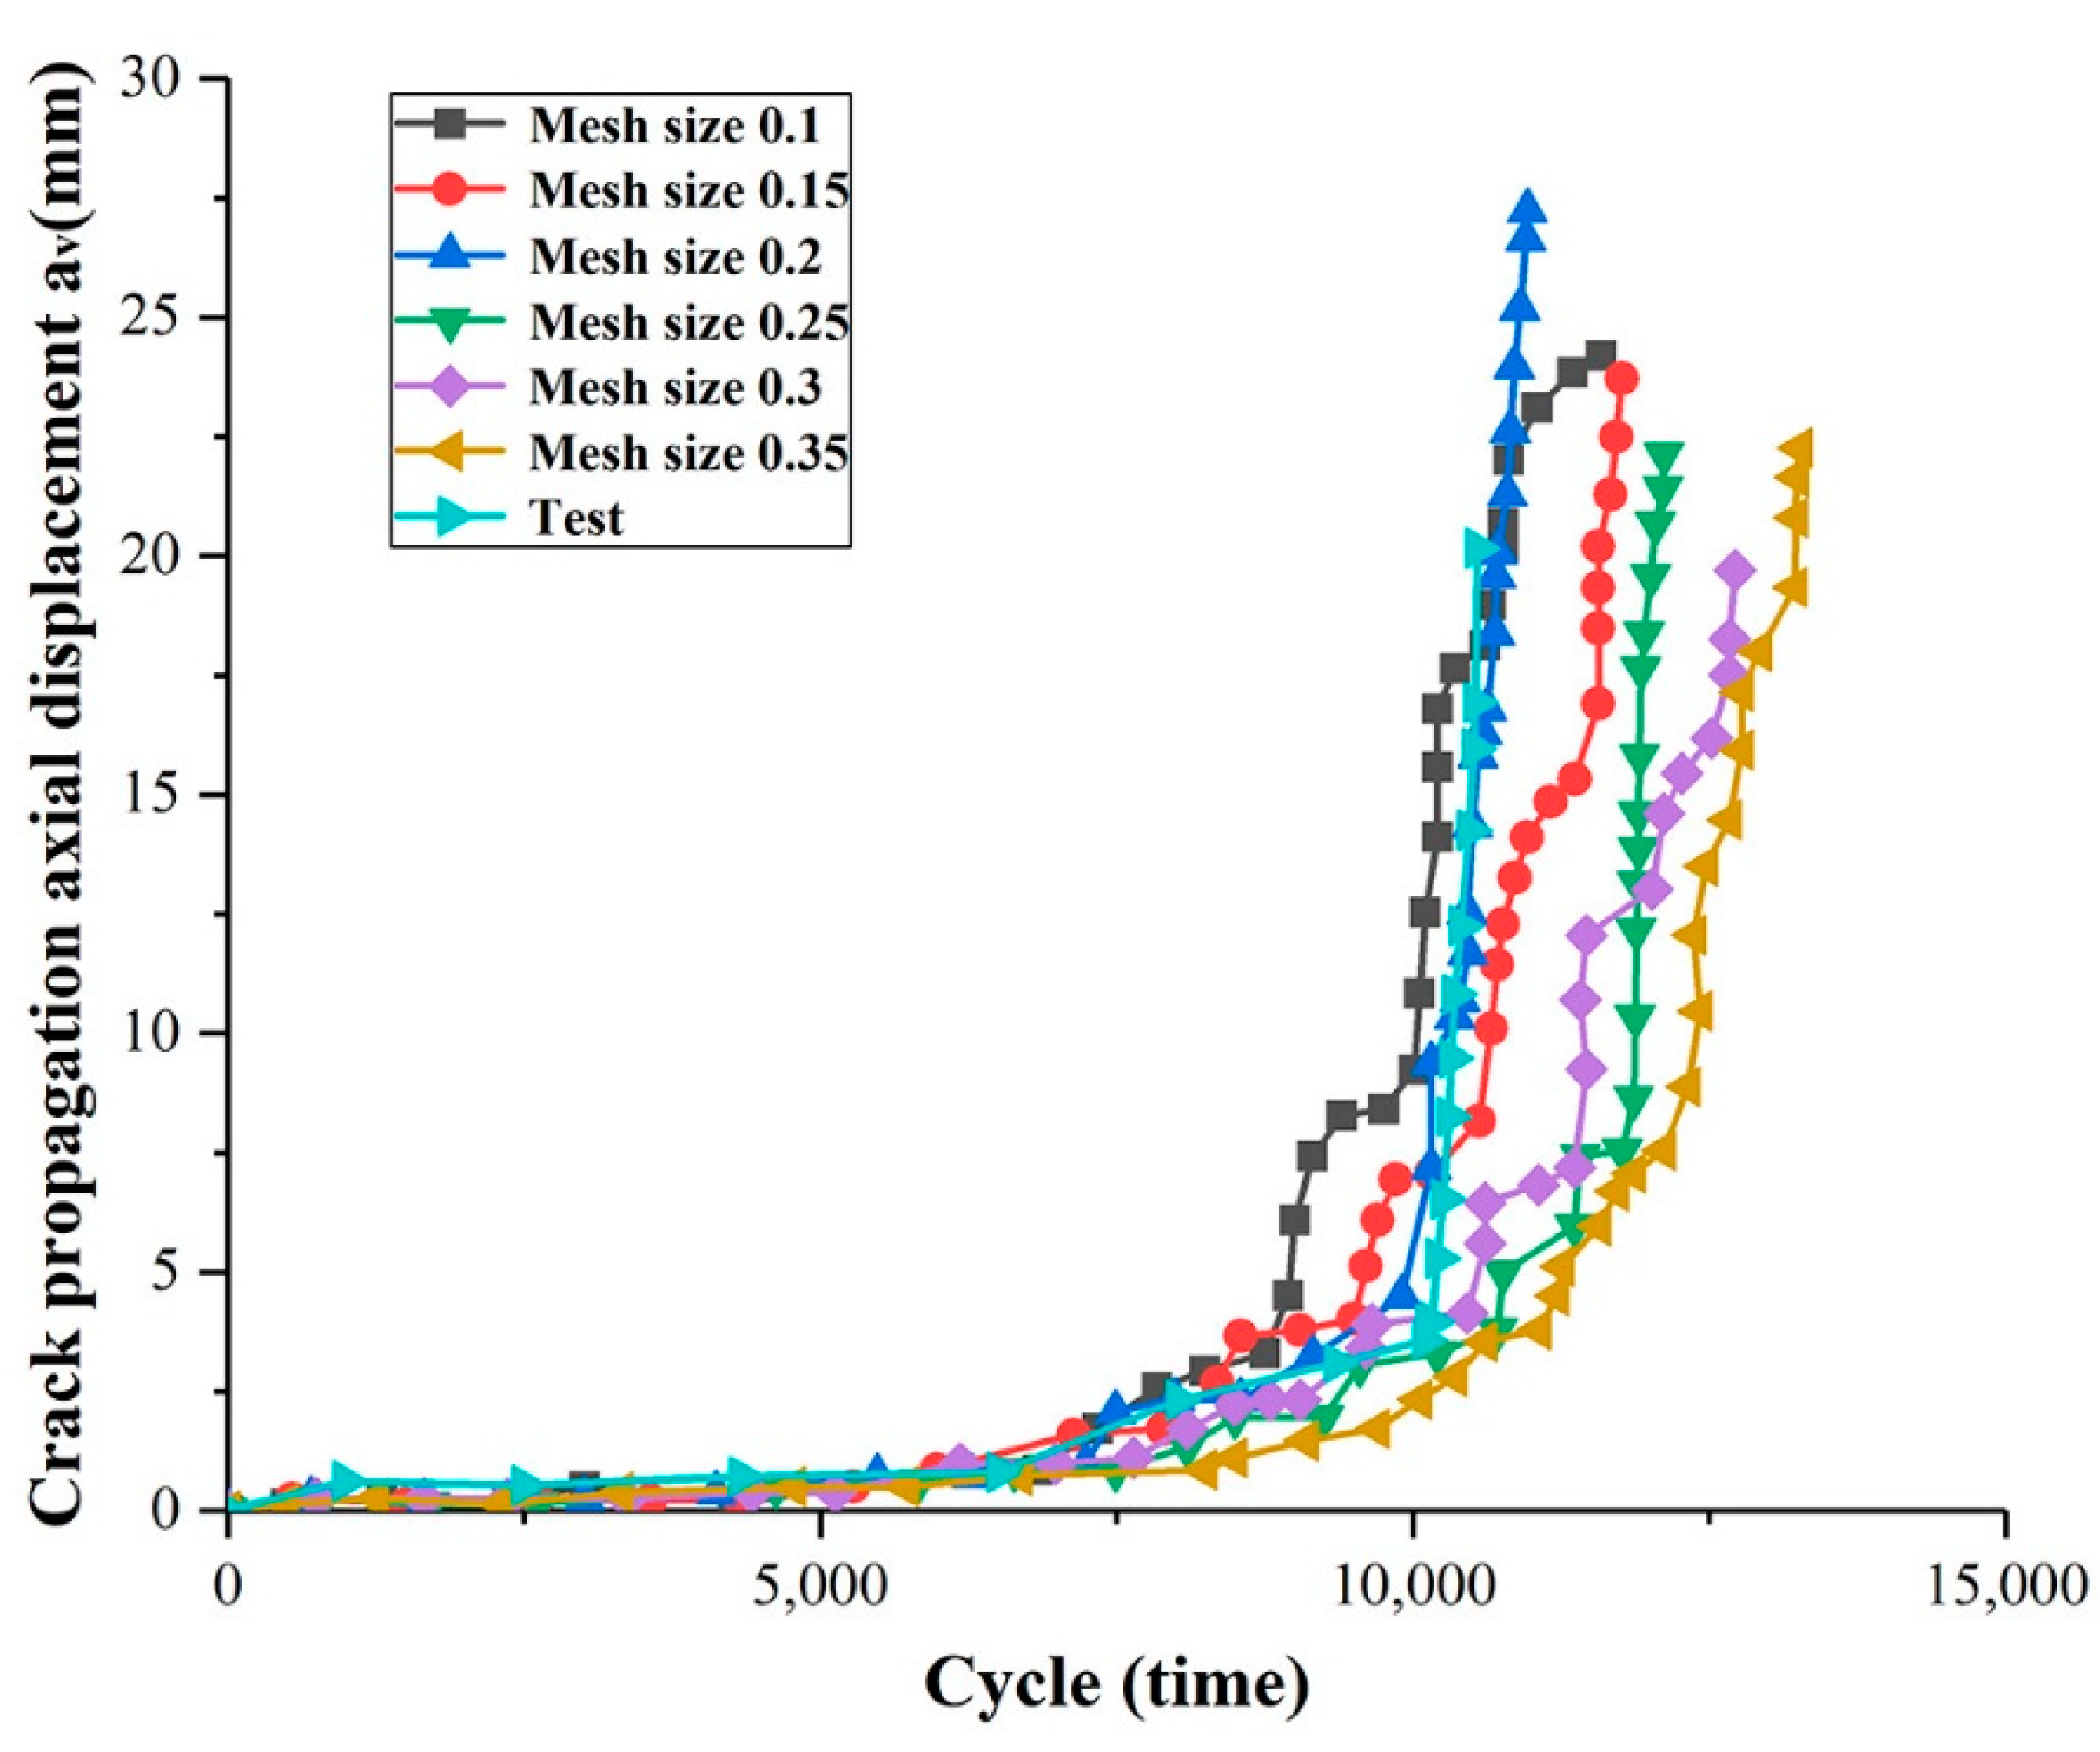
Under the condition of 0.5–4.5 KN load range, frequency f = 5 Hz, and stress ratio R = 0.11, the influence of different element sizes of cohesive material units on the a-N curve was studied. Figure 12 depicts the corresponding a-N curve for the cohesive material element size of 0.1, 0.15, 0.2, 0.25, 0.3, and 0.35 mm and experimental curve. The element type is COH2D4. Related studies had shown that it is reasonable to use two-to-five cohesive units for one matrix material unit [27,28]. In this paper, five cohesive elements are used to correspond to one matrix element. The type of matrix element is CPS4R.
Deviations between the fatigue life of the CT specimen and the experimental results N = 10540 under different mesh sizes are listed in Table 7. It can be seen that, the larger the mesh size of the cohesive material, the shorter the total life of the CT specimen at full fracture, and the smaller the deviation from the real life. The results obtained when the mesh size is 0.1, 0.15, 0.2, and 0.25 mm are very close to the experiment, indicating that the mesh size is not sensitive to the mesh density in this interval. After comprehensive considerations, the cohesive material mesh size of 0.2 mm was selected as the most suitable mesh size and used for later simulation. Thus, the matrix material mesh size was 1.0 mm.
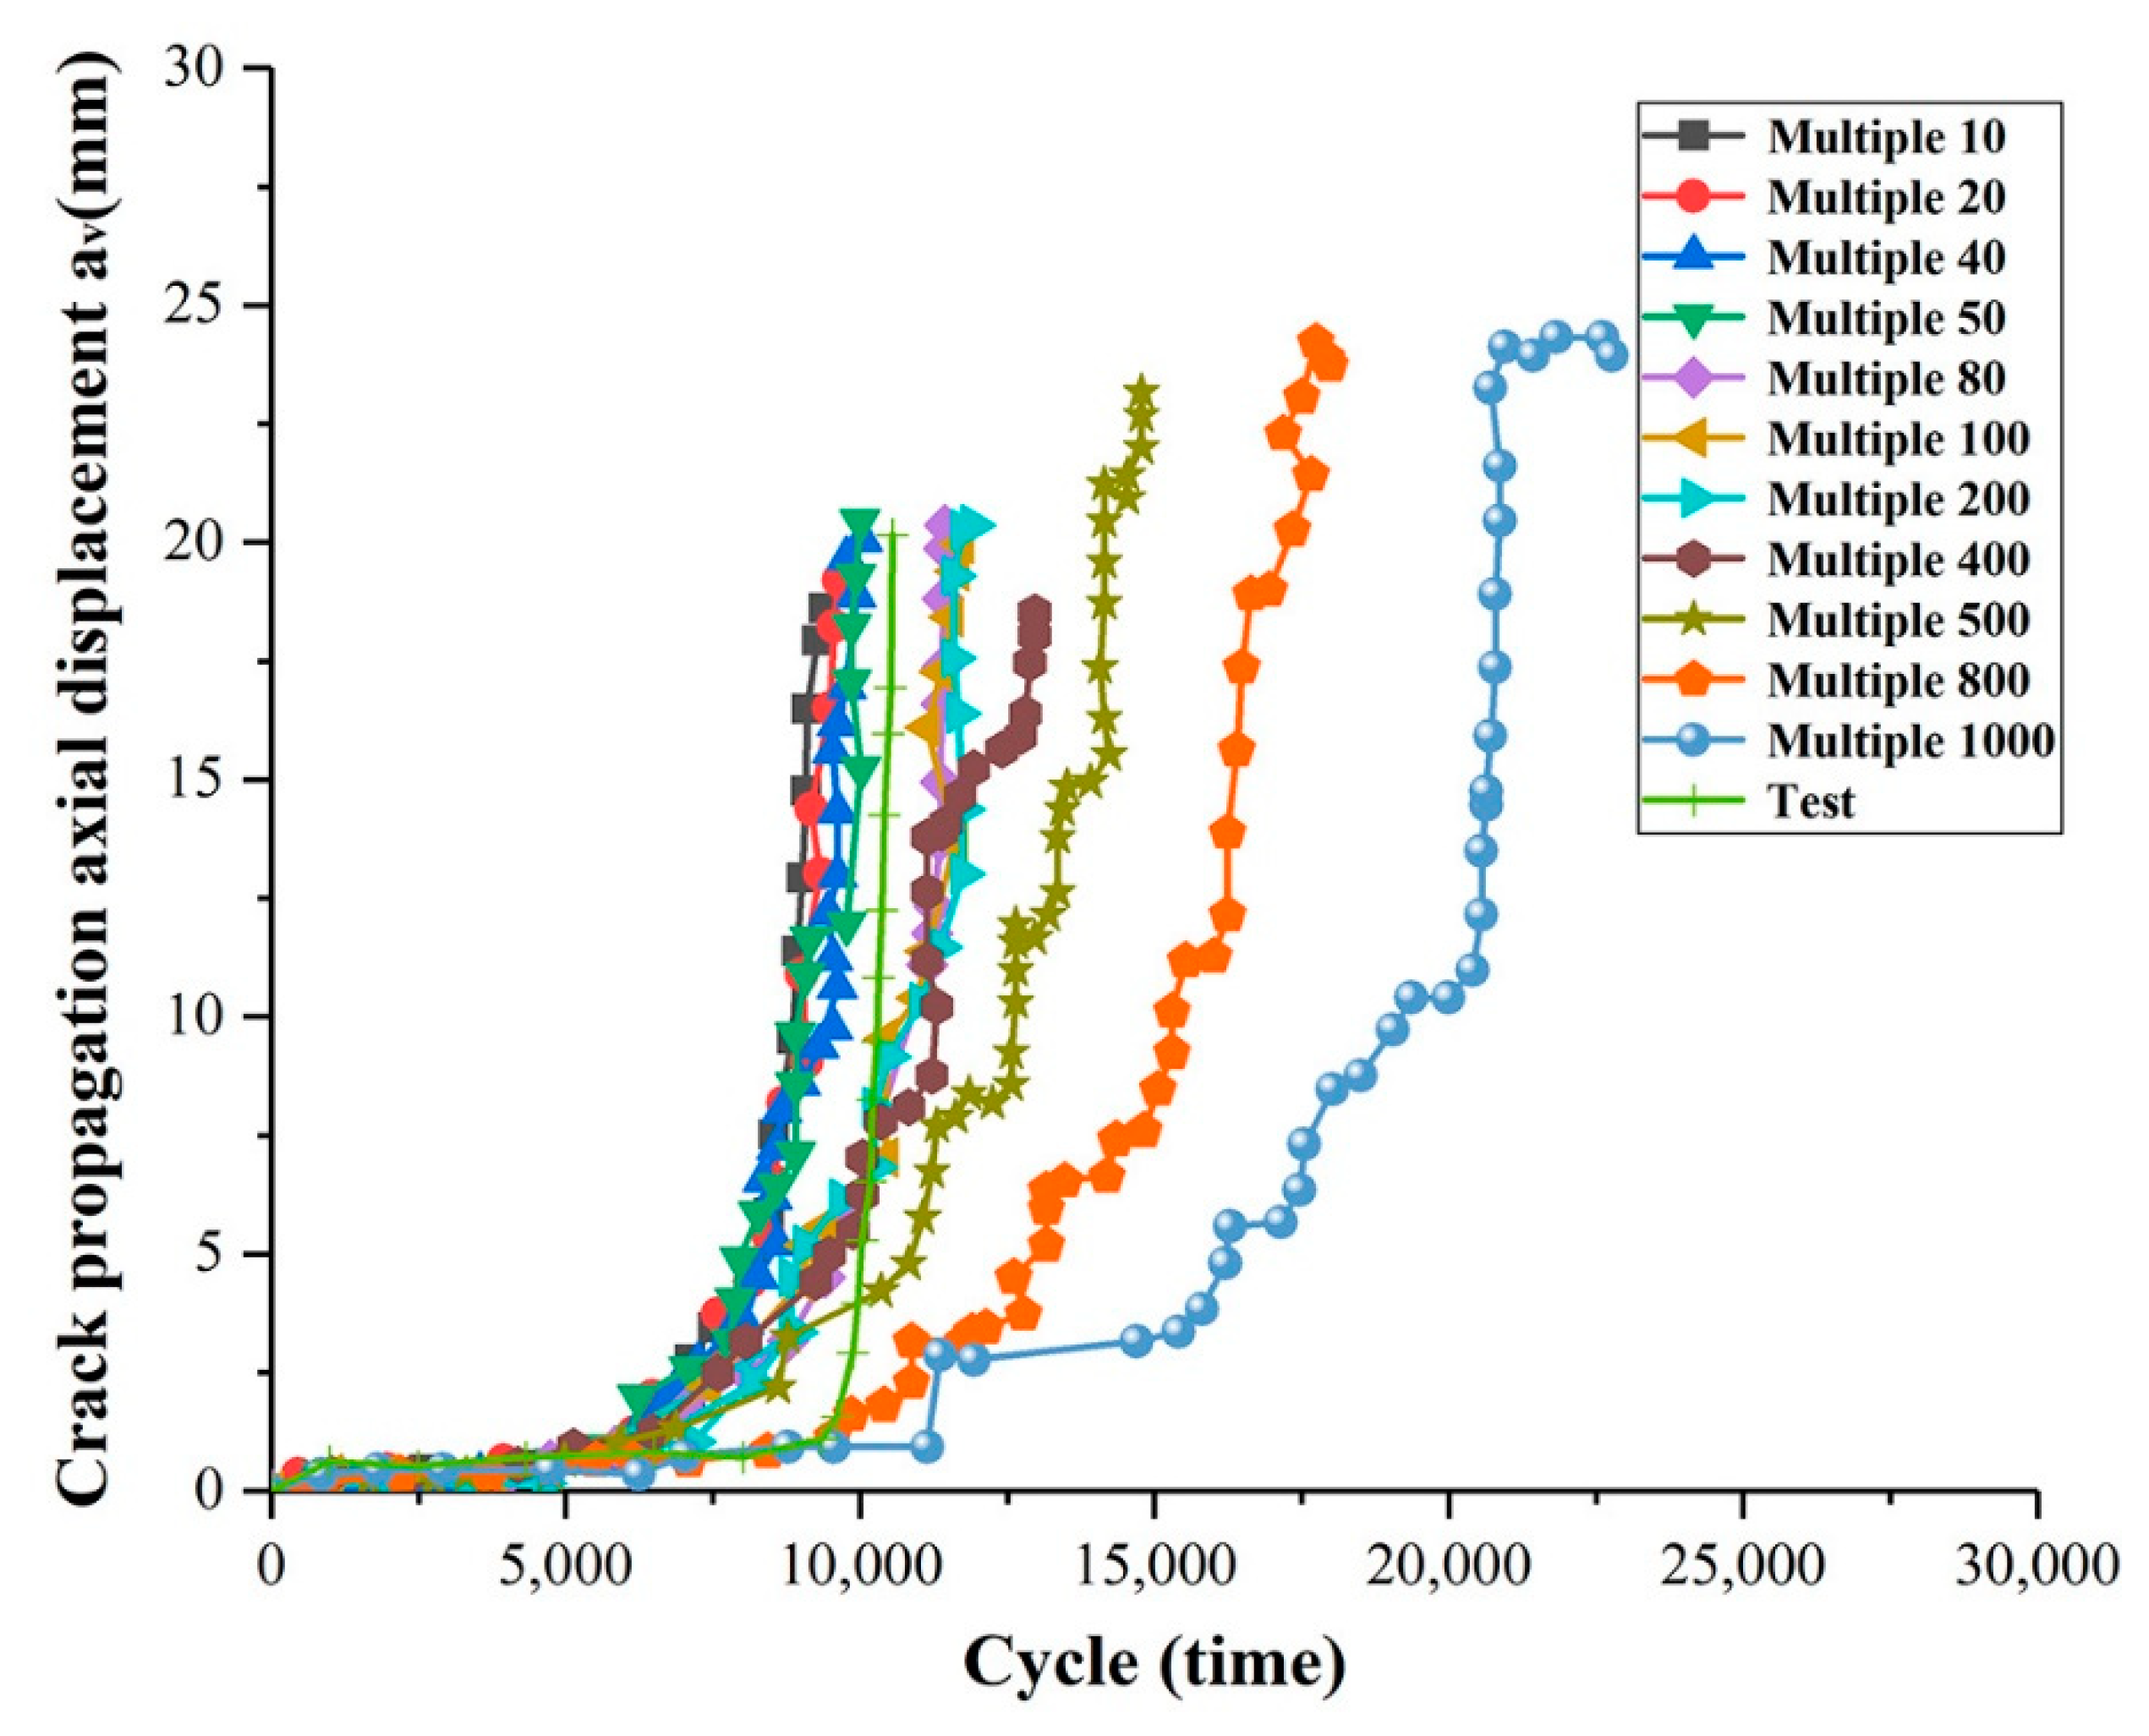
Figure 13 depicts the effect of different damage parameters’ magnifications on the a-N curve under a load range of 0.5–4.5 KN, frequency f = 5 Hz, and stress radio R = 0.11. Simulating the slow progressive damage process under multiple cyclic loads is an extremely slow process. Magnifications in this paper are the magnifications of the damage parameter in the damage extrapolation technique. Damage extrapolation magnification is to amplify a cycle of a cycle and then extrapolate it to the next few cycles, instead of multiple cycles, which can shorten the calculation time. However, the results obtained after amplification may have certain tolerance, so the tolerance of the results needs to be studied at different magnifications. Table 8 summarizes the percentage deviation between fatigue life of CT specimens and experimental data at different magnifications. It shows that, when the damage magnification is below 40, the fatigue life increases with the increase of the magnification, and the deviation of the fatigue life between the simulation and the experiment is gradually reduced. When the damage magnification is higher than 40, the fatigue life increases as the magnification increases, but the deviation between the simulation and the experiment also increases. It can be seen from Table 8 that, when the magnifications are 10, 20, 40, 50, 80, 100, and 200, the percentage deviation between fatigue life of CT specimens and experimental data is less than 20%, while when the magnifications are 400, 500, 800, and 1000, the deviation is greater than 20%. The experiment and simulation match well when the magnification is 10, 20, 40, 50, 80, 100, and 200, and the fit is poor when the magnification is 400, 500, 800, and 1000. Finally, the magnification of 100 was selected as the most suitable magnification.

4.4. Simulated Results Based on Bilinear CZM

Under the condition of loading range of 0.5–4.5 KN, loading frequency of f = 5 Hz, and stress ratio R = 0.11, the stress distributions of the CT specimen in the process of fatigue crack propagation were obtained. We selected several status points at cycles N = 100, 12,000, 14,000, 16,000, 17,000, and 17,200 for analysis, as shown in Figure 14a–f. There is a severe stress concentration at the tip of the incision, so the Mises stress is greatest in the incision and its enrichment region. It shows that the first cohesive element has a complete fracture failure after about 12,000 cycles. This process is relatively long compared to the whole process. Figure 14b–e illustrates that the crack propagates at a relatively constant speed for a period of time. After that, the crack growth rate increases sharply in a short period of time. Then the CT specimen reaches the crack propagation threshold and breaks at N = 17,200, and the simulation ends.
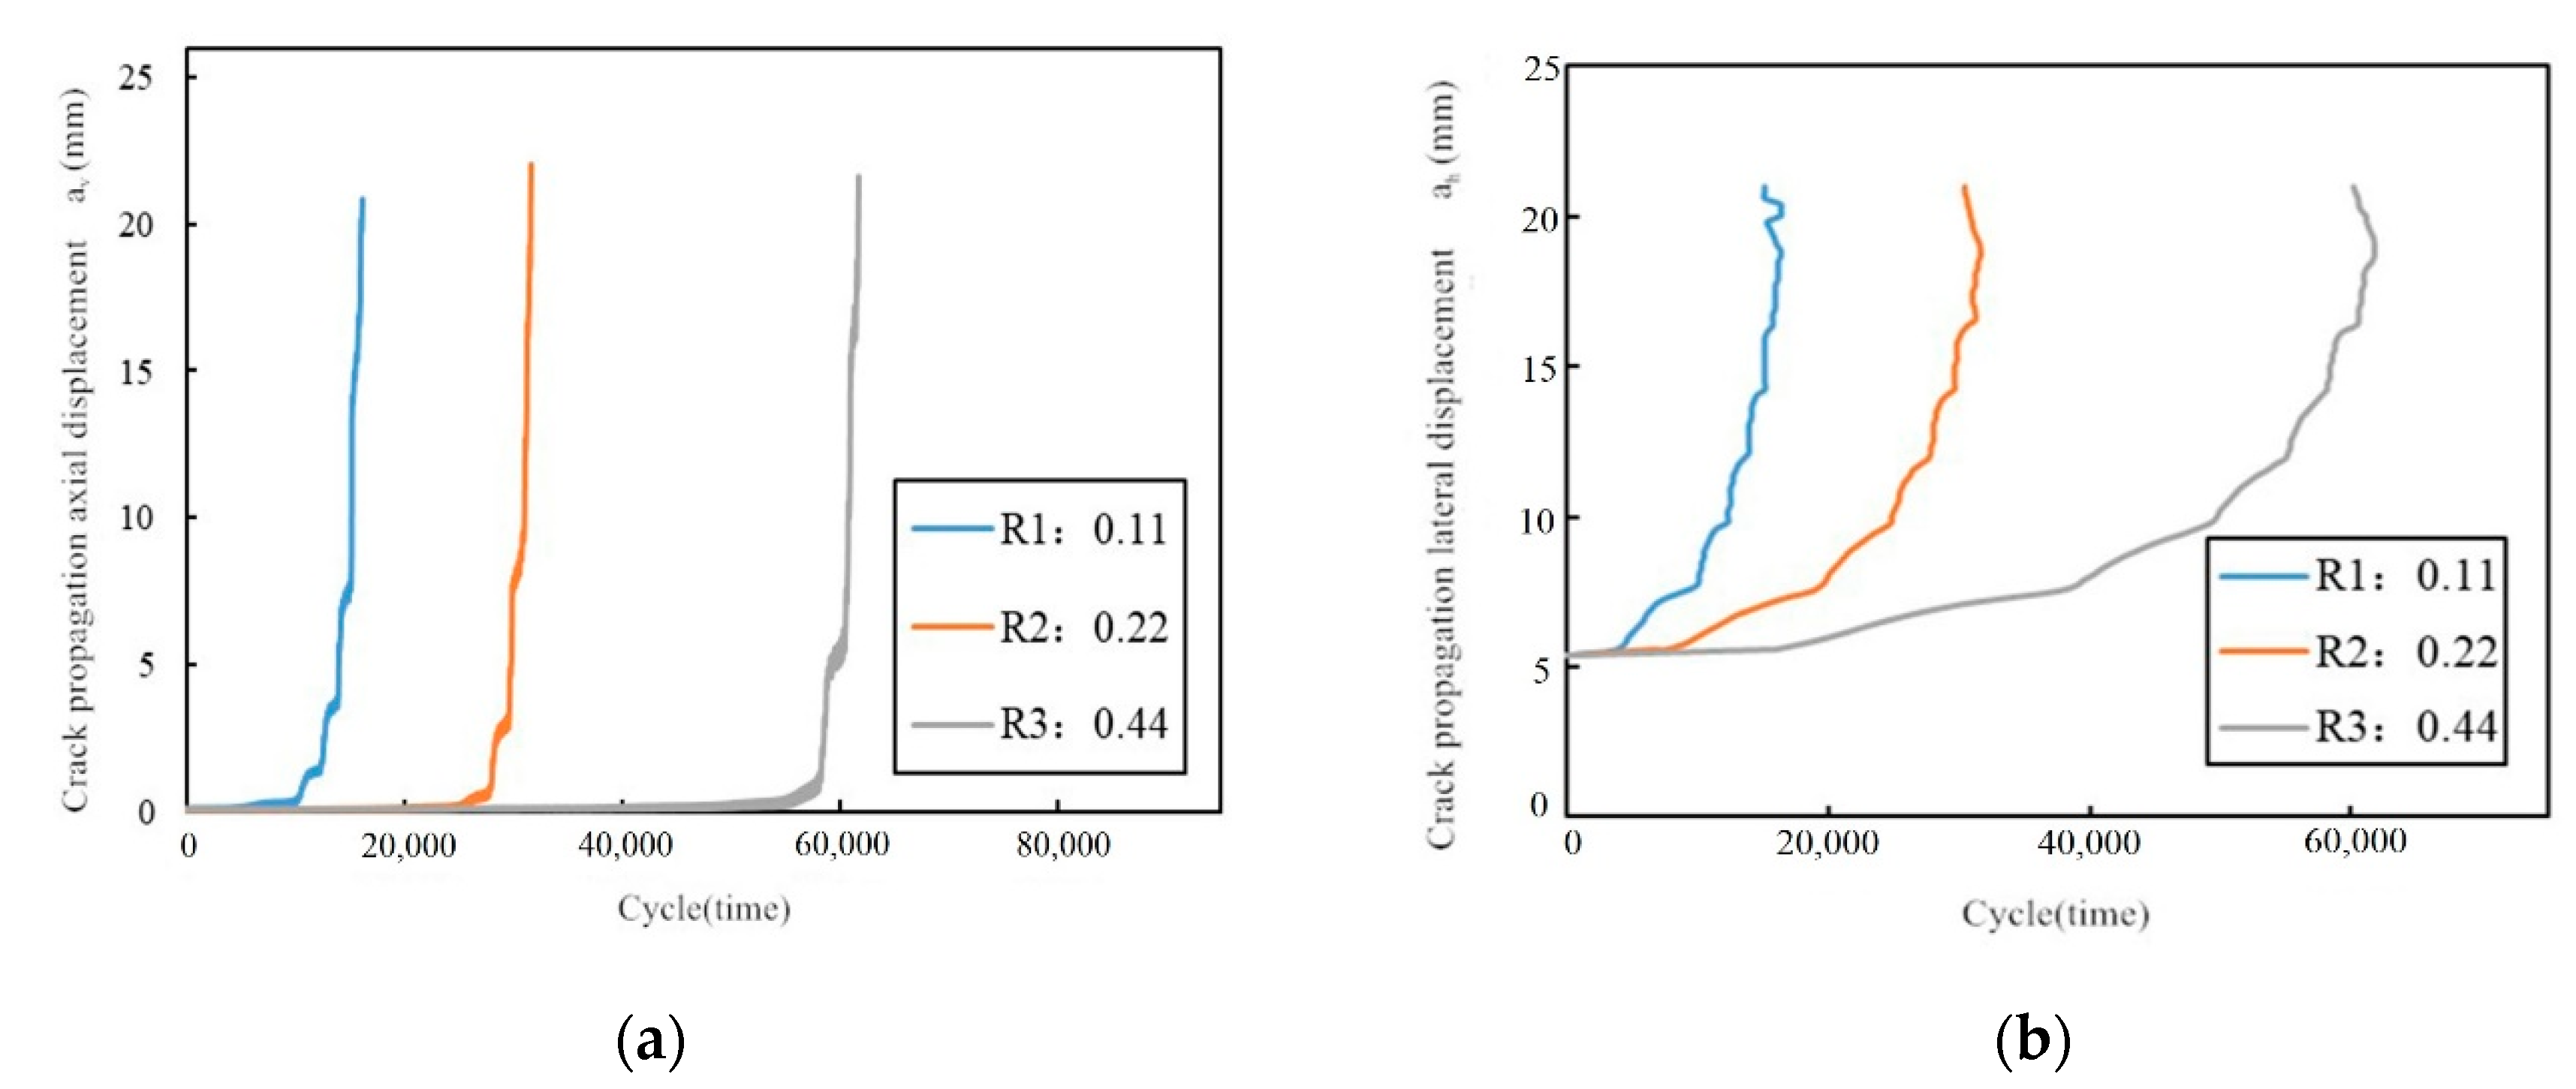
Under the condition that the damage parameter’s magnification was 100, the influence of the stress ratio on the a-N curve in the low cycle fatigue simulation of CT specimen was obtained, as shown in Figure 15. It shows that both the av-N curve and the ah-N curve can clearly indicate the effect of stress ratio, R, on fatigue life. The abscissa of Figure 15a,b represents the number of cycles, that is, the fatigue life. It can be seen from Figure 15a,b, as the stress ratio, R, increases, the final number of cycles also increases, that is, the fatigue life increases. The larger the stress ratio, R, is, the smaller the crack propagation rate is, and the longer the time required for the CT specimen to completely break, that is, the longer the crack fatigue life is.
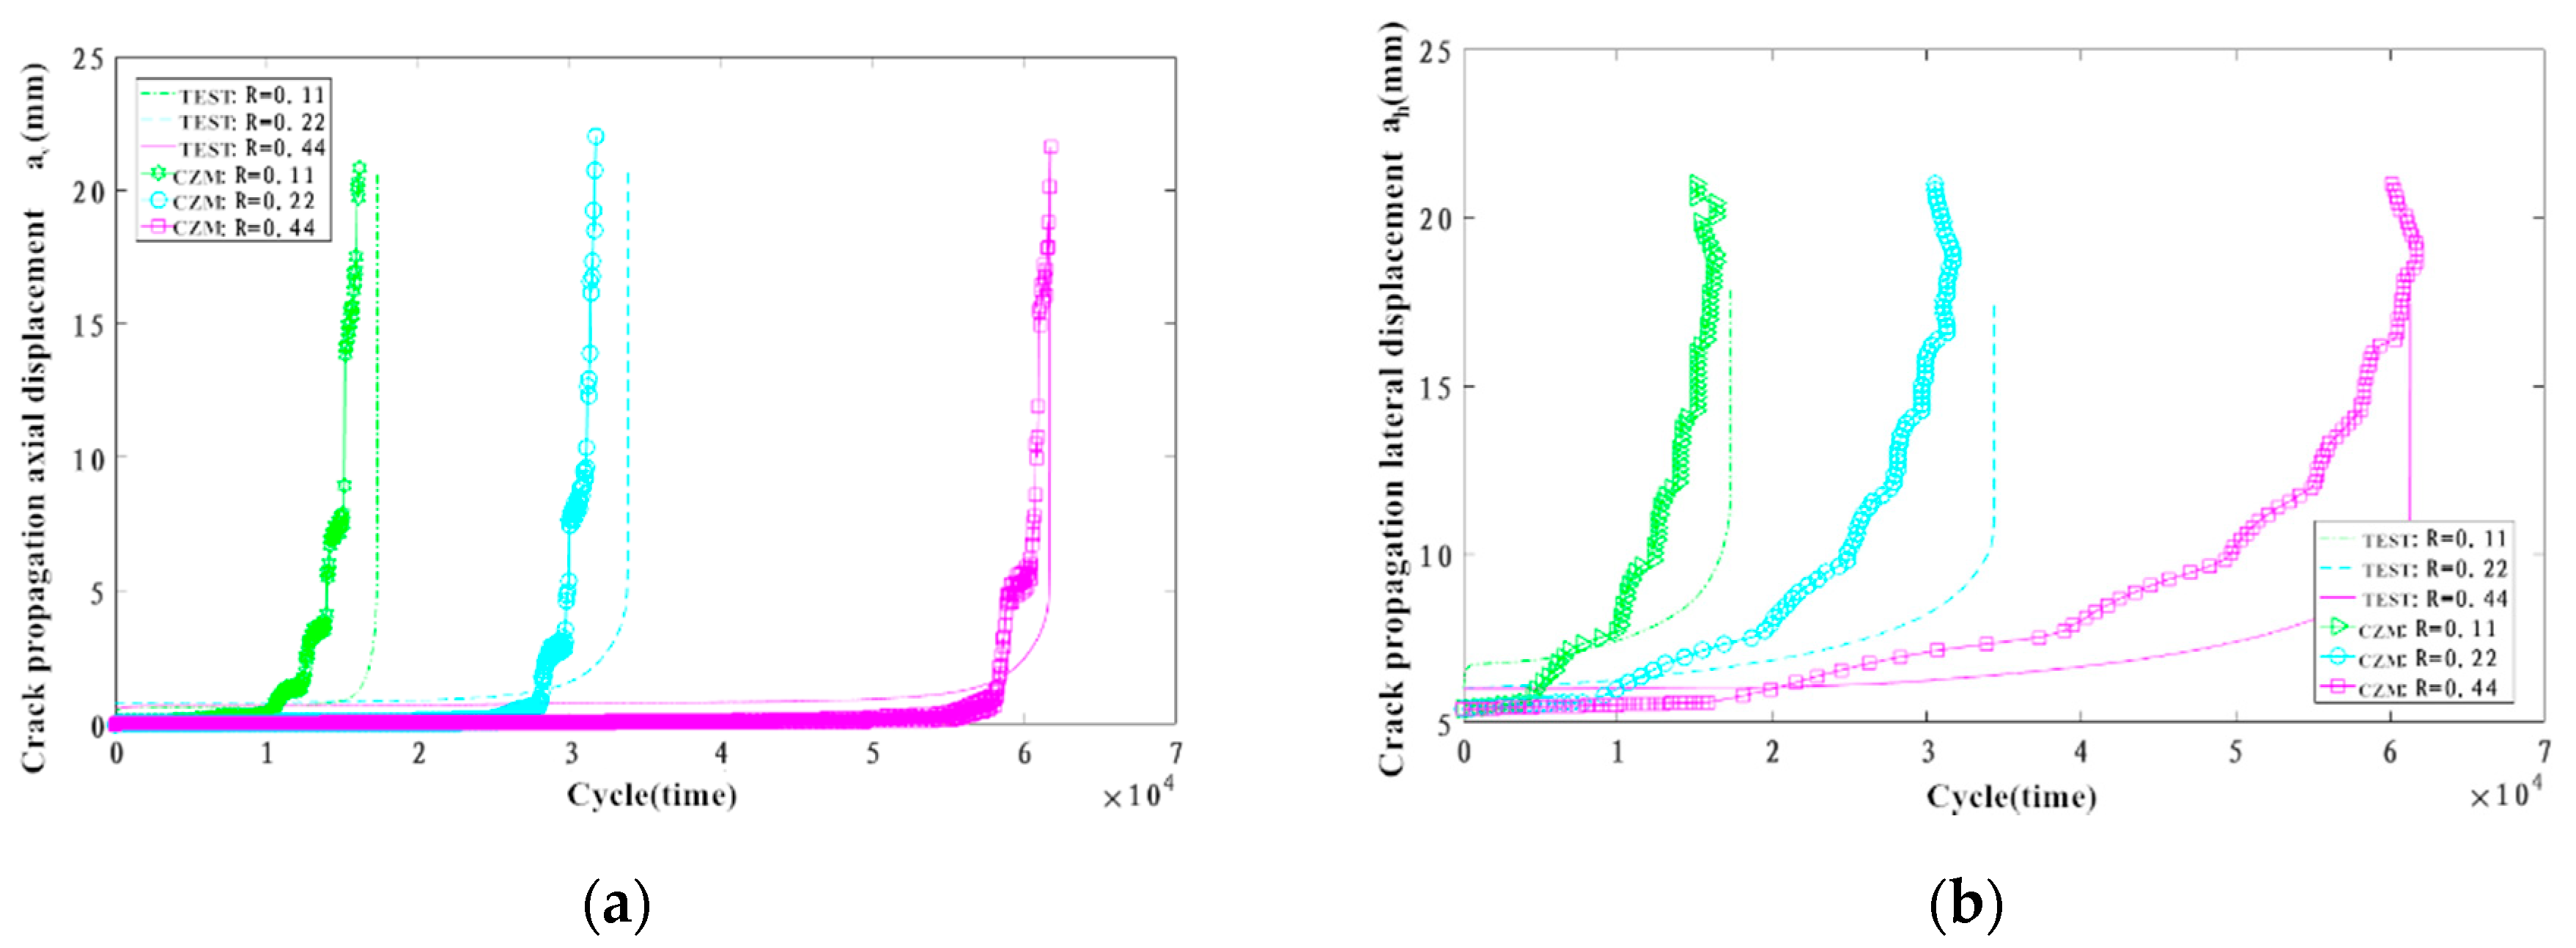
The simulated results are compared with experimentally measured a-N curves at different stress ratios. The results are shown in Figure 16 and Table 9. There are some deviations between the simulated and experimental curves in Figure 16. In the crack stability expansion stage, the axial and lateral crack propagation lengths simulated under the same cycle times are smaller than those measured by the experiments. In the crack rapid rupture period, the crack propagation speed obtained by the simulation is greater than that measured by the experiments. From the data listed in Table 9, the simulated fatigue life is close to the experimentally measured fatigue life at the same stress ratio. Overall, the CZM simulation results are in good agreement with the experimental data.
Figure 17 shows the comparison of experimental data with XFEM and CZM simulations results under the same conditions with a loading range of 0.5–4.5 KN, loading frequency of f = 5 Hz, and stress ratio R = 0.11. It can be seen from Figure 17 that the simulated results with the XFEM are in good agreement with the experimental data in the crack stability extension period. However, there are some deviations in the crack nucleation period. Compared to XFEM, the CZM can predict the fatigue crack propagation life better.

5. Conclusions

Based on the analysis of the experimental results and the simulated results with two different methods, XFEM and CZM, some conclusions about the research content of this paper are obtained:
(1)
The difference between the fatigue life of CT specimens measured at different frequencies, f, was small in this experiment, revealing that the f has little effect on the fatigue life. The smaller the stress ratio, R, is, the faster the crack propagates steadily, and the smaller the fatigue life, N, is.
(2)
The simulated results with the XFEM are in good agreement with the experimental data in the crack stability extension period. However, there are some deviations in the crack nucleation period. Moreover, the simulated and experimental data in the crack rapid rupture period are quite different. Therefore, the crack propagation path simulated by the XFEM model agrees well with the experimental result, but the predicted fatigue life is not accurate.
(3)
The simulated results by the CZM were compared with the experimental results at different stress ratios, R. Results show that the CZM can predict the fatigue crack propagation life very well in this paper, but it has certain limitations because the crack propagation path is preset. However, if all elements’ sides have CZM property, and FE mesh is reasonably fine, predefinition of crack path should not be required to predict a crack path of growing crack.

Author Contributions

Conceptualization and writing—review and editing, X.H.; investigation and writing—original draft, J.X.; methodology and resources, Y.Z.; software, X.D.; conceptualization and writing—review and editing, F.Z. All authors have read and agreed to the published version of the manuscript.

Funding

The authors gratefully acknowledge the support provided by the National Natural Science Foundation of China (No. 51905544), Fundamental Research Funds for the Central Universities (No. 18CX02147A), and Natural Science Foundation of Shandong Province (No. ZR2019BEE061).

Conflicts of Interest

The authors declare no conflict of interest. The funders had no role in the design of the study; in the collection, analyses, or interpretation of data; in the writing of the manuscript; or in the decision to publish the results.

References

  1. Belytschko, T.; Black, T. Elastic crack growth in finite elements with minimal remeshing. Int. J. Numer. Methods Eng. 1999, 45, 601–620. [Google Scholar] [CrossRef]
  2. Daux, C.; Nicolas, M.; Dolbow, J.; Sukumar, N.; Belytschko, T. Arbitrary branched and intersecting cracks with the extended finite element method. Int. J. Numer. Methods Eng. 2000, 48, 1741–1760. [Google Scholar] [CrossRef]
  3. Sukumar, N.; Prévost, J.-H. Modeling quasi-static crack growth with the extended finite element method Part I: Computer implementation. Int. J. Solids Struct. 2003, 40, 7513–7537. [Google Scholar] [CrossRef]
  4. Bordas, S.; Nguyen, P.V.; Dunant, C.; Guidoum, A.; Nguyen-Dang, H. An extended finite element library. Int. J. Numer. Methods Eng. 2007, 71, 703–732. [Google Scholar] [CrossRef] [Green Version]
  5. Wyart, E.; Duflot, M.; Coulon, D.; Martiny, P.; Pardoen, T.; Remacle, J.-F.; Lani, F. Substructuring FE–XFE approaches applied to three-dimensional crack propagation. J. Comput. Appl. Math. 2008, 215, 626–638. [Google Scholar] [CrossRef] [Green Version]
  6. Giner, E.; Sukumar, N.; Tarancón, J.E.; Fuenmayor, F.; Fernández, F.J.F. An Abaqus implementation of the extended finite element method. Eng. Fract. Mech. 2009, 76, 347–368. [Google Scholar] [CrossRef] [Green Version]
  7. Shi, J.; Chopp, D.; Lua, J.; Sukumar, N.; Belytschko, T. Abaqus implementation of extended finite element method using a level set representation for three-dimensional fatigue crack growth and life predictions. Eng. Fract. Mech. 2010, 77, 2840–2863. [Google Scholar] [CrossRef] [Green Version]
  8. Cheng, L.; Luo, Z.; Yu, Y.; Zhao, L.; Zhou, C. Study on the interaction mechanism between hydraulic fracture and natural karst cave with the extended finite element method. Eng. Fract. Mech. 2019, 222, 106680. [Google Scholar] [CrossRef]
  9. Mishra, R.; Burela, R.G. Thermo-electro-mechanical fatigue crack growth simulation in piezoelectric solids using XFEM approach. Theor. Appl. Fract. Mech. 2019, 104, 102388. [Google Scholar] [CrossRef]
  10. Abdullah, N.A.; Akbar, M.; Wirawan, N.; Curiel-Sosa, J.L. Structural integrity assessment on cracked composites interaction with aeroelastic constraint by means of XFEM. Compos. Struct. 2019, 229, 111414. [Google Scholar] [CrossRef]
  11. Elruby, A.; Nakhla, S. Strain energy density based damage initiation in heavily cross-linked epoxy using XFEM. Theor. Appl. Fract. Mech. 2019, 103, 102254. [Google Scholar] [CrossRef]
  12. Leonov, M.Y.; Panasyuk, V.V. The development of the smallest crack in solids. J. Prykl. Mesh. 1959, 5, 391–401. [Google Scholar]
  13. Dugdale, D.S. Yielding of steel sheets containing slits. J. Mech. Phys. Solids 1960, 8, 100–104. [Google Scholar] [CrossRef]
  14. Barenblatt, G.I. The Mathematical Theory of Equi-librium Cracks in Brittle Fracture. Adv. Appl. Mech. 1962, 7, 55–129. [Google Scholar]
  15. Camacho, G.T.; Ortiz, M. Computational modelling of impact damage in brittle materials. Int. J. Solids Struct. 1996, 33, 2899–2938. [Google Scholar] [CrossRef]
  16. Ghodrati, M.; Ahmadian, M.; Mirzaeifar, R. Three-dimensional study of rolling contact fatigue using crystal plasticity and cohesive zone method. Int. J. Fatigue 2019, 128, 105208. [Google Scholar] [CrossRef]
  17. Ghovanlou, M.K.; Jahed, H.; Khajepour, A. Cohesive zone modeling of fatigue crack growth in brazed joints. Eng. Fract. Mech. 2014, 120, 43–59. [Google Scholar] [CrossRef] [Green Version]
  18. Feng, Y.; Mei, D.; Wang, Y. Cohesive zone method based multi particle finite element simulation of compaction densification process of Al and NaCl laminar composite powders. J. Phys. Chem. Solids 2019, 134, 35–42. [Google Scholar] [CrossRef]
  19. De-Andrés, A.; Pérez, J.; Ortiz, M. Elastoplastic finite element analysis of three-dimensional fatigue crack growth in aluminum shafts subjected to axial loading. Int. J. Solids Struct. 1999, 36, 2231–2258. [Google Scholar] [CrossRef]
  20. Roe, K.L.; Siegmund, T. An irreversible cohesive zone model for interface fatigue crack growth simulation. Eng. Fract. Mech. 2003, 70, 209–232. [Google Scholar] [CrossRef]
  21. Enayatpour, S.; Van Oort, E.; Patzek, T. Thermal shale fracturing simulation using the Cohesive Zone Method (CZM). J. Nat. Gas Sci. Eng. 2018, 55, 476–494. [Google Scholar] [CrossRef]
  22. Chen, D.; Li, G.; Wang, Y.; Xiao, Q. Research on fatigue crack propagation of a T-joint based on XFEM and TSA. Eng. Fract. Mech. 2019, 222, 106707. [Google Scholar] [CrossRef]
  23. Heidari-Rarani, M.; Sayedain, M. Finite element modeling strategies for 2D and 3D delamination propagation in composite DCB specimens using VCCT, CZM and XFEM approaches. Theor. Appl. Fract. Mech. 2019, 103, 102246. [Google Scholar] [CrossRef]
  24. Li, Y.; Li, X. A study of the numerical simulation technique for fatigue crack closure. Mech. Sci. Technol. 2006, 25, 1233–1237. [Google Scholar]
  25. Wang, Z.; Yu, T. A multiscale extended finite element method for modeling three-dimensional crack problems. Rock Soil Mech. 2014, 35, 2702–2708. [Google Scholar]
  26. He, L.; Liu, Z.; Gu, J.; Wang, J.; Men, K. Fatigue Crack Propagation Path and Life Prediction Based on XFEM. J. Northwest. Polytech. Univ. 2019, 37, 737–743. [Google Scholar] [CrossRef]
  27. Turon, A.; Dávila, C.G.; Camanho, P.P.; Costa, J. An engineering solution for mesh size effects in the simulation of delamination using cohesive zone models. Eng. Fract. Mech. 2006, 74, 1665–1682. [Google Scholar] [CrossRef]
  28. Zhou, F.; Molinari, J.; Shioya, T. A rate-dependent cohesive model for simulating dynamic crack propagation in brittle materials. Eng. Fract. Mech. 2004, 72, 1383–1410. [Google Scholar] [CrossRef]
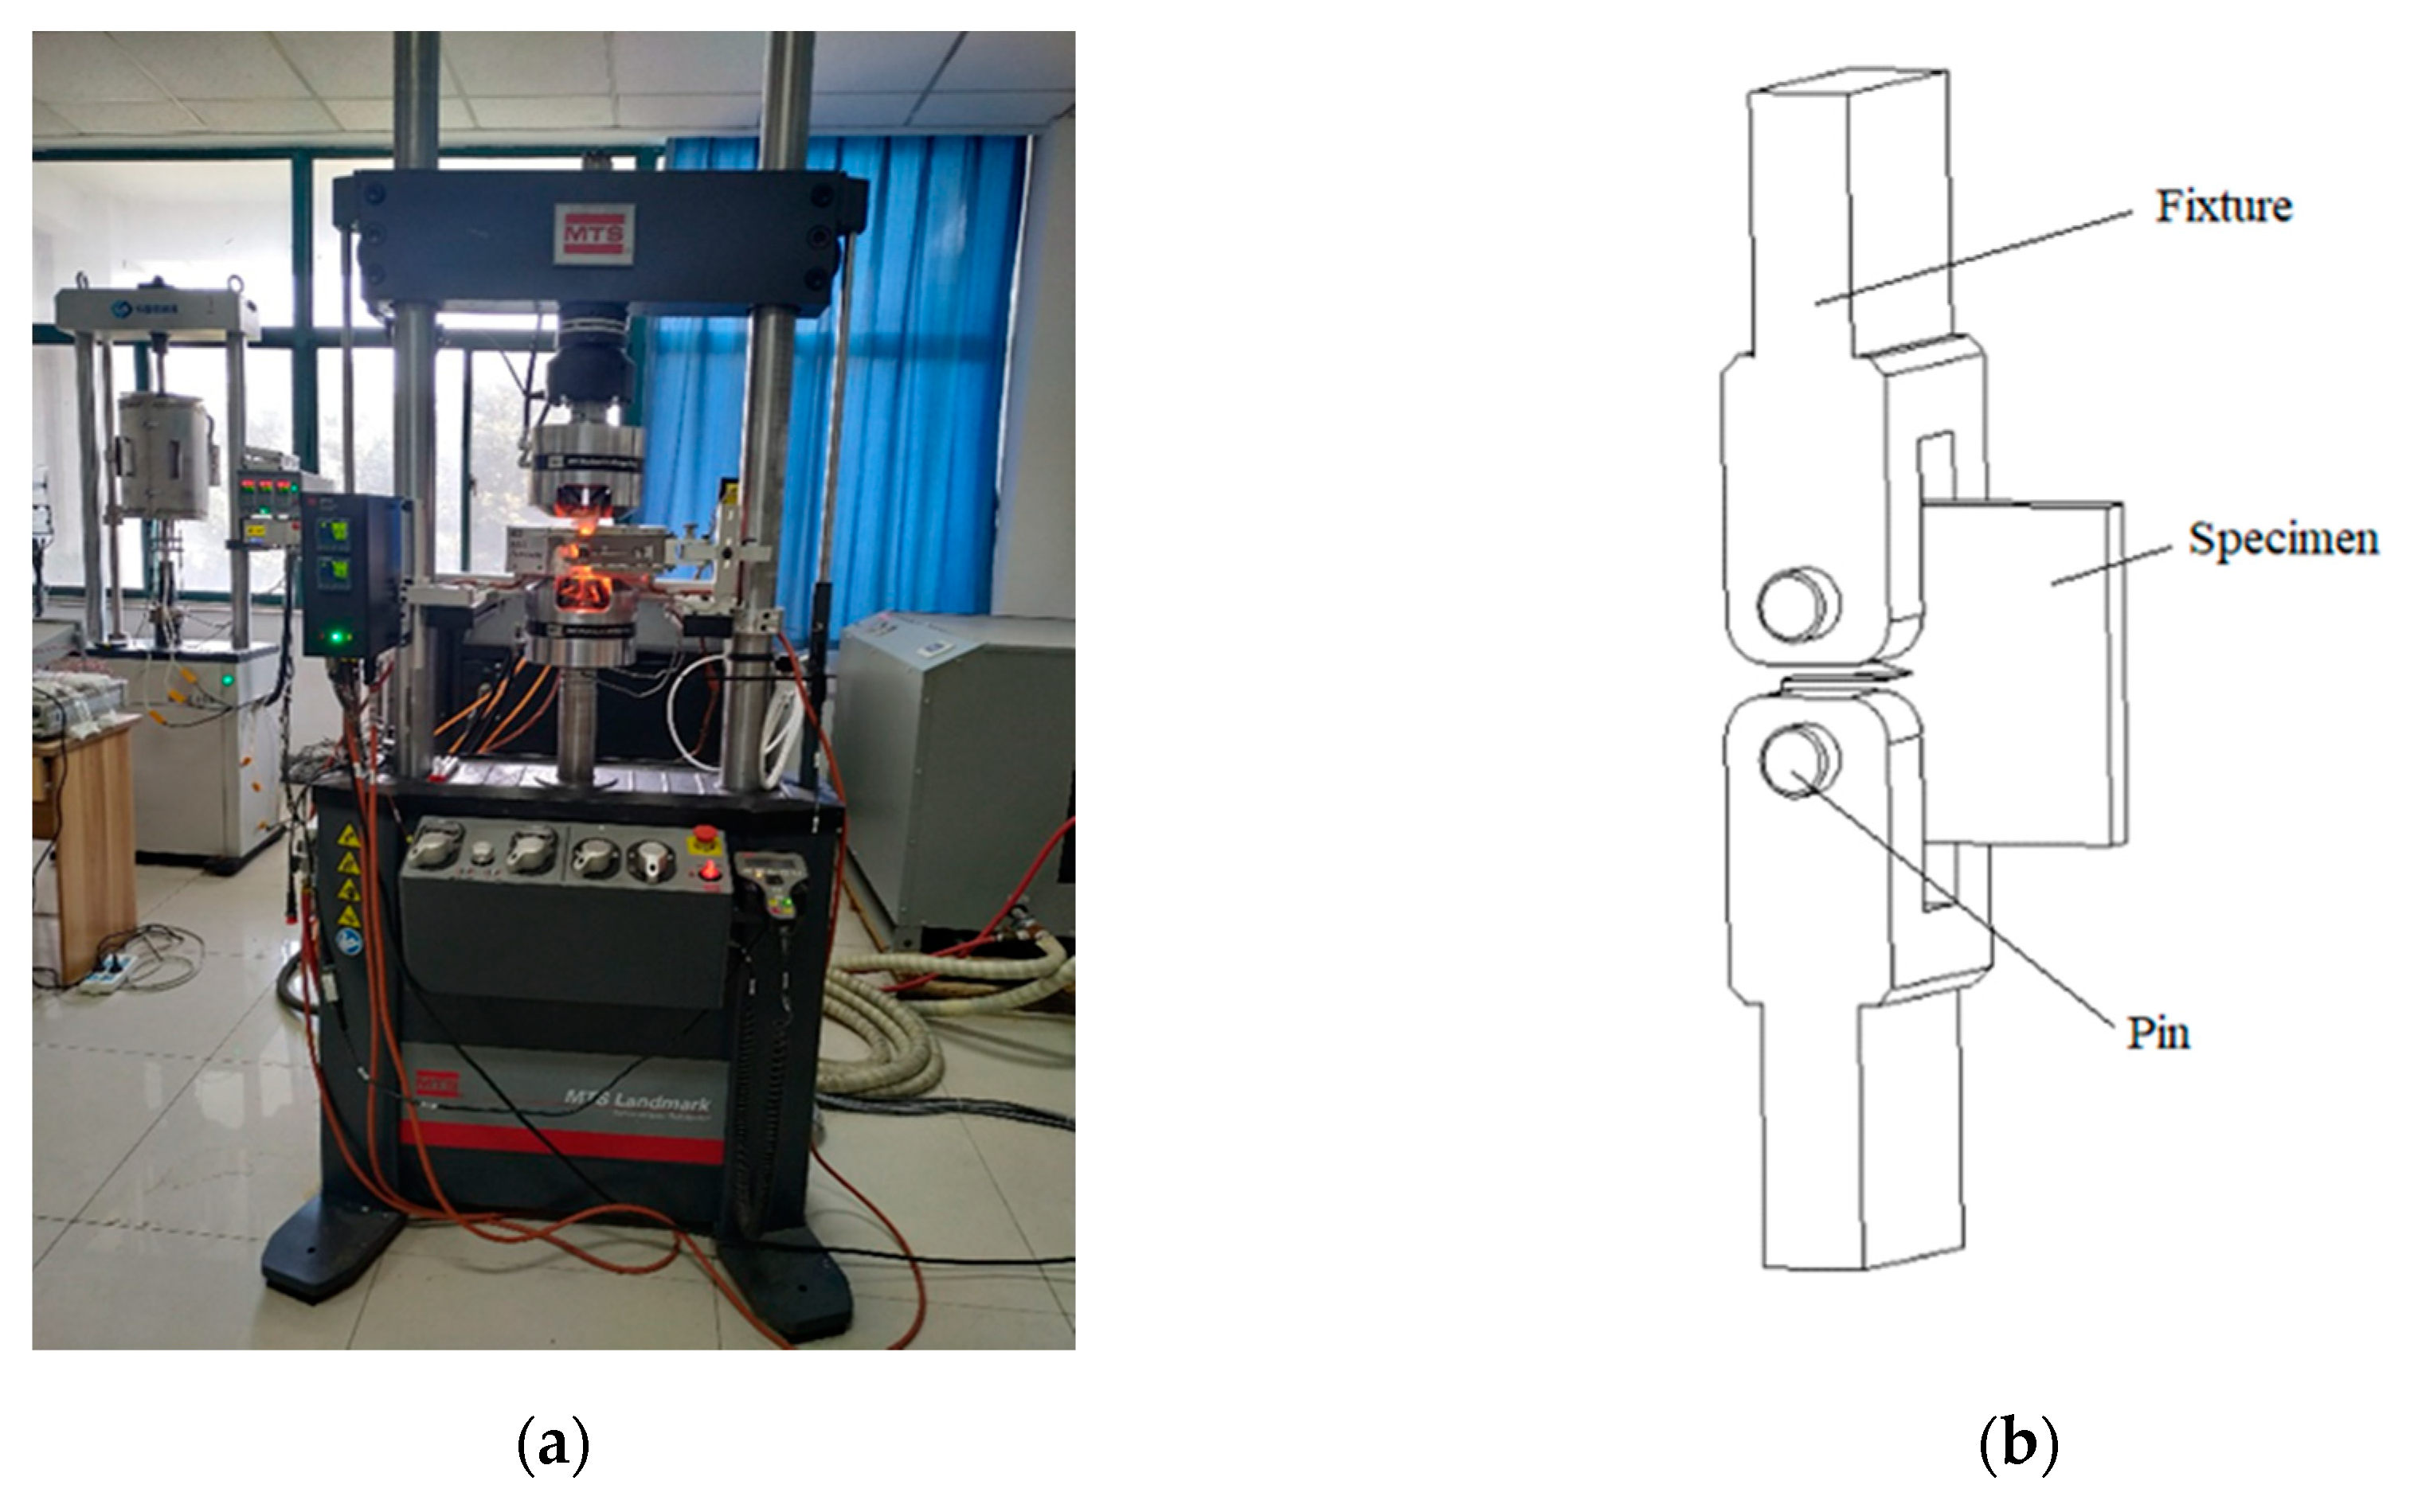
Figure 1. (a) MTS Landmark 370.10 hydraulic servo fatigue testing machine. (b) Compact tension specimen and relevant components.
Metals 10 00727 g001
Figure 2. (a) Physical map of compact tensilespecimen for fatigue tensile test. (b) Size drawing of CT specimen for fatigue tensile test.
Metals 10 00727 g002aMetals 10 00727 g002b
Figure 3. The presentations of CT specimens after fatigue tensile testing.
Metals 10 00727 g003
Figure 4. Crack lengths under different frequencies and stress ratios (a) in the axial direction and (b) in the lateral direction.
Metals 10 00727 g004
Figure 5. The curve of crack growth rate.
Metals 10 00727 g005
Figure 6. Three-dimensional model of CT specimen.
Metals 10 00727 g006
Figure 7. Mises stress contours at different times: (a) t = 0.0 s; (b) t = 0.5 s; (c) t = 12.5 s; (d) t = 31.5 s; (e) t = 36.5 s; and (f) t = 40.5 s.
Metals 10 00727 g007
Figure 8. The contrast of a-N curves between XFEM simulation and experiment results.
Metals 10 00727 g008
Figure 9. Principle of bilinear CZM.
Metals 10 00727 g009
Figure 10. Flowchart of VUMAT based on CZM.
Metals 10 00727 g010
Figure 11. The interaction, boundary conditions (BCs), and load condition for CT specimen.
Metals 10 00727 g011
Figure 12. The effect of mesh discretization of cohesive elements on av-N curves.
Metals 10 00727 g012
Figure 13. The effect of damage parameter’s magnification on av-N curves of CT specimen.
Metals 10 00727 g013
Figure 14. Contours of CT specimen’s Mises stress distributions based on bilinear CZM: at N = 100 (a), at N = 12000 (b), at N = 14000 (c), at N = 16000 (d), at N = 17000 (e), and at N = 17200 (f).
Metals 10 00727 g014
Figure 15. (a) The effect of stress ratio on av-N curves. (b) The effect of stress ratio on ah-N curves.
Metals 10 00727 g015
Figure 16. (a) The contrast of av-N curves at different stress ratios between CZM simulation and experiment. (b) The contrast of ah-N curves at different stress ratios between CZM simulation and experiment.
Metals 10 00727 g016
Figure 17. Comparison of experimental data with XFEM and CZM simulation results.
Metals 10 00727 g017
Table 1. The variable control groups in fatigue tensile test.
VariableValues of Control Group Parameters
Frequency5 Hz2 Hz1 Hz
Stress ratio0.110.220.44
Table 2. Fatigue life of CT specimens under different frequencies and stress ratios.
VariableAxial Fatigue Life (N)Lateral Fatigue Life (N)Average Life (N)
f = 5 Hz11,24710,87511,061
f = 2 Hz10,02310,11610,070
f = 0.5 Hz10,08210,89210,487
R = 0.1117,26917,29417,282
R = 0.2233,81134,35834,085
R = 0.4461,67861,30961,494
Table 3. Different values of force in two analysis steps.
StepFirst Analysis StepSecond Analysis Step
Time (s)00.5100.51
Force (N)010,0005005005000500
Table 4. Fatigue life of CT specimen in different mesh discretization of XFEM model.
Mesh Size0.5 mm0.6 mm0.7 mm0.8 mm0.9 mm1.0 mm1.1 mm1.2 mm
Fatigue life11,78011,73011,62011,69011,67011,58011,75011,700
Percentage of deviation11.8%11.3%10.2%10.9%10.7%9.8%11.5%11%
Table 5. Different values of ΔK at different cycles.
Cycles (time)200500100040006000800010,00012,00015,00017,000
∆K (Mpa·m1/2)34.7238.0440.8144.5746.7949.0254.4463.1569.7884.28
Table 6. The relationship between yield stress and plastic strain.
Plastic StrainYield Stress (Mpa)
0180
0.01191.1
0.02239.5
0.03277.7
0.04310.6
0.05340.3
0.06367.6
0.07363.1
0.08417.2
0.09440.1
0.1550
0.21000
0.53000
210,000
Table 7. Fatigue life of CT specimen in different mesh discretization of cohesive elements.
Mesh Size0.1 mm0.15 mm0.2 mm0.25 mm0.3 mm0.35 mm
Fatigue life11,60011,75010,97012,10012,70013,250
Percentage of deviation10.1%11.5%4.1%14.8%20.5%25.7%
Table 8. Fatigue life of CT specimen at different magnification of damage parameter.
MultipleFatigue LifePercentage of Deviation
10937011.1%
2096408.5%
4010,0404.7%
5010,0005.1%
8011,4408.5%
10011,70011.0%
20011,92013.1%
40012,90022.4%
50014,82040.6%
80017,92070.0%
100022,800116.3%
Table 9. The contrast of fatigue life at different stress ratios between CZM simulation and experiment.
Stress Ratio (R)Experimental Fatigue Life (N)CZM Simulation Fatigue Life (N)Deviation
0.1117,28216,1006.8%
0.2234,08531,7007.0%
0.4461,49461,7000.3%