Analysis of Samples Cleaning Methods Prior to Hydrogen Content Determination in Steel


Abstract
1. Introduction
- -
- -
- HELP (hydrogen-enhanced local plasticity): Accumulated hydrogen close to the crack tip eases dislocation movement under low stress levels because of the reduction in mechanical properties caused by hydrogen. The failure is due to a subcritical crack growth by microvoid coalescence [5].
- -
- AIDE (adsorption-induced dislocation emission): It is a combination of HEDE and HELP. Atomic hydrogen is absorbed in the most stressed areas (crack tip), which causes cohesive force weakening by HEDE mechanisms, and consequently subcritical crack propagation by HELP mechanisms. Failure occurs by the combined effects of cleavages and dislocations together with microvoid coalescence [6].
- -
- -
- -
2. Background about Sample Types and Cleaning Methodologies
2.1. Main Samples Geometries
- -
- Pins: The most commonly used, generally of a mass of between 0.5 and 2 g and cylindrical shape (generally twice or three times longer than its diameter).
- -
- Cylindrical bars: Having a much greater length than its diameter and a mass of between 5 and 10 g generally.
- -
- Metal powder: Normally used in cases of very high hydrogen contents, or when small amounts need to be used (price, toxicity, …).
2.2. Recommendations for Sampling Performance
2.3. Main Sample Cleaning Methods
- -
- The mechanical processes include scraping, blasting, and brushing, among others. These methods must be carefully performed and used only when chemical and electrolytic methods are not enough, or in combination with them. Appropriated grits or sand blast material must be carefully chosen in order not to introduce further contamination that can modify the results.
- -
- The chemical methods have been specified through “try and failure” (testing different solvents and different dipping times); the solvents most commonly employed are acetone, trichloroethylene, or hydrochloric acid (HCl). It is normally recommended to combine them with slight brushing, without metallic bristles (mechanical method), or ultrasounds alternatively repeating the chemical procedure and the brushing or ultrasounds. These methods can last for times regularly between seconds and a few minutes, and are usually applied at room temperature. It must be taken into account that the longer the method takes and the higher the cleaning temperature is, the more important the diffusion and inaccurate the result, for this reason shorter cleaning methods (around 1 min) tend to be preferred.
- -
- The electrolytic methods, often used when corrosion or strong superficial oxidation is present on the samples, do not apply to the case under study, as this paper focuses on the sample cleaning without any observable superficial corrosion or oxidation. The electrolytic methods, as the chemical ones, also include the use of brushing or ultrasounds before and after the electrolytic cleaning. To correct the metal loss caused by its use, the standard ASTM G1 [17] recommends using a simple graphic method to differentiate the metal loss due to the cleaning process, or using control samples without corrosion to be able to measure afterwards the mass taken away by the cleaning process.
3. Materials and Methodology
3.1. Materials Employed
- -
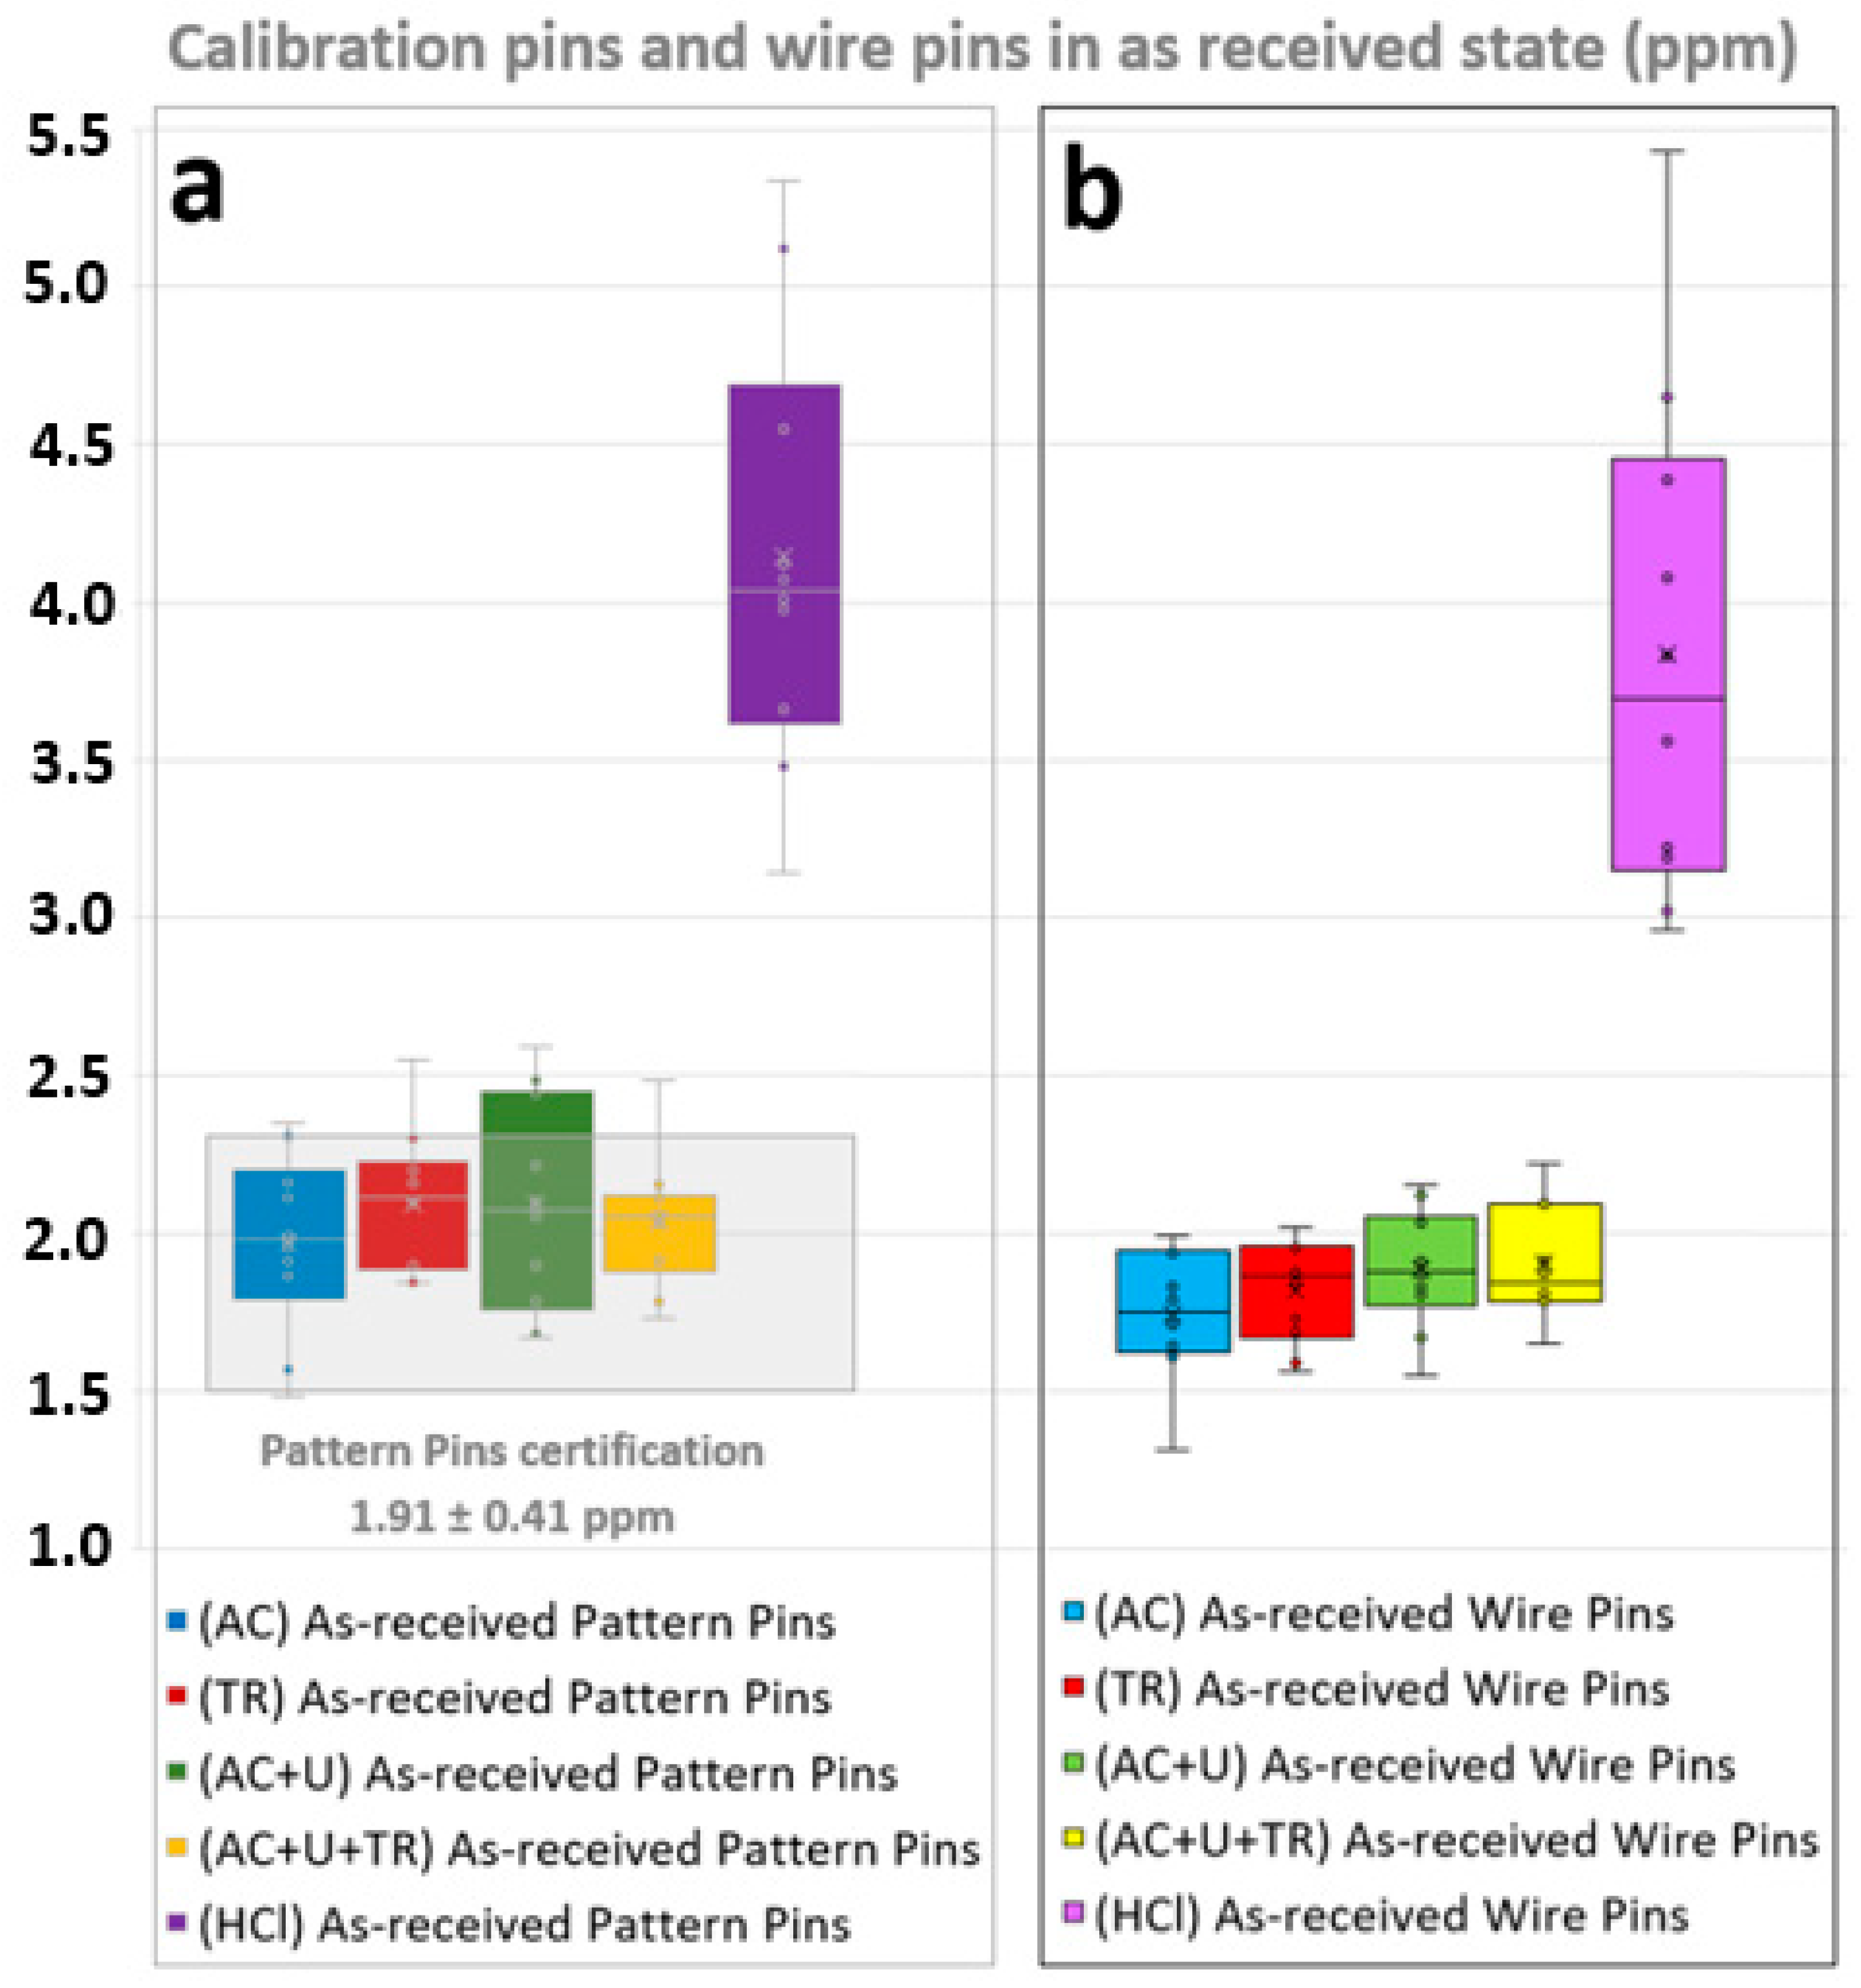
- Certified hydrogen content calibration pins (calibration pins). This material was supplied by the company LECOR under the reference “502-061” (which is equivalent to Eltra 91400-1002 and to ALPHA AR555) [18], and consisted of the electroplated cylindrical 1 g (0.989 ± 0.009 g) steel pins (10 mm long and 4 mm of diameter), which have a hydrogen content of 1.91 ± 0.41 ppm certified by the manufacturer. The diffusivity of this material is considered negligible as the pins are electroplated [12,13]. The calibration pins did not require any other previous preparation before application of the cleaning method prior to the hydrogen content tests. A total of 50 samples were employed.
- -
- High strength steel pins obtained from the central wire of a 5 mm of diameter 7 wire concrete prestressing strand (wire pins). A total of 90 cylindrical wire pins of around 2 g (12 mm long and 5 mm of diameter) were obtained, ergo 10 samples for testing each possibility to be studied (combination of cleaning methods and hydrogen charging conditions). To obtain the wire pins, it was first necessary to separate the central wire from the rest, and then clean it with lab paper and acetone to remove the dust and superficial remains of soap and grease from the manufacturing processes. The samples were visually checked and did not present any superficial corrosion products on them as, on the one side were manufactured the week prior to the tests performance, and on the other side the grease covering them prevented any corrosion. Nonetheless, in order to guarantee any corrosion at all, after degreased, the central wire was slightly sanded with #2000 sandpaper and cleaned again with lab paper and acetone and dried with air. Finally, the samples were cut in a precision metallographic cutter, removing the edges, which had suffered heating while being sampled by non-refrigerated means from the strand roll at the factory.
3.2. Hydrogen Charging Conditions Studied
3.3. Proposed Cleaning Methods
- -
- Simple acetone method (AC). This method starts by degreasing the samples with ethanol (C2H5OH v/v: 95.1–96.9%, for analysis), placing them on a paper and spraying it over them. The samples are then dried with cellulose paper and air; after this no more direct hand touching is permitted; only tweezers can be used in order to avoid any contamination (this phase is the same for all the methods used). Next, the samples are submerged in a container with acetone (C3H6O min. 99.8%, for analysis) at room temperature for less than one minute. Finally, the samples are placed on a lab cellulose paper to air dry them at room temperature (the drying technique is the same for all cleaning methods).The advantages of this method are based on its simplicity and fastness, and this makes the method one of the most commonly used. Another important advantage is that it is suitable for cases in which the hydrogen loss during cleaning operations needs to be minimized to be able to know the exact amount of the sample when extracted from an aggressive environment. On the other hand, it is not a very good method when the samples have a large amount of superficial oxide, as it can hardly remove it.
- -
- Simple trichloroethylene method (TR). It consists of the same sequence as the aforementioned AC one, but substituting the acetone by trichloroethylene. After degreasing the samples in ethanol (C2H5OH v/v: 95.1–96.9%, for analysis), a submersion in trichloroethylene (C2HCl3 min. 99.5%, stabilized with ethanol) for less than 1 min is carried out, finally the samples are dried at room temperature.This method is a simplification of the complete method (AC+U+TR), which is explained in the following paragraphs, and includes a process of submersion in acetone for 8 min which is eliminated here. The purpose of its use is to see if there are effects when reducing substantially (AC+U+TR) the duration and the possibilities of hydrogen diffusion outside and/or contamination by a longer exposition to acetone. Together with the simple acetone simple method (AC), and constituting its main alternative, these two are the most widely used in the literature. Their advantages and disadvantages are the same: they are fast and simple, ideal for situations where hydrogen loss during cleaning must be minimized, although they cannot eliminate superficial oxide when existing.
- -
- Compound acetone and ultrasounds method (AC+U). This method is also a simplification of the complete method explained above (AC+U+TR), eliminating the immersion in trichloroethylene and directly drying the samples instead.The main advantage of this method is the trichloroethylene elimination, as it is toxic, and also the capacity to eliminate some superficial oxides during the ultrasounds process. Nevertheless, the still longer time required than that of the simple methods can make it difficult to know the exact hydrogen content due to its diffusion out of the samples.
- -
- Acetone, ultrasounds, and trichloroethylene complete method (AC+U+TR). This method is outlined in [12]. First, the samples are degreased with pure ethanol (C2H5OH v/v: 95.1–96.9%, for analysis), and are then subjected to 8 min cleaning submerged in acetone (C3H6O min. 99.8%, for analysis) helped by ultrasounds at room temperature. After that, the samples are taken out and submerged in a container with trichloroethylene (C2HCl3 min. 99.5%, stabilized with ethanol) at room temperature for less than one minute. No rinsing was applied between solutions in this work. Finally, the samples are placed on a lab cellulose paper to air dry them at room temperature.As in (AC+U), in this case it is impossible to minimize the hydrogen loss due to the time employed, which can be substantial if the original content is low. On the other hand, given the longer immersion time and the ultrasound action, this method allows a better elimination of the superficial oxide than the simplified methods (AC) or (TR).
- -
- HCl solution C-3.5 method from ASTM G1 standard (HCl). As the other methods described, the first step is to degrease the samples with pure ethanol (C2H5OH v/v: 95.1–96.9%, for analysis). It is then followed by a 10 min immersion at room temperature in a dissolution of 500 mL of hydrochloric acid (HCl 36.5–38.0%, for analysis) plus 3.5 g of hexamethylenetetramine (C6H12N4 min. 99%) and distilled water up to 1 L (or proportional quantities), after which the samples are retired and dried at room temperature and in air.This method is slower and more laborious than the rest. It also uses a more aggressive dissolution, so it is more likely to introduce hydrogen in the samples, heavily interfering with the results when the contents to be analyzed are low. Nevertheless, it must be pointed out as an advantage that it is the only one of the methods studied capable of removing superficial oxidation when this is large, cases when the oxides will have a greater influence on the results than the quantity introduced by the cleaning method if not removed.
3.4. Equipment Used for Hydrogen Content Analysis
4. Results and Analysis
4.1. Calibration Pins and Wire Pins in As-Received State
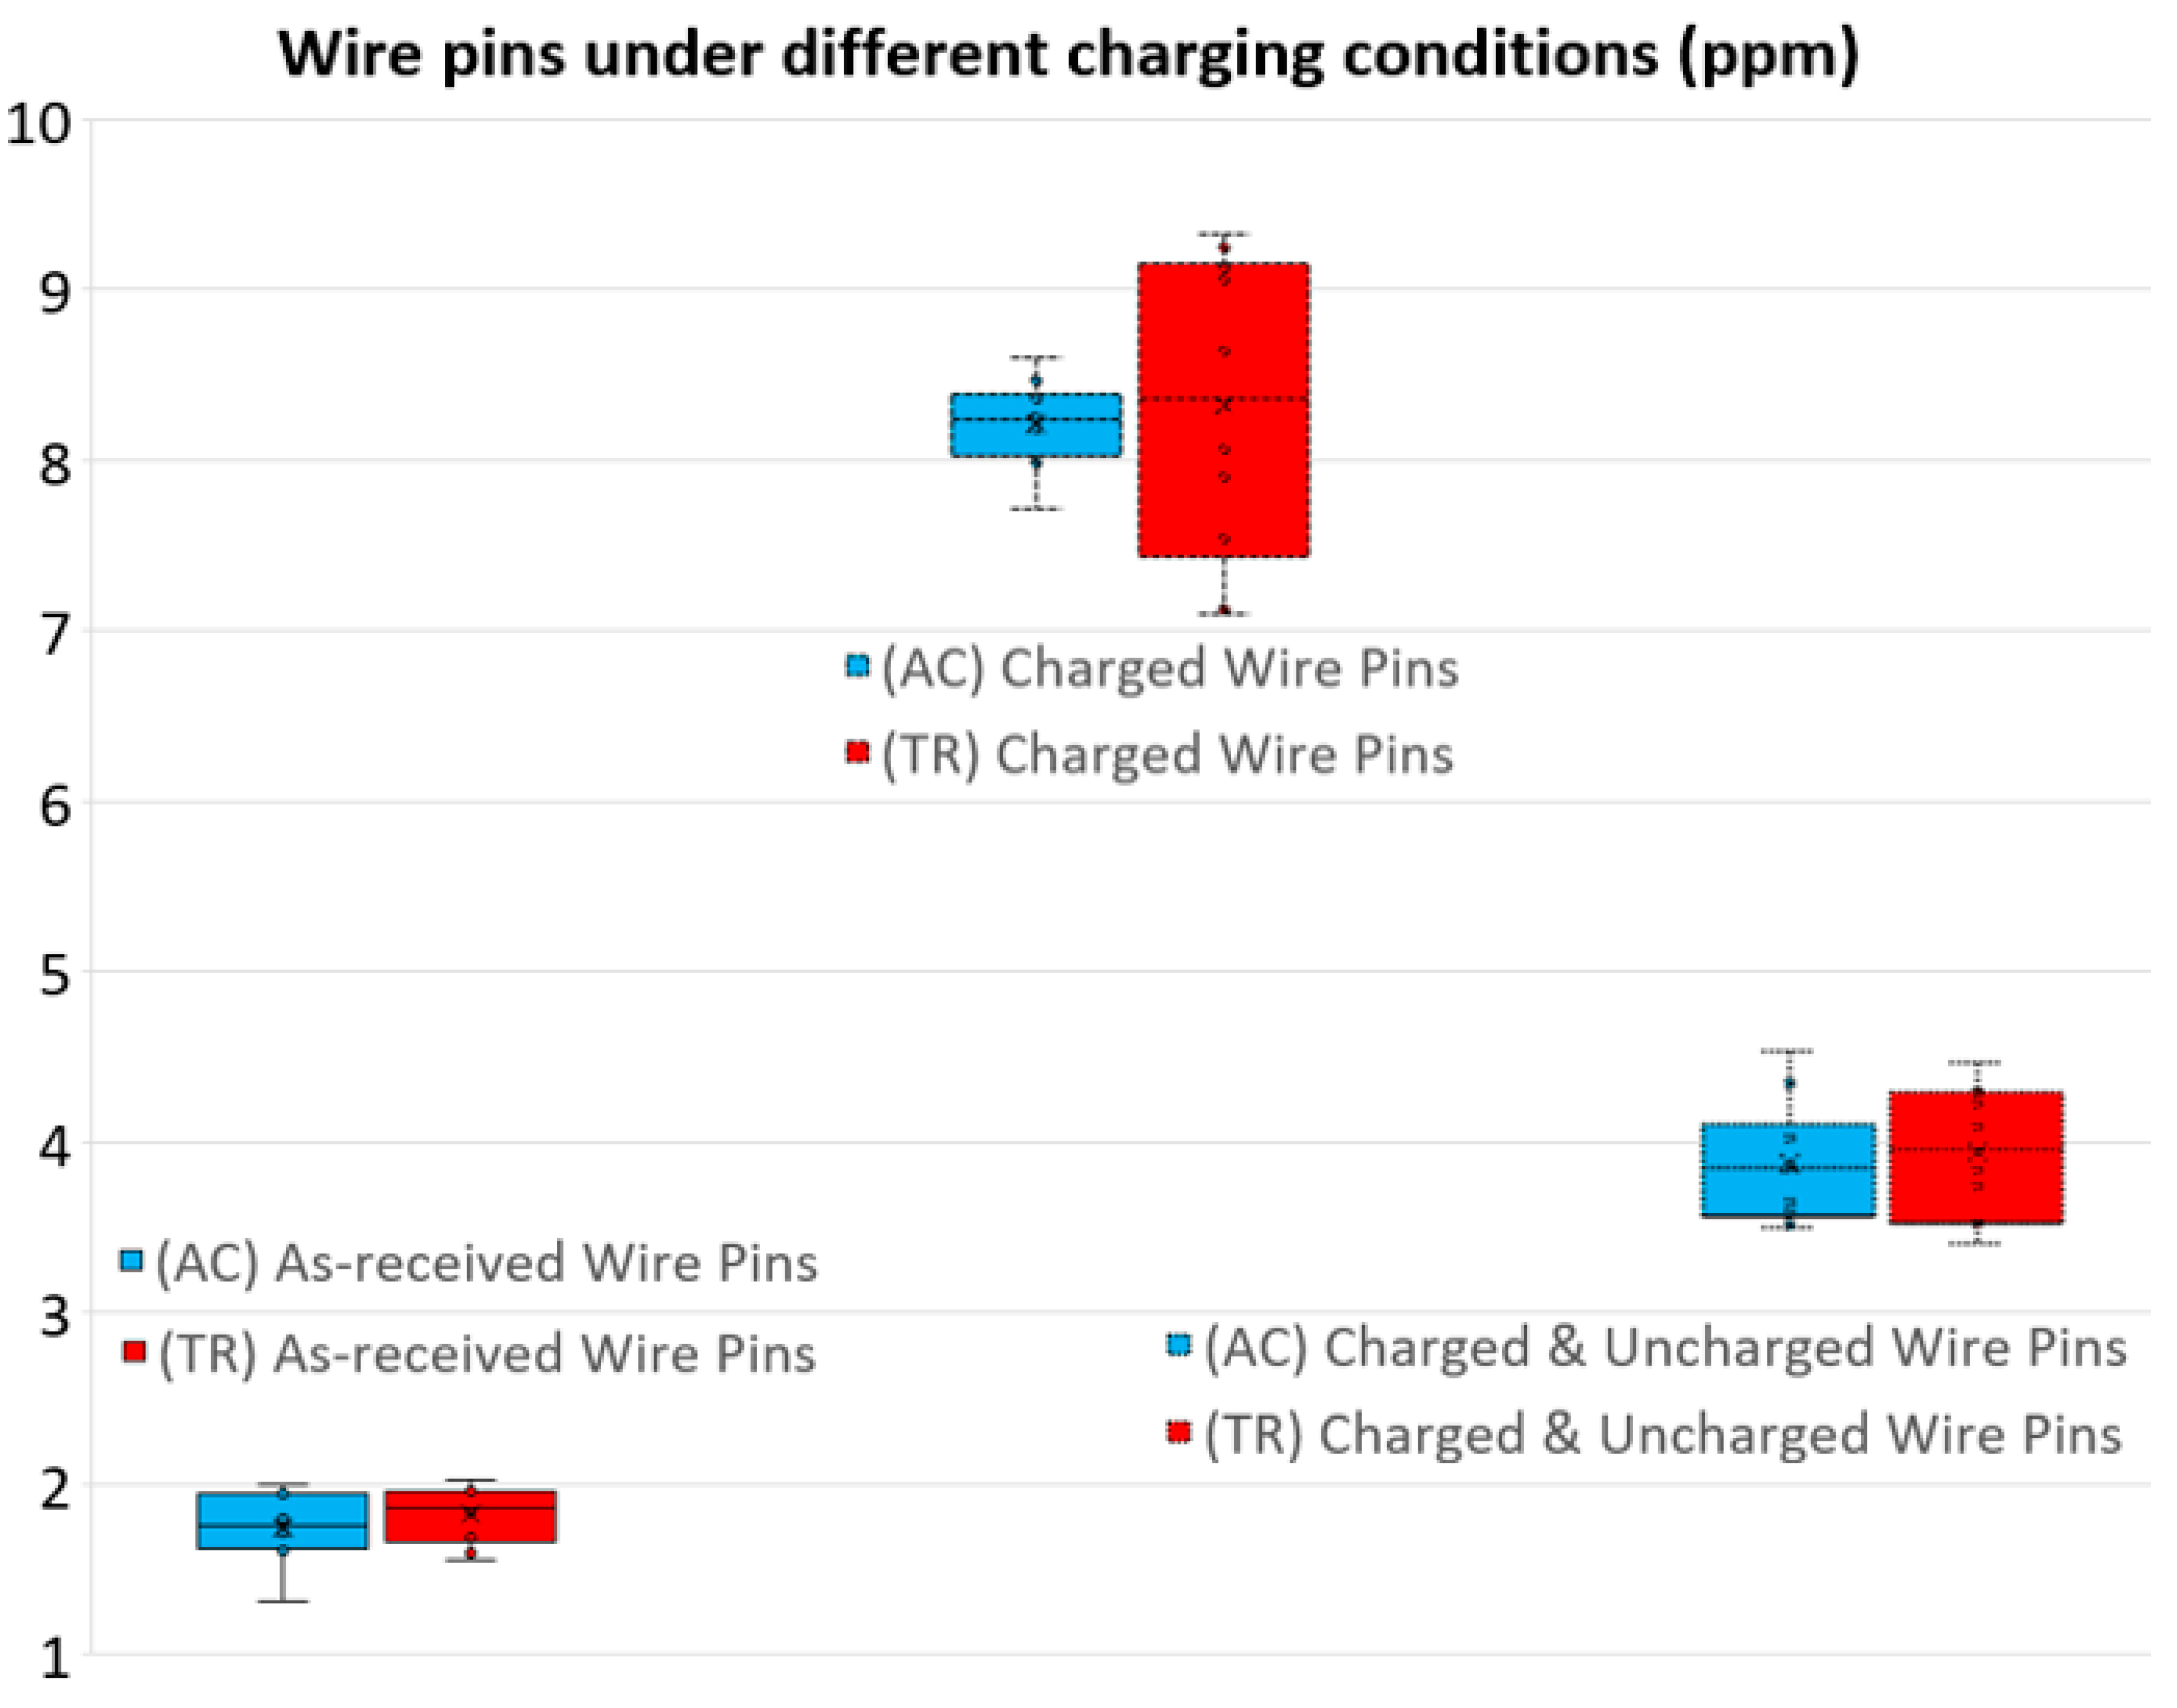
4.2. Wire Pins under Different Hydrogen Charging Conditions
5. Conclusions
- -
- The HCl solution C-3.5 method from ASTM G1 standard, (HCl), showed hydrogen contents around 2 ppm higher than the other methodologies (which showed close results), even for calibrated pattern pins. This proves that this method, while it can be useful for eliminating superficial oxides, corrosion deposits or dirt, introduces large amounts of hydrogen in the samples. Mechanical methods of cleaning (Section 2.3), might be also considered for this kind of tasks in order to not modify the hydrogen contents, being careful about not using abrasive that can affect it.
- -
- The longest methodologies: The compound acetone and ultrasounds method, (AC+U), and the acetone, ultrasounds and trichloroethylene complete method, (AC+U+TR), showed slightly higher median values and dispersion ranges between first and third quartiles than the simple methods (AC) and (TR), but remain inside the usual range of uncertainties for a regular hydrogen analysis. This does not discard (AC+U) and (AC+U+TR) as valid methodologies, but the time and equipment demands are higher, so the simple methods (AC) and (TR) are generally preferred (cheaper, easier, and faster).
- -
- The simple acetone method, (AC), and simple trichloroethylene method, (TR), are the adequate ones when the hydrogen content determination must minimize diffusion of the samples while being performed. (AC) and (TR) showed very close results for all charging conditions studied, while the greater the (TR) dispersion range between first and third quartiles the higher the hydrogen content to be measured is; while (AC) Q1–Q3 dispersion remained constant at around 0.5 ppm. Either of these two methods can be considered adequate, taking into account the reliability of the results, their simplicity, and the speed of their execution; this last parameter is of vital importance in steel-making processes in order to not disturb the manufacturing chain.
Author Contributions
Funding
Conflicts of Interest
References
- Dwivedi, S.K.; Vishwakarma, M. Hydrogen embrittlement in different materials: a review. Int. J. Hydrog. Energy 2018, 43, 21603–21616. [Google Scholar] [CrossRef]
- Lynch, S.P. Hydrogen embrittlement (HE) phenomena and mechanisms. In Stress Corrosion Cracking; Raja, V.S., Shoji, T., Eds.; Woodhead Publishing: Sawston, UK, 2011; pp. 90–130. [Google Scholar]
- Pfeil, L.B. The effect of occluded hydrogen on the tensile strength of iron. Proc. R. Soc. Lond. A 1926, 112, 182–195. [Google Scholar]
- Troiano, A.R. The role of hydrogen and other interstitials in the mechanical behavior of metals (1959 Edward De Mille Campbell Memorial Lecture). Metallogr. Microstruct. Anal. 2016, 5, 557–569. [Google Scholar] [CrossRef]
- Beachem, C.D. A new model for hydrogen-assisted cracking (hydrogen embrittlement). Metall. Mater. Trans. 1972, 3, 441–455. [Google Scholar] [CrossRef]
- Lynch, S.P. Mechanisms of hydrogen-assisted cracking. Met. Forum 1979, 2, 189–200. [Google Scholar]
- Gangloff, R.P. Hydrogen assisted cracking of high strength alloys. In Comprehensive Structural Integrity; Milne, I., Ritchie, R.O., Karihaloo, B., Eds.; Elsevier Science: New York, NY, USA, 2003; Volume 6, pp. 31–101. [Google Scholar]
- Liu, Q.; Atrens, A. A critical review of the influence of hydrogen on the mechanical properties of medium-strength steels. Corros. Rev. 2013, 31, 85–103. [Google Scholar] [CrossRef]
- Davey, V.S. Hydrogen assisted cracking of high strength in the legs of jack-up rigs. In Proceedings of the Third International Conference: The Jack-Up Drilling Platform, Design, Construction and Operation, London, UK, 24–25 September 1991. [Google Scholar]
- Standard Practice for Sampling Steel and Iron for Determination of Chemical Composition; ATM E1806-18; ASTM International: West Conshohocken, PA, USA, 2018.
- Steel and Iron. Sampling and Preparation of Samples for the Determination of Chemical Composition; ISO 14284:1996; International Organization for Standardization: Geneva, Switzerland, 1996. [Google Scholar]
- Lesne, L. Application of New Fracture Mechanics Concepts to Hydrogen Damage Evolution- Publications Office of the EU. Available online: https://op.europa.eu/en/publication-detail/-/publication/b3a683b8-fdf4-476b-aa2c-68624b04febe/language-en/format-PDF/source-118525922 (accessed on 24 April 2020).
- SERCAMAT (Servicio de Caracterización de Materiales de la Universidad de Cantabria). Internal Hydrogen Determination Protocol; University of Cantabria: Santander, Spain, 2020. [Google Scholar]
- Navas, J. Diseño y PWHT de Aceros Avanzados de Alta Resistencia para Cadenas de Líneas de Fondeo. Ph.D. Thesis, Universidad del País Vasco—Euskal Herriko Unibertsitatea, Bilbao, Spain, June 2015. [Google Scholar]
- Arroyo, B.; Álvarez, J.A.; Lacalle, R.; Uribe, C.; García, T.E.; Rodríguez, C. Analysis of key factors of hydrogen environmental assisted cracking. Mater. Sci. Eng. A 2017, 691, 180–194. [Google Scholar] [CrossRef]
- Arroyo, B.; Álvarez, J.A.; Gutiérrez-Solana, F.; Lacalle, R.; González, P. Rate Effects on the Estimation of Fracture Toughness by Small Punch Tests in Hydrogen Embrittlement. J. Strain Anal. Eng. Des. 2019, 54, 390–400. [Google Scholar] [CrossRef]
- Standard Practice for Preparing, Cleaning, and Evaluating Corrosion Test Specimens; ASTM G1; ASTM International: West Conshohocken, PA, USA, 2018.
- AR555 Hydrogen in Steel CRM (H = 0.00023%)—1g Pin. Available online: https://www.alpharesources.com/product_details.php?p=hydrogen-in-steel-pin-standard&code=AR555&s=2221&cat=3&m=1 (accessed on 9 May 2020).
- Alambres y Cordones de Acero para Armaduras de Hormigón Pretensado; UNE 36094:1997; Asociación Española de Normalización: Madrid, Spain, 1997.
- Álvarez, J.A.; Gutiérrez-Solana, F. An elastic-plastic fracture mechanics based methodology to characterize cracking behaviour and its applications to environmental assisted processes. Nucl. Eng. Des. 1998, 188, 185–202. [Google Scholar] [CrossRef]
- Standard Reference Test Method for Making Potentiodynamic Anodic Polarization Measurements; ASTM G5-87; ASTM International: West Conshohocken, PA, USA, 1987.
- González, P.; Cicero, S.; Arroyo, B.; Álvarez, J.A. A theory of critical distances based methodology for the analysis of environmentally assisted cracking in steels. Eng. Fract. Mech. 2019, 214, 134–148. [Google Scholar] [CrossRef]
- Fukai, Y. The Metal-Hydrogen System: Basic Bulk Properties; Springer Science & Business Media: Berlin, Germany, 2005. [Google Scholar]
- Kirchheim, R.; Pundt, A. Hydrogen in metals. Phys. Metall. 2014, 1, 2597–2705. [Google Scholar]
- Bernstein, I.M.; Pressouyre, G.M. Role of Traps in the Microstructural Control of Hydrogen Embrittlement of Steels; Carnegie-Mellon University: Pittsburgh, PA, USA, 1984. [Google Scholar]
- Matsumoto, Y.; Miyashita, T.; Takai, K. Hydrogen behavior in high strength steels during various stress applications corresponding to different hydrogen embrittlement testing methods. Mater. Sci. Eng. A 2018, 735, 61–72. [Google Scholar] [CrossRef]
- Konno, R.; Manabe, T.; Hirakami, D.; Takai, K. Lattice defect formation behavior of cold-drawn pearlitic steel fractured under elastic and plastic region in the presence of hydrogen. J. Iron Steel Inst. Jpn. 2018, 104, 36–45. [Google Scholar] [CrossRef]
- García, T.E.; Arroyo, B.; Rodríguez, C.; Belzunce, F.J.; Álvarez, J.A. small punch test methodologies for the analysis of the hydrogen embrittlement of structural steels. Theor. Appl. Fract. Mech. 2016, 86, 89–100. [Google Scholar] [CrossRef]
- Chiu, W.A.; Jinot, J.; Scott, C.S.; Makris, S.L.; Cooper, G.S.; Dzubov, R.C.; Bale, A.S.; Evans, M.V.; Guyton, K.Z.; Keshava, N.; et al. Human health effects of trichloroethylene: key findings and scientific issues. Environ. Health Perspect. 2013, 121, 303–311. [Google Scholar] [CrossRef] [PubMed]


| C | Mn | Si | P | S | Cr | Ni | Cu | Mo |
| 0.795 | 0.665 | 0.214 | 0.011 | 0.016 | 0.193 | 0.126 | 0.268 | 0.023 |
| Sn | V | N | Al | B | Ti | Pb | Zn | Fe |
| 0.014 | 0.002 | 0.0095 | 0.002 | 0.0004 | 0.001 | 0.001 | 0.001 | Rest |
| Parameter | Value | Requirement [19] |
|---|---|---|
| Mass density | 1103 ± 1 g/m | 1101 g/m |
| Cross section | 140.5 ± 0.1 mm² | 137.2 ÷ 142.8 mm² |
| ØOuter wires | 5.00 ± 0.02 mm | -- |
| ØInner wire | 5.22 ± 0.02 mm | 5.1 ÷ 5.25 mm |
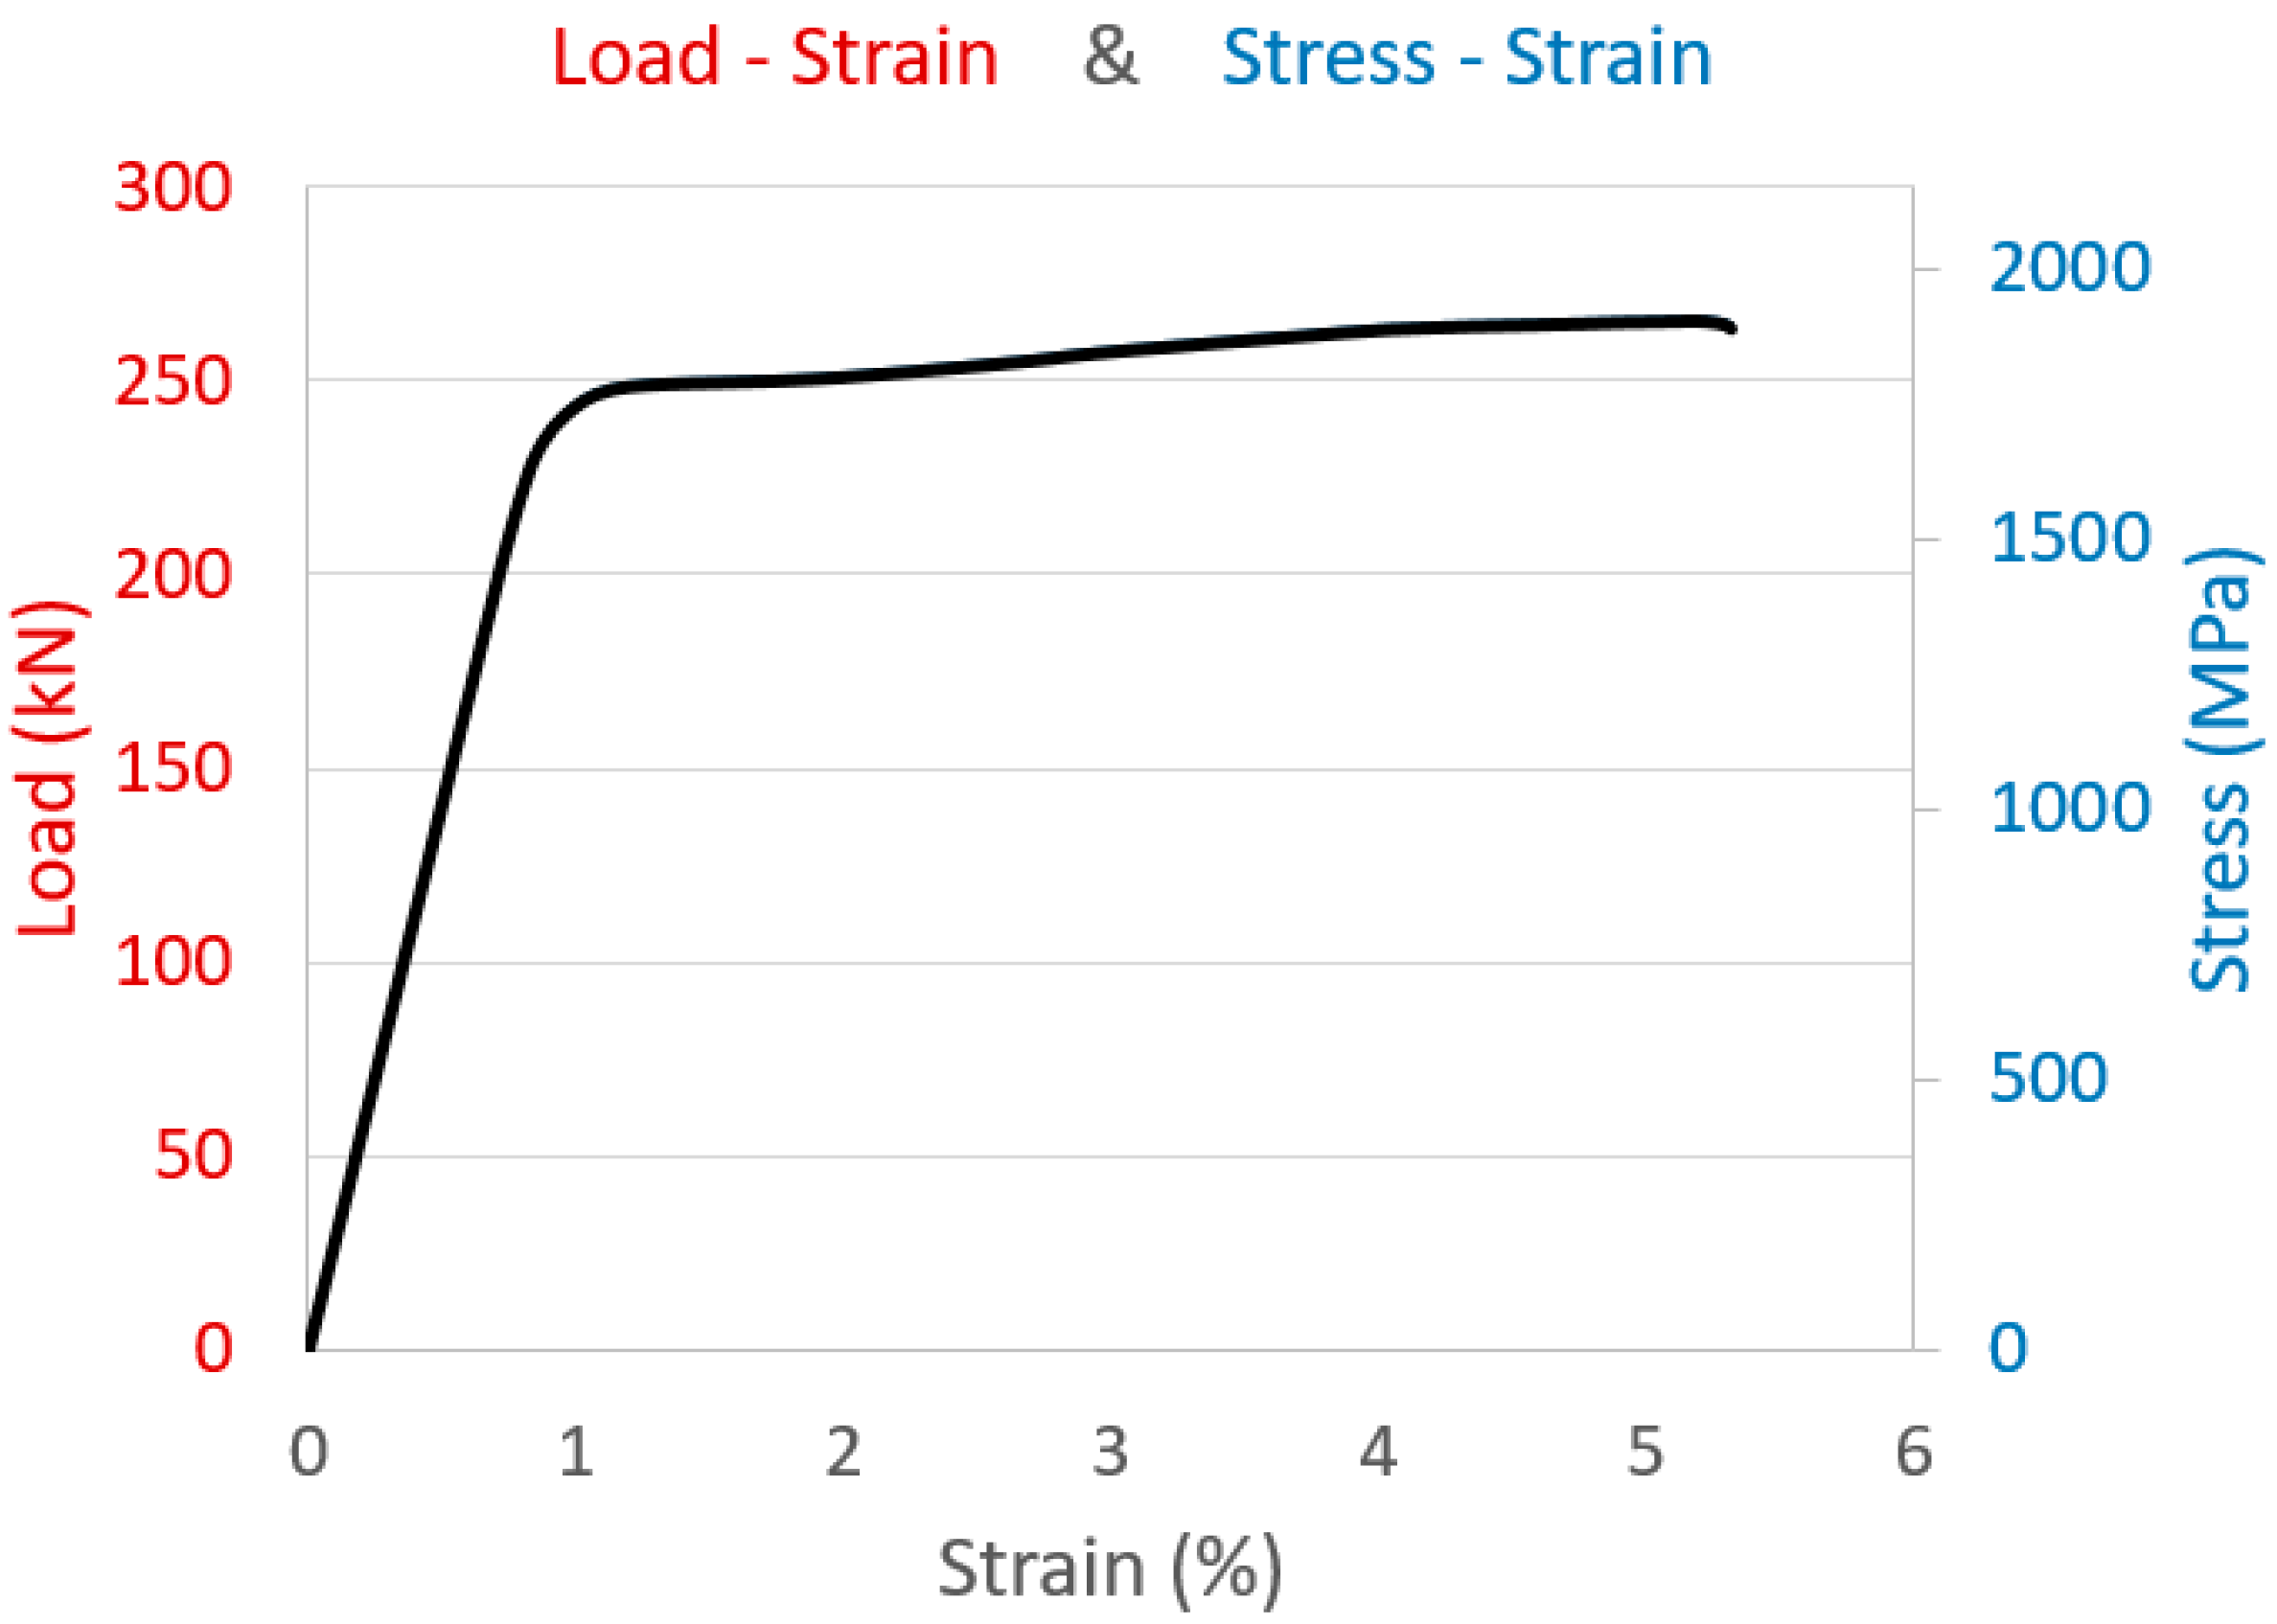
| Young’s modulus, E | 202 ± 3 GPa | 181.4 ÷ 208.7 GPa |
| Yield load (stress) at 0,1%, Fp 0.1 | 242 ± 3 kN (1730 ± 24 MPa) | >221 kN |
| Yield load (stress) at 0,2%, Fp 0.2 | 248 ± 3 kN (1771 ± 21 MPa) | >229 kN |
| Maximum load, Fm (stress, Sm) | 266 ± 3 kN (1901 ± 19 MPa) | 260 ÷ 304 kN |
| Elongation at maximum load, Agt | 5.19 ± 0.05% | >3.5% |
| Ratio Fp 0.2/Fm | 0.93 ± 0.01 | -- |
| Environmental conditions | 23.0 °C–85.9% RH | Room Temp. |
| Method | Steps |
|---|---|
| Simple acetone method (AC) | Degrease the sample with ethanol. |
| Immerse in acetone at room temperature for ≤1 min. | |
| Dry with air at room temperature. | |
| Simple trichloroethylene method (TR) | Degrease the sample with ethanol. |
| Immerse in trichloroethylene at room temperature for ≤1 min. | |
| Dry with air at room temperature. | |
| Compound acetone and ultrasounds method (AC+U) | Degrease the sample with ethanol. |
| Immerse in acetone at room temperature for 8 min and apply ultrasounds. | |
| Dry with air at room temperature. | |
| Acetone, ultrasounds, and trichloroethylene complete method (AC+U+TR) | Degrease the sample with ethanol. |
| Immerse in acetone at room temperature for 8 min and apply ultrasounds. | |
| Immerse in trichloroethylene at room temperature for ≤1 min. | |
| Dry with air at room temperature. | |
| HCl solution C-3.5 method from ASTM G1 standard (HCl) | Degrease the sample with ethanol. |
| Immerse in a solution of 500 mL of HCl, 3.5 g of hexamethylenetetramine and water up to 1 L at room temperature for 10 min. | |
| Dry with air at room temperature. |
© 2020 by the authors. Licensee MDPI, Basel, Switzerland. This article is an open access article distributed under the terms and conditions of the Creative Commons Attribution (CC BY) license (http://creativecommons.org/licenses/by/4.0/).
Share and Cite
Arroyo, B.; Andrea, L.; Álvarez, J.A.; Cicero, S.; Lacalle, R. Analysis of Samples Cleaning Methods Prior to Hydrogen Content Determination in Steel. Metals 2020, 10, 723. https://doi.org/10.3390/met10060723
Arroyo B, Andrea L, Álvarez JA, Cicero S, Lacalle R. Analysis of Samples Cleaning Methods Prior to Hydrogen Content Determination in Steel. Metals. 2020; 10(6):723. https://doi.org/10.3390/met10060723
Chicago/Turabian StyleArroyo, Borja, Laura Andrea, José Alberto Álvarez, Sergio Cicero, and Roberto Lacalle. 2020. "Analysis of Samples Cleaning Methods Prior to Hydrogen Content Determination in Steel" Metals 10, no. 6: 723. https://doi.org/10.3390/met10060723
APA StyleArroyo, B., Andrea, L., Álvarez, J. A., Cicero, S., & Lacalle, R. (2020). Analysis of Samples Cleaning Methods Prior to Hydrogen Content Determination in Steel. Metals, 10(6), 723. https://doi.org/10.3390/met10060723