Abstract
Nowadays, composite materials are playing an increasingly important role in material forming processes because they can combine remarkable physical and mechanical properties with relatively low weight. The main objective of this work is to study the forming behaviour of multi-layer sheets by finite element analysis. The possibility of replacing the composite by a single equivalent material, with a plastic behaviour similar to that of the composite, was also numerically analysed. This study focuses on two three-layer sheets, each composed of two metallic outer layers and a core of polymeric material; on one of the sheets, the outer layers are steel and, on the other, aluminium. Numerical simulations of the bulge test and of the deep drawing of a U-channel profile and a square cup were used to evaluate the behaviour of the multi-layer sheets and their equivalent materials. The influences of the difference of the mechanical properties of the constituent materials and some geometrical parameters of the deep-drawing process on the plastic behaviour, namely the curves of force vs. displacement of the punch and the strain and stress distributions, were evaluated. The possibility of using the bulge test to characterize the behaviour of the composite was also analysed.
1. Introduction
Multi-layer sheets are composed of two or more layers, becoming increasingly popular in the aerospace and automotive industries [1]. They can also be called sandwich materials, which, as the name suggests, are mostly composed of two thin outer layers and one thick core. In general, the thin outer layers present relatively high strength and stiffness, when compared to the thick lightweight core. Composite materials, such as multi-layer sheets, are highly sought-after because they can achieve similar performance when compared to traditional materials, combined with a reduced weight. This is especially important in the aforementioned industries, where the need for greater efficiency and lower greenhouse gas emissions is ever increasing.
The performance of multi-layer sheets is governed by the volume fractions and material properties of each layer, leading to desirable features, such as low weight, high mechanical strength, ductility, corrosion resistance and good thermal and electrical properties simultaneously [2]. Multi-layer sheets can be joined by manufacturing methods such as explosive welding [2], cold or hot rolling [1,2,3] and adhesive bond [1]. In this context, a poor multilayer sheet manufacturing associated with the strong dissimilarity in the mechanical behaviour between the layers and/or the volume fraction of each layer can lead to various failure modes, namely under bending loading conditions. Examples of failure modes include: (i) delamination, i.e., layer separation that occurs when the bond is relatively weak; (ii) skin wrinkling on the outer layers under compressive loading; (iii) the outer layers’ failure under tensile or compressive loading; and (iv) core failure, due to shear stresses [4]. In this regard, it is crucial to investigate the mechanical properties and suitability of multi-layer metal sheets in forming processes involving large plastic deformations. A number of studies on the forming and mechanical behaviour of multi-layer sheets can be found in the literature, which include extensive investigation on the behaviour of metal-polymer-metal sandwich sheets under stretching, bending and deep-drawing loading conditions [5,6,7,8,9,10]. However, these studies, being mainly experimental, need to be complemented by in-depth stress analysis, which can be performed numerically, to better understand the forming behaviour of multilayer sheets.
In this work, a numerical simulation study is carried out in order to evaluate the forming behaviour of multi-layer sheets. Firstly, numerical simulations of the circular bulge test were performed for two composites, each composed of two outer metal layers and a core of polymeric material. This study allowed to define equivalent materials, i.e., single sheet materials whose plastic behaviour is similar to that of the composites. Afterwards, numerical simulations of the forming processes of U-channel profile and square cup were carried out for both the composites and the equivalent materials.
2. Materials and Methods
2.1. Materials
The study focuses on two multilayer sheets with a total thickness of 1.6 mm, each having two metallic outer layers, 0.3 mm thick, and a polymeric core, 1.0 mm thick. Two different mechanical behaviours were considered for the outer layers: one is an interstitial free steel that will be refer as “Composite 1”, and the other is an AA1060-O aluminium alloy that will be refer as “Composite 2”. In both composites, the mechanical behaviour of the polymeric core is considered typical of a polyethylene.
The constitutive model adopted for these materials assumes that: (i) the elastic behaviour is isotropic and described by the generalised Hooke’s law; (ii) the plastic behaviour is described by the von Mises yield criterion with isotropic hardening and an associated flow rule. For the metallic materials (outer layers), the isotropic hardening behaviour was modelled by Swift’s law:
where . represents the yield stress and its evolution with the equivalent plastic strain, ; K, and n are the material parameters; is the initial yield stress. For Composite 1, the hardening law parameters of the outer layers were determined from the bulge test results of pressure vs. pole height results by Miranda et al. [8], using the inverse analysis procedure proposed by Pereira et al. [11], although simplified for the case of isotropy. For the metallic outer layers of Composite 2, the hardening law parameters were determined from the experimental tensile test results by Liu and Xue [12], using least-squares regression. The Swift’s law parameters of the metallic outer layers of the sandwich materials are given in Table 1; this table also shows the elastic parameters of Hooke’s law (Young’s modulus, E, and Poisson’s ratio, ν) assigned to both metallic materials.

Table 1.
Material parameters of the metallic outer layers.
Regarding the polymeric core layer of both composites, Miranda et al. [8] and Liu and Xue [12] characterized the stress–strain behaviour of polyethylene cores using tensile tests, which is similar in both cases. This behaviour is chosen for the core material of the Composites 1 and 2, in the current work. Considering the shape of the tensile curve of the polyethylene, it was modelled by a saturation of Voce’s law:
where , . and are the material parameters. In this context, the Voce’s law parameters of the core of both composites were assessed from the tensile test results by Liu and Xue [12], using least-squares regression. Table 2 shows these parameters as well as the elastic parameters of the core.

Table 2.
Material parameters of the polymeric core of both composites (E and ν are from [12]).
Figure 1 compares the hardening curves of the constituent materials of Composites 1 and 2, obtained from the constitutive parameters indicated in Table 1 (steel and aluminium alloy) and Table 2 (polymer). The dissimilarity in the hardening behaviour of the constituent materials of Composite 1 is much greater than in Composite 2, which allows the analysis of its influence on the mechanical behaviour of the composites.
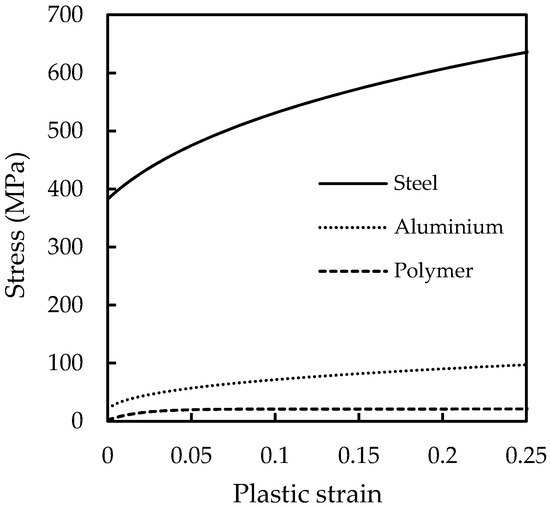
Figure 1.
Hardening curves of the metallic outer layers and polymer core.
2.2. Numerical Models
The numerical simulations were carried out with the in-house finite element code DD3IMP (Deep Drawing 3D Implicit Finite Element Code), developed and optimized for the simulation of sheet metal forming processes [13]. The forming tools were considered rigid and their surfaces were described by Bézier surfaces or Nagata patches [14]. The blanks were discretized with eight-node hexahedral solid elements combined with a selective reduced integration technique to avoid volumetric locking. The metallic layers are assumed to remain perfectly bonded with the polymeric core during the loading. The contact with friction was described by Coulomb’s law with a friction coefficient of 0.02 for the circular bulge test and 0.144 for the other examples [15,16].
2.2.1. Circular Bulge Test
The circular bulge test proves to be an accurate tool for characterizing the mechanical behaviour of sheet materials up to large deformations. The data obtained from the bulge test provides complementary information to those of the tensile curve that can be used for identifying the parameters of the constitutive model, for example.
A numerical model of the circular bulge test was built in order to perform the study on the plastic behaviour of multilayer sheets. The geometry of the selected tools was based on the bulge test apparatus described by Santos et al. [17], which was also used to obtain the experimental results by Miranda et al. [8] for the steel sheet. Figure 2 schematically shows the geometry of the bulge test, where RM = 75 mm is the die radius, RC = 13 mm is the die profile radius, RD = 95 mm is the radius of the central part of the draw bead and RS = 100 mm is the initial blank radius of the circular sheet.
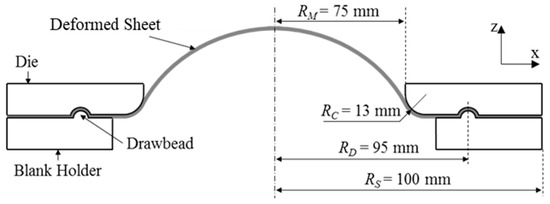
Figure 2.
Representation of the bulge test, identifying the main dimensions of the tools in agreement with Santos et al. Data from [17].
Only one quarter of the test geometry was modelled due to material and geometric symmetries. To further simplify the numerical model, the draw bead geometry was neglected and its effect was replaced by a boundary condition that restricts the radial displacement of the nodes placed at a distance equal to RD from the centre of the circular sheet. The numerical simulations assumed an incremental increase of the pressure applied to the inner surface of the sheet. The in-plane discretisation of the blank sheets was based on a previous work by Pereira et al. [11], and each layer of material presents two layers of elements through the thickness (i.e., six elements through the total sheet thickness).
2.2.2. Sheet Metal Forming Processes: U-Channel and Square Cup
The two deep-drawing examples selected are based on the benchmarks proposed under the Numisheet ’93 conference: U-channel (2D) and the square cup [16]. Both are representative of sheet metal forming industrial processes, but the process parameters were adapted taking into account the thickness of the composite sheet and its material properties. Figure 3 schematically represents the typical setup for the bending and the deep drawing processes under study. The numerical simulation of both forming processes is composed of three phases: in phase one, the blank holder compresses the sheet against the die; in phase two, the displacement (d) is imposed to the punch, with d = 30 mm in case of the U-channel profile and d = 40 mm for the square cup (see Figure 3a), while the blank holder force (BHF) remains constant; finally, in the third phase, the forming tools are removed, with the subsequent springback.
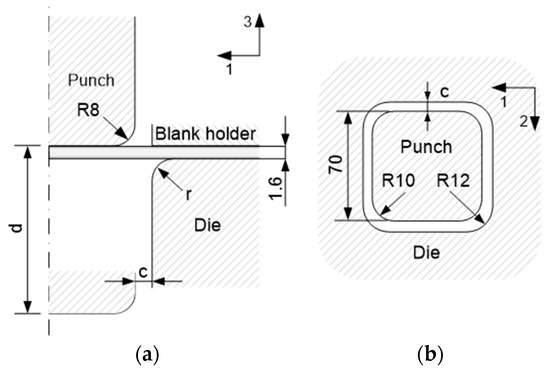
Figure 3.
Schematic representation of the geometry of the numerical deep drawing setup for the U-channel and the square cup (dimensions in mm), data from [16,18]: (a) longitudinal sectional view of both processes, (b) top view of the square cup tooling.
For the U-channel forming process, various combinations of process parameters were tested in both Composite 1 and Composite 2, concerning the blank holder force (BHF), die radius (r) and clearance between the punch and the die (c). The selected values for the process parameters are shown in Table 3. For the square cup forming process, the die radius, r, is kept always equal to 5 mm and two values of clearance between the punch and the die, c, were studied: 2 mm and 4 mm; moreover, two values of the blank holder force were used: BHF = 9.8 kN and 19.6 kN, for the Composite 1, and BHF = 2.45 kN and 4.9 kN, for the Composite 2.

Table 3.
Combinations of U-channel forming process parameters used for the simulations of Composite 1 and Composite 2.
Regarding the U-channel forming process, a section of the blank with in-plane dimensions of 75 × 35 mm was discretized with just one element in width and 150 elements in length. Note that only one element is adopted along the width direction because the boundary conditions adopted guarantee a plane strain state along this direction. In case of the square cup forming process, the initial surface dimensions of the sheet are 75 × 75 mm and was discretized with 40 elements in length and width. In both processes, the mesh has six layers of elements through the thickness, two for each layer of material. Due to material and geometric symmetries of the processes, only half of the U-channel and a quarter of the square cup were simulated.
2.3. Equivalent Material
An equivalent sheet material is now defined. The hardening behaviour of the materials equivalent to the composites was estimated using a rule of mixture approach [19], which considers the weighted average of the thickness of composite constituent materials, as follows:
where and represent the hardening laws of the metallic outer layers (Swift’s law) and polymeric core (Voce’s law), respectively (see hardening parameters in Table 1; Table 2), and and , being tmetal and tpolymer the thicknesses of the metallic outer layers (tmetal = 2 × 0.3 mm) and inner polymeric core (tpolymer = 1 mm), respectively. Accordingly, a mixed Swift-Voce hardening law was selected to model the hardening behaviour of the equivalent materials, as follows [20]:
where the values of the hardening parameters are those indicated in Table 1 and Table 2 and 0.375. The elastic parameters E and ν of the equivalent materials were also estimated as the thickness-weighted average of the elastic parameters of the constituent materials of each composite.
Table 4 summarizes the values of the parameters that describe the elastoplastic behaviour of both equivalent materials, where materials “Equivalent 1” and “Equivalent 2” refer to single sheet materials estimated as equivalent to “Composite 1” and “Composite 2”, respectively. Figure 4 illustrates the comparison of the hardening curves of the equivalent materials with those of the metallic outer layers and polymer inner layer of each composite (see Figure 1).

Table 4.
Parameters describing the elastoplastic behaviour of the equivalent materials.
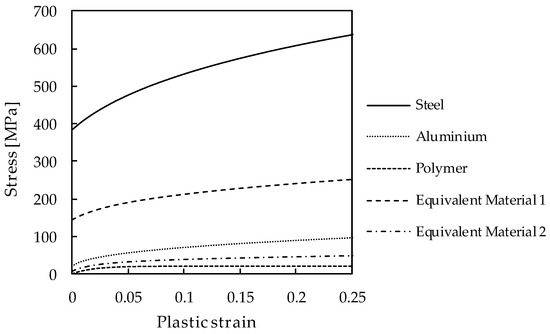
Figure 4.
Hardening curves of the metallic and polymer layers of the composites and of the equivalent materials.
3. Results and Discussion
3.1. Circular Bulge Test
Numerical simulations of the circular bulge test were performed with both composite materials, each with a total thickness of 1.6 mm. The numerical simulations were also performed for each of the constituent materials of Composite 1 and Composite 2: (i) steel (with a total thickness of 2 × 0.3 mm = 0.6 mm); (ii) aluminium (2 × 0.3 mm = 0.6 mm thickness); (iii) polymeric core (1 mm thickness). Figure 5 presents the pressure vs. pole height results for Composite 1 and Composite 2 as well as for their constituent materials (“Steel (2 mm × 0.3 mm)”, “Aluminium (2 mm × 0.3 mm)” and “Polymer (1 mm)”, in the figure); the experimental pressure vs. pole height results of Composite 1 (“Composite 1_Exp [8]” in Figure 5a), obtained by Miranda et al. [8], are also included. Finally, the results of pressure vs. pole height of the composite materials are presented as the sum of the results of their independent components: outer metallic layer + polymeric core results (see curves “Steel + Polymer” and “Aluminium + Polymer”, in Figure 5). No differences are observed between these curves and those of the composites.
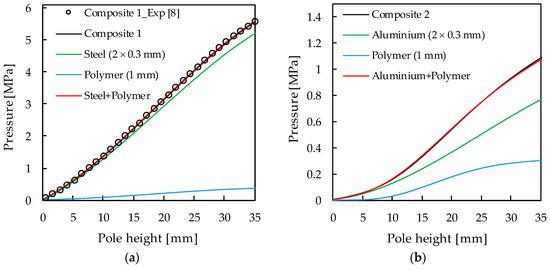
Figure 5.
(a) and (b) Pressure vs. pole height evolutions for the: (i) composite materials (black lines); (ii) constituent outer layers of steel and aluminium (green lines); constituent inner layer of polymer (blue lines); (iii) sum of the results of independent constituents: outer metallic layer + polymeric core results (red lines) and data experimentally obtained by Miranda et al. [8] (circles). Note: the software Web Plot Digitizer was used to obtain an excel file with the data points, from the published experimental curves [21].
Numerical simulations of the bulge test were also performed considering the equivalent materials, whose parameters are presented in Table 4, and Figure 6 shows that the pressure vs. pole height curves of these equivalent materials overlap those of the corresponding composites.
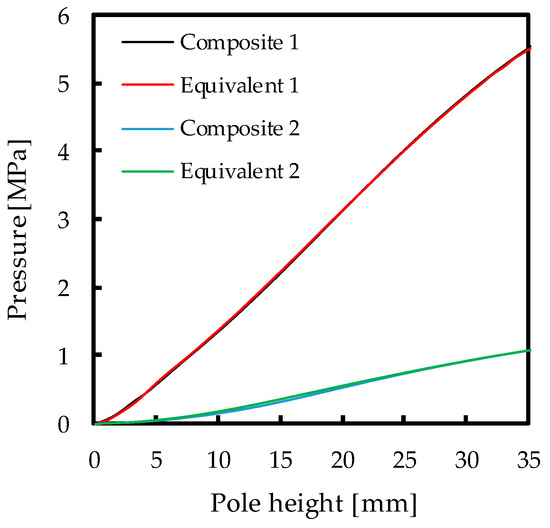
Figure 6.
Pressure vs. pole height evolutions for the two composites and the respective equivalent materials, confirming the overlapping.
Figure 7 presents the distributions of the equivalent plastic strain in the sheet, at the end of the bulge test (pole height equal to 35 mm), for composites 1 and 2 (Figure 7a,c, respectively)) and their corresponding equivalent materials (Figure 7b,d). The maximum values of equivalent plastic strain, at the pole of the cup, are very similar in all cases, and about 30%, although the strain values in the inner layer of the composites are slightly lower than in the corresponding equivalent materials.
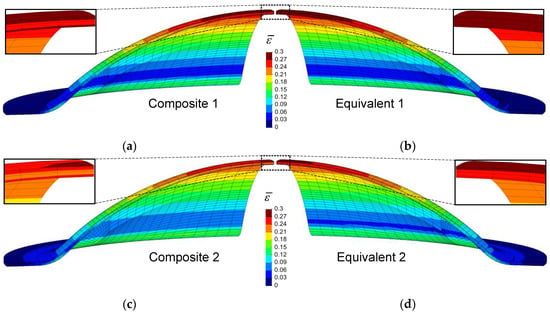
Figure 7.
Distribution of the equivalent plastic strain at the end of the bulge test for the: (a) Composite 1; (b) equivalent material 1; (c) Composite 2; (d) equivalent material 2.
Figure 8 shows the equivalent stress distributions in the sheets for the composites 1 and 2 (Figure 8a,c, respectively) and the corresponding equivalent materials (Figure 8b,d), at the end of the bulge test (pole height equal to 35 mm). The major difference observed is the fact that there is an enormous stress gradient in the thickness of the composites while the equivalent material presents a uniform stress. This is particularly evident in the pole region, where in case of Composite 1, for example, the stress drops from 657.96 MPa, in the outer layers, to 21.3 MPa, at the middle point of the core layer. For the corresponding equivalent material, the maximum value of the equivalent stress is 260.76 MPa at the pole, which is far from the maximum stress in the Composite 1, but quite close to the weighted average (260.05 MPa) of the previous two values. The same conclusion is valid for Composite 2.
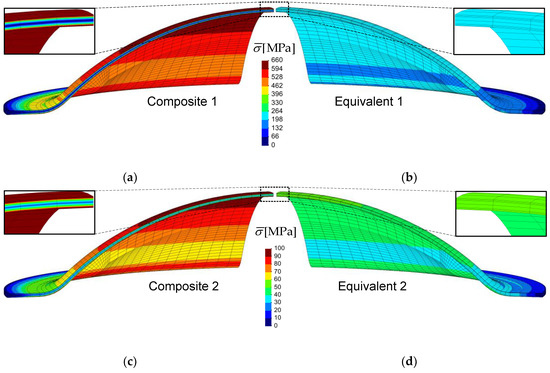
Figure 8.
Distribution of equivalent stress at the end of the bulge test for the: (a) Composite 1; (b) Equivalent material 1; (c) Composite 2; (d) Equivalent material 2.
Figure 9 shows the distributions of relative difference between the equivalent stress obtained for the numerical simulation of the equivalent material and the equivalent stress calculated from the mixture rule approach (Equation (3)), using the numerical results of the composite. In general, the equivalent stress distributions, obtained for the equivalent materials, obey to the rule of mixtures, which is not limited to the pole of the cup.
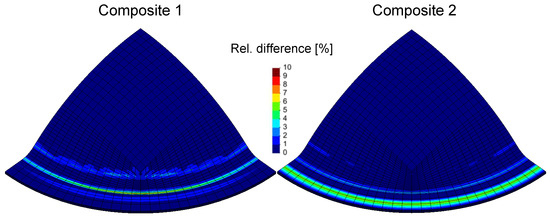
Figure 9.
Distributions of relative difference (%) between the equivalent stress obtained for the numerical simulation of the equivalent material and the equivalent stress calculated from the rule of mixture (Equation (3)), using the numerical results of the composite.
In short, the equivalent material seems to satisfactorily reproduce the behaviour of the composites, during the bulge test, relative to the pressure vs. pole height curve and the equivalent plastic strain. Although there are substantial differences between the composite and the equivalent material in terms of equivalent stress distribution, the uniform value attained by the equivalent material follows the rule of mixtures, particularly in the region near the pole cup of the bulge test.
3.2. Deep Drawing of a U-Channel Profile
Numerical simulations of the U-channel profile were performed to assess the behaviour of the composite materials and compared it to the respective equivalent materials, using the combinations of process parameters indicated in Table 3. First, the results of the evolution of the punch force vs. its displacement are analysed. Afterwards, the analysis focuses on the strain and stress distributions in the sheet thickness, after a punch displacement of 30 mm.
3.2.1. Force vs. Displacement
Figure 10 shows the results of the evolution of the punch force, normalized with the blank width, vs. its displacement for the Composites 1 and 2 and their corresponding equivalent materials, for the combinations of process parameters presented in Table 3. In general, the curves of the composites are similar to those of their equivalent materials, except in case A of Composite 1 from Table 3 (see Figure 10a); in this context, increasing the BHF value from 0.28 kN/mm (case A-see Table 3) to 1.12 kN/mm (cases B to E-see Table 3) leads to a better correspondence between the force vs. displacement results of each composite and their equivalent materials. The curves of the composites and their corresponding equivalent materials are not significantly altered by variations in the clearance and in the die radius, as can be seen by comparing the Figure 10b–e. Therefore, the analyses carried out in the following section focus mainly on Cases A and B.
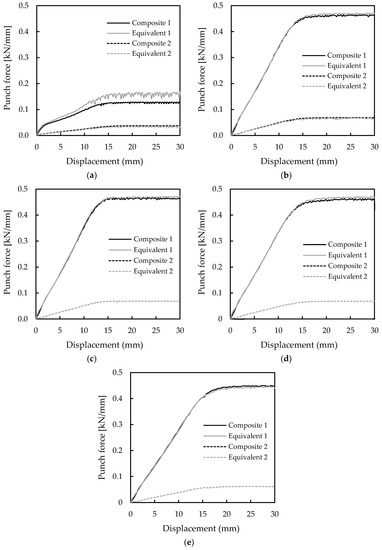
Figure 10.
Evolution of the punch force, normalized with the blank width, vs. its displacement during the deep drawing process of the U-channel for the composites 1 and 2, and their corresponding equivalent materials: (a) case A; (b) case B; (c) case C; (d) case D; (e) case E.
3.2.2. Strain and Stress Distribution for Composite 1
Figure 11 shows strain and stress distributions in the sheet thickness for the Composite 1 and the equivalent material, respectively for cases A and B (see Composite 1 in Table 3), presenting the distributions of equivalent plastic strain (), Green-Lagrange shear strain () and equivalent stress (). In general, the difference of mechanical behaviour between the layers of the Composite 1 produces a stress gradient through-thickness, as expected, but also in strain, the highest values of which are located in the polymeric core in the vertical wall region. In case of the equivalent material, there are almost no strain and stress gradients across the thickness, for which the maximum values of equivalent plastic strain and equivalent stress are clearly smaller than in the composite. The closeness observed between the distributions of equivalent plastic strain and shear strain in the core layer of the composite indicate that shear strains are prevalent, in which the shear strain magnitudes and gradients at the vertical wall certainly favour core failure and failure by delamination; the equivalent materials show negligible shear strain values.
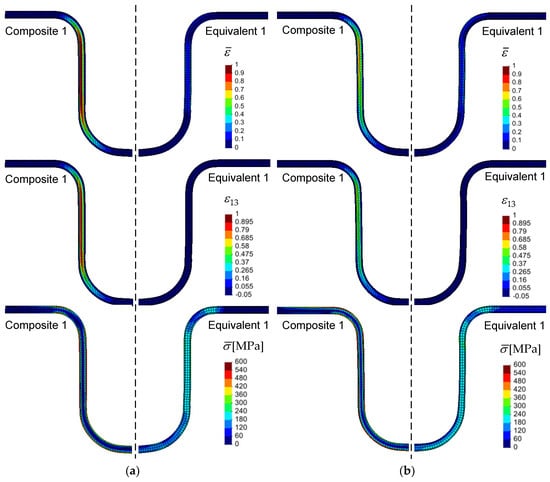
Figure 11.
Distributions of equivalent plastic strain, , Green–Lagrange shear strain, , and equivalent stress, , for Composite 1 and the equivalent material: (a) Case A; (b) Case B. The maximum values of , and are, respectively: 0.976, 0.978 and 515.75 MPa (for Composite 1 in Case A); 0.717, 0.619 and 578.23 MPa (for Composite 1 in Case B); 0.340, 0.007 and 267.71 MPa (for Equivalent 1 in Case A); 0.327, 0.007 and 263.5 MPa (for Equivalent 1 in Case B).
The increase of the blank holder force, from 0.28 kN/mm (case A-see Figure 11a) to 1.12 kN/mm (case B-see Figure 11b), leads to a decrease of about 25% in the maximum value of equivalent plastic strain, and subsequent reduction of the strain gradient in the composite. On the contrary, the equivalent material shows a strain distribution nearly identical for both values of blank holder force, in particular the maximum equivalent plastic strain is not significantly dissimilar. In this context, the diverse process conditions defined for cases A and B, which give rise to these differences in the strain distribution in the composite, are also reflected in the punch force vs. displacement results: for the case A (see Figure 10a), the equivalent material curve has a noticeably higher force level than the composite, which does not occur for case B (Figure 10b).
Although we do not find it necessary to show figures, it is worth to point out the effect of changing the die radius and the clearance between the punch and the die in the composite. The increase of the die radius, from 5 mm to 8 mm, leads to a strong reduction of the maximum values of the equivalent plastic strain (from 0.717 to 0.328) and shear strain (from 0.619 to 0.264), and, consequently, the strain gradients through thickness are reduced; on the other hand, the increase of the die radius does not have a significant effect on the equivalent stress results. Changing the clearance between the punch and the die, from 1.6 mm to 2.0 mm, does not have a significant effect on the stress and strain distributions. In addition, to check for any potential issues that may arise from the parameters of the hardening law, namely the hardening coefficient of Swift’s law, a lower value was considered for the metallic layers of Composite 1 (n equal to 0.10, in contrast to 0.239 for the steel). This material was chosen because its relatively low hardening coefficient is potentially more prone to plastic instabilities. However, the results are quite similar in terms of equivalent plastic strain and shear strain distributions, with no impact on the conclusions.
In summary, the process conditions influence the distribution of equivalent plastic strain through the thickness, which can reach relatively high values in the inner polymeric layer, due to the redundant shear deformation that occurs. In the cases analysed, the increase in the blank holder force from 0.28 kN/mm to 1.12 kN/mm led to a less heterogeneous strain distribution. It should be noted that high values of shear strain can lead to core failure [4]. Moreover, strong strain gradients, between the core and the outer layers, can cause delamination failures, as was observed in the case of the three-point bending test [5]; this depends strongly on the geometrical parameters of the test, such as the space between the counter rolls and the punch.
3.2.3. Strain and Stress Distribution for Composite 2
Figure 12 shows strain and stress distributions in the sheet thickness of the Composite 2 and the equivalent material, respectively for cases A and B (see Composite 2 in Table 3), presenting the distributions of equivalent plastic strain, Green–Lagrange shear strain and equivalent stress. In all the cases, the through-thickness strain and stress gradients are smoother than those found in Composite 1 and present lower values of equivalent plastic strain and equivalent stress. The equivalent plastic strain and shear strain distributions are more homogeneous when compared with the corresponding cases A and B of Composite 1, where the levels of shear strain are noticeably lower than those of equivalent plastic strain; this suggests that shear strain has a less relevant role than in Composite 1. In this context, the BHF has less influence on the results of Composite 2 than of Composite 1. Finally, it should be noted that the strain distribution of the composite is relatively close to that of the corresponding equivalent material; this is because the difference in the mechanical behaviour of the constituent materials of the Composite 2 is small, when compared to Composite 1 (see Figure 4).
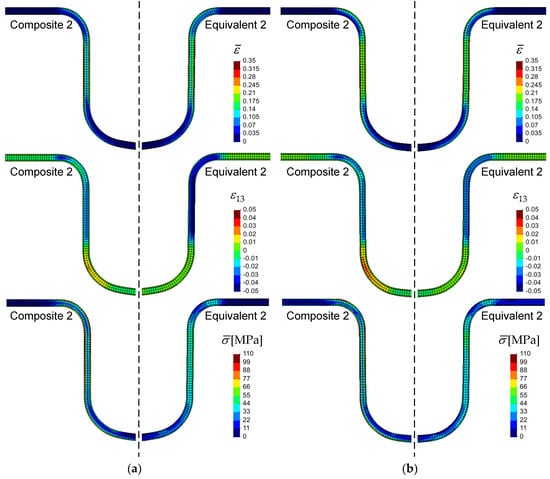
Figure 12.
Distributions of equivalent plastic strain, , Green–Lagrange shear strain, , and equivalent stress, , for Composite 2 and the equivalent material: (a) Case A; (b) Case B. The maximum values of , and are, respectively: 0.302, 0.02 and 103.86 MPa (for Composite 2 in Case A); 0.318, 0.032 and 105.52 MPa (for Composite 2 in Case B); 0.341, 0.01 and 53.86 MPa (for Equivalent 2 in Case A); 0.337, 0.01 and 53.53 MPa (for Equivalent 2 in Case B).
The influence of the clearance between the die and the punch and the influence of the die radius are qualitatively similar to that described for the Composite 1, although less important.
3.3. Deep Drawing of a Square Cup
Numerical simulations of the square cup forming process were performed to assess the behaviour of the composite materials and compare it to that of the respective equivalent materials. This forming process presents a more complex symmetry than the U-channel profile, offering a greater variety of strain paths, simultaneously (i.e., depending of the point location). First, the punch force vs. displacement results are analysed for two values of clearance, c, between the punch and the die: 2 mm and 4 mm. Two levels of blank holder force (BHF) were considered for each composite: (i) 9.8 kN and 19.6 kN, for the Composite 1; (ii) 2.45 N and 4.9 N, for Composite 2. Afterwards, the analysis focuses on the equivalent plastic strain and Green–Lagrange shear strain distributions in the sheet thickness, at the end of the forming process, which occurs after a punch displacement of 40 mm; the flange contours and flange draw-in are also analysed.
3.3.1. Force vs. Displacement
The results of punch force vs. displacement for the two composites and their corresponding equivalent materials, for the above-mentioned two values of clearance and two levels of BHF, are shown in Figure 13. The comparison between the curves of the composite and equivalent materials reveals identical behaviours during the deep drawing of a square cup, for both values of c and both levels of BHF, as was already the case for the U-channel profile, when the BHF value is high enough.
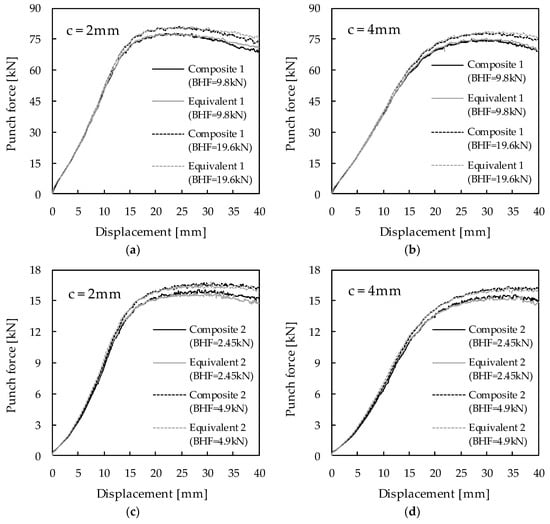
Figure 13.
Force vs. displacement of the punch during the square cup forming process, for two values of clearance, c: (a) and (b) Composite 1 and equivalent material 1, for c = 2 mm and 4 mm, respectively; (c) and (d) Composite 2 and equivalent material 2, for c = 4 mm, respectively.
3.3.2. Strain Distribution for Composites 1 and 2
Figure 14 and Figure 15 show examples of the equivalent plastic strain and Green–Lagrange shear strain distributions for the Composites 1 and 2, respectively, and their corresponding equivalent materials, with BHF equal to 19.6 kN (Composite 1, Figure 14) and 4.9 kN (Composite 2, Figure 15), where the clearance between the punch and the die is equal to 2 mm. Concerning the strain distributions in surface, there is not significant difference between the composites and the equivalent materials; this is also the case for BHF equal to 9.8 kN (Composite 1) and 2.45 kN (Composite 2), although not shown in the figures. However, there are differences through thickness, in case of Composite 1, although these differences are not noticeable in the case of Composite 2. This is related to the occurrence of shear deformation in the case of Composite 1 (see Figure 14) that does not occur in Composite 2 (see Figure 15), because in the latter case the difference in mechanical properties between the polymeric core and the outer metal layers is smaller than in the Composite 1 (see Figure 4). Finally, Figure 16 shows the flange contours corresponding to the examples shown in Figure 14 and Figure 15, as well as the relative difference in draw-in between each composite and their equivalent material, highlighting relatively small differences between the contours of composites and their equivalent materials (less than 5%).
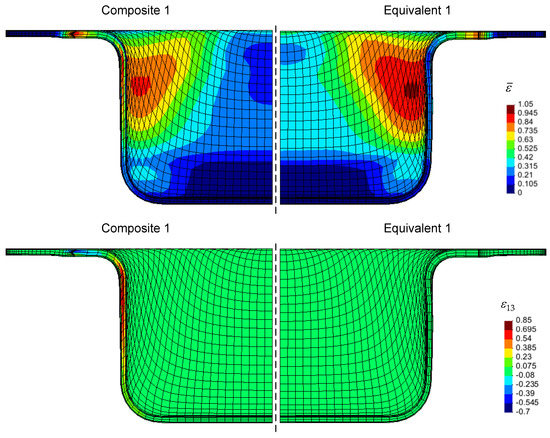
Figure 14.
Side view of the equivalent plastic strain distributions, , and Green–Lagrange shear strain, , in the Composite 1 and corresponding equivalent material, at the end of the deep drawing process for BHF = 19.6 kN. The maximum values of . and are, respectively: 0.989 and 0.817 (for Composite 1); 1.038 and 0.073 (for Equivalent 1).
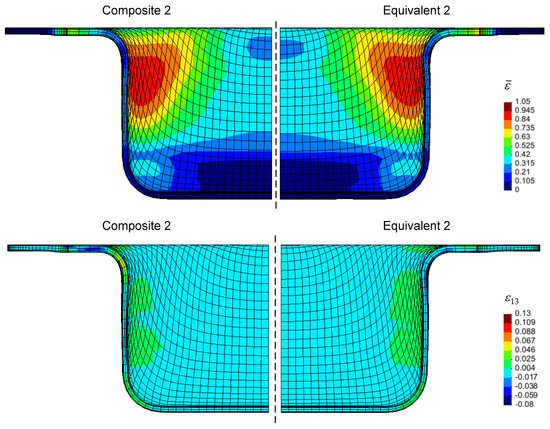
Figure 15.
Side view of equivalent plastic strain distributions, , and Green–Lagrange shear strain, , in the Composite 2 and corresponding equivalent material, at the end of the deep drawing process for BHF = 4.9 kN. The maximum values of and are, respectively: 1.024 and 0.121 (for Composite 2); 1.037 and 0.069 (for Equivalent 2).
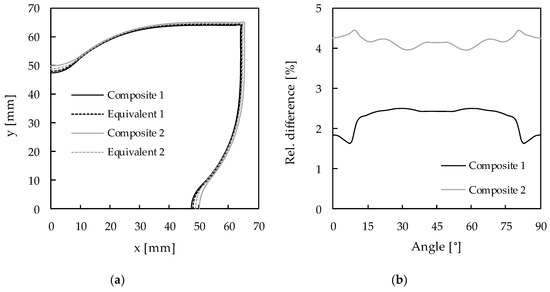
For the clearance between the punch and the die, c, equal to 4 mm (figures not shown), the results are quite similar to those of c = 2 mm, concerning the equivalent plastic strain and the Green–Lagrange shear strain, as well as the flange contour and draw-in.
4. Conclusions
The present work allowed the investigation of the plastic behaviour of sandwich composites, made up of two outer layers of a metal, steel or aluminium, and a polymeric core, with recourse to numerical simulation of bulge test and deep-drawing processes of a U-channel profile and a square cup. Equivalent materials, representing a single material with the same thickness and behaviour in tension defined by a rule of mixtures approach, were considered for comparison during the analysis of the behaviour of the sandwich composites.
The bulge test results showed that the pressure vs. pole height curve of the composite can be obtained by the weighted sum of the corresponding curves of the constituent layers. The respective equivalent material seems to reproduce well the behaviour of the composite in relation to the equivalent plastic strain; therefore, differences between both materials with regard to equivalent stress were observed, which, however, follows the rule of mixtures for the composite.
Under certain forming process conditions of the U-channel profile, a high equivalent plastic strain can occur in the composite core in contrast to the outer layers; this is due to the occurrence of shear stresses in the inner polymer layer, which can promote core failure and/or delamination. For example, the blank holder force is an influential parameter in the magnitude of the strain gradient through thickness of the composite. When the difference between the mechanical behaviour of the constituent materials of the composite decreases, the strain gradient in the thickness direction of the composite becomes smoother and approximates that of the corresponding equivalent material.
In order to test the forming process of a component with more complex geometry than the U-channel profile, the analysis of the deep-drawing of a square cup was performed. For this forming process, the conclusions are qualitatively the same as for the U-channel profile. Moreover, the analysis of the strain distributions in surface does not show significant difference between the composites and the equivalent materials, whatever the BHF value. The differences are mainly observed through thickness in the case of Composite 1, for which shear strain occurs; the differences are barely noticeable in the case of Composite 2, for which there is almost no shear strain.
Finally, the curves of force vs. displacement of the punch of the composites are similar to those of their equivalent materials, for both composites whatever the processes conditions, except in one case of the U-channel of Composite 1, where the BHF has a relatively small value.
Author Contributions
Formal analysis: A.E.M., P.A.P., A.F.G.P., N.A.S., M.C.O. and J.V.F.; funding acquisition: P.A.P. and J.V.F.; investigation: A.E.M.; software: M.C.O.; supervision: P.A.P. and J.V.F.; writing—original draft: A.E.M.; writing—review and editing: A.E.M., P.A.P., A.F.G.P., N.A.S., M.C.O. and J.V.F. All authors have read and agreed to the published version of the manuscript.
Funding
This research is sponsored by FEDER funds through the program COMPETE–Programa Operacional Factores de Competitividade and by national funds through FCT–Fundação para a Ciência e a Tecnologia, under the project UID/EMS/00285/2020. It was also supported by projects: RDFORMING (reference PTDC/EME-EME/31243/2017), co-funded by Portuguese Foundation for Science and Technology, by FEDER, through the program Portugal-2020 (PT2020), and by POCI, with reference POCI-01-0145-FEDER-031243; EZ-SHEET (reference PTDC/EME-EME/31216/2017), co-funded by Portuguese Foundation for Science and Technology, by FEDER, through the program Portugal-2020 (PT2020), and by POCI, with reference POCI-01-0145-FEDER-031216. All supports are gratefully acknowledged.
Conflicts of Interest
The authors declare no conflicts of interest.
References
- Bagherzadeh, S.; Mollaei-Dariani, B.; Malekzadeh, K. Theoretical Study on Hydro-Mechanical Deep Drawing Process of Bimetallic Sheets and Experimental Observations. J. Mater. Process. Technol. 2012, 212, 1840–1849. [Google Scholar] [CrossRef]
- Marandi, F.A.; Jabbari, A.H.; Sedighi, M.; Hashemi, R. An Experimental, Analytical, and Numerical Investigation of Hydraulic Bulge Test in Two-Layer Al–Cu Sheets. J. Manuf. Sci. Eng. 2017, 139, 031005. [Google Scholar] [CrossRef]
- Kim, J.G.; Baek, S.M.; Cho, W.T.; Song, T.J.; Chin, K.-G.; Lee, S.; Kim, H.S. On the Rule-of-Mixtures of the Hardening Parameters in TWIP-Cored Three-Layer Steel Sheet. Met. Mater. Int. 2017, 23, 459–464. [Google Scholar] [CrossRef]
- Andrews, E.W.; Moussa, N.A. Failure Mode Maps for Composite Sandwich Panels Subjected to Air Blast Loading. Int. J. Impact Eng. 2009, 36, 418–425. [Google Scholar] [CrossRef]
- Sokolova, O.A.; Carradò, A.; Palkowski, H. Metal–polymer–metal Sandwiches with Local Metal Reinforcements: A Study on Formability by Deep Drawing and Bending. Compos. Struct. 2011, 94, 1–7. [Google Scholar] [CrossRef]
- Harhash, M.; Sokolova, O.; Carradó, A.; Palkowski, H. Mechanical properties and forming behaviour of laminated steel/polymer sandwich systems with local inlays—Part 1. Compos. Struct. 2014, 118, 112–120. [Google Scholar] [CrossRef]
- Harhash, M.; Carradó, A.; Palkowski, H. Mechanical properties and forming behaviour of laminated steel/polymer sandwich systems with local inlays—Part 2: Stretching and deep drawing. Compos. Struct. 2017, 160, 1084–1094. [Google Scholar] [CrossRef]
- Miranda, S.S.; Amaral, R.L.; Santos, A.D.; Oliveira, T.F.; Malheiro, L.T. Analysis and characterization of the behaviour of a hybrid material, steel with polymeric core. In Proceedings of the XIII Congresso Ibero-americano de Engenharia Mecânica (CIBEM2017), Lisboa, Portugal, 23–26 October 2017. [Google Scholar]
- Miranda, S.S.; Santos, A.D.; Amaral, R.L.; Malheiro, L.T. Experimental and numerical analysis of springback and bending behavior of a composite sandwich metal-polymer material. AIP Conf. Proc. 2019, 213, 020020. [Google Scholar]
- Miranda, S.S.; Santos, A.D.; Amaral, R.L.; Malheiro, L.T. Characterization and Formability Analysis of a Composite Sandwich Metal-Polymer Material. In Materials Design and Applications II. Advanced Structured Materials; Silva, L., Ed.; Springer: Cham, Switzerland, 2019; Volume 98, pp. 487–508. [Google Scholar]
- Pereira, A.F.G.; Prates, P.A.; Oliveira, M.C.; Fernandes, J.V. Inverse identification of the work hardening law from circular and elliptical bulge tests. J. Mater. Process. Technol. 2020, 279, 116573. [Google Scholar] [CrossRef]
- Liu, J.; Xue, W. Unconstrained bending and springback behaviors of aluminum-polymer sandwich sheets. Int. J. Adv. Manuf. Technol. 2017, 91, 1517–1529. [Google Scholar] [CrossRef]
- Menezes, L.F.; Teodosiu, C. Three-dimensional numerical simulation of the deep-drawing process using solid finite elements. J. Mater. Process. Technol. 2000, 97, 100–106. [Google Scholar] [CrossRef]
- Neto, D.M.; Oliveira, M.C.; Alves, J.L.; Menezes, L.F. Applying Nagata patches to smooth discretized surfaces used in 3D frictional contact problems. Comput. Methods Appl. Mech. Eng. 2014, 271, 296–320. [Google Scholar] [CrossRef]
- Reis, L.C.; Prates, P.A.; Oliveira, M.C.; Santos, A.D.; Fernandes, J.V. Anisotropy and plastic flow in the circular bulge test. Int. J. Mech. Sci. 2017, 128–129, 70–93. [Google Scholar] [CrossRef]
- Makinouchi, A.; Nakamachi, E.; Onate, E.; Wagoner, R.H. NUMISHEET’93 Benchmark Problem. In Proceedings of the 2nd International Conference on Numerical Simulation of 3D Sheet Metal Forming Processes-Verification of Simulation with Experiment, Isehara, Japan, 31 August–2 September 1993. [Google Scholar]
- Santos, A.D.; Teixeira, P.; da Rocha, A.; Barlat, F. On the determination of flow stress using bulge test and mechanical measurement. AIP Conf. Proc. 2010, 1252, 845–852. [Google Scholar]
- Marques, A.E.; Prates, P.A.; Pereira, A.F.G.; Oliveira, M.C.; Fernandes, J.V.; Ribeiro, B.M. Performance Comparison of Parametric and Non-Parametric Regression Models for Uncertainty Analysis of Sheet Metal Forming Processes. Metals 2020, 10, 457. [Google Scholar] [CrossRef]
- Palkowski, H.; Sokolova, O.A.; Carradò, A. Sandwich materials. In Encyclopedia of Automotive Engineering; Crolla, D., Foster, D.E., Kobayashi, T., Vaughan, N., Eds.; John Wiley & Sons Ltd.: Hoboken, NJ, USA, 2013; pp. 1–17. [Google Scholar]
- Larour, P. Strain rate sensitivity of automotive sheet steels: Influence of plastic strain, strain rate, temperature, microstructure, bake hardening and pre-strain. Ph.D. Thesis, RWTH Aachen University, Aachen, Germany, April 2010. [Google Scholar]
- WebPlotDigitizer, version 4.2; Software For Obtain an Excel File with the Data Points; San Francisco, CA, USA, 2019; Available online: https://automeris.io/WebPlotDigitizer (accessed on 1 April 2020).
© 2020 by the authors. Licensee MDPI, Basel, Switzerland. This article is an open access article distributed under the terms and conditions of the Creative Commons Attribution (CC BY) license (http://creativecommons.org/licenses/by/4.0/).