Article

Beta Titanium Alloys Produced from Titanium Hydride: Effect of Alloying Elements on Titanium Hydride Decomposition

Department of Materials Science and Engineering, Universidad Carlos III de Madrid, IAAB, Avda. Universidad, 30, 28911 Leganés, Spain
*
Author to whom correspondence should be addressed.
Metals 2020, 10(5), 682; https://doi.org/10.3390/met10050682
Submission received: 21 April 2020 / Revised: 18 May 2020 / Accepted: 19 May 2020 / Published: 22 May 2020
(This article belongs to the Special Issue Powder Metallurgy of Titanium Alloys)

Abstract

:
The use of titanium hydride as a raw material has been an attractive alternative for the production of titanium components produced by powder metallurgy, due to increased densification of Ti compacts, greater control of contamination and cost reduction of the raw materials. However, a significant amount of hydrogen that often remains on the samples could generate degradation of the mechanical properties. Therefore, understanding decomposition mechanisms is essential to promote the components’ long life. Several studies on titanium hydride (TiH2) decomposition have been developed; nevertheless, few studies focus on the effect of the alloying elements on the dehydrogenation process. In this work, the effects of the addition of different amounts of Fe (5 and 7 wt. %) and Nb (12, 25, and 40 wt. %) as alloying elements were evaluated in detail. Results suggest that α→β transformation of Ti occurs below 800 °C; β phase can be observed at lower temperature than the expected according to the phase diagram. It was found that β phase transformation could take place during the intermediate stage of dehydrogenation. A mechanism was proposed for the effect of allying elements on the dehydrogenation process.

1. Introduction

Titanium and its alloys have been widely employed for high-performance components, due to their unique combination of low density, excellent mechanical properties, and high corrosion resistance. Aerospace and biomedical are currently the most important fields for applications of titanium products. Ti-based components are typically manufactured by a multi-step process of vacuum arc melting, hot rolling, scale removal, vacuum annealing machining, and surface treatment; all these fabrication stages make the final product expensive [1,2,3]. Powder metallurgy (PM) processing offers an interesting alternative for many applications since it provides near-net-shape parts [1], enhancing the flexibility of design, minimizing the machining steps, and increasing the material yield.
PM techniques allow production of components from refractory metals such as molybdenum, tungsten, or niobium, which are difficult to process by casting due to their high melting point, above 2000 °C. Besides, PM is a very useful alternative over casting for processing of components from elements with very different melting points that exhibit limited solubility in the liquid state and different density among them [4]. Hence, PM provides high flexibility in alloying design, overcoming limitations in casting, and achieving good homogenization of the alloying elements.
PM components are highly influenced by the characteristics of the starting powder, such as particle size and morphology [5]. In the case of Ti products, there is another key aspect: The content of interstitial elements such as O, N, and C [6,7]. These elements come from the reduction process of ilmenite (FeTiO3) and rutile (TiO2), due to the high reactivity of titanium. There are several processes to obtain commercial Ti powders. Among them, the HDH (hydride-dehydride) technique uses by-products of Ti sponge which are submitted to hydrogenation, ground until they achieve the suitable particle size, and then powder dehydrogenation is carried out [8]. Production of Ti powder from HDH process began around 1957 by the Titanium Metal Corporation [9]. These powders are irregular shape, the oxygen content is low, and they are suitable for pressing and sintering. Ti powders also can be obtained by several atomization techniques, in order to get spherical powders and usually make pre-alloyed powders [8]. In general, the cleaner the powder, the higher the cost. Therefore, finding a cheap powder with the appropriate features, in terms of morphology, purity, and particle size, suitable to be processed by the different PM techniques is one of the main challenges of the PM Ti industry.
On the other hand, processing of titanium powders to give final components by the conventional pressing and sintering route requires sintering temperatures around 1200–1400 °C employing long dwell times (2 to 5 h typically) which suppose high energy consumption. Hence, there is room to reduce processing cost by means of alternative routes or using alternative starting powders and alloying elements that help to improve the sintering parameters maintaining the final properties, in terms of density and microstructure [1,8].
Use of titanium hydride (TiH2) is an attractive alternative to reduce the cost of raw material and adapt processing parameters of PM titanium components. The main advantages of the use of TiH2, compared to Ti powders are: (1) TiH2 as raw material is cheaper because it is an intermediate product in the HDH-Ti powder production. (2) It achieves higher densification compared to Ti sintered under the same conditions [10,11]. (3) The brittle behavior of TiH2 helps to fragment particles during pressing improving/increasing the compressibility of the powder [7,11,12,13]. (4) The lattice defects generated by decomposition reactions of TiH2 activate the diffusion process, which leads to pore healing and accelerates the chemical homogenization of the final product [13]. (5) Hydrogen released during the transformation to Ti, through the reaction   T i H 2 T i + H 2 , provides a protective atmosphere for the Ti surface that reduces/controls the contamination amount [12,14,15].
In 1970, Greenspan et al. reported a process to produce titanium alloys and metal matrix composites by hot pressing using titanium hydride as starting powder; this process was called decomposition powder metallurgy [16]. Afterwards, in 1974, Obara et al. patented the first press and sinter process, both in vacuum and inert gas atmosphere, to produce Ti alloys from TiH2 powder [16]. Since then, several works focused on the development of processes for the production of hydrogenated Ti powder, as well as sintering of titanium hydride components.
All TiH2 applications depend on the decomposition of TiH2: How hydrogen is released when it is subjected to a heat treatment. The process of TiH2 decomposition has been widely researched through simultaneous thermal analysis under different atmospheres combined with structural analysis and in-situ methods [17,18,19,20,21,22,23]. Although there are discrepancies about the sequence of the phases formed during TiH2 decomposition process, researchers agree that this process is strongly dependent on samples’ features, like the purity of the powder, particle size, and surface contamination, which can act as a barrier for the release of hydrogen. Besides, the heating rate and atmosphere employed during heat treatment are important aspects to be taken into account in order to promote the decomposition [19,21,24,25].
Many studies have been developed on thermal behavior of TiH2 since its decomposition temperature is an essential aspect to take into account when it is used in an alloy system as a foaming/blowing agent [18,26,27,28]. Sintering of Ti alloys employing TiH2 powders has also been extensively studied [19,25,29,30,31]. However, there are few studies about the effect of alloying elements on the TiH2 decomposition. Understanding the interactions among hydrogen and alloying elements during and after the dehydrogenation process could become a powerful tool in achieving microstructure control of Ti alloys, especially in β-Ti alloys.
Bone resorption due to the stress-shielding phenomenon is one of the main failures produced in Ti implants; it is generated by the high difference between elastic modulus of the Ti implants (100–110 GPa) and the cortical bone (10–30 GPa) [32]. Hence, it is important to reduce the elastic modulus by development of β-Ti alloys that generally exhibit a lower elastic modulus, closer to that of the cortical bone. Both Fe and Nb are nontoxic and biocompatible β-stabilizer elements employed to develop low elastic modulus alloys. High Nb content is required to get the β-Ti phase, which could produce nonhomogeneous microstructures due to the low diffusivity of Nb into Ti matrix. Furthermore, Nb is an expensive metal, so addition of large Nb amounts implies increasing the cost of the alloy. Hence, it is necessary to develop β-Ti alloys using other alloying elements that promote the β phase stabilization with lower Nb amount [33]. Addition of small amounts of Fe have several advantages for Ti alloys processing: Fe promotes the β phase stabilization allowing decrease of the Nb content required; it improves the sinterability of Ti alloys since it accelerates mobility of Ti atoms by rapid Fe diffusion; Fe increases the Ti auto-diffusion coefficient [34], which could enhance the Nb diffusion process, promoting a homogeneous microstructure; and, finally, Fe is a low-cost material, so substituting Nb with Fe can contribute to the cost reduction of the alloy.
The objective of this work was to identify the phases that are formed during the decomposition of titanium hydride as well as the effect of the addition of β-stabilizing elements such as Fe and Nb on the decomposition of titanium hydride, in order to be able to control the decomposition process and produce β-titanium alloys from titanium hydride. The study was performed controlling shrinkage, mass loss related to hydrogen released, and densification, as well as the evolution of the microstructure in the different stages of the process.

2. Experimental Procedure

The raw materials used in this study were TiH2 powder (average particle size: 27 µm, supplied by Gesellschaft für Elektrometallurgie mbH, GfE, Nürnberg, Germany), elemental Nb powder (average particle size: 18 µm, supplied by Sat Nano, Dongguan, China), and elemental Fe powder (average particle size: 4 µm, provided by H.C Starck, Munich, Germany). Average particle size was measured for the starting powders using a laser diffraction particle size analyzer Mastersizer 2000 (Malvern Instruments Ltd., Worcestershire, UK). Further information about the powders employed is shown in previous work [30].
Size of TiH2 and Nb powders was chosen by availability reasons, while size and morphology of Fe powder was previously studied. The following work gives details on the all powders employed as well as the study of the effect of Fe particle size on densification of Ti-Nb and Ti-Fe-Nb alloys [30].
Samples were prepared by blending the required amount of powders for 1 h in a Turbula® multidirectional mixer (WAB, Muttenz, Switzerland). The green compacts (discs of 16 mm in diameter) were obtained in a uniaxial press by means of a floating die at 700 MPa using between 2–2.5 g of powder.
Fundamental thermal analyses were performed in order to understand the mechanism of TiH2 decomposition and how it is affected by the addition of beta-stabilizing elements, such as Nb and Fe, as well as to identify the critical points of TiH2 decomposition. The thermal analyses consisted of differential thermal analysis (DTA) and thermogravimetry analysis (TGA) carried out on a Setaram Setsys ‘Evolution 16/18′ (Setaram Instrumentation, Caluire-et-Cuire, France) for mixtures of powders, filling the alumina crucible with 80 mg of powders. The resolution to the equipment was 0.002 μg for the weight and 0.4 μV to the heat flow. Dilatometry (DIL) measurements were performed for square pressed samples (about 1 cm side length), using a dilatometer Setaram Setsys Evolution TMA (Setaram Instrumentation, Caluire-et-Cuire, France) with a vertical configuration. For all thermal analyses, samples were heated at 10 °C/min up to 1250 °C, then were cooled at 10 °C/min; tests were performed under argon flowing at 80 mL/min. The standby temperature for DTA, TGA, and DIL analyses was 45 °C.
On the other hand, thermal treatments were carried out for green compacts using high-vacuum conditions (VAC) reaching up 10−5 mbar. VAC tests were done to corroborate the transformation reactions and dimensional changes observed by thermal analysis, as well as to evaluate the microstructural evolution during the decomposition stages. The VAC treatments were carried out in a high-vacuum tube furnace, model Carbolite-Hut 15/50/450 (Carbolite, Derbyshire, UK), equipped with a diffusion pump coupled to a rotary pump. The VAC treatments were performed between 400 and 1100 °C. For heat treatments from 400 °C to 800 °C, samples were heated with a heating rate of 2 °C/min. While samples treated at 1100 °C, were heated up 800 °C at 2 °C/min. Then, from 800 to 1100 °C, samples were heated at 5 °C/min. In all cases, once the chosen temperature was reached, it was maintained for 5 min, then the furnace was cooled to room temperature with a cooling rate of 5 °C/min. During dehydrogenation, a heating rate of 2 °C/min was used in order to promote the hydrogen elimination according to previous results reported by Chirico et al. [30]. Afterwards, the heating rate was increased to 5 °C/min between 800 to 1100 °C to promote sintering after dehydrogenation took place. Five specimens were analyzed for each heat treatment.
These temperatures were chosen based on several works that focused on titanium dehydrogenation and supported that reactions occurred at similar temperatures to the chosen temperatures in this work. At 400 °C, it was considered that the process had already started. While at about 500 °C and 650 °C, two intense peaks appeared, corresponding to the typical decomposition stages of TiH2. Many authors state that above 800 °C the dehydrogenation process has finished. Finally, 1100 °C was selected in order to evaluate the interaction of the alloying elements with the matrix, during the early sintering stage. The VAC treatments were performed for some compositions, which were selected from the thermal analysis results. Alloys containing 7 wt. % Fe were discarded due to signs of formation of TiFe intermetallic and alloys containing higher than 40 wt. % of alloying elements were also discarded since it was considered that was a very high amount of Nb to produce a homogeneous material.
Figure 1 shows the thermal treatments performed in this work and Table 1 summarizes the compositions prepared as well as the method employed for their analysis. The amount of TiH2 in the mixtures was calculated to obtain the mentioned final compositions of Ti after the dehydrogenation process.
Microstructural analyses were performed using a Philips XL-30 (Philips, Eindhoven, The Netherlands) scanning electron microscopy (SEM) coupled with energy-dispersive X-ray spectroscopy (EDS, EDAX, Mahwah, NJ, USA). Samples were embedded in a conductive resin, then they were metallographically prepared. First, samples were ground using a sandpaper from 180 to 1000 grit (ISO/FEPA). Next, they were polished with an alumina suspension of 3 and 1 μm. Finally, samples were cleaned with acetone.
The phase structures present after each thermal treatment at different temperatures (25 °C, 400 °C, 500 °C, 650 °C, 800 °C, and 1100 °C) were identified by X-ray diffraction (XRD) using X’pert Philips (Philips, Eindhoven, The Netherlands) with Cu Kα radiation 1.54 Å and an accelerating voltage of 40 kV and a current of 40 mA.

3. Results and Discussion

3.1. Effect of Alloying Elements on Thermal Decomposition of Titanium Hydride

Figure 2 shows the DTA results of the powder samples. For comparison proposes, an unalloyed TiH2 curve has been plotted alongside the powder mixtures in all cases. Table 2 summarizes the temperatures of interest for each decomposition stage obtained from DTA tests. DTA curves exhibit a typical decomposition behavior for TiH2. Overall, for all samples and compositions, two reactions can be distinguished, represented by two intense and discernible endothermic peaks between 450–625 °C. The temperature of these peaks coincided with local maximums of hydride decomposition reaction and hydrogen release rate. The last stage observed, corresponding to a slight shoulder (marked with an arrow) around 630–870 °C, was associated with the third decomposition stage. Changes in the third stage were subtle due to the fact that the remaining hydrogen was very low in this temperature range.
According to literature, the whole TiH2 decomposition takes place between 380–800 °C approximately [13,18]. Reported data of accurate temperature of dehydrogenation stages, as well as the corresponding phase transformation, can differ. This is because there is a strong dependence on samples’ features, like the purity of powder, samples mass, particle size, surface contamination, and experimental techniques employed, like heating rate, atmosphere, etc.
Liu et al. [21], Kennedy [35], and Ma et al. [24] proposed that dehydrogenation occurs with the following sequence (Equation (1)):
δ ( TiH 2 ) Stage   I   δ ( TiH x )   Stage   II β ( Ti ) H Stage   III β ( Ti ) H +   α ( Ti ) H   Stage   IV α ( Ti )
In the beginning, hydrogen atoms are released and change their position randomly from tetrahedral to octahedral interstitials sites, but keeping the initial FCC structure of δ-TiH2 (stage I). During stage II, as hydrogen is lost, δ phase is gradually transformed to β-Ti phase that is hydrogen-rich (β-TiH) with a BCC crystal structure. In stage III, hydrogen is continuously released from β-TiH, and α-TiH begins to form when the hydrogen amount is low enough. Overall, during stages II and III, the highest conversion of titanium hydride takes place, achieving up to 80% of dehydrogenation. These stages are usually quick and intense; they may occur, simultaneously, between 500–700 °C [21]. The phase transformation model is like a core-shell structure, where δ (TiHx) constitutes the nucleus; the intermediate layer corresponds to β-TiH and external layer is α-TiH. Finally, complete α-Ti transformation occurs, which means that complete hydrogen elimination is produced in the last stage, but this stage is very dependent on the surface features. It has been reported that the formation of a slight layer of oxide on the particle surface could hinder complete dehydrogenation [10,19,20,21].
Several authors only agree on the first decomposition stage, where the progressive loss of hydrogen keeping the FCC structure is produced. Another approach claims that the TiH2 decomposition occurs through the δ (TiHx) transformation to α-Ti on the particle surface. In this case, the phase structure changes from FCC to HCP.
Dehydrogenation process did not seem considerably modified by the addition of a different amount of Nb and Fe, either by elemental or combined addition, considering that for all samples the three stages of the dehydrogenation process could be observed (Figure 2). However, the addition of alloying elements was found to accelerate the beginning of the reaction during the first stage: Both onset and peak temperatures were shifted to lower temperatures around up to 95 °C and 40 °C, respectively (Table 2). Meanwhile, the temperature of stage II was maintained similar to TiH2 for all samples with a variation of ±25 °C. Finally, it can be seen that the dehydrogenation process for mixtures of powders finished at a higher temperature compared to pure TiH2. This factor suggests that the alloying elements could act as a barrier for the removal of the remaining hydrogen. The last theoretical dehydrogenation stage/reaction (stage IV), where the transformation βH + αH to α-Ti phase takes place, was not expected to happen for the alloyed samples due to the presence of a high quantity of beta-stabilizer elements incorporated, which considerably reduced the beta transus temperature with respect to unalloyed Ti.
On the other hand, in the detail of Figure 2a, a slight endothermic peak between 850–950 °C for TiH2 can be seen, which corresponds to theoretical α → β transformation (882 °C). No α → β transformation was observed for samples of Ti-Nb and Ti-5Fe-Nb systems. The α → β transformation was expected to occur at lower temperature due to Fe and Nb addition, as well as the possible remaining hydrogen. Therefore, the absence of this slight endothermic peak in all powders that contained Fe and Nb alloying elements could be attributed to the α → β transformation taking place at lower temperatures and overlapping with the second stage of dehydrogenation process.
At higher temperature, around 1090 °C, an exothermic reaction for TiH2-7Fe (detail Figure 2a) was produced, which was associated with the formation of intermetallic TiFe [36]. In the case of TiH2-5Fe, there was no evidence of this reaction. This could indicate that 5 wt. % Fe was not enough to promote TiFe formation. During cooling, reverse reactions to those produced during heating were not observed, due to the irreversibility of Ti-Fe reaction, and the stability of the β phase.

3.2. Shrinkage Evolution During the Dehydrogenation Process

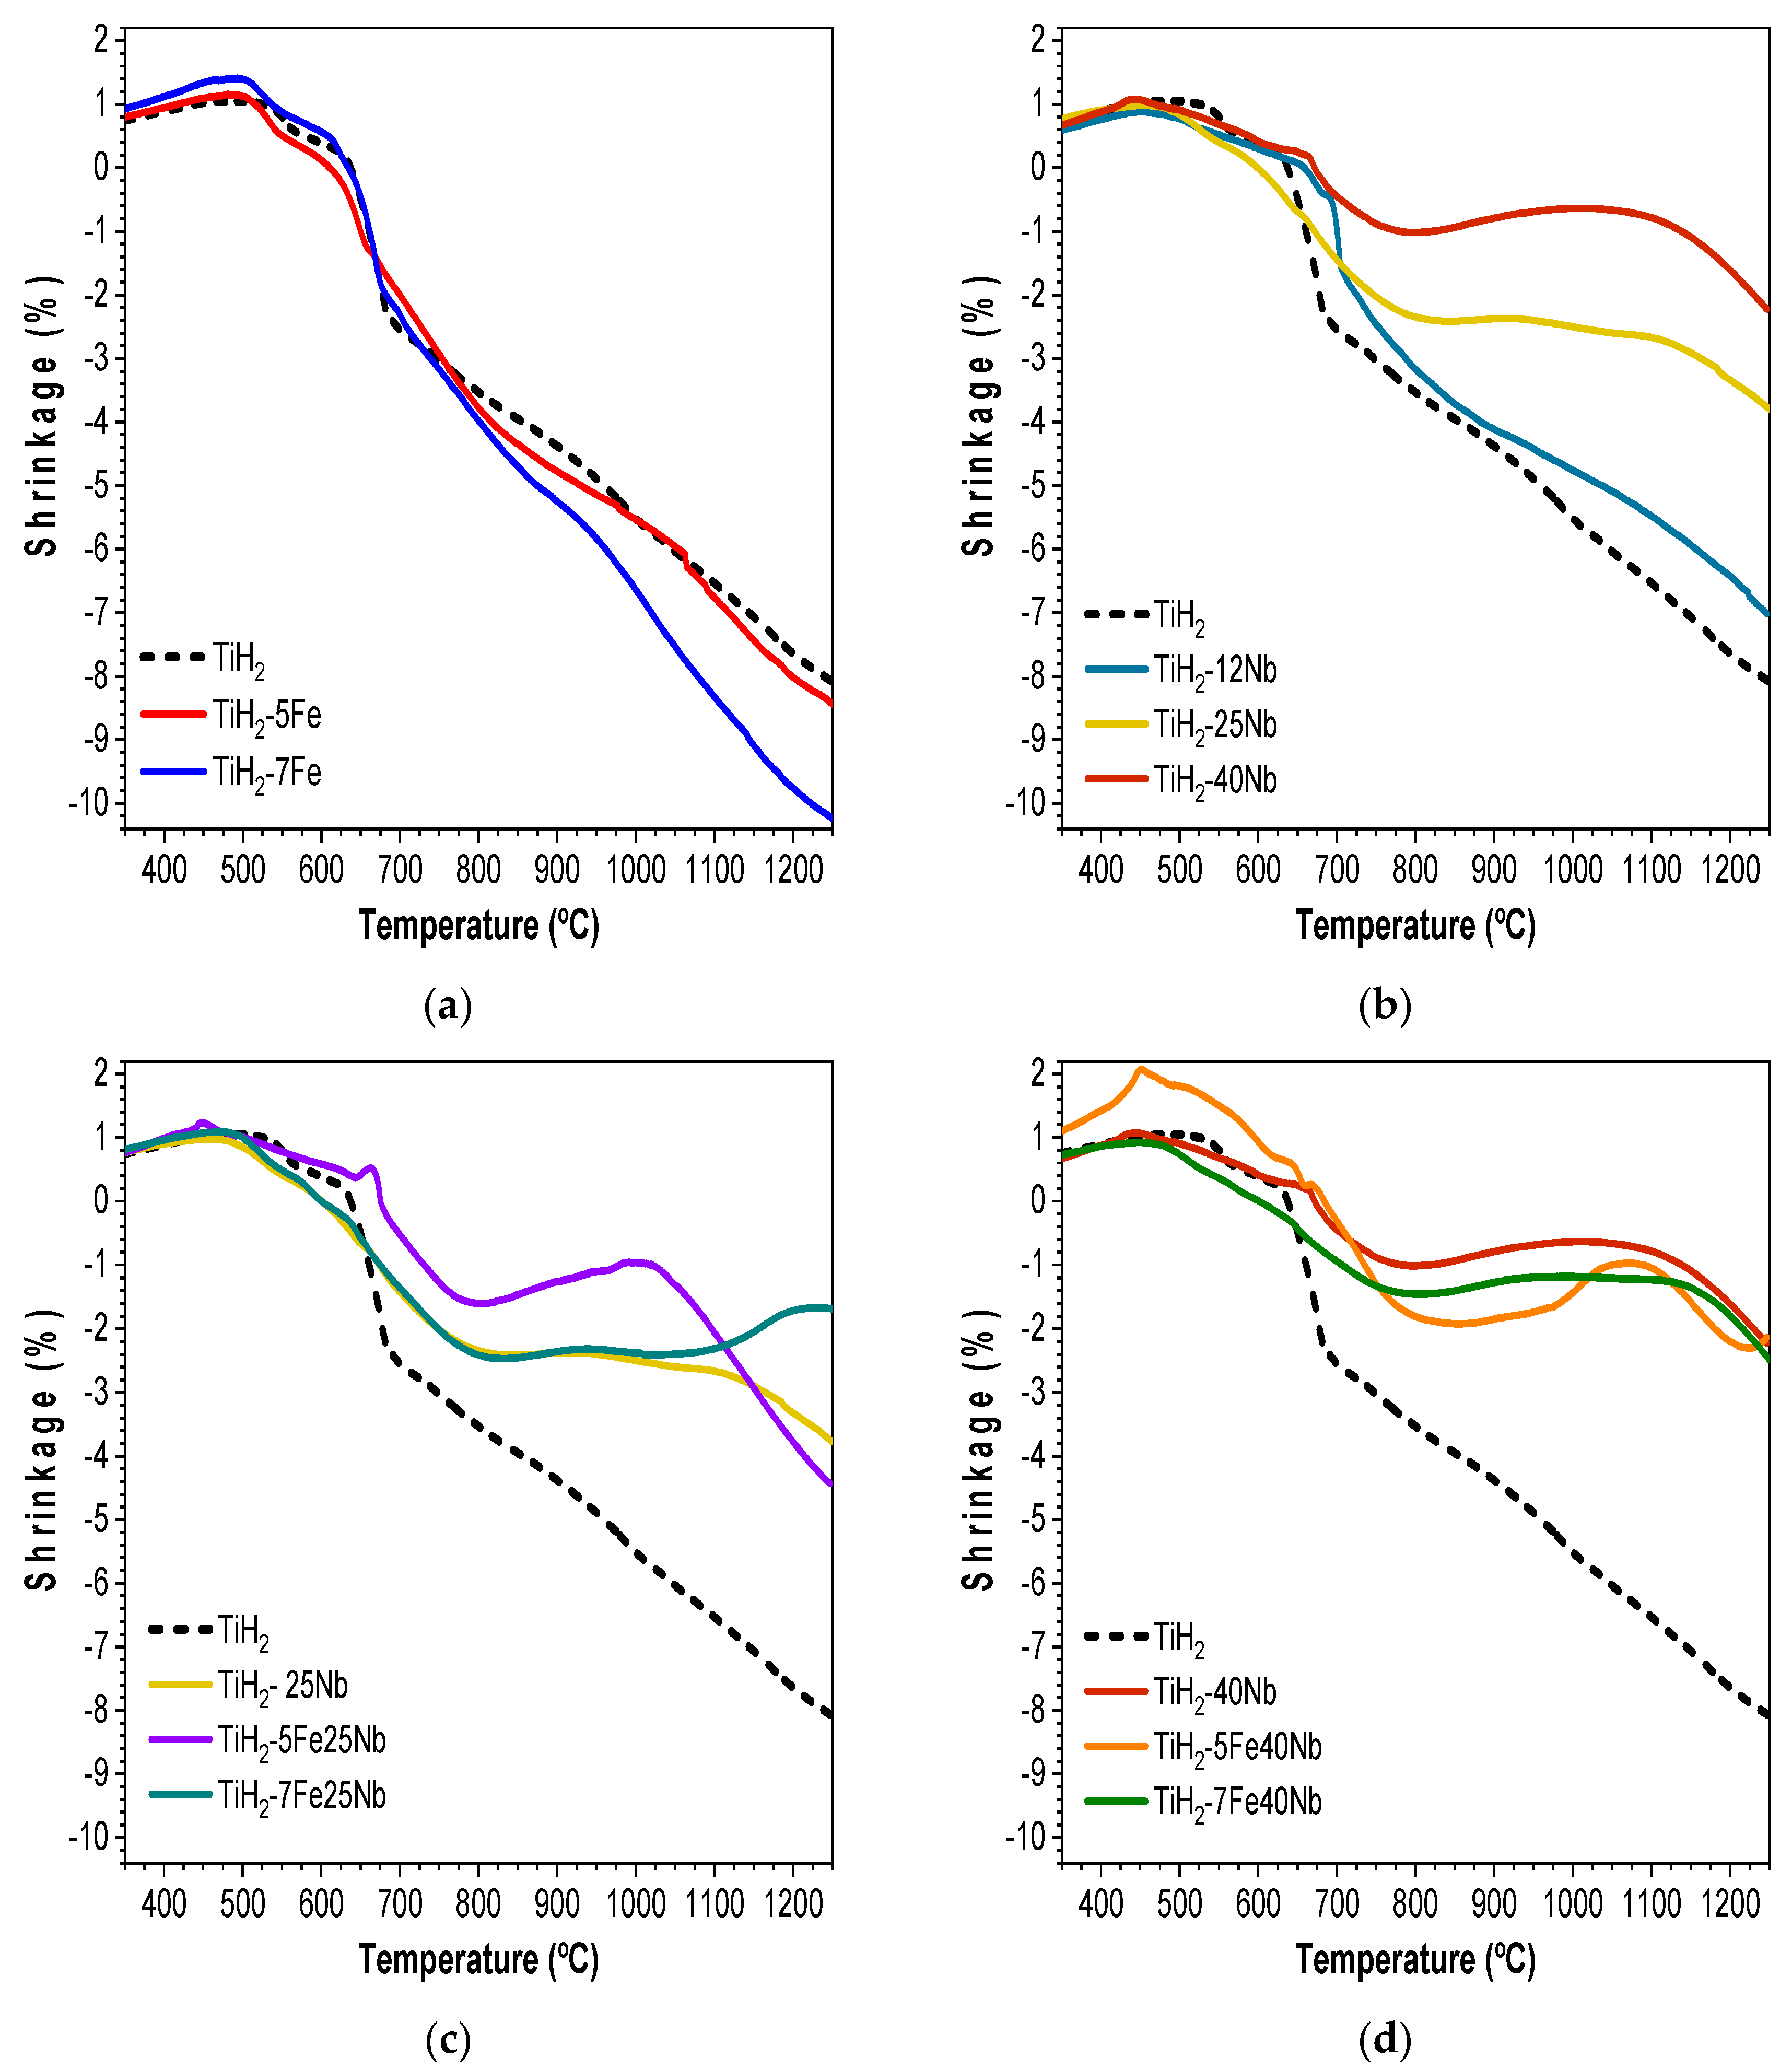
In order to understand the behavior during TiH2 decomposition and sintering of base Ti alloys, dilatometry experiments were carried out for all compositions. Figure 3 plots the dilatometric curves. In all diagrams, a curve for pure TiH2 is included as a reference. According to Wang et al. [10], densification behavior of TiH2 compounds was a consequence of two reasons: (1) The volume change caused by the high density of dislocations and vacancies due to the dehydrogenation process, which increases diffusion rates; and (2) the cleaning effect of the hydrogen atoms released that can remove a fraction of oxygen of the Ti surface and promote sintering densification. In this work the effect of addition of beta-stabilizer elements, like Nb and Fe, on dehydrogenation and densification processes is evaluated.
Samples with a lower amount of alloying elements (TiH2-5Fe, TiH2-7Fe, and TiH2-12Nb) presented similar shrinkage to unalloyed TiH2. As the content of alloying elements increased, shrinkage was considerably modified as compared to pure TiH2.
In the beginning, all samples exhibited expansion up to 500 °C; this coincides with stage I of TiH2 decomposition. This extension could be attributed to the increase of the lattice parameter of δ-TiHx due to the thermal expansion coefficient change as the temperature increased, as well as to the lattice defects generated by the removal of hydrogen.
In Figure 3a, it can be seen that expansion was followed by a drastic increase of shrinkage rate up to 600 °C. This agrees with stage II of TiH2 decomposition, which is the most intense step of the dehydrogenation process and produces a quick shrinkage of the samples due to the higher amount of hydrogen released. During this stage, the crystallographic structure changed from FCC (δ-TiHx) to BCC (β-TiH), which also contributed to the change in volume due to solute atoms’ rearrangement. Taking into account the diffraction patterns obtained from the International Center for Diffraction Data (ICDD) database for δ-TiHx (03-065-0934) and β-Ti (01-089-4913), which have lattice parameters of 4.450 Å and 3.283 Å, respectively, an approximate calculation of the shrinkage expected could be made. According to these lattice parameters and the number of atoms in the unit cell of each crystal structure, one-unit cell FCC (δ-TiHx) had a volume of 0.088 nm3, and it was transformed into two-unit cells BCC (β-Ti), which exhibited a volume of 0.071 nm3 (0.035 nm3 each one). Hence, with a rough calculation, it could be estimated that this crystal structure change involved shrinkage around 20%.
Next, between 600 and 800 °C shrinkage occurred more slowly due to the fact that dehydrogenation was almost finished. Around 800 °C, a slight slope change could be observed, which suggests that sintering has started. Then, from 800 °C the shrinkage observed could be related to the neck formation between Ti particles. Results indicate that Fe addition promotes sample densification since TiH2-7Fe showed higher contraction value than TiH2-5Fe and TiH2. Samples TiH2 and TiH2-5Fe reached a shrinkage of 8% and 8.5%, respectively, while 10.2% was achieved for sample TiH2-7Fe. This fact may have been caused because Fe increases self-diffusion coefficient of Ti, which enhances the sinterability [37]; furthermore, the small particle size of Fe employed (D50 3–4 μm), and its spherical morphology, improves filling of empty spaces between TiH2 particles, promoting better sample densification. Although TiH2-7Fe sample exhibited densification 24% higher than pure TiH2 and 18% greater than sample TiH2-5Fe, the possibility of formation of TiFe with the addition of 7 wt. % should be taken into account since it could be undesirable due to its brittle nature.
With respect to the effect of Nb addition, Figure 3b indicates that as the Nb amount increased the percentage of shrinkage decreased, which was expected because as TiH2 content decreases the sample contraction is lower, too. The values of linear shrinkage achieved correspond to 7%, 3.8%, and 2.2% for TiH2-12Nb, TiH2-25Nb, and TiH2-40Nb, respectively. Sample TiH2-12Nb exhibited a behavior similar to TiH2, although a decrease of the shrinkage rate from 650 °C (after stage II) could be noted. For samples TiH2-25Nb and TiH2-40Nb, after the initial expansion observed (stage I), the shrinkage rate was more subtle than TiH2, which suggested that Nb could delay or inhibit the TiH2 decomposition process. On the other hand, around 900 °C a shoulder could be observed, which became more evident as the Nb amount increased. This could be related to the diffusion process of Nb into the Ti lattice. It has been reported that the interdiffusion coefficient of Ti-Nb decreases over 2–4 orders of magnitude with an increase in the Nb amount [38,39]. According to the Ti-Nb phase diagram, BCC-Nb and BCC-Ti are completely soluble over 900 °C; therefore, from this temperature, onwards diffusion processes were faster with the increase in temperature [40].
Figure 3c,d shows the influence of Fe addition on the alloys with higher Nb content (25 wt. % and 40 wt. %, respectively). These alloys suffered smaller shrinkage than unalloyed TiH2 and the influence of Nb mixed/combined with Fe was not clear. An expansion of 0.6% was found at 1000 °C for sample TiH2-5Fe25Nb, whereas TiH2-7Fe25Nb reached an expansion of 0.8%, which was delayed until 1250 °C. For samples containing 40 wt. % of Nb, expansion of 1% was observed just for TiH2-5Fe40Nb around 1075 °C, while TiH2-7Fe40Nb showed shrinkage behavior similar to TiH2-40Nb. Further tests are necessary in order to understand the effect of the simultaneous addition of Nb and Fe.
Even when the starting temperature of dehydrogenation stages could be shifted with the addition of alloying elements, decomposition behavior did not seem to be modified significantly with respect to unalloyed TiH2. However, the final sample densification was affected/altered by the incorporation of the alloying element since both Fe and Nb had different interactions with Ti particles (once TiH2 was decomposed). On one hand, Fe promoted sinterability; therefore, final densification increased. On the other hand, Nb, owing to its large atomic size and poor diffusion rate, impeded/limited the densification.

3.3. Comparison of Mass Loss during the Dehydrogenation Process under Different Environments

Mass losses of samples tested under argon (TGA analysis) and under vacuum (VAC, heat treatment in a tubular furnace) are shown in Figure 4a,b, respectively. In both cases, the mass loss percentage is in accordance to the TiH2 fraction present in each composition. So, TiH2 exhibited the highest mass loss of 3.9%, while, as the amount of alloying elements increased, mass loss decreased. Thereby, the most alloyed composition, TiH2-40Nb, showed the lowest mass loss of 2.5%.
Table 3 summarizes the relative weight loss achieved in both environments, which was related to the total amount of hydrogen according to the initial TiH2 powder in each mixture. It was noticeable that at low temperature, while the dehydrogenation process took place (up to 800 °C approximately), samples evaluated under vacuum condition reached higher weight loss compared to samples treated in argon flow.
For all samples, no observable mass loss was found at 400 °C in argon flow, while in high vacuum at least 14% of hydrogen loss for TiH2-5Fe25Nb was reached. At 650 °C, almost all hydrogen contained in the samples was released for VAC samples: Sample TiH2-5Fe reached hydrogen loss of 90.6% under vacuum, while with argon it reached 57.1%. Finally, from 800 °C onwards, mass loss became stable for vacuum samples while for samples in argon, hydrogen it was still being released. The amount of hydrogen retained on the samples TiH2-5Fe, TiH2-12Nb, and TiH2-5Fe25Nb could be attributed to a slight layer of oxide formed on particle surface, which interferes with complete degasification. The formation of this oxide layer was highly likely due to the inherent nature of Ti and it has been previously observed in literature [10,19,20,21].
According to results, dehydrogenation occurs faster under vacuum than in argon flow; this is due to the fact that hydrogen released during the decomposition process is continuously removed when the samples are under vacuum. Moreover, the heating rate is an important aspect to consider on dehydrogenation. Many researchers have reported that a lower heating rate promotes an effective dehydrogenation process [21,24]. Tests in argon flow were carried out with a heating rate of 10 °C /min, while in vacuum a rate of 2 °C/min was employed. Hence, the sum of these observations suggests that both lower heating rate and high-vacuum sintering enhanced the dehydrogenation process, promoting an effective/complete hydrogen elimination. In all cases, the addition of alloying elements did not hinder achievement of full dehydrogenation, even when the starting and ending temperature of the reactions could be slightly shifted.

3.4. Microstructure Evolution during the TiH2 Decomposition

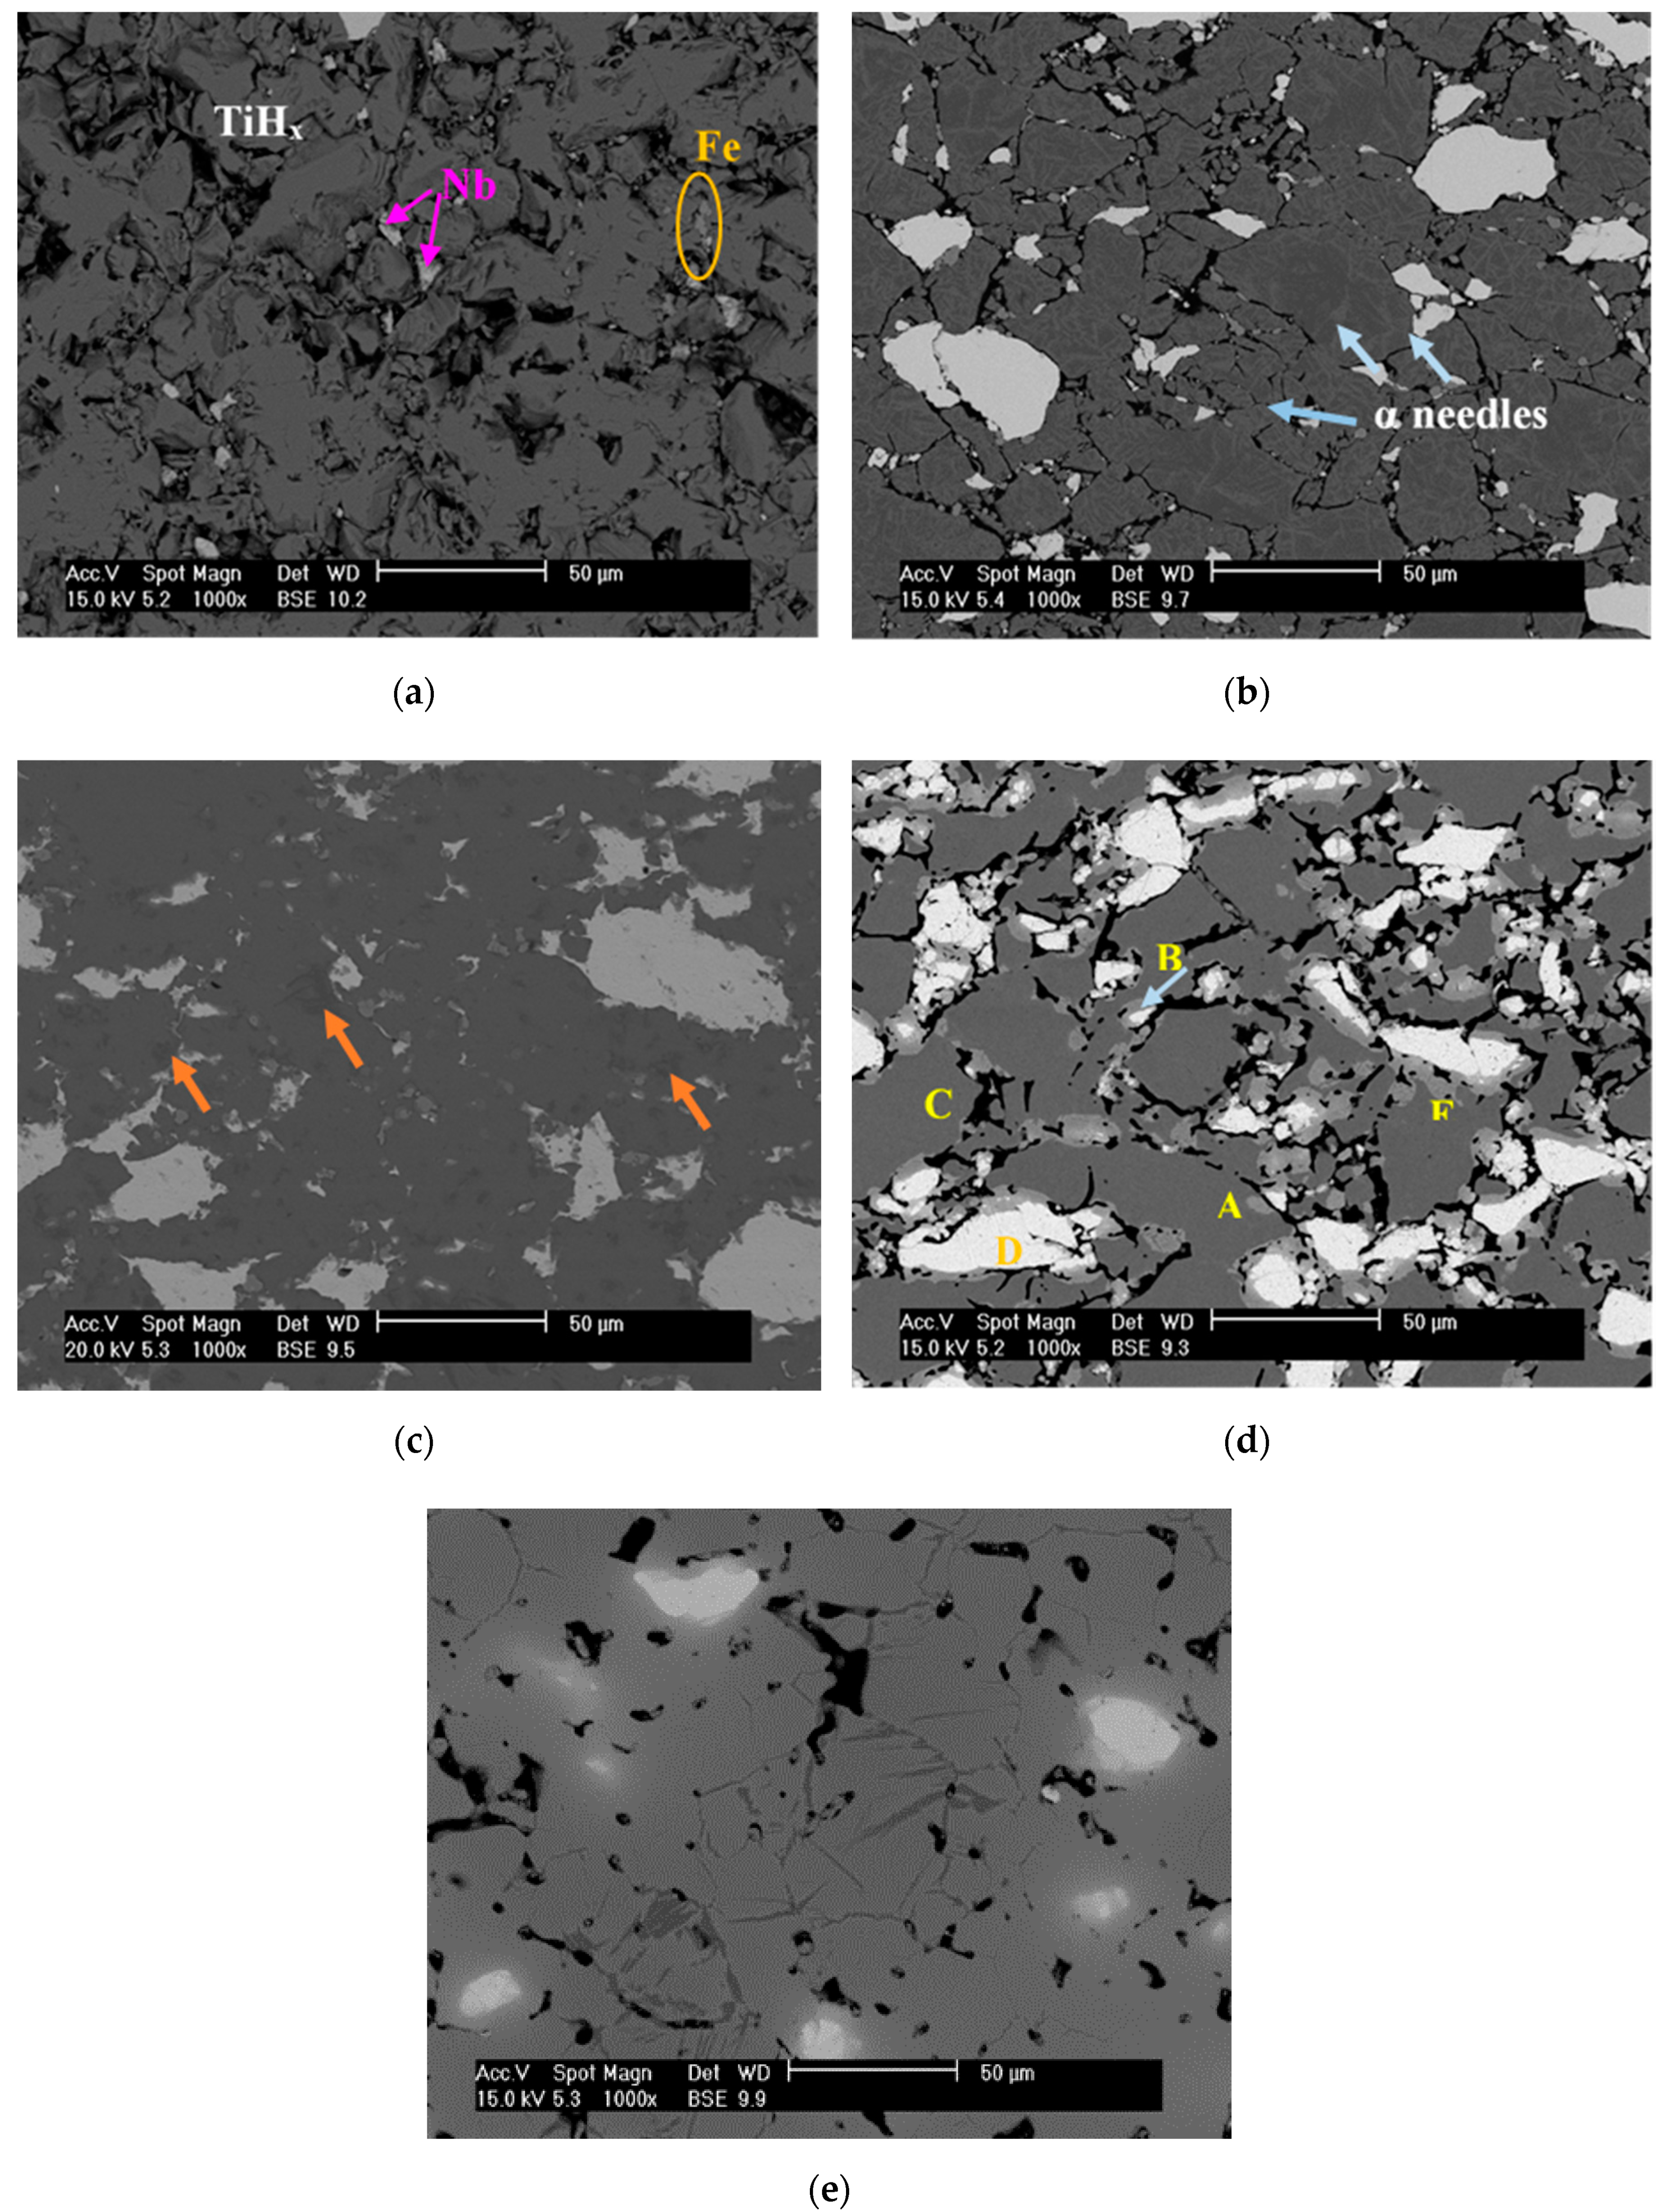
Microstructure evolution during the dehydrogenation process of TiH2-5Fe25Nb heated from 400 to 1100 °C is displayed in Figure 5. Similar behavior and characteristics were observed for the other compositions studied.
At 400 °C (Figure 5a), no significant changes were found in the microstructure with respect to green compacts. The sample seems to be composed of particles of titanium hydride, Nb, and Fe, which maintain their original morphology due to the pressing process. Due to the brittleness of titanium hydride, smaller broken particles can be seen filling the holes between the bigger particles. According to the results reported in Table 3, the weight loss of TiH2-5Fe25Nb at 400 °C was about 14% of hydrogen, which suggests dehydrogenation had already started. This fact suggests that samples at 400 °C were composed of a nonstoichiometric titanium hydride, TiHx, were x is referred to a fraction between 1 and 2.
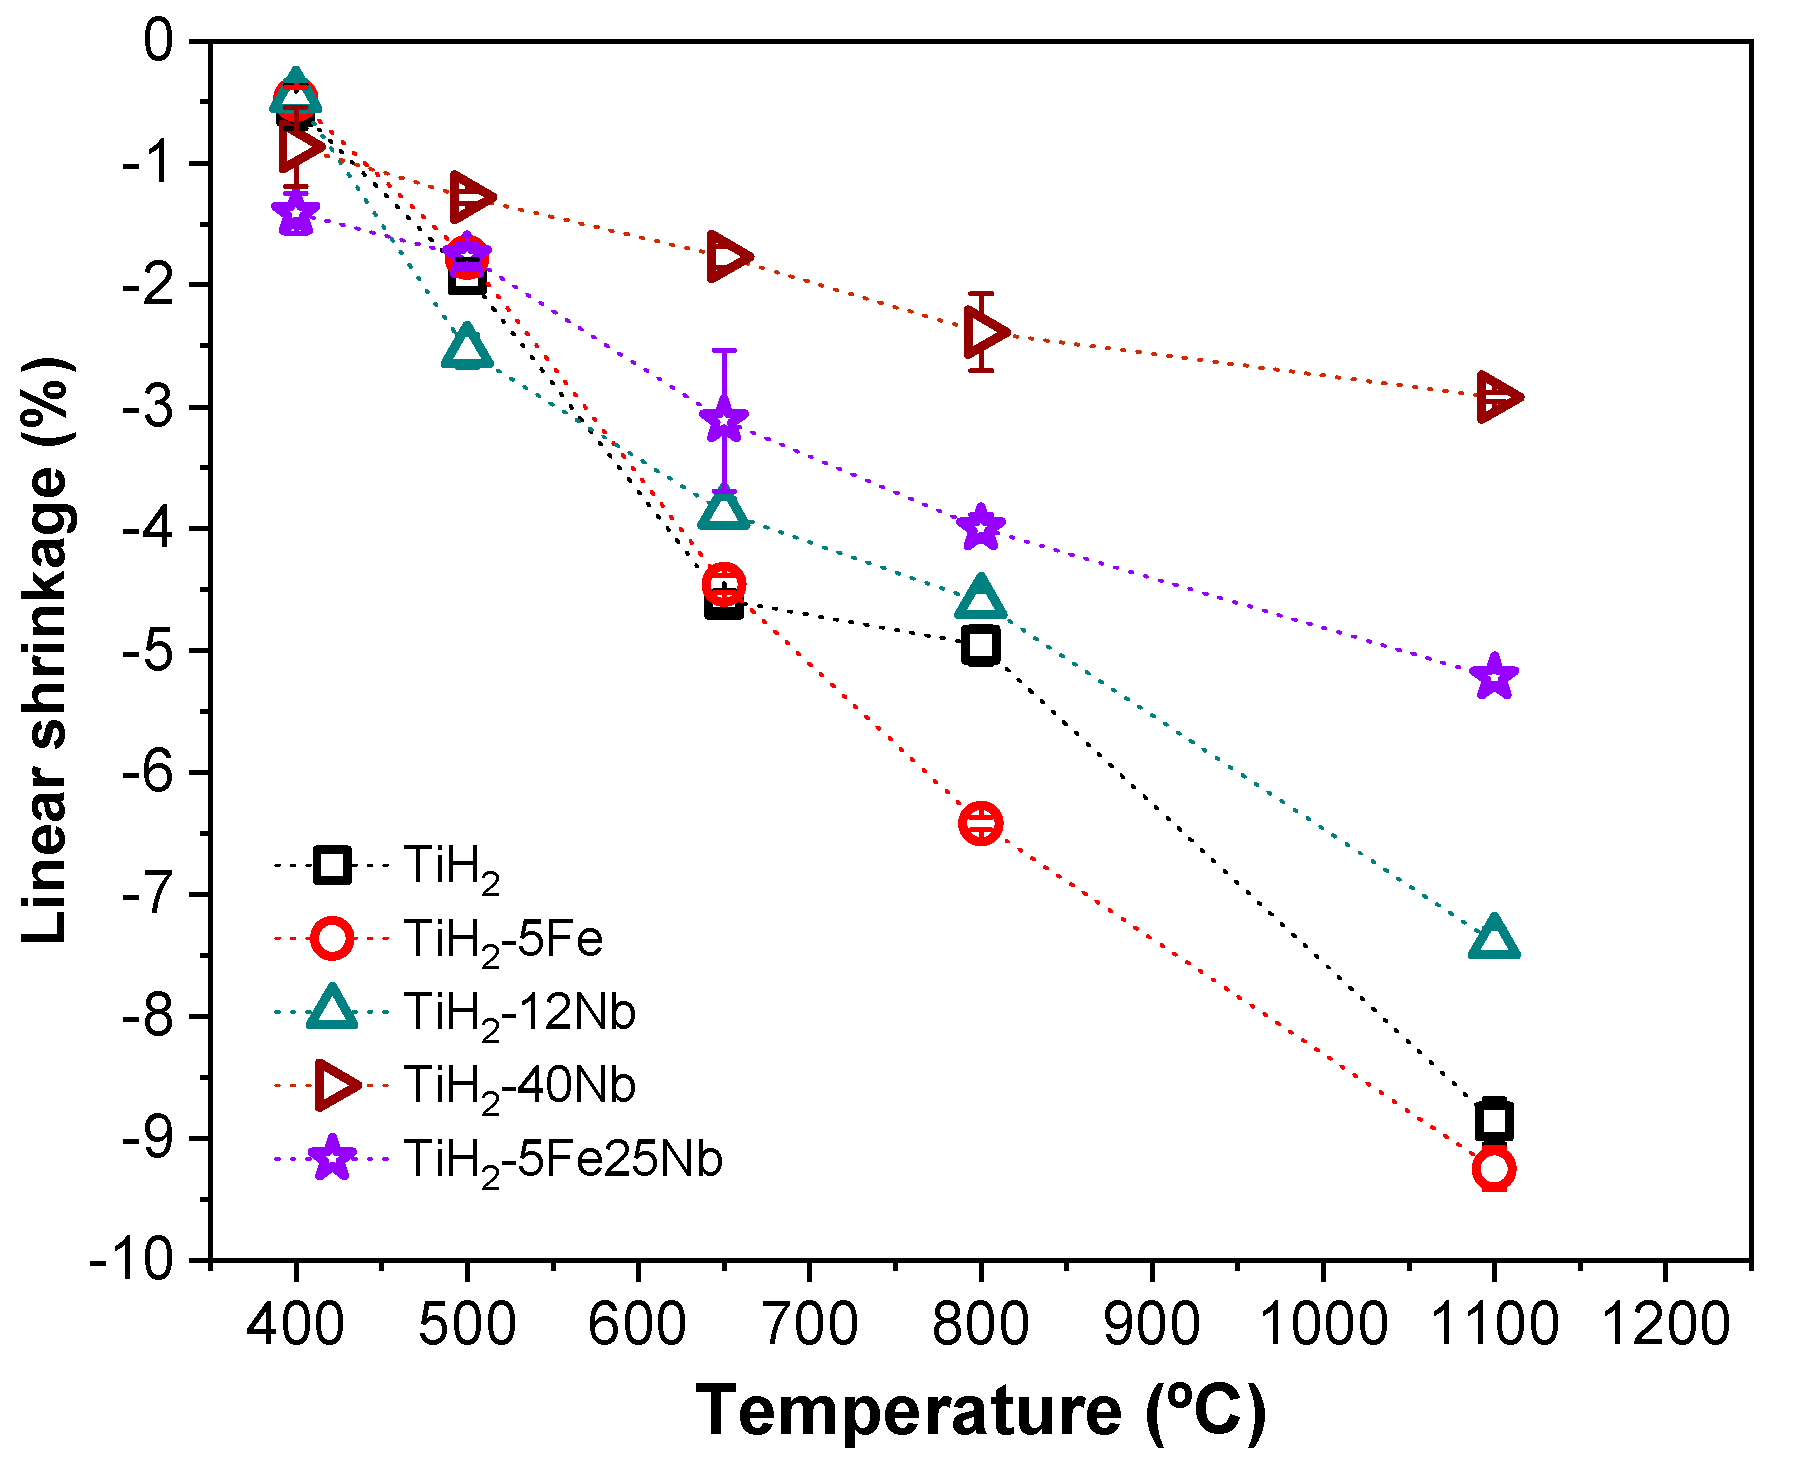
At 500 °C (Figure 5b), needle-like structures were found forming from the outside to inner of the hydride particles. These needles could be associated with the first transformation of titanium hydride to α-Ti. Besides this, no interaction signs of alloying elements with titanium hydride were found, and particles seemed to be closer together than at 400 °C, which agreed with the dilatometric curves (Figure 3) that showed that the initial shrinkage took place among 400–500 °C. This fact also concurred with the linear shrinkage obtained/calculated for the samples heated under vacuum (Figure 6) where there was a slight increase in contraction at 500 °C.
Samples heated up to 650 °C (Figure 5c) showed a drastic increase of densification, achieving shrinkage of 3% for TiH2-5Fe25Nb. Figure 6 indicates that samples containing a higher amount of TiH2 got higher contraction values as well. Hence, it can be confirmed that densification achieved was due to the dehydrogenation process.
On the other hand, at 650 °C, alpha needles were no longer visible, suggesting that complete transformation took place during the dehydrogenation, until all the structure was composed of mainly α-Ti matrix with few H-rich regions (darkest zones/spots indicated by orange arrows in Figure 5c). Both densification and α-Ti transformation were expected, since it has been reported that around 600–650 °C most of the hydrogen was released, and samples were mainly composed of α-Ti [21].
The transformation from TiHx to α-Ti phase was not in accordance with the mechanism previously proposed in Equation (1), in which, at this temperature (around 650 °C), the transformation from TiHx to β-Ti was expected instead of transformation to α-Ti. In this case, alpha phase may appear during cooling since the heating of samples treated under vacuum conditions was stopped at specific temperatures and samples were cooled down for microstructural observation, thereby, also stopping the decomposition reaction. Hence, the β-phase obtained from the dehydrogenation process, according to the transformation process suggested, was reverted to α-Ti phase during cooling, which was not fast enough to maintain the high-temperature β-phase microstructure.
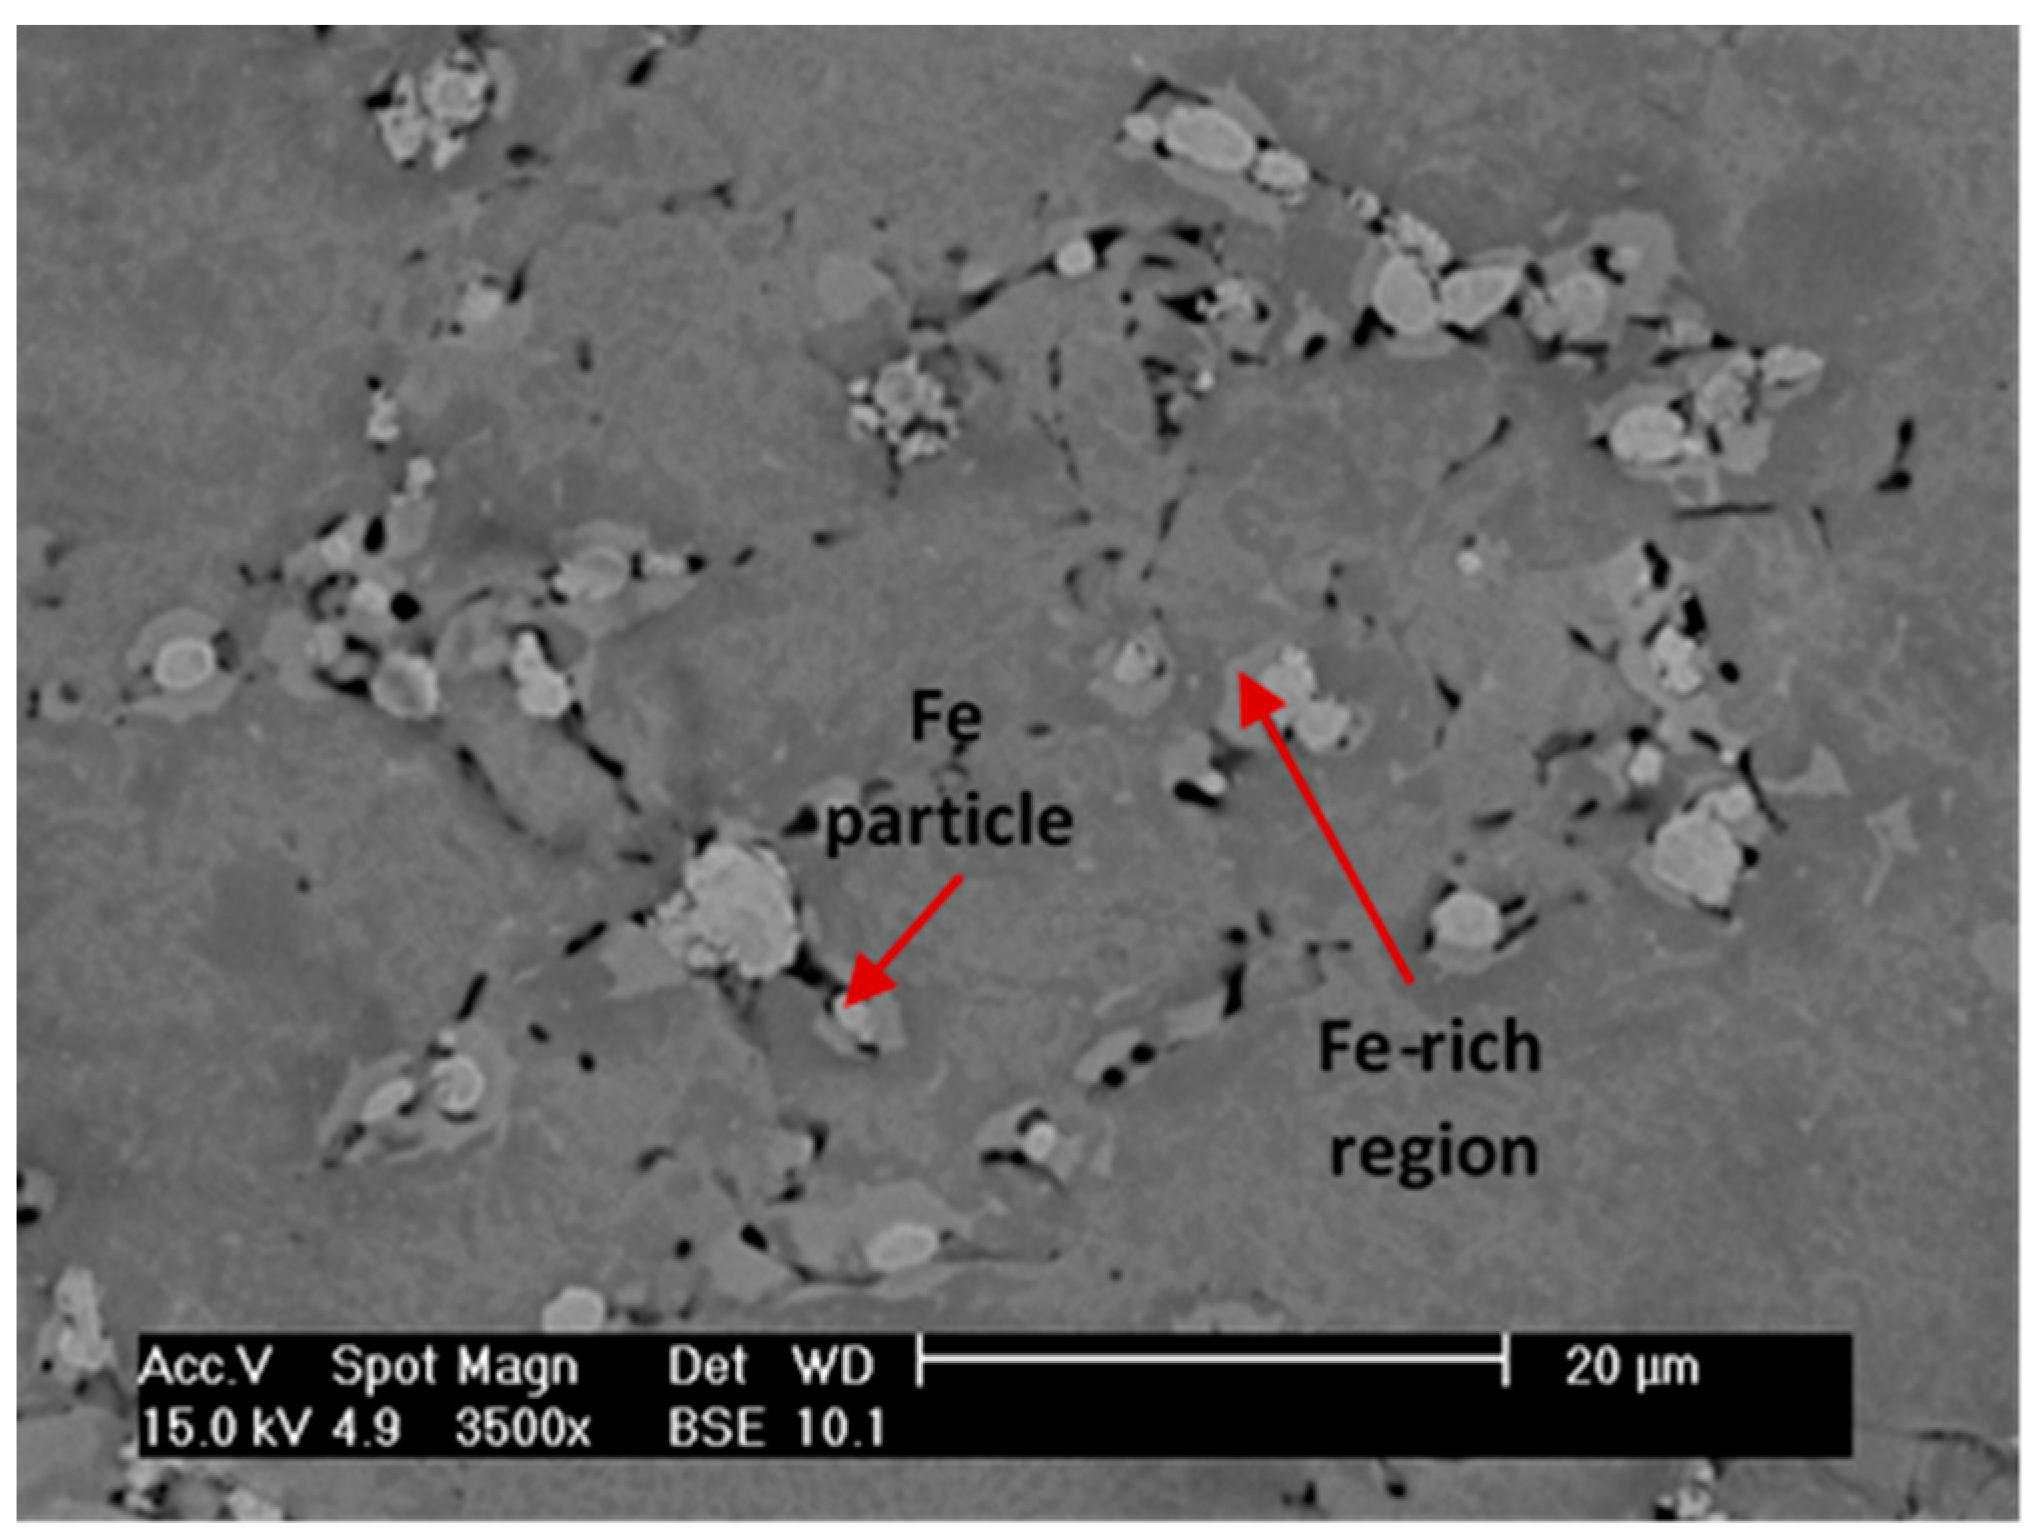
In addition, it can be seen that the Fe particles were surrounded by a brighter ring that indicated that the diffusion processes between Fe and Ti had started. This effect is shown in detail in Figure 7. Fe diffusion in α-Ti is unlikely since the maximum solubility of Fe in α-Ti is lower than in β-Ti, 0.047 and 17 wt. %, respectively. Besides, it is known that diffusivities of Fe in β-Ti is around 4 orders of magnitude larger than in α-Ti [41]. So, β-Ti might have been stabilizing around the Fe particles, even when the temperature was significantly lower than the β transus temperature expected (750 °C) according to Ti-Fe phase diagram for 5 wt. % of Fe. It is important to remark that this temperature cannot be directly compared to the phase diagrams temperature, since VAC treatments and phase diagrams were carried out under different conditions, in terms of atmosphere, time, and pressure.
This early β-Ti phase transformation could also be attributed to the presence of remaining hydrogen. Hydrogen was used as a temporary alloying element in the processing of Ti alloys since it can modify the phase composition, microstructure by controlled diffusion of other alloying elements in hydrogen environment [42]. According to the Ti-H phase diagram, the β transus temperature was reduced from 882 °C for pure Ti to 300 °C for Ti alloy containing 39 %at. of hydrogen. Hence, it is possible that a small amount of hydrogen could be enough to promote the β-phase stabilization at lower temperatures.
Evidence of alpha needles could still be found for TiH2-5Fe (Figure 7). This suggests that the presence of Nb could promote/accelerate the dehydrogenation reactions allowing us to obtain a higher amount of β-Ti phase at the same temperature. This agreed with DTA results (Figure 2 and Table 2), where a decrease of the peak temperature for samples containing Nb was observed.
Above 800 ° C, it can be considered that the remaining hydrogen content present in the samples at 650 °C was released, and the reaction T i H 2 T i + H 2 was completed. SEM image at 800 °C (Figure 5d) shows evidence of neck formation between Ti particles and Ti-Nb particles (marked as A and B, respectively). Besides, three different zones can be distinguished: (1) Ti matrix mainly composed by α-Ti phase, identified by dark grey zone (Point C); (2) bright particles which correspond to Nb (Point D), and (3) light grey region, where the diffusion of Nb atoms into Ti matrix was taking place (Point E), hence, this zone would correspond to Nb-rich β-Ti phase.
It has been reported that complete diffusion/dissolution of Fe into Ti matrix occurs above 1080 °C for Ti-5 wt. % Fe; and almost no interaction between Ti-Fe particles was observed at 950 °C [34,37,43]. However, in this work, there were no signs of Fe particles at 800 °C; they had already been dissolved into Ti matrix. This could be related to hydrogen released from hydride powder having a cleansing effect on the particle surface, which not only allowed protecting Ti from getting oxygen but also increased the chemical activity of the Ti particles’ surface, allowing the reduction of the temperature of the initiation of both sintering and diffusion processes [12,44].
It was surprising that the porosity increased from 600 to 800 °C for alloyed samples. Nevertheless, this behavior coincided with the expansion observed for alloyed samples in Figure 3. Expansion was more significant as a higher amount of alloying elements was incorporated. This could be associated with the formation of Kirkendall porosity, which is a result of the difference of intrinsic diffusion coefficient/diffusivities among the constituents of the alloy forming solid solutions [45]. Kirkendall effect is a phenomenon of interdiffusion in substitutional alloys, where the difference on mass transfer involved in the interdiffusion process causes the diffusion couple (in this case Ti-Nb and Ti-Fe) to contract on one side and to swell the other side, inducing stress and could also generate voids/porosity.
Interdiffusion processes depend strongly on the composition/amount of the alloying element. For Ti-Nb system/couple, the interdiffusion coefficient decreased 2 or 3 orders of magnitude as Nb content increased from 0 to 40 at. %. of Nb [39,40]. Even when it has been reported that Fe increased the interdiffusion coefficient of Nb into Ti [46], self-diffusion of Ti seems to be controlling the diffusion/sintering of the alloy. This might be explained due to the difference in melting points between the constituents Ti-Nb. Ti has a lower melting point than Nb; hence, Ti exhibits higher vacancy concentration and diffusion mobility, promoting the self-diffusion of Ti instead of the interdiffusion among Ti-Nb. Hence, high porosity around Nb particle can be observed. On the other hand, Kirkendall porosity could be formed by the diffusion couple Ti-Fe due to difference of diffusion rate, which was higher than in Ti-Nb. However, considering the low amount of Fe added with respect to Nb, it is more likely that the high porosity observed in the SEM images could be generated mainly by the Ti-Nb couple.
In general, the diffusion processes are activated/promoted as the temperature increases. At 1100 °C, significant changes concerning Nb diffusion were observed. Improvement on the neck growth between the Ti and Nb particles was seen, allowing the reduction of porosity compared to samples treated at 800 °C; however, a strong Kirkendall effect was maintained. Undissolved Nb particles surrounded by a diffusion region were found; so, Nb diffusion into Ti matrix was still taking place. This suggested that neither temperature nor sintering time (1100 °C, 5 min) were enough to complete both the diffusion of Nb and sintering of the alloy in order to achieve/get a higher amount of β-Ti phase and densification values. Moreover, isolated α-Ti needles in some areas of the samples were also observed, which could be associated with the incomplete Nb diffusion.
Microstructures of the obtained samples were compared with Ti-Nb samples produced by casting [47,48,49,50]. The main difference between Ti-Nb alloys produced by casting and PM was that β phase seemed more homogeneous for PM alloys and α’’ phase formed during cooling for cast-alloys was not observed in PM alloys. Since the microstructures obtained in this paper were not optimized in terms of complete sintering, it was difficult to assess the differences with fully sintered samples reported in the bibliography [51,52,53]. Nevertheless, similar findings were reported by Sharma et al. [29] and Siti et al. [54] for Ti-40 wt. % Nb alloy, processed from TiH2 as starting powder produced by press and sinter process. Both cases highlight the incomplete Nb diffusion at temperatures between 1100 and 1200 °C, the presence of a diffusion zone with unreacted Nb particles surrounded by a β-Ti matrix, and some α-needles mainly located at the grain boundaries.

3.5. Effect of Fe and Nb Alloying Elements on Phase Evolution during Dehydrogenation Process

Figure 8 shows the XRD patterns of TiH2-5Fe25Nb alloy from room temperature up to 1100 °C. Similar results were found for the other compositions evaluated. At room temperature, as expected, TiH2, Fe, and Nb were identified by XRD patterns.
It is complicated to determine the sequence of hydrides formed during the entire dehydrogenation process even employing high-temperature XRD analysis due to the fact that this reaction is fast and takes place in a narrow interval of temperatures [55]. However, the main stages of the process could be followed, as described below.
At 400 °C, FCC δ-TiH2 was transformed into FCC-TiH1.5, which coincided with the first decomposition stage. Afterwards, as temperature increased (500 °C), part of TiH1.5 was transformed into HCP-α phase. It can be observed that the peak intensity of TiH1.5 was reduced, while peaks of α-Ti phase started to appear, which was confirmed by the needles found in the SEM images (Figure 5b) that corresponded to α-Ti. Peaks of alpha phase at 500 °C did not agree with the transformation sequence proposed before, which suggests that δ(TiHx) transformed to β(Ti)H. However, this was attributed to the fact that these samples were analyzed after cooling; thus, the fraction of beta transformation reached up to that stage was reverted to alpha phase during cooling when FCC to HCP phase transformation occurred. It is important to consider that the pattern diffraction obtained did not correspond to the phase transformation sequence, since the high-temperature reaction was interrupted to perform the XRD measurement at room temperature (RT) and, hence, the intermediate phases that were formed during dehydrogenation, at a specific interval of temperature, could have been reverted to another stable phase at lower temperature.
At 650 °C, the sample was composed by α-Ti phase, Fe, and Nb, leaving behind TiH1.5 phase. XRD results support that dehydrogenation finished at this temperature for alloys of Ti-Nb and Ti-Nb-Fe system. At 800 °C, Nb, HCP α-Ti, and BCC β-Ti phase could be identified. No Fe peaks (or intermetallic) were found in the XRD; this was attributed to Fe being already dissolved into Ti matrix, as was observed in the SEM image (Figure 5d).
Finally, for TiH2-5Fe25Nb alloy at 1100 °C strong peaks corresponding to β-Ti phase were found and small peaks of α-Ti phase were also identified. Even when Nb particles were observed in the SEM images, they were not by found by XRD; this could be due to the fact that the remaining undissolved Nb amount was lower than the detection limit. The incomplete Nb diffusion was not enough to obtain only β-Ti phase. Therefore, it is necessary to increase both time and sintering temperature in order to promote the Nb diffusion and to stabilize a higher content of β-Ti.

4. Conclusions

In conclusion:
  • Using thermal analysis (DTA, DIL) it is possible to follow the in-situ transformation during the whole dehydrogenation process and assess the effect of alloying elements. In contrast, for samples heated until a determined temperature and then cooled down (VAC), the dehydrogenation reactions were interrupted and some phase transformations could not be identified since they were reverted during cooling. The following reactions were identified for unalloyed TiH2 using conventional XRD:
    δ ( T i H 2 )   400   ° C δ ( T i H 1.5 )   500   ° C δ ( T i H 1.5 ) + α ( T i ) 650   ° C α ( T i )
    This transformation sequence was modified with the addition of Fe and Nb as alloying elements. The presence of these alloying elements reduced considerably the beta transus temperature, hence, it is suggested that beta→alpha reaction described in Equation (1) did not occur. Once δ-TiHx was transformed into β-Ti, this phase was maintained and became more stable as temperature increased and diffusion of Fe and Nb was produced, which allowed stabilization the β-Ti phase after cooling.
    The following transformation sequence was proposed for alloyed TiH2 with Fe and Nb during continuous heating:
    δ ( T i H 2 ) + F e + N b 400   ° C   δ ( T i H 1.5 ) + F e + N b   550 650   ° C   β ( T i ) H + β ( T i ) F e   r i c h + F e + N b   800 1100   ° C   β ( T i ) H + β ( T i ) F e   r i c h + β ( T i ) N b   r i c h + N b
  • Fe was dissolved into Ti matrix at a lower temperature than when using Ti powders as starting material. Hence, dehydrogenation allowed chemical activation of the particle surface, promoting an earlier diffusion of the alloying elements. Small amount of hydrogen retained on the last dehydrogenation stage could have promoted the earlier diffusion of elements that exhibited higher diffusivity in BCC-Ti than HCP-Ti.
  • Fe and Nb addition shifted the temperature of the initial and final stage of the dehydrogenation process with respect to unalloyed/pure TiH2.
    On one hand, Fe and Nb accelerated the beginning of the decomposition reaction, reducing the onset temperature of the first stage between 50–95 °C lower than TiH2. On the other hand, Fe and Nb could act as a barrier to the removal of the remaining hydrogen content retained in the Ti phase, delaying the offset temperature of the third stage between 15–50 °C more than TiH2.
    No significant differences were detected for the intermediate stage (second stage), which was considered the main decomposition reaction.
  • Alloying elements’ addition, such as Fe and Nb, did not hinder the complete hydrogen elimination; however, they modified the decomposition process.

Author Contributions

Conceptualization, E.G.; methodology, C.C., S.A.T. and E.G.; formal analysis, C.C., S.A.T. and E.G.; investigation, C.C., P.W., S.A.T. and E.G.; validation, C.C., P.W., S.A.T. and E.G.; writing—original draft preparation, C.C.; writing—review and editing, C.C., S.A.T. and E.G.; supervision, S.A.T. and E.G. All authors have read and agreed to the published version of the manuscript.

Funding

This research was funded by the Regional Government of Madrid (program ADITIMAT-CM, ref. S2018/NMT-4411), and by the Ministry of Economy and Competitiveness of Spain (program MINECO, ref. PCIN-2016-123 project BIOHYB, and Ramón y Cajal contract RYC-2014-1504).

Conflicts of Interest

The authors declare no conflict of interest. The funders had no role in the design of the study; in the collection, analyses, or interpretation of data; in the writing of the manuscript, or in the decision to publish the results.

References

  1. Amherd, A.H.; Frykholm, R.; Ebel, T.; Pyczak, F. Powder Metallurgy Strategies to Improve Properties and Processing of Titanium Alloys: A Review. Adv. Eng. Mater. 2017, 19, 1600743. [Google Scholar] [CrossRef]
  2. Froes, F.H.S.; Gungor, M.N.; Imam, M.A. Cost-Affordable Titanium: The Component Fabrication Perspective. JOM 2007, 59, 28–31. [Google Scholar] [CrossRef]
  3. Lutjering, G.; Williams, J. Titanium, 2nd ed.; Springer: Berlin, Germany, 2007. [Google Scholar]
  4. Angelo, P.; Upadhyaya, G. Powder Metallurgy: Science, Technology and Applications; PHI Learning Pvt Ltd.: Delhi, India, 2009. [Google Scholar]
  5. Narasimhan, K.S.; Amuda, M.O.H. Powder Characterization. Ref. Modul. Mater. Sci. Mater. Eng. 2017. [Google Scholar] [CrossRef]
  6. Sibum, H. Titanium and Titanium Alloys—From Raw Material to Semi-finished Products. In Titanium and Titanium Alloys. Fundamentals and Applications; Leyens, C., Peters, M., Eds.; WILEY-VCH: Weinheim, Germany, 2003; pp. 231–245. [Google Scholar]
  7. Mccracken, C.G.; Barbis, D.P.; Deeter, R.C. Key characteristics of hydride—Dehydride titanium powder. Powder Metall. 2011, 54, 180–183. [Google Scholar] [CrossRef]
  8. Fang, Z.Z.; Paramore, J.D.; Sun, P.; Chandran, K.S.R.; Zhang, Y.; Xia, Y.; Cao, F.; Koopman, M.; Free, M. Powder metallurgy of titanium–past, present, and future. Int. Mater. Rev. 2018, 63, 407–459. [Google Scholar] [CrossRef]
  9. Barbis, D.P.; Gasior, R.M.; Walker, G.P.; Capone, J.A.; Schaeffer, T.S. Titanium powders from the hydride-dehydride process. In Titanium Powder Metallurgy: Science, Technology and Applications; Qian, M., Froes, F., Eds.; Elsevier Inc Butterworth-Heinemann: Oxford, UK, 2015; pp. 101–116. [Google Scholar]
  10. Wang, C.; Zhang, Y.; Xiao, S.; Chen, Y. Sintering densification of titanium hydride powders. Mater. Manuf. Process. 2017, 32, 517–522. [Google Scholar] [CrossRef]
  11. Mei, L.; Wang, C.; Wei, Y.; Xiao, S.; Chen, Y. Effects of hydrogen content on powder metallurgy characteristic of titanium hydrides. Int. J. Hydrogen Energy 2018, 43, 7102–7107. [Google Scholar] [CrossRef]
  12. Robertson, I.M.; Schaffer, G.B. Comparison of sintering of titanium and titanium hydride powders. Powder Metall. 2010, 53, 12–19. [Google Scholar] [CrossRef]
  13. Ivasishin, O.; Moxson, V. Low-cost titanium hydride powder metallurgy. In Titanium Powder Metallurgy; Elsevier Inc.: Oxford, UK, 2015; pp. 117–148. [Google Scholar]
  14. Savvakin, D.H.; Humenyak, M.M.; Matviichuk, M.V.; Molyar, O.H. Role of hydrogen in the process of sintering of titanium powders. Mater. Sci. 2012, 47, 72–81. [Google Scholar] [CrossRef]
  15. Nyberg, E.; Miller, M.; Simmons, K.; Weil, S. Manufactures ‘need better quality titanium PM powders’. Met. Powder Rep. 2005, 60, 8–13. [Google Scholar] [CrossRef]
  16. Paramore, J.D.; Fang, Z.; Sun, P. Hydrogen sintering of Titanium and its alloys. In Titanium Powder Metallurgy; Elsevier Inc.: Oxford, UK, 2015; pp. 163–182. [Google Scholar]
  17. Kovalev, D.Y.; Prokudina, V.K.; Ratnikov, V.I.; Ponomarev, V.I. Thermal decomposition of TiH2: A TRXRD study. Int. J. Self-Propagating High-Temp. Synth. 2010, 19, 253–257. [Google Scholar] [CrossRef]
  18. Lehmhus, D.; Rausch, G. Tailoring titanium hydride decomposition kinetics by annealing in various atmospheres. Adv. Eng. Mater. 2004, 6, 313–330. [Google Scholar] [CrossRef]
  19. Peillon, N.; Fruhauf, J.B.; Gourdet, S.; Feraille, J.; Saunier, S.; Desrayaud, C. Effect of TiH2 in the preparation of MMC Ti based with TiC reinforcement. J. Alloys Compd. 2015, 619, 157–164. [Google Scholar] [CrossRef]
  20. Bhosle, V.; Baburaj, E.G.; Miranova, M.; Salama, K. Dehydrogenation of TiH2. Mater. Sci. Eng. A 2003, 356, 190–199. [Google Scholar] [CrossRef]
  21. Liu, H.; He, P.; Feng, J.C.; Cao, J. Kinetic study on nonisothermal dehydrogenation of TiH2 powders. Int. J. Hydrogen Energy 2009, 34, 3018–3025. [Google Scholar] [CrossRef]
  22. Zhou, Y.L.; Zheng, L.R.; Chu, S.Q.; Wu, M.; An, P.F.; Zhang, J.; Hu, T.D. In-situ EXAFS study on the thermal decomposition of TiH2. Chin. Phys. C 2014, 38, 1–9. [Google Scholar] [CrossRef] [Green Version]
  23. Jiménez, C.; Garcia-Moreno, F.; Pfretzschner, B.; Klaus, M.; Wollgarten, M.; Zizak, I.; Schumacher, G.; Tovar, M.; Banhart, J. Decomposition of TiH2 studied in situ by synchrotron X-ray and neutron diffraction. Acta Mater. 2011, 59, 6318–6330. [Google Scholar] [CrossRef]
  24. Ma, M.; Liang, L.; Wang, L.; Wang, Y.; Cheng, Y.; Tang, B.; Xiang, W.; Tan, X. Phase transformations of titanium hydride in thermal desorption process with different heating rates. Int. J. Hydrogen Energy 2015, 40, 8926–8934. [Google Scholar] [CrossRef]
  25. Prashanth, K.G. Influence of Mechanical Activation on Decomposition of Titanium Hydride. Mater. Manuf. Process. 2010, 25, 974–977. [Google Scholar] [CrossRef]
  26. Matijasevic-lux, B.; Banhart, J.; Fiechter, S.; Gorke, O.; Wanderka, N. Modification of titanium hydride for improved aluminium foam manufacture. Acta Mater. 2006, 54, 1887–1900. [Google Scholar] [CrossRef] [Green Version]
  27. Wu, S.; Liu, X.; Yeung KW, K.; Hu, T.; Xu, Z.; Chung, J.C.; Chu, P.K. Hydrogen release from titanium hydride in foaming of orthopedic NiTi scaffolds. Acta Biomater. 2011, 7, 1387–1397. [Google Scholar] [CrossRef] [PubMed]
  28. Yang, D.; Hur, B. The relationship between thermal decomposition properties of titanium hydride and the Al alloy melt foaming process. Mater. Lett. 2006, 60, 3635–3641. [Google Scholar] [CrossRef]
  29. Sharma, B.; Vajpai, S.K.; Ameyama, K. Microstructure and properties of beta Ti–Nb alloy prepared by powder metallurgy route using titanium hydride powder. J. Alloys Compd. 2016, 656, 978–986. [Google Scholar] [CrossRef]
  30. Chirico, C.; Tsipas, S.; Toptan, F.; Gordo, E. Development of Ti–Nb and Ti–Nb–Fe beta alloys from TiH2 powders. Powder Metall. 2019, 62, 44–53. [Google Scholar] [CrossRef]
  31. Zhang, Y.; Wang, C.; Zhang, Y.; Cheng, P.; Wei, Y.; Xiao, S.; Chen, Y. Fabrication of Low-cost Ti-1Al-8V-5Fe by Powder Metallurgy with TiH2 and FeV80 Alloy. Mater. Manuf. Process. 2017, 32, 1869–1873. [Google Scholar] [CrossRef]
  32. Biesiekierski, A.; Lin, J.; Li, Y.; Ping, D.; Yamabe-Mitarai, Y.; Wen, C. Investigations into Ti–(Nb,Ta)–Fe alloys for biomedical applications. Acta Biomater. 2016, 32, 336–347. [Google Scholar] [CrossRef]
  33. Zhang, Y.; Sun, D.; Cheng, J.; Kit, J.; Tsoi, H.; Chen, J. Mechanical and biological properties of Ti–(0–25 wt%) Nb alloys for biomedical implants application. Regen. Biomater. 2020, 7, 119–127. [Google Scholar] [CrossRef] [Green Version]
  34. Wei, W.; Liu, Y.; Zhou, K.; Huang, B. Effect of Fe addition on sintering behaviour of titanium powder. Powder Metall. 2003, 46, 246–250. [Google Scholar] [CrossRef]
  35. Kennedy, A.R.; Lopez, V.H. The decomposition behavior of as-received and oxidized TiH2 foaming-agent powder. Mater. Sci. Eng. A 2003, 357, 258–263. [Google Scholar] [CrossRef]
  36. Esteban, P.G.; Bolzoni, L.; Ruiz-Navas, E.M.; Gordo, E. PM processing and characterisation of Ti-7Fe low cost titanium alloys. Powder Metall. 2011, 54, 242–252. [Google Scholar] [CrossRef] [Green Version]
  37. Liu, Y.; Chen, L.F.; Tang, H.P.; Liu, C.T.; Liu, B.; Huang, B.Y. Design of powder metallurgy titanium alloys and composites. Mater. Sci. Eng. A 2006, 418, 25–35. [Google Scholar] [CrossRef]
  38. Gibbs, G.B.; Graham, D.; Tomlin, D.H. Diffusion in titanium and titanium—Niobium alloys. Philos. Mag. 1963, 8, 1269–1282. [Google Scholar] [CrossRef]
  39. Soma, P.; Paul, A. Interdiffusion in Nb-Mo, Nb-Ti and Nb-Zr systems. Defect Diffus. Forum 2012, 323–325, 491–496. [Google Scholar]
  40. Zhu, L.; Zhang, Q.; Chen, Z.; Wei, C.; Cai, G.M.; Jiang, L.; Jin, Z.; Zhao, J.C. Measurement of interdiffusion and impurity diffusion coefficients in the bcc phase of the Ti–X (X = Cr, Hf, Mo, Nb, V, Zr) binary systems using diffusion multiples. J. Mater. Sci. 2017, 52, 3255–3268. [Google Scholar] [CrossRef]
  41. Nakajima, H.; Koiwa, M. Diffusion in Titanium. ISIJ Int. 1991, 31, 757–766. [Google Scholar] [CrossRef] [Green Version]
  42. Froes, F.H.; Senkov, O.N.; Qazi, J.I. Hydrogen as a temporary alloying element in titanium alloys: Thermohydrogen processing. Int. Mater. Rev. 2004, 49, 227–245. [Google Scholar] [CrossRef]
  43. O’Flynn, J.; Corbin, S.F. The influence of iron powder size on pore formation, densification and homogenization during blended elemental sintering of Ti–2.5Fe. J. Alloys Compd. 2015, 618, 437–448. [Google Scholar] [CrossRef]
  44. Ivasishin, O.M.; Demidik, A.N.; Savvakin, D.G. Use of titanium hydride for the synthesis of titanium aluminides from powder materials. Powder Metall. Met. Ceram. 1999, 38, 482–487. [Google Scholar] [CrossRef]
  45. Pieraggi, B. Diffusion and solid-state reactions. In Developments in High Temperature Corrosion and Protection of Materials; Woodhead, P., Gao, W., L, Z.W., Eds.; Woodhead Publishing: Cambridge, UK, 2008; pp. 9–35. [Google Scholar]
  46. Peartt, R.F.; Tomlin, D.H. Diffusion of elements in beta-titanium. Acta Metall. 1962, 10, 123–134. [Google Scholar] [CrossRef]
  47. Lee, C.M.; Ju, C.P.; Lin, J.H.C. Structure property relationship of cast Ti-Nb alloys. J. Oral Rehabil. 2002, 29, 314–322. [Google Scholar] [CrossRef]
  48. Cremasco, A.; Andrade, P.N.; Contieri, R.J.; Lopes, E.S.N.; Afonso, C.R.M.; Caram, R. Correlations between aging heat treatment, ω phase precipitation and mechanical properties of a cast Ti-Nb alloy. Mater. Des. 2011, 32, 2387–2390. [Google Scholar] [CrossRef]
  49. Bönisch, M.; Calin, M.; Waitz, T.; Panigrahi, A.; Zehetbauer, M.; Gebert, A.; Skrotzki, W.; Eckert, J. Thermal stability and phase transformations of martensitic Ti-Nb alloys. Sci. Technol. Adv. Mater. 2013, 14, 055004. [Google Scholar] [CrossRef] [PubMed]
  50. Xu, L.J.; Xiao, S.L.; Tian, J.; Chen, Y.Y.; Huang, Y.D. Microstructure and dry wear properties of Ti-Nb alloys for dental prostheses. Trans. Nonferrous Met. Soc. China (Engl. Ed.) 2009, 19, s639–s644. [Google Scholar] [CrossRef]
  51. Ebel, T.; Beißig, T.; Ebner, S.; Luo, X.; Nagaram, A.B. Reduction of the embrittlement effect of binder contamination in MIM processing of Ti alloys. Powder Metall. 2017, 60, 157–166. [Google Scholar] [CrossRef]
  52. Amigó, A.; Vicente, A.; Afonso, C.R.M.; Amigó, V. Mechanical properties and the microstructure of β Ti-35Nb-10Ta-xFe alloys obtained by powder metallurgy for biomedical applications. Metals 2019, 9, 76. [Google Scholar] [CrossRef] [Green Version]
  53. Zhao, D.; Chang, K.; Ebel, T.; Qian, M.; Willumeit, R.; Yan, M.; Pyczak, F. Microstructure and mechanical behavior of metal injection molded Ti-Nb binary alloys as biomedical material. J. Mech. Behav. Biomed. Mater. 2013, 28, 171–182. [Google Scholar] [CrossRef] [Green Version]
  54. Hosnie, S.M.; Yahaya, M.; Haris, N.A.; Todd, I. Fabrication of porous β-Type Ti-40Nb alloys incorporated with TiH2 via powder metallurgy processing route under reducing environment. J. Mech. Eng. 2017, 2, 99–112. [Google Scholar]
  55. Schur, D.V.; Zaginaichenko, S.Y.; Adejev, V.M.; Voitovich, V.B.; Lyashenko, A.A.; Trefilov, V.I. Phase transformations in titanium hydrides. Int. J. Hydrogen Energy 1996, 21, 1121–1124. [Google Scholar] [CrossRef]
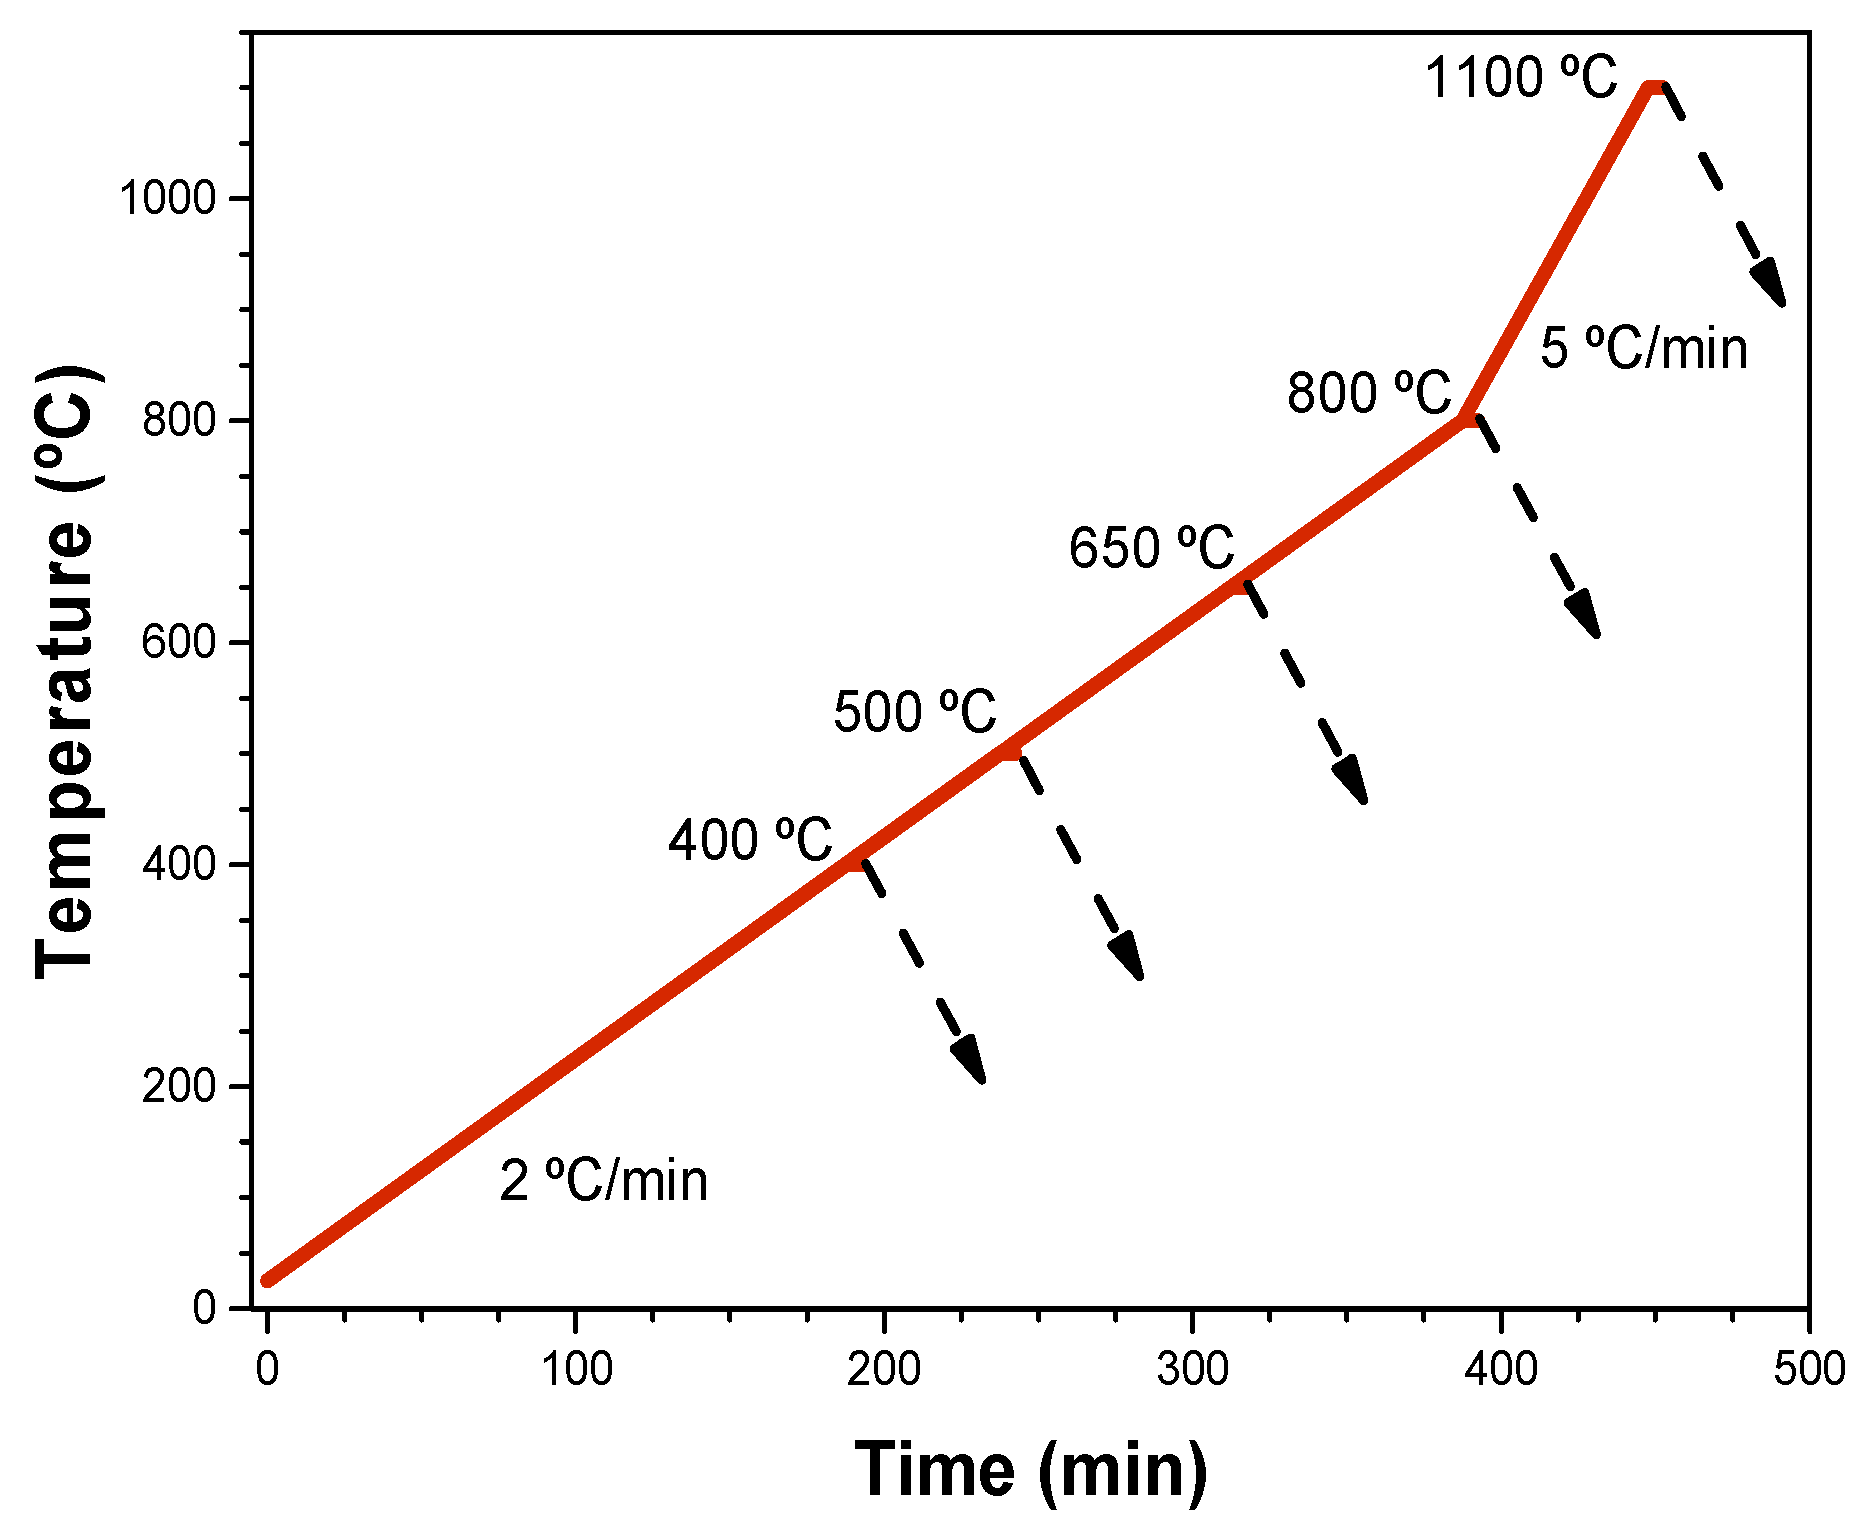
Figure 1. Thermal treatments performed under high-vacuum conditions. The dotted lines show the temperatures at which samples were cooled down in order to examine their phase composition and microstructure at intermediate stages of the dehydrogenation process.
Metals 10 00682 g001
Figure 2. Comparison of differential thermal analysis (DTA) curves between TiH2 and mixtures of powders under high purity argon atmosphere heated at 10 °C/min. (a) TiH2-Fe (5 and 7 wt. %); (b) TiH2-Nb (12, 25, 40 wt. %); (c) TiH2-Nb-Fe (25 wt. % Nb and 5, 7 wt. % Fe) and (d) TiH2-Nb-Fe (40 wt. % Nb and 5, 7 wt. % Fe).
Metals 10 00682 g002
Figure 3. Dilatometric curves for compact powders. Analyses were performed under high-purity argon atmosphere, heating at 10 °C/min. (a) TiH2-Fe (5 and 7 wt. %); (b) TiH2-Nb (12, 25, 40 wt. %); (c) TiH2-Nb-Fe (25 wt. % Nb and 5, 7 wt. % Fe) and (d) TiH2-Nb-Fe (40 wt. % Nb and 5, 7 wt. % Fe).
Metals 10 00682 g003
Figure 4. Mass loss for the composition prepared obtained by: (a) Thermogravimetric analysis (TGA) of mixtures of powders (samples measured under argon flow of 80 mL/min) and (b) Vacuum treatments (VAC) of compact samples (samples treated under high-vacuum conditions).
Metals 10 00682 g004
Figure 5. Scanning Electron Microscopy images in backscattered electrons mode (BSE-SEM) for TiH2-5Fe25Nb heated at different temperatures: (a) 400 °C, (b) 500 °C, (c) 650 °C, (d) 800 °C, and (e) 1100 °C.
Metals 10 00682 g005
Figure 6. Linear shrinkage for samples heated under VAC conditions at different temperatures.
Metals 10 00682 g006
Figure 7. BSE-SEM image for TiH2-5Fe heated up to 650 °C: Detail of Fe diffusion.
Metals 10 00682 g007
Figure 8. X-ray diffractograms showing the evolution of phases’ transformations as function of temperature by TiH2-5Fe25Nb (from room temperature to 1100 °C).
Metals 10 00682 g008
Table 1. Analyzing methods for the different compositions prepared.
Composition 1DTA/TGA/DIL *VAC
TiH2XX
TiH2-5FeXX
TiH2-7FeX-
TiH2-12Nb 1XX
TiH2-25NbX-
TiH2-5Fe-25NbXX
TiH2-7Fe-25NbX-
TiH2-40NbXX
TiH2-5Fe-40NbX-
TiH2-7Fe-40NbX-
* Performed using a high purity argon flow of 80 mL/min. 1 Nomenclature indicates the compositions in weight percent
Table 2. Transformation temperatures found during the dehydrogenation process analyzed by differential thermal analysis (DTA).
SampleTemperature (°C)
Stage IStage IIStage III
OnsetPeakOnsetPeakOnsetOffset
TiH2475510555592650830
TiH2-5Fe395500555623700880
TiH2-Fe385500555620700875
TiH2-12Nb380470535600645850
TiH2-25Nb385490545613645870
TiH2-40Nb390480540596630830
TiH2-5Fe25Nb410485535585645815
TiH2-7Fe25Nb405495542695630840
TiH2-5Fe40Nb420487535608635855
TiH2-Fe40Nb425490545600630845
Table 3. Relative hydrogen weight loss (%) for treated samples heated in Thermogravimetric analysis (TGA) and Vacuum treatments (VAC) test.
Samples400 °C500 °C650 °C800 °C1100 °C
TGAVACTGAVACTGAVACTGAVACTGAVAC
TiH22.316.71.776.866.398.989.199.894.899.1
TiH2-5Fe<114.99.974.757.190.687.897.497.798.1
TiH2-12Nb5.918.49.584.058.797.383.897.789.998.1
TiH2-40Nb<124.715.092.870.996.093.999.798.499.7
TiH2-5Fe25Nb8.514.07.084.662.997.986.798.390.698.0