Abstract
A comprehensive mathematical model of electroslag remelting with two series-connected electrodes (TSCE-ESR) was constructed based on sequential coupling method. The influence of droplet effect on electroslag remelting process (ESR) was considered in this model. Compared with one-electrode electroslag remelting (OE-ESR), the multi-physics field, droplet formation and dripping behavior, and molten metal pool structure of TSCE-ESR process were studied. The results show that during the process of TSCE-ESR, the proximity effect of the electrodes suppresses the skin effect, and Joule heat is concentrated in the area between the two electrodes of slag pool, making the temperature distribution of the slag pool more uniform. The heat used to melt the electrode in the process of TSCE-ESR accounts for about 34% of the total Joule heat, which is lower than the OE-ESR (17%). Therefore, it makes a higher melting rate and a smaller droplet size in the process of TSCE-ESR. Compared with OE-ESR, TSCE-ESR process can realize the unification of higher melting rate and shallow flat molten metal pool. Compared with the results without droplet effect, it is found that in the simulation results with droplet effect, the depth and the cylindrical section of molten metal pool increased, and the width of the mushy zone is significantly reduced, which is more consistent with the actual electroslag remelting process.
1. Introduction
The technology of TSCE-ESR adopts the mode of two electrodes connected in series, which can reduce the inductive reactance of short net (transformer-water cooled copper plate-water cooled cable-electrode), improve the power factor, reduce the active power consumption of the short net, thus greatly reducing the power consumption. It is widely used in the preparation of tool steel, die steel, military steel, and other special alloy materials [1]. Compared with the process of OE-ESR, the current flow direction of the TSCE-ESR process has changed. On the one hand, it will affect the heating area of the slag. On the other hand, it will change the direction of the electromagnetic force and the flow field of slag pool, which will have an important impact on the temperature field and the structure of the molten metal pool, and ultimately affect the quality of the electroslag remelting steel ingot. Therefore, the systematic study on the heating and heat-transfer mechanisms of TSCE-ESR process is of great significance to the development of the process. In recent years, some scholars have studied the remelting process of TSCE-ESR. For example, Wang [2] established a mathematical model of coupled harmonic electromagnetic equations, obtained the distribution of current density and electromagnetic force in the process of TSCE-ESR, and analyzed the influence of frequency on current density distribution. Li [3] established a three-dimensional finite element model of TSCE-ESR process, and studied the influence of the ingot height on the molten metal pool. However, there are still few systematic studies on the multi-physics field, droplet formation, and dripping behavior and molten metal pool structure in the process of TSCE-ESR, which limits the technological development and the improvement of product quality.
Because of the high temperature and invisibility, it is difficult to observe a series of physical and chemical phenomena during the electroslag remelting process. In recent years, many scholars have studied the electroslag remelting process by means of numerical simulation. Kelkar [4] established an electroslag remelting model taking into account electromagnetic, flow, and heat transfer. He calculated the Joule heat, flow field, and metal pool profile. Weber [5] established a two-dimensional transient mathematical model of the electroslag remelting process, and analyzed the influence of filling ratio on the flow field distribution. Li [6] studied the distribution of electromagnetic field, Joule heat, and temperature field during the electroslag remelting process under the influence of skin effect. The above studies have been able to realize the coupling of multiple physical fields to the mathematical model of electroslag remelting. However, the electroslag remelting process involves the two phases of slag and liquid metal, which is a typical multiphase flow problem. Obviously, the influence of droplet formation and droplet dropping on the electroslag remelting process is still ignored in the above studies. With the development of multiphase flow models, researchers have tried to couple multiphase flow models to directly simulate the dripping process of droplets. Ruckert [7] used VOF (Volume of Fluid) module to track the slag/metal (slag and metal pool) interface in order to study the droplet formation and dripping behavior. Li [8] simulated the flow between slag and metal in the slag pool based on the VOF algorithm, and obtained the formation and dripping process of metal droplets. However, these studies did not take into account the effects of buoyancy and electromagnetic forces on metal droplets. Giesselmann [9] considered the effects of buoyancy and electromagnetic force on metal droplets, but he assumed that the effects of electromagnetic field, Joule heat and Lorentz force were independent of each other. However, the two actually affected each other, so this simulation method would also lead to inaccurate simulation results. Liu [10] established a mathematical model of droplet behavior of the electroslag remelting process based on magnetohydrodynamic. The electromagnetic force and joule heat in the process of droplet formation and dropping were studied in detail. However, the shape of electrode tip was specified in the study and a constant mass flow was applied, while the effect of slag temperature on the electrode melting process was ignored, so the droplet formation process could not be reflected. In conclusion, it is difficult to find a comprehensive mathematical model to describe the multi-physical field, droplet effect, and metal pool structure in the electroslag remelting process.
By constructing a simultaneous sequential coupling numerical model of three models, which means a multi-physical steady-state model, a transient model of electrode melting and droplet dropping, and a multiphase transient model of metal pool, it can be more accurate to simulate the multi-physical field, droplet dropping behavior, and molten pool structure in the process of TSCE-ESR. In summary, it is necessary to comprehensively simulate the electroslag remelting process considering the droplet effect. By comparing OE-ESR process with TSCE-ESR process, the influence caused by the change of current direction in the process of TSCE-ESR was systematically studied.
In this paper, the multi-physical steady-state model, the transient model of electrode melting and droplet dropping, and the multiphase transient model of molten metal pool are established in the process of OE-ESR and TSCE-ESR. The electromagnetic field is calculated by the user-defined function (UDF), and the Joule heat and electromagnetic force are coupled to the equation by the source term to calculate the flow field and temperature field of OE-ESR and TSCE-ESR at steady state. The steady-state calculation results are used as the initial conditions for the transient model of electrode melting and droplet dropping and multiphase transient model of metal pool. Then the formation and dripping behavior of the droplets were tracked by VOF method. By using the remelting rate calculated from the transient model of electrode melting and droplet dropping as the inlet boundary condition of multi-phase transient model of molten metal pool, the shape of the molten metal pool considering the droplet effect is calculated. Based on the above methods, this paper makes a comprehensive comparison and study on the process of OE-ESR and TSCE-ESR, and provides a theoretical basis for the development of the process of TSCE-ESR and the improvement of product quality.
2. Mathematical Modeling
Figure 1 is a schematic diagram of the OE-ESR and TSCE-ESR. In this paper, the difference of process between OE-ESR and TSCE-ESR is studied by establishing a two-dimensional steady-state axisymmetric model. Figure 2 shows the computational domain models of OE-ESR and TSCE-ESR, including electrode, slag pool, and ingot. In order to ensure that the input power and geometric parameters of the two processes are consistent, we set the process parameters as follows. The filling ratio of the two processes is 0.5, the electrode length is 310 mm, the mold diameter is 150 mm, the ingot length is 360 mm, and the slag pool depth is 70 mm. In order to simplify the calculation, the following hypothesis is proposed [11]: (1) The process of TSCE-ESR is a steady state process. (2) Ignore the induced magnetic fields in the system. (3) The physical and chemical properties of slag are only related to temperature.
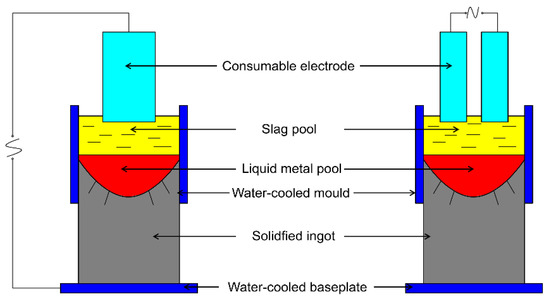
Figure 1.
Schematic diagram of OE-ESR (one-electrode electroslag remelting) and TSCE-ESR (electroslag remelting with two series-connected electrodes).
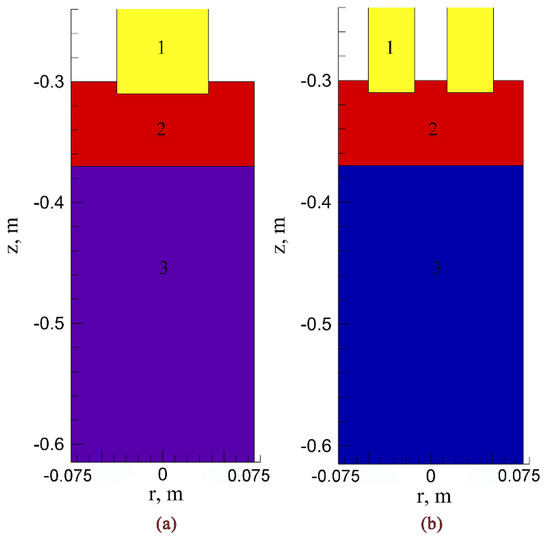
Figure 2.
Computational domains. (a) OE-ESR. (b) TSCE-ESR. 1-electrode, 2-slag pool, 3-ingot.
2.1. A. Governing Equations
2.1.1. Electromagnetic Field Control Equation
The current flows from the electrode into the slag pool to produce Joule heat. In this process, the corresponding induction magnetic field will be generated. The electromagnetic field follows Maxwell’s equations.
The standard Reynolds number is used in the electroslag remelting process and the effect of fluid motion on the electromagnetic field is negligible [12]. The current density is expressed as follows:
where E is the electric field intensity, H is the electric field intensity, J is the current density, B is the magnetic flux density, and t is the time.
2.1.2. Fluid Control Equation
In the electroslag remelting process, the fluid flow is affected by gravity, electromagnetic force, and buoyancy. Electromagnetic force is the main factor driving fluid flow. The flow of molten slag and metallic liquid is determined by the continuity equation and Navier–Stokes equation:
Here, ρ is the density of the fluid, v is the velocity vector, P is the pressure, μeff is the effective viscosity of the fluid, g is the acceleration of gravity, and Ss is the source term including electromagnetic force, buoyancy, and interfacial tension. The electromagnetic force expression is as follow:
where Floc is electromagnetic force and μ0 denotes vacuum permeability.
2.1.3. Multiphase Flow
In the VOF model, the phase volume fraction α is introduced to describe the distribution between the appearance of slag and metal. In each control volume, the sum of the volume fractions of the terms is equal to 1. In the VOF model, the governing equation of the volume fraction of the qth phase is as follows:
where, ρq is density of qth phase, αq is volume fraction of qth phase, vq is the velocity vector of the qth phase, and is the mass transferred from phase pth to phase qth.
2.1.4. Heat Transfer Control Equation
The heat transfer during electroslag remelting determines the final temperature distribution and solidification process. The heat transfer in the slag pool can be expressed by the following equation:
where Cp is the thermal capacity of slag, T is temperature, Sl stands for volumetric heat source with following description:
Qj is Joule heat per unit volume, and Keff represents the effective conductivity, which can be expressed in the following form:
2.1.5. Governing Equation for Droplet
Assuming that the slag is stationary and the droplet is spherical, the droplet movement process can be given by the following formula:
where, ρ is density of molten slag, U denotes the droplet velocity, rd and qd represent the radius
and density of droplet respectively, CD is resistance coefficient, as follows:
The heat transfer characteristics from slag to droplet can be described by a single heat transfer coefficient h and the average temperature TB of slag between the electrode and the slag gold interface. For a single drop, the thermal balance can be written as:
Here, TB is the average temperature between the slag/metal interface at the end of the electrode, CP,d is the heat capacity of the droplet. The heat transfer equation can be calculated by the following equation:
where λ is conductivity of the molten slag, Uav represents the average velocity of droplet in slag pool, L is the distance between the two electrodes.
When a droplet drops to the slag/droplets interface, the temperature can be expressed as:
where
The amount of heat when a droplet falls can be expressed as:
where Q represents the heat absorbed by the droplet, me indicates the electrode melting rate, Cp denotes heat capacity of liquid steel, Tdp is the temperature of the droplet, TL represents liquidus temperature, Tme represents the melting temperature of the electrode.
2.2. Multi-Physical Field Steady State Model Conditions
2.2.1. Electromagnetic Boundary Condition
In order to simplify the calculation, the influence of slag peel is not considered in this model [13]. Figure 3 is a schematic diagram of boundary conditions. In the process of TSCE-ESR, current flows from one electrode to the other and back to the short-net system after passing through the slag pool. In the slag/air interface current only has a radial component. Therefore, the magnetic field in the slag/air interface only has an axial component [14]. The expression of current and magnetic field is as follows:
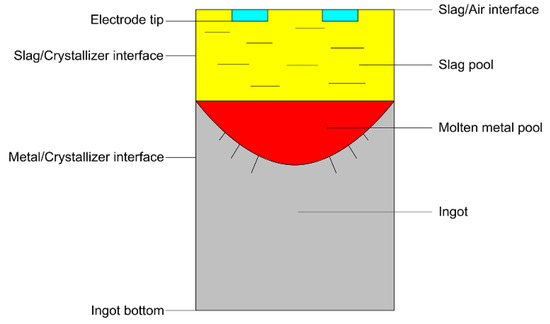
Figure 3.
Schematic diagram of boundary conditions.
At the slag pool/mold interface, this model does not consider the current flowing into the side wall of the mold, so the current on the two contact surfaces only flows in the axial direction, and the magnetic field only has a radial component [15]. The expression between the current and the magnetic field is as follows:
Here, I0 is the initial current fed into the electrode at its upper side, which will vary in the following iterative procedure.
2.2.2. Heat Transfer Boundary Condition
In this paper, the heat transfer at slag/air interface is complicated. Therefore, the total heat transfer at the slag/air interface can be expressed as:
Qc is the heat of convection heat transfer, Qr the heat transfer heat of the radiation, the heat exchange area, and h the comprehensive convective heat transfer coefficient, which can be expressed by the formula:
Here, hc is the convective heat transfer coefficient, hr is the convective heat transfer coefficient equivalent to the radiation heat transfer.
At the slag pool/crystallizer interface, the metal/crystallizer interface and the bottom of steel ingot, the comprehensive heat transfer coefficient is relatively complex, so the measured data are adopted and treated according to the third type of boundary conditions.
2.2.3. Flow Boundary Condition
At the slag/air interface, the friction resistance between the two is very small, so the sliding wall boundary condition is adopted [16,17]:
For slag pool/crystallizer interface, metal/crystallizer interface, and ingot bottom surface, which is considered as a non-slip wall surface:
2.3. Transient Model of Electrode Melting and Droplet Dropping Conditions
The electrode melting model uses the temperature of the slag/droplets interface of the steady-state model as its boundary condition, which can be expressed by the following equation:
In addition, the electrode surface must be loaded with multiphase flow boundary conditions:
where Ts-i is the temperature distribution of the slag/droplets interface at steady state, and Vst is the electrode volume fraction.
2.4. Multi-Phase Transient Model of Molten Metal Pool Boundary Conditions
The mass-flow-inlet boundary condition can be introduced into multi-phase transient model of molten metal pool boundary condition. The exit boundary condition is set to out-of-flow.
In addition, polyphase flow boundary conditions need to be defined. The upper surface of the electrode is:
The bottom of the ingot is:
where, Vst is the volume fraction of steel, and Vin represents the volume fraction of solidified ingot at the outlet boundary.
2.5. Calculation Strategy
Figure 4 is the flow chart of numerical simulation. Table 1 shows the physical parameters adopted in this model [18,19,20,21,22]. The multi-physical steady-state model, the transient model of electrode melting and droplet dropping, and the multiphase transient model of molten metal pool are established in the process of OE-ESR and TSCE-ESR by using commercial software Fluent © (Ansys, Pittsburgh, PA, USA). The electromagnetic field was calculated by the UDF module, and the Joule heat and electromagnetic force were coupled to the energy equation and momentum equation to solve the flow field and temperature field. The steady-state calculation results are used as the initial conditions for the transient model of electrode melting and droplet dropping and the multiphase transient model of molten metal pool. The distribution of slag and metal was tracked by VOF method. By using the remelting rate calculated from the transient model of electrode melting and droplet dropping as the inlet boundary condition of the multiphase transient model of molten metal pool, the structure of the molten metal pool considering the droplet effect is calculated.
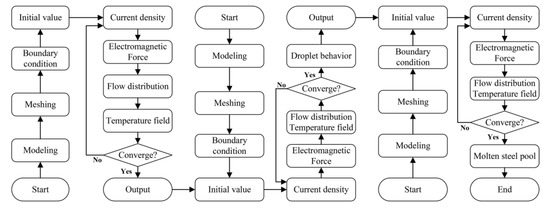
Figure 4.
Numerical simulation flow charts. (a) Multi-physical steady-state model. (b) Transient model of electrode melting and droplet dropping. (c) Multi-phase transient model of molten metal pool.

Table 1.
Physical properties and geometric parameters for the simulation.
3. Results and Discussion
Under the same input power and the same filling ratio (the ratio of electrode diameter to mold diameter), a two-dimensional comprehensive mathematical model of the process of OE-ESR and TSCE-ESR were established. The multi-physical field and droplet effect under the two processes are described in terms of the metal pool structure, and the molten metal pool structure considering droplet effect is obtained.
3.1. Electromagnetic Field
Figure 5 shows the current density distribution in the process of OE-ESR and TSCE-ESR. It can be seen from Figure 5a that in the process of OE-ESR, after the current flows from the electrode into the slag pool, the current is redistributed, which is mainly concentrated below the electrode. Therefore, the current density in the central area of the slag pool is relatively large. It can be seen from Figure 5b that in the process of TSCE-ESR, the current path is mainly divided into two types. One is that the current flows from one electrode into the slag pool, then directly into the other electrode, and finally flows back to the short-net system. Another way is that when the current flows from one electrode, a small amount of current will flow through the ingot, then through the slag pool, and finally back to the short-net system. Because of the self-inductance and mutual inductance of the two electrodes, there is a significant proximity effect on the current density distribution between the two electrodes. Proximity effect makes the current flow along the shortest path, resulting in the current density mainly concentrated on the inner side of the two electrodes in the slag pool, which accounts for about 44.9% of the total current. Figure 6 shows the current density values of OE-ESR and TSCE-ESR at z = −0.31 m. It can be seen from the figure that because of the skin effect, the current density values of OE-ESR and TSCE-ESR reach the peak at the corner of the electrode tip. However, in the process of TSCE-ESR, the current density value in the corner area (r = ± 0.01325) near the tips of the two electrodes is much larger than that in the corner area (r = ± 0.05075) near the mold. Therefore, in the process of TSCE-ESR, the proximity effect will inhibit the skin effect and becomes the main factor affecting the current distribution in slag pool.
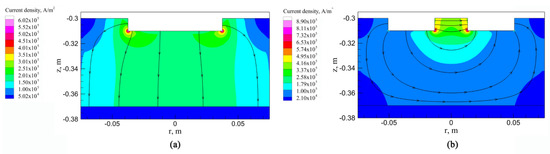
Figure 5.
Current density distribution in slag pool. (a) OE-ESR. (b) TSCE-ESR. The black line represents the current flow line.
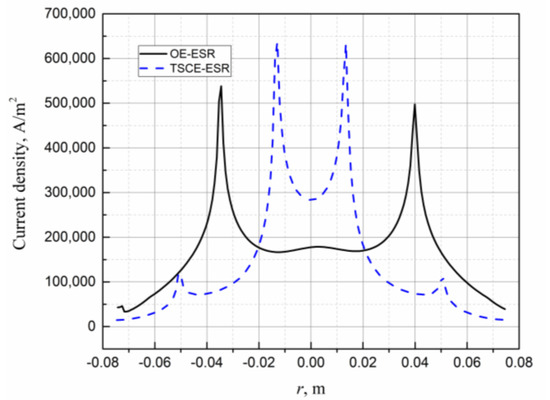
Figure 6.
Current density value at z = −0.31 m.
It can be seen from Figure 7 that in the process of OE-ESR and TSCE-ESR, the Joule heat distribution is similar to the current density distribution. In the process of OE-ESR the Joule heat is mainly concentrated in the central area of the slag pool below the electrode. In the process of TSCE-ESR, the Joule heating area is mainly located in the inner region of the two electrodes in the slag pool, and the Joule heat power density value is much larger than other regions. In the process of OE-ESR, the maximum power density of Joule heat is 1.07 × 10⁹ W/m3, while in the process of TSCE-ESR, the maximum power density of Joule heat is 2.32 × 10⁹ W/m3, which is about twice that of OE-ESR. Therefore, compared with OE-ESR, the Joule heat distribution of slag pool in TSCE-ESR process is more concentrated and stronger.
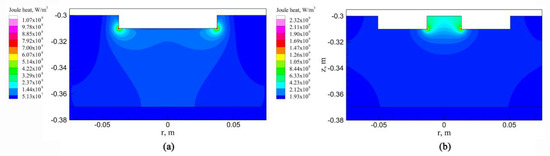
Figure 7.
Joule heat distribution in slag pool. (a) OE-ESR. (b) TSCE-ESR.
Figure 8 shows the distribution of electromagnetic forces in the process of OE-ESR and TSCE-ESR. The direction of the electromagnetic force is perpendicular to the direction of the current, and its magnitude depends on the magnitude of the current density. In the OE-ESR process, the electromagnetic force is almost zero at the center line of the slag pool because of the offsetting effect of the electromagnetic force. In the TSCE-ESR process, the current density is mainly concentrated in the inner regions of the two electrodes in the slag pool because of proximity effect. Therefore, the electromagnetic force is larger in the upper part of the slag pool and smaller in the periphery of the slag pool. At the same time, because of the inhibition of the proximity effect on skin collection effect, the electromagnetic force in the outer corner of the two electrode tips is almost zero. As can be seen from the Figure 8, the electromagnetic force generated in the process of TSCE-ESR is much larger than that generated in the process of OE-ESR.
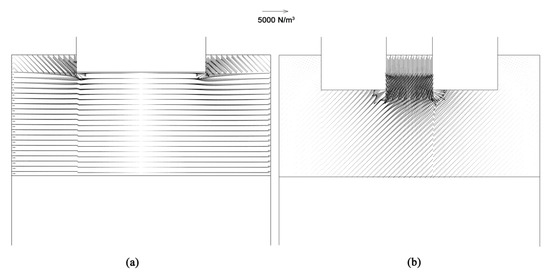
Figure 8.
Vector diagram of electromagnetic force. (a) OE-ESR. (b) TSCE-ESR.
3.2. Velocity Field and Temperature Field
The temperature field in the slag pool is formed under the combined action of Joule heat and flow field. The fluid flow in the slag pool is determined by electromagnetic force, buoyancy, and gravity, among which electromagnetic force plays a dominant role. The flow characteristics of slag ultimately determine the temperature distribution of slag pool. It can be seen from Figure 9a,b that in the OE-ESR process, because of the large electromagnetic force in the corner area of the electrode tip, slag is driven from the periphery of the electrode to the central area of the slag pool, thus there is a pair of opposite vortices in the slag pool. The heating area of Joule heat is mainly located in the central area of the slag pool below the electrode, and the slag flows from the center of the slag pool to the periphery, transferring the heat from the central area to the periphery of the slag pool. At the periphery of the vortex, the velocity is larger and the temperature is lower, while at the center of the vortex where the velocity is slower, the temperature is higher. During the OE-ESR process, the maximum temperature of slag pool is up to 2010 K. According to Figure 9c, in the process of TSCE-ESR, the electromagnetic force drives the slag to flow from the center of the slag pool to the periphery of the slag pool, thus forming a pair of vortices with opposite directions. The area between the two electrodes in the slag pool is the main heating area of Joule heat. The flow of slag transfers heat from the area between the two electrodes to the entire slag pool. Therefore, it can be seen from Figure 9d that in the TSCE-ESR process, the high temperature region is mainly located in the region between the two electrodes, with the temperature up to 2186 K, while the temperature distribution in other regions of the slag pool is relatively uniform. Figure 10 is surface diagram of the temperature distribution in the slag pool area during the OE-ESR and TSCE-ESR processes. Compared with OE-ESR, the temperature distribution of the slag pool during the TSCE-ESR process is significantly more uniform. Table 2 shows the average temperature in the slag pool area and the radial temperature gradient at the slag/electrode interface. The table indicates that during the TSCE-ESR process, the average temperature in the slag pool area is relatively low, which is 158.3 K lower than that in the OE-ESR process. In the process of TSCE-ESR, the temperature difference between the axis of symmetry and the mold decreased significantly, which is 136.39 K less than that between the axis of symmetry and the mold in the process of OE-ESR. In conclusion, compared with the process of OE-ESR, the temperature of slag pool in the process of TSCE-ESR is relatively uniform, the temperature gradient is significantly smaller, and the temperature difference between the axis of symmetry and the mold is reduced, which have positive effects on the solidification of ingot.
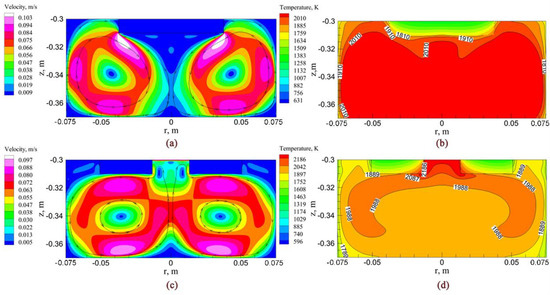
Figure 9.
Velocity field and temperature field distribution in slag pool. (a) Velocity field of OE-ESR. (b) Temperature field of OE-ESR. (c) Velocity field of TSCE-ESR. (d) Temperature field of TSCE-ESR.
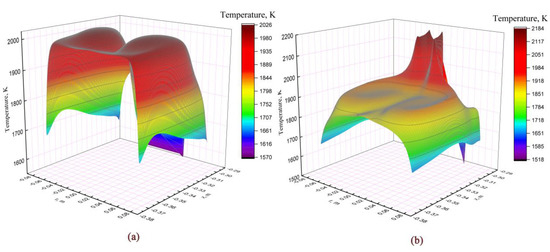
Figure 10.
Surface map of temperature distribution in slag pool. (a) OE-ESR. (b) TSCE-ESR.
Table 2.
Average temperature in the slag pool area and the radial temperature gradient at the slag/electrode interface.
3.3. Simulation Results of Droplet Formation and Dripping Process
Figure 11 and Figure 12 show the droplet formation and dripping process in the process of OE-ESR and TSCE-ESR. It can be seen from Figure 11 that in the process of OE-ESR, because of the effect of Joule heat, the electrode tip corner region first begins to melt, making the electrode shape become conical and forming two smaller droplet sources. The two smaller droplet sources gradually converge into a larger droplet source due to the scour effect caused by the flow of molten slag, and gather at the tip of the electrode. With the gradual increase of molten steel, when the combined force of gravity, buoyancy, and electromagnetic force is greater than the interfacial tension, the droplet reaches a critical size. At this time, the droplets are divided into two parts because of the effect of necking. One part of the droplets quickly retracts to the tip of the electrode under the action of surface tension and forms numerous small droplets in suspension. The other part of the droplets continues to move downward, gradually changing from linear to circular. It can be seen from Figure 12 that during the TSCE-ESR process, because the high temperature region is concentrated between the two electrodes, the metal between the two electrodes melts first. Under the action of slag flow scouring, the droplets gather near the center of the electrode and form the droplet source. As can be seen from the figure that the droplets dripping process of TSCE-ESR and OE-ESR are roughly the same. However, because of the high temperature between the two electrodes in the process of TSCE-ESR, the ambient temperature in the droplet dropping process is significantly higher than that in the process of OE-ESR. The higher temperature will reduce the interfacial tension. Therefore, the droplet tensile length in the TSCE-ESR process is significantly shorter than that in the OE-ESR process. Thus, the formation time of the droplet is shortened and the droplet falling frequency is increased. At the same time, the size of the interfacial tension will affect the size of the droplet. Campbell [23] proposed the theoretical estimation formula of the maximum droplet diameter:
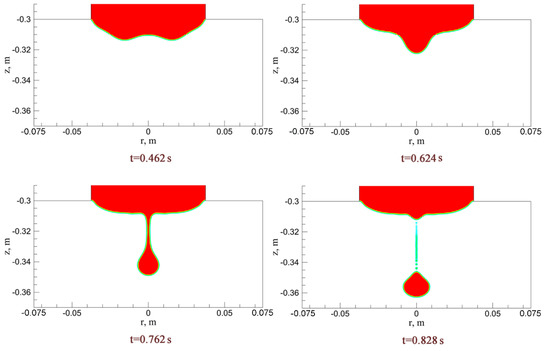
Figure 11.
Formation and dripping process of droplet of OE-ESR.
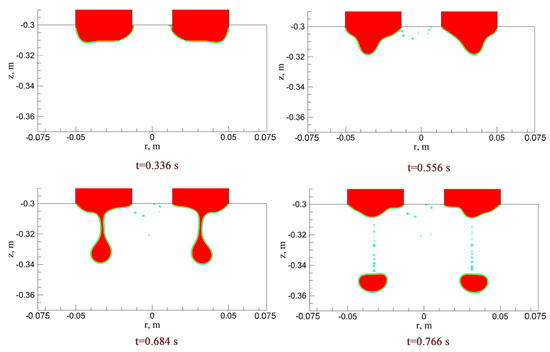
Figure 12.
Formation and dripping process of droplet of TSCE-ESR.
The theoretical prediction value of droplet diameter in the process of OE-ESR is 15.1 mm and 13.47 mm in the process of TSCE-ESR. Table 3 lists the droplet diameters calculated by numerical simulation. The average droplet diameter calculated by numerical simulation is slightly smaller than the theoretically predicted diameter. As can be seen from the table, the diameter of a single droplet in the TSCE-ESR process is significantly smaller than that generated in the process of OE-ESR. This is because during the TSCE-ESR process, with the reduction of interfacial tension and the droplet formation time, the droplet becomes relatively small. During the droplet formation and dripping process, the contact interface between molten metal and slag is the main area for slag/electrode reaction and removal of non-metallic inclusions in consumable electrode [24]. Therefore, the relatively small droplets generated during the TSCE-ESR process will increase the specific surface area of the droplets in contact with slag, thus facilitating the removal of non-metallic inclusions and further improving the metallurgical quality. In addition, the theoretical residence time of the droplet in the slag can be calculated by the following calculation formula [25]:
Table 3.
The calculated and theoretically predicted diameter of droplets.
The residence time of the droplet in the slag pool of OE-ESR and TSCE-ESR was estimated to be 0.267 s and 0.213 s, respectively. The residence time calculated by numerical simulation is 0.272 s and 0.228 s, respectively. The difference between the theoretical calculation value and the numerical simulation result is small, because the empirical formula does not take into account the influence of slag flow [26]. Therefore, the rationality of the calculation results of this model can be affirmed.
Figure 13 and Figure 14 show the velocity field and temperature field of the droplet formation and dripping process of OE-ESR. Figure 15 and Figure 16 show the velocity field and temperature field of the droplet formation and dripping process of TSCE-ESR. During the dripping process, the maximum temperature of slag pool temperature field did not change significantly. However, it has a significant effect on the distribution of the whole temperature field in the slag pool. The temperature of the area through which the droplets fall decreases, and a significant temperature gradient is formed. It can be seen from the temperature field distribution diagram that during the droplet dropping processes of OE-ESR and TSCE-ESR, the temperature field of the slag pool changes approximately the same. However, compared with OE-ESR, the decrease of temperature in TSCE-ESR slag pool is obviously larger. It can be seen from Figure 13 and Figure 15 that the dripping of the droplet significantly increases the flow velocity in the vicinity of the droplet, which is conducive to the flow of slag in the slag pool. Compared with the flow rate of the slag pool at steady state, the maximum flow rate of the slag pool in the process of OE-ESR increased from 0.11 m/s to 0.41 m/s, and the maximum flow rate of the slag pool in the process of TSCE-ESR increased from 0.097 m/s to 0.46 m/s, the dripping of droplets increases the maximum flow velocity of the slag pool by about four times. Table 4 reveals the average velocity of the slag pool in the steady state (before the droplet drop) and the maximum average velocity in the transient state (during the dripping process of droplet). The maximum average velocity of the slag pool in OE-ESR transient state is 0.062 m/s, which is 19.2% higher than that in the steady state. The maximum average velocity of the slag pool in the TSCE-ESR transient state is 0.093 m/s, which is 82.3% higher than that in the steady state. Therefore, compared with OE-ESR, the increases of overall velocity of slag pool is more obvious in the droplet dropping process of TSCE-ESR. The interaction between the droplet and the slag pool will promote the flow of the slag pool and facilitate the transfer of energy and mass. Formula (33) refers to the study of Hu and Kintner [27], and the motion of the droplet in the slag pool can be determined by the following empirical formula:
where X and Y are described as follows respectively:
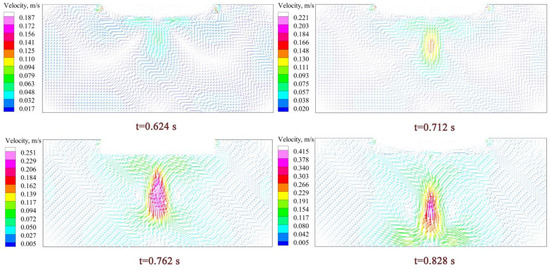
Figure 13.
Distribution of velocity field during droplet dripping process of OE-ESR.
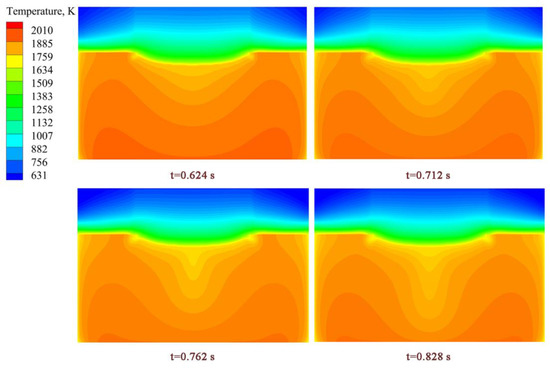
Figure 14.
Distribution of the temperature field during the droplet dripping process of OE-ESR.
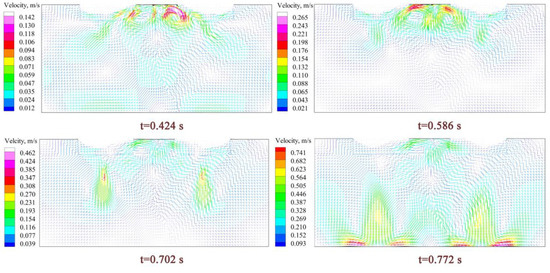
Figure 15.
Distribution of velocity field during droplet dripping process of TSCE-ESR.
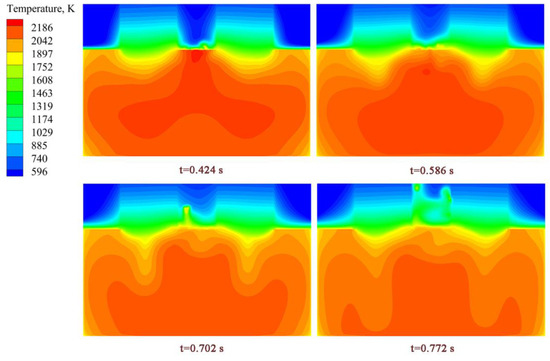
Figure 16.
Distribution of the temperature field during the droplet dripping process of TSCE-ESR.
Table 4.
Average velocity in steady and transient states in slag pool.
Here, Cd is dimensionless drag coefficient; We is weber number; Pd is physical property group; Re is Reynolds number. Through Equations (33) and (35), the theoretical predicted value of the final droplet velocity in the slag pool can be calculated. In the process of OE-ESR, the theoretical predicted value of the final drop velocity is 0.40 m /s, and in the process of TSCE-ESR, the theoretical predicted value of the final drop velocity in the slag pool is 0.71 /s. Through numerical simulation, the final drop velocity of OE-ESR is 0.41 m/s, and that of TSCE-ESR is 0.74 m/s. The calculated value is slightly higher than the theoretical predicted value, which is caused by buoyancy and slag flow.
3.4. Remelting Rate and Molten Metal Pool
From the perspective of thermal equilibrium, the shape of the molten metal pool depends on the heating and cooling methods of the steel ingot. When the steel type is fixed and the cooling condition is basically unchanged, the shape of the molten metal pool mainly depends on the heat supply at the slag/metal interface. Figure 17 shows the thermal equilibrium parameters in the steady state of OE-ESR and TSCE-ESR in the whole calculation domain. The values of the heat balance can be obtained by monitors module of fluent. The results show that in the OE-ESR process, the heat passing through the slag/metal interface is 150 kW. In the TSCE-ESR process, the heat passing through the slag/metal interface is 118 kW. Compared with the OE-ESR, the heat transfer at the slag/metal interface in the process of TSCE-ESR is reduced by 32 kW, which significantly reduces the heat transfer from the slag pool to the molten metal pool. Therefore, the molten metal pool formed during the TSCE-ESR process is relatively shallow. The shallower molten metal pool can reduce the columnar crystal angle, which is beneficial to obtain the crystal structure inclined in the axial direction and improve the quality of the ingot core. Figure 18 is the profile of the molten metal pool at the steady state process of OE-ESR and TSCE-ESR. As can be seen from the figure, compared with the “V” shaped metal pool formed in the process of TSCE-ESR, the cylindrical section formed on the “U” shaped molten metal pool in the process of OE-ESR is higher. This is because in the OE-ESR process, the heat transferred from metal to mold accounts for about 29.88% of the total heat, while in the TSCE-ESR process, the heat transferred from metal to mold is only 23.82%. Therefore, in the steady state of the OE-ESR process, because of the larger heat flux density near the side wall, the cylinder size segment formed is correspondingly large. The increase of cylindrical section is helpful to obtain remelting ingot with better surface quality [24].
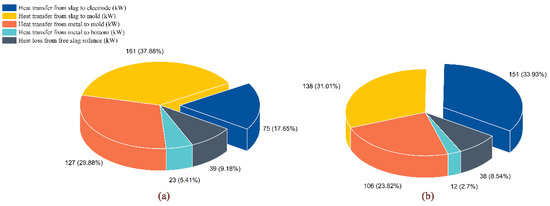
Figure 17.
Overall heat balance. (a) OE-ESR. (b) TSCE-ESR.
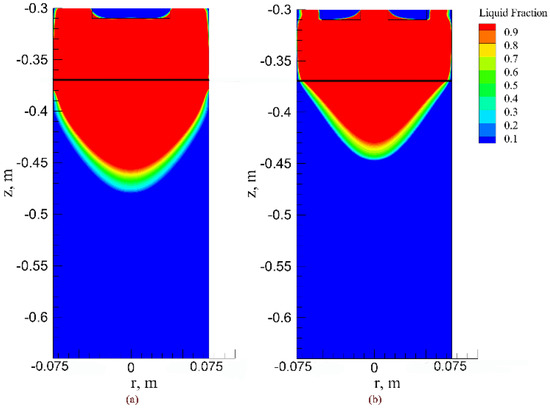
Figure 18.
Profile of molten metal pool without droplet effect. (a) OE-ESR. (b) TSCE-ESR.
At the same time, the depth of the molten metal pool can be expressed by the net heat flux at the slag/metal interface:
In the formula, Qsm mainly depends on the convective heat transfer between slag/metal, and its heat transfer is related to the viscosity and thermal conductivity of slag, so it can be expressed as ∑Qsm = Qd + Qse. Qd represents the heat flow absorbed by the droplets and Qse represents the heat flow of slag to the electrode, J/s. Qd and Qse are mainly determined by the electrode melting rate. Therefore, the electrode melting rate can be calculated by using the thermal balance between slag/electrode in this model, which was proposed by Choudary [28].
In this equation, me is the melting rate of the electrode, kg·s−1; cp is the thermal capacity, J·kg−1·K−1; TL and T0 represent liquidus temperature and reference temperature respectively, K; L is the latent heat of the metal, J·kg−1; r is radius of the electrode, m; qse is heat flux from slag to electrode, W·m−2. It can be concluded from the formula that the melting rate is determined by the heat transfer from the slag to the electrode. The calculation results are shown in Table 5. As can be seen from the table, compared with the process of OE-ESR, the droplet diameter formed during the TSCE-ESR process is smaller. Although the individual droplets formed during the TSCE-ESR process is smaller, the melting rate is more influenced by heat transfer, frequency, and so on. As can be seen from Figure 17, the heat used to melt the electrode accounts for 17% and 34% of the total Joule heat during the process of OE-ESR and TSCE-ESR respectively. This makes the melting rate in the TSCE-ESR process about twice that of the OE-ESR. Figure 19 is a schematic diagram of a molten metal pool with droplet effect. Considering the influence of droplet, the depth of the molten metal pool of OE-ESR and TSCE-ESR increase obviously. This is because the droplets bring more heat into the molten metal pool, so that more heat is transferred to the slag/metal interface. Therefore, in the simulation of electroslag remelting process, the coupling droplet effect is necessary, which is beneficial to improve the accuracy of numerical simulation results. Although the melting rate in the TSCE-ESR process is relatively high, the depth of the molten metal pool is still lower than that of the OE-ESR. At the same time, the width of the mushy zone is significantly reduced relative to that before the droplet dripping. This may be because the droplet dripping promotes the slag pool flow and changes the uniformity of the slag pool temperature. The difference is that the cylinder section (the height of the liquid metal in contact with the crystallizer) of TSCE-ESR molten metal pool has been increased by 10 mm while the cylinder section of OE-ESR metal pool has been increased by only 3 mm. This is because the higher melting rate in the TSCE-ESR process is beneficial to the formation of the cylinder section of the molten metal pool. With the increase of the cylinder section of the molten metal pool, the surface of the remelted ingot is smoother. Therefore, it can be concluded that the TSCE-ESR process can maintain a high melting rate and form a relatively shallow metal pool when considering the droplet. At the same time, the height of the cylinder section of the TSCE-ESR molten metal pool increases obviously.
Table 5.
Droplet average diameter and remelting rate.
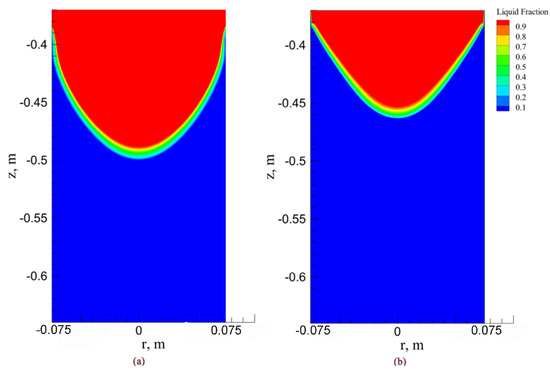
Figure 19.
Profile of molten metal pool with droplet effect. (a) OE-ESR. (b) TSCE-ESR.
3.5. Validation of Mathematical Model
In order to verify the simulation results, the electroslag remelting experiment was carried out according to the simulation parameters. In the numerical simulation, the values of the molten metal pool structure and the width of the mushy region can be obtained by the post-processing software Tecplot (Tecplot, Bellevue, WA, USA). Figure 20a shows the photo of the TSCE-ESR plant experiment. In the experiment, the current is 4000 A and the current frequency is 50 Hz. The mold diameter is 150 mm and the height is 360 mm. The diameter of electrode is 37.5 mm and the electrode insertion depth is 10 mm. Slag system consisted of CaF2 (30%), CaO (35%), Al2O3 (20%), and MgO (15%). Figure 20b reveals molten metal pool structure in the process of TSCE-ESR. Tungsten powder was added at the end of the normal remelting period of the electroslag remelting process. When the remelting is finished, the electroslag ingot was annealed at 1183 K for 10 h, and the molten metal pool structure in the process of TSCE-ESR was obtained through cutting, sawing, grinding, and pickling. The molten metal pool structure is measured by taking points. It can be seen from Figure 21 that compared with the steady state metal pool structure, the molten metal pool structure coupled with the droplet effect is more similar to the experimental measured value. Therefore, the coupling of droplet effect during the numerical simulation process can effectively improve the accuracy of the simulation results, and it also illustrates the rationality of the model.
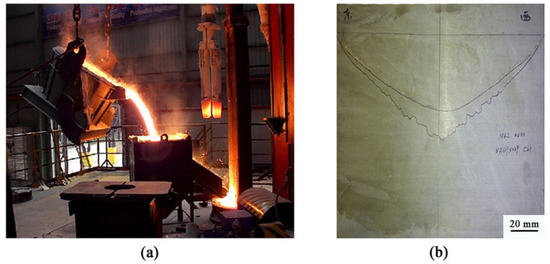
Figure 20.
The experiment of TSCE-ESR process. (a) Photo of the TSCE-ESR plant experiment. (b) Molten metal pool structure in the process of TSCE-ESR.
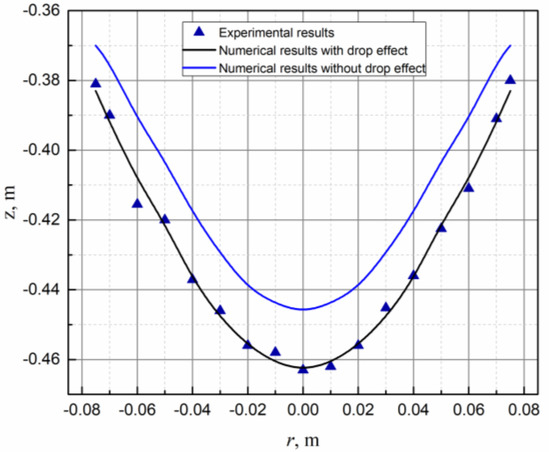
Figure 21.
Comparison of molten metal pool structure between the experimental value and the numerical value.
Figure 22 reveals the comparison of the width of mushy zone between the experimental value and the numerical value. As can be seen from the figure, in the numerical simulation results coupled with the droplet effect, the width of the paste zone decreases significantly, which is more consistent with the results of actual electroslag remelting. To sum up, in the case of coupled droplet formation and dropping, the droplet will put more heat into the molten metal pool and increase the heat transfer efficiency of the slag/metal interface. Therefore, it makes a relatively deeper molten metal pool, showing an increase in the cylindrical section of the molten metal pool and a decrease in the width of the paste region. These are conducive to the numerical simulation more consistent with the actual electroslag remelting processAll these make the actual electroslag.
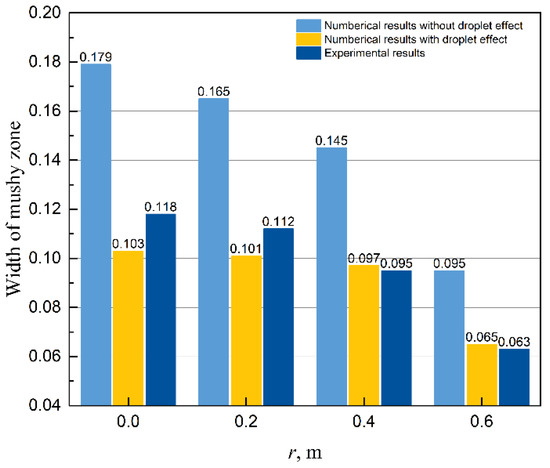
Figure 22.
Comparison of the width of mushy zone between the experimental value and the numerical value.
3.6. Discussion
In previous studies, the multi-physical fields and droplet formation and dropping behavior in the process of ESR were mostly developed independently [4,5,6,7,8,9,10]. However, it is worth noting that the formation of multi-physical field, droplet behavior, and molten metal pool is a continuous process. Droplet formation and dripping behavior interact with multi-physical field, while the structure of molten metal pool is determined by the multi-physical field and droplet behavior. Besides, as shown in Figure 19, the dropping of droplets will bring a large amount of heat to the molten metal melting pool, which will produce significant changes to the molten metal pool. Therefore, in the numerical simulation of electroslag remelting process, it is necessary and comprehensive to consider simultaneously the multi-physical field, droplet effect, and molten metal pool structure. As shown in Figure 21 and Figure 22, this will significantly improve the accuracy of the numerical simulation of the electroslag remelting process.
During the formation and dropping of molten droplets, the full contact and interaction between molten slag and molten steel play an important role in the removal of inclusions. In addition to the dissolution and adsorption of inclusions by liquid slag [29], the stretching stage of the molten droplets provides good kinetic and thermodynamic conditions for the removal of inclusions [30]. Compared with OE-ESR, because the heat used to melt the electrode in the TCES-ESR process is higher, the droplet dropping frequency is increased, which makes TSCE-ESR form smaller and more droplets. The production of smaller and more droplets is equivalent to increasing the specific surface area of the droplets and increasing the contact area between liquid slag and liquid steel. This facilitates the removal of inclusions during the TSCE-ESR process. Therefore, the refining effect of the TSCE-ESR process is significantly higher than that of the OE-ESR process.
In the droplet effect, the melting rate is the key factor affecting the molten metal pool. Therefore, it is very important to compare the coupling droplet effect between OE-ESR and TSCE-ESR. As shown in Figure 17, the heat used to melt the electrode in the process of TSCE-ESR is about twice that of the OE-ESR process, which further increases the melting rate in the process of TSCE-ESR. However, the increased melting rate will bring more heat to the metal pool, increasing the heat transfer at the slag/metal interface and resulting a deeper molten metal pool [24]. However, as shown in Figure 7, the dominant role of the proximity effect causes the joule heat of TSCE-ESR to concentrate over the slag pool, which results in a reduction in heat transfer from the slag/metal interface. Considering the distribution of joule heat and the influence of melting rate, the heat transfer at the slag/metal interface in TSCE-ESR process is less than OE-ESR. As shown in Figure 19, for the above reasons, this makes the molten metal pool of TSCE-ESR shallower than that of OE-ESR. Therefore, in the process of TSCE-ESR, the unification of high melting rate and shallow flat molten metal pool can be maintained.
As shown in Figure 19, compared with OE-ESR, the formation of a shallow flat molten metal pool during the TSCE-ESR process can reduce the angle of columnar crystals and obtain the crystallization structure with axial orientation. Practice has proved that the quality of axial crystallization metallurgy is better than that of radial crystallization metallurgy [24,31]. In addition to controlling the quality of the ingot through the structure of the molten metal pool, Flemings [32] pointed out that the ingot structure is controlled by the local solidification time (LST), and the relationship between LST and dendrite spacing is determined by the following formula:
Here, LST is the local solidification time, s; X is the distance between the solid and liquid phases, mm; Vr is the local solidification speed, mm/s; G is the temperature gradient of the liquid phase, K/mm; Rc is the local cooling rate, K·s−1; d is the secondary dendrite spacing, mm; k1, k2, n and b are constants related to material properties. From Equations (38)–(40) and Figure 23, it can be seen that LST is constrained by factors such as the width of the solid–liquid two-phase region, the local solidification rate, and the temperature gradient of the liquid phase. LST can be reduced by reducing the width of the solid–liquid two-phase region, increasing the local solidification time, and increasing the temperature gradient of the liquid phase. As shown in Figure 19, compared with OE-ESR, the TSCE-ESR process reduces the width of the liquid–solid two-phase region of the ingot core while changing the temperature field distribution of the ingot, and improves the molten steel by reducing the crystallization angle. Both of them can reduce LST, so the ingot quality can be effectively improved. In the actual remelting process, we cannot see the metal melting pool, but in the numerical simulation, LST can be obtained according to the following equation:
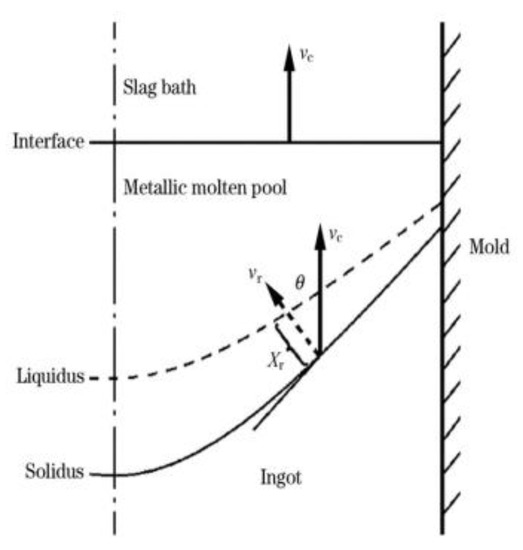
Figure 23.
Relationship of local solidification time and cooling rate in ESR process.
In this formula, zs and z1 represent the position of the solidus line and the liquidus line, respectively. Figure 24 shows the LST results of the two processes. The LST of TSCE-ESR process is obviously smaller than that of OE-ESR, which will reduce the tendency of element segregation in the TSCE-ESR process and be beneficial to control the improvement of ingot quality.
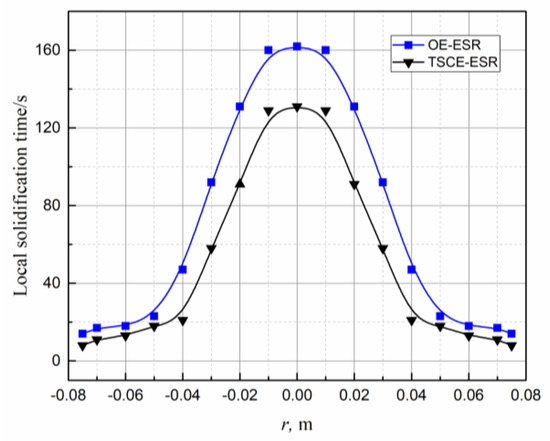
Figure 24.
Local solidification time (LST) at different processes.
4. Conclusions
In this paper, a two-dimensional comprehensive mathematical model of the process of OE-ESR and TSCE-ESR was established. Considering the influence of droplet behavior, the structure distribution of molten metal pool obtained by the two processes is discussed. The main conclusions are as follows:
(1) The proximity effect of the electrodes suppresses the skin effect, and Joule heat is concentrated in the slag pool area between the two electrodes, which makes the Joule heat more concentrated and stronger during the process of TSCE-ESR. Compared with OE-ESR, the slag pool temperature in the process of TSCE-ESR is more uniform, the temperature gradient is significantly smaller, and the temperature difference between the symmetry axis and the mold decreases.
(2) The maximum average velocity in the slag pool during the droplet dropping process of OE-ESR is 0.062 m/s, which is 19.2% higher than that in the steady state. The maximum average velocity in the slag pool during the droplet dropping process of TSCE-ESR is 0.093 m/s, which is 82.3% higher than that in the steady state. Compared with OE-ESR, the overall velocity of slag pool is improved more obviously during the droplet dropping process of TSCE-ESR. This is conducive to the transfer of energy and mass in the slag pool and provides good thermodynamic and kinetic conditions for the removal of non-metallic inclusions.
(3) In the process of OE-ESR, the heat used to melt the electrode accounted for 17% of the total Joule heat. In the process of TSCE-ESR, the heat used to melt the electrode accounted for 34% of the total Joule heat, which enabled TSCE-ESR to produce relatively small droplets at a relatively high melting rate, thus effectively improved the working efficiency and facilitated the removal of non-metallic inclusions.
(4) Under the same input power, the heat through the slag/metal interface in the process of OE-ESR is 150 kW, while the heat through the slag/metal interface in the process of TSCE-ESR is 118 kW. The net heat flow through the slag/metal interface is relatively small in the process of TSCE-ESR, which makes the molten metal pool shallower. Considering the droplet behavior, the TSCE-ESR process can achieve the unification of higher melting rate and shallow flat molting pool, which is beneficial to obtain the crystal structure inclined in the axial direction. Compared with the results without droplet effect, it is found that in the simulation results with droplet effect, the depth and the cylindrical section of molten metal pool increased, and the width of the mushy zone is significantly reduced, which is more consistent with the actual electroslag remelting process.
Author Contributions
Conceptualization, W.L.; methodology, W.T. and W.L.; formal analysis, W.T. and W.L.; investigation, W.T.; resources, X.Z. and H.L.; writing—original draft preparation, W.T.; writing—review and editing, W.T. and W.L.; supervision, Z.J. and D.L. All authors have read and agreed to the published version of the manuscript.
Funding
The authors gratefully express their appreciation to Natural Science Foundation of China (No.51974153, No. U1960203), and the Joint Fund of State key Laboratory of Marine Engineering and University of Science and Technology Liaoning (SKLMEA-USTLN-201901, SKLMEA-USTL-201707), and the China Scholarship Council (201908210457).
Conflicts of Interest
The authors declare that there are no conflicts of interest.
Abbreviations
| E | Electric Field (V·m−1) |
| H | Magnetic field intensity (A·m−1) |
| J | Current density (A·m−2) |
| B | Magnetic flux density (T) |
| t | Time (s) |
| ρ | Density of fluid (kg·m−3) |
| v | Velocity (m·s−1) |
| P | Pressure (Pa) |
| μeff | Effective viscosity of the fluid (Pa·s) |
| Floc | Electromagnetic force (N·m−3) |
| μ0 | Vaccum permeabilitbility (H·m−1) |
| Qj | Joule heat per unit volume (W·m−3) |
| σ | Electroconductibility (S·m−1) |
| ut | Turbulent velocity (m·s−1) |
| U | Velocity of droplet (m·s−1) |
| rd | Radius of droplet (m) |
| qd | Density of droplet (kg·m−3) |
| CD | Resistance coefficient |
| λ | Conductivity of liquid (S·m−1) |
| Cp | The thermal capacity of slag (J·kg−1·K−1) |
| Tdp | Temperature of droplet (K) |
| LST | Local solidification time (s) |
| Vr | Local solidification rate (mm·s−1) |
| Rc | Local cooling rate (K·s−1) |
| de | The Diameter of Droplet (m) |
| σd | Surface tension (N·m−1) |
| ρm | Density of metal (kg·m−3) |
| ρs | Density of slag (kg·m−3) |
| HS | Coefficient of position (1) |
| τ | Droplet residence time in the slag pool (s) |
| Vt | Terminal velocity (m·s−1) |
| We | Weber number (ρm·Vt2·d·r·σd−1) |
| Pd | Physical property group |
| Re | Reynolds number (ρm·Vt2·d·μ−1) |
| me | Melt rate (kg·s−1) |
| T0 | Reference temperature (K) |
| R | Radius of the electrode (m) |
| qse | Heat flux from slag to electrode (W·m−2) |
| TL | Liquidus temperature (K) |
| Tme | Melting point of electrode (K) |
| I0 | Current (A) |
| Qc | Heat of convection heat transfer (W·m−2·K−1) |
| A | Heat exchange area (m2) |
| h | Heat transfer coefficient (W·m−2·K−1) |
| CP,d | Heat capacity of the droplet (J·kg−1·K−1) |
| X | Solid-liquid two-phase zone width (mm) |
| G | Liquid temperature gradient (K·mm−1) |
| d | Secondary dendrite spacing (mm) |
References
- Anon, J. High quality billets by electroslag rapid remelting. Steel Times Int. 1997, 21, 20–25. [Google Scholar]
- Wang, F.; Li, B.K. Electromagnetic field and joule heating of an electroslag remelting process with two series-connected electrodes. J. Northeast. Univ. 2011, 32, 533–536. [Google Scholar]
- Li, B.K.; Wang, B.; Tsukihashi, F. Modeling of electromagnetic field and liquid metal pool shape in an electroslag remelting process with two series-connected electrodes. Metall. Mater. Trans. B 2014, 45, 1122–1132. [Google Scholar] [CrossRef]
- Kelkar, K.; Patankar, S.; Mitchell, A. Computational Modeling of the Electroslag Remelting Process Used for the Production of Ingots of High-Performance Alloys. In Proceedings of the 2013 International Symposium on Liquid Metal Processing and Casting, Austin, TX, USA, 22–25 September 2013; Springer: Cham, Germany. [Google Scholar]
- Weber, V.; Jardy, A.; Dussoubs, B.; Ablitzer, D. A Comprehensive model of the electroslag remelting process: Description and validation. Metall. Mater. Trans. B 2009, 40, 271–280. [Google Scholar] [CrossRef]
- Li, B.K.; Wang, F.; Tsukihashi, F. Current, magnetic field and joule heating in electroslag remelting processes. ISIJ Int. 2012, 52, 1289–1295. [Google Scholar] [CrossRef]
- Rückert, A.; Pfeifer, H. Mathematical modelling of the flow field, temperature distribution, melting and solidification in the electroslag remelting process. Magnetohydrodynamics 2009, 45, 527–533. [Google Scholar] [CrossRef]
- Li, B.K.; Li, R.; Wang, B. Formation and Drop of Metal Droplets in Slag Bath of Electroslag Remelting Processes, 2nd ed.; Materials Processing Fundamentals: Cham, Germany, 2013; pp. 121–127. [Google Scholar]
- Giesselmann, N.; Rückert, A.; Eickhoff, M. Coupling of multiple numerical models to simulate electroslag remelting process for alloy 718. ISIJ Int. 2015, 55, 1408–1415. [Google Scholar] [CrossRef][Green Version]
- Liu, S.; Zhu, H.E.; Cai, H.U. Numerical simulation of the formation and the dripping of droplet in the electroslag remelting process. Therm. Sci. 2017, 14, 78–82. [Google Scholar] [CrossRef]
- Dong, Y.W.; Jiang, Z.H.; Li, Z.B. Mathematical model for electroslag remelting process. J. Iron Steel Res. Int. 2007, 14, 7–12. [Google Scholar] [CrossRef]
- Dilawari, A.; Szekely, J. A mathematical model of slag and metal flow in the ESR process. Metall. Mater. Trans. B 1977, 8, 227–236. [Google Scholar] [CrossRef]
- Yanke, J.; Fezi, K.; Trice, R. Simulation of slag-skin formation in electroslag remelting using a volume-of-fluid method. Numer. Heat Transf. Part A 2015, 67, 268–292. [Google Scholar] [CrossRef]
- Patel, A.D. Effect of Electrode Pipe and Mold Current on Electromagnetic Fields in ESR. In Proceedings of the International Symposium on Liquid Metal Processing and Casting LMPC, Nancy, France, 2–5 September 2007. [Google Scholar]
- Li, B.K.; Wang, Q. Theory and Technology of Electroslag Remelting Based on Numerical Simulation; Science Press: Beijing, China, 2016; pp. 30–32. [Google Scholar]
- Bahrami, A.; Valentine, D.T.; Helenbrook, B.T. Study of mass transport in autogenous GTA welding of dissimilar metals. Int. J. Heat Mass Transf. 2015, 85, 41–53. [Google Scholar] [CrossRef]
- Yanke, J.; Krane, M. A Parametric Study of Slag Skin Formation in Electroslag Remelting. In Proceedings of the 2013 International Symposium on Liquid Metal Processing and Casting, Austin, TX, USA, 22–25 September 2013; Springer: Cham, Germany. [Google Scholar]
- Hernandez-Morales, B.; Mitchell, A. Review of mathematical models of fluid flow, heat transfer, and mass transfer in electroslag remelting process. Ironmak. Steelmak. 1999, 26, 423–438. [Google Scholar] [CrossRef]
- Kharicha, A.; Schützenhöfer, W. Influence of the slag/pool interface on the solidification in an electro-slag remelting process. Mat. Sci. Forum 2010, 12, 229–236. [Google Scholar] [CrossRef]
- Kharicha, A.; Schützenhöfer, W. On the importance of electric currents flowing directly into the mould during an ESR process. Steel Res. Int. 2008, 79, 632–636. [Google Scholar] [CrossRef]
- Nastac, L.; Sundarraj, S. The stochastic modeling of solidification structures in alloy 718 remelt ingots. JOM 1998, 50, 30–35. [Google Scholar] [CrossRef]
- Sheng, Y.Y. Transport phenomena in electric smelting of nickel matte: Part II. Mathematical modeling. Metall. Trans. B 1998, 29, 85–94. [Google Scholar] [CrossRef]
- Campbell, J. Fluid flow and droplet formation in the electroslag remelting process. JOM 1970, 22, 23–35. [Google Scholar] [CrossRef]
- Jiang, Z.H. Electroslag Metallurgy, 1st ed.; Science Press: Beijing, China, 2015; p. 387. [Google Scholar]
- Dilawari, A.H.; Szekely, J. Heat transfer and fluid flow phenomena in electroslag refining. Metall. Mater. Trans. B 1978, 9, 77–87. [Google Scholar] [CrossRef]
- Wang, X.; Li, Y. A comprehensive 3D mathematical model of the electroslag remelting process. Metall. Mater. Trans. B 2015, 46, 1837–1849. [Google Scholar] [CrossRef]
- Hu, S.; Kinter, R. The fall of single liquid drops through water. AIChE J. 1955, 1, 42–48. [Google Scholar] [CrossRef]
- Choudhary, M.; Szekely, J. Modelling of fluid flow and heat transfer in industrial-scale ESR system. Ironmak. Steelmak. 1981, 8, 225–232. [Google Scholar]
- Li, Z.B. Electroslag Metallurgy Theory and Practice, 1st ed.; Metallurgical Industry Press: Beijing, China, 2011; p. 32. [Google Scholar]
- Tong, W.J.; Li, W.M.; Zang, X.M. Droplet formation and dripping behavior during the electroslag remelting process with two series-connected electrodes. Metals 2020, 10, 386. [Google Scholar] [CrossRef]
- Li, W.M.; Jiang, Z.H. Carbide segregation control in electro-slag remelting withdrawal process of large cross-section high-speed steels. J. Cent. South Univ. 2017, 17, 15–21. [Google Scholar]
- Flemings, M. Solidification processing. Metall. Mater. Trans. B 1974, 5, 2121–2134. [Google Scholar] [CrossRef]


© 2020 by the authors. Licensee MDPI, Basel, Switzerland. This article is an open access article distributed under the terms and conditions of the Creative Commons Attribution (CC BY) license (http://creativecommons.org/licenses/by/4.0/).