Article

Numerical Simulation on Saffman Force Controlled Inclusions Removal during the ESR Process

State Key Laboratory of Advanced Special Steels, Shanghai University, Shanghai 200072, China
*
Authors to whom correspondence should be addressed.
Metals 2020, 10(5), 647; https://doi.org/10.3390/met10050647
Submission received: 7 April 2020 / Revised: 13 May 2020 / Accepted: 15 May 2020 / Published: 17 May 2020

Abstract

:
Electroslag remelting (ESR) is an effective method for removing nonmetallic inclusions from steels or alloys. The main stage of inclusion removal during ESR is the aggregation of liquid metal film (LMF) to form droplets at the consumable electrode tip. In this study, a lab-level ESR experiment was carried out. The number and size of inclusions at the characteristic position of the electrode were quantitatively counted. The number of inclusions in the center position of LMF were larger than that in other regions. To elucidate these phenomena, a two-dimensional mathematical model was established to study the migration of inclusions in LMF. The results indicate that due to the large velocity gradient in LMF, the Saffman force is strong enough to offset the buoyant force and drag the inclusions toward the slag/LMF interface (SFI), where the inclusions will be dissolved in the SFI region by the molten slag. This study demonstrates that the Saffman force plays a key role in the removal of nonmetallic inclusions in LMF during the ESR process.

1. Introduction

Electroslag remelting (ESR) processes have been widely employed to produce high-quality alloys and steels because they can improve the purity and structural quality of ingots [1,2,3,4,5,6]. The number, size, and distribution of nonmetallic inclusions are significant indicators of the purity of steels and alloys. To meet the higher demands for cleaner and higher-quality steels and alloys, the ESR process has become an essential technology to remove impurities and nonmetallic inclusions.
It is well known that the inclusions will be driven to the interface of the liquid slag and liquid melt for the dynamic forces first, and then absorbed by the liquid slag for the chemical reaction. Li et al. [7,8] reported three stages of inclusion removal in the ESR process: aggregation of the LMF to form droplets at the electrode tip as the first stage; droplets falling through the slag as the second stage; and the interaction between the liquid slag and the molten steel as the third stage. They experimented with radioisotopes in the ESR process and came to the conclusion that the main stage of inclusion removal is the aggregation of LMF to form droplets at the consumable electrode tip. The removal rate of this first stage can reach 53%. Many studies [9,10] indicate that, for the last two stages, the inclusions will be affected by seven forces: gravity force, buoyancy force, drag force, added mass force, Saffman force, electromagnetic pressure force, and rebound force. However, for the first stage, the physical dynamic mechanism is still unclear, particularly which forces dominate this process and how the inclusions migrate to the LMF, and need to be further investigated.
Li [11] concluded that the inclusion that moved to the slag/LMF interface (SFI) was mainly attributed to the diffusion process assisted by a mathematical model. However, for a solid particle, diffusion theory is illogical. Afterward, Fu et al. [12] proposed that the surface update caused by liquid flow in LMF is the main reason for the inclusion migrating to the SFI. This reminds us that melt flow is of benefit to the removal of nonmetallic inclusions in the liquid metal film (LMF). Only the driving forces need to be further studied. Wang et al. [9] established a transient three-dimensional (3D) comprehensive mathematical model which studied the movement of the inclusion in a formed droplet at the tip of the electrode. However, force analysis of inclusions in LMF has been neglected. Obviously, all the above studies ignored that the dynamic mechanism of nonmetallic inclusions moved to the SFI before the formation of liquid droplet/droplets in the LMF. At the end of the electrode, the interface update takes place mainly in the LMF due to its small size and high velocity of melt flow. For an aggregated liquid droplet, the situation is right contrary. Thus, inclusion removal mainly happens in the LMF, rather than liquid droplets. Therefore, the present paper mainly focused on the first stage of inclusion removal during the ESR process.
A schematic diagram of the forces on the inclusions is shown in Figure 1. An inclusion in a flow field with a melt velocity gradient will be subjected to a drag force (FD), which is parallel to the direction of the fluid flow. The Saffman force (FS), defined by P.G. Saffman [13], which is perpendicular to the flow direction, causes the inclusion to move toward the region with a larger melt velocity. The main principle is that in a melt velocity gradient flow field, the higher the flow melt velocity, the lower the pressure. In contrast, when the flow melt velocity is low, the pressure will be high. The Saffman force is generated by this type of pressure difference and moves the inclusions perpendicular to the flow field direction. As a result, the Saffman force is opposite to the buoyancy force and leads to the downward movement of inclusions in the LMF during the ESR process.
In previous studies, Lei et al. [14] focused on inclusion collision growth in a continuous caster. A mathematical model and the related source code were developed to trace inclusion movement and collision growth in an inclusion cloud. The results showed that the Saffman lift force can be ignored because it is two orders less than the other forces. Enif Gutiérrez et al. [15] studied the effects of inertial, gravitational, buoyant, pressure gradient, and Saffman forces on deposited inclusion trajectories in a typical adhesion zone inside an upper tundish nozzle (UTN) during the continuous casting of steel. The results indicated that the Saffman force had an important effect on the deposited inclusions in the highest deposition zone. Huang et al. [10] numerically tracked inclusions with different sizes and densities during the ESR process, and the inclusions distributed in the melt were acted upon by a number of forces including the Saffman force. The above studies indicate that the Saffman force should be considered when a large velocity gradient exists in the melt.
The present work studied the migration behavior of the nonmetallic inclusions in the LMF at the electrode tip during the ESR process. An ESR experiment was carried out to investigate the number and size of the inclusions in the LMF. Moreover, the present work built a transient 2D numerical model to investigate the influence of the Saffman force on the migration behavior of the nonmetallic inclusion, which can benefit the understanding of the mechanism of inclusion removal in a LMF during the ESR process.

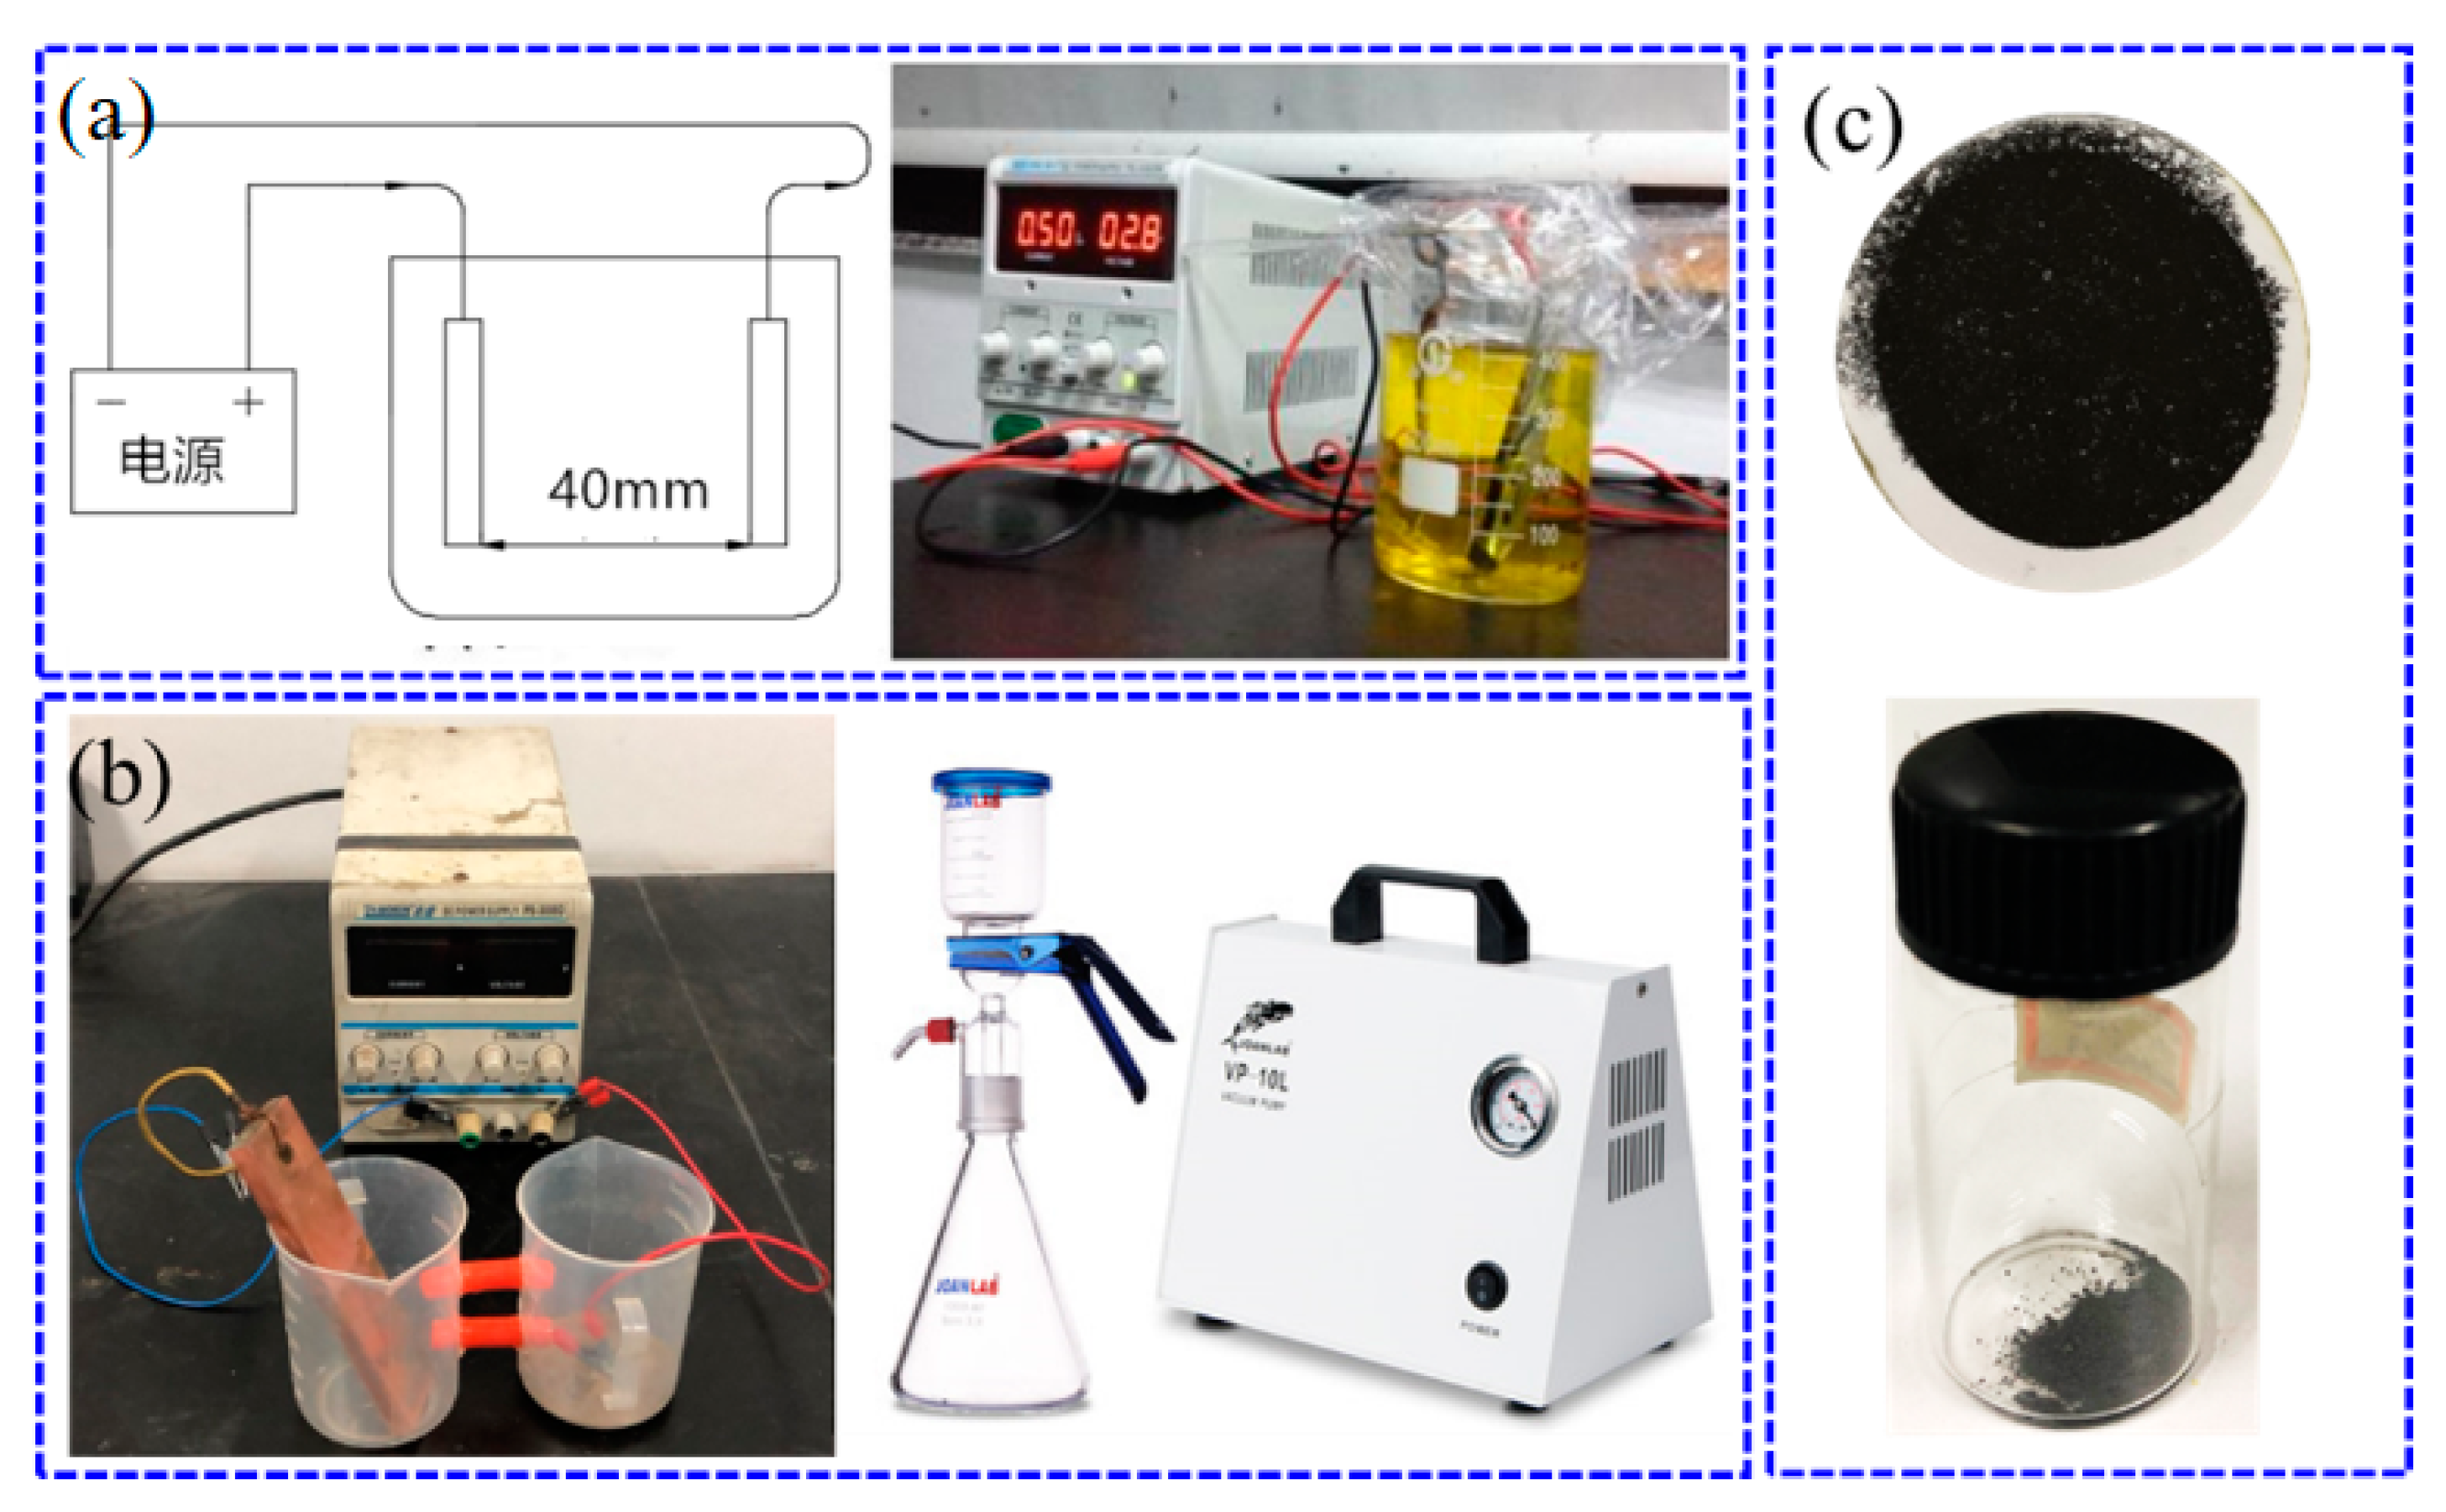
2. Experimental Details

An ESR experiment was performed under an open-air atmosphere. The inner diameter and height were 100 mm and 200 mm, respectively. The consumable electrode was GCr15 steel with a diameter of 60 mm. A 60%CaF2–20%CaO–20%Al2O3 mixture was chosen as the protecting slag. Single-phase alternating currents (50 Hz) were used in the ESR process. The melting current was 1500 A. At the end of the ESR, the consumable electrode was quickly lifted from the slag pool and then air cooled from approximately 1500 °C to room temperature. A sample 100 mm in length was cut from the tip of the consumable electrode using a wire-electrode cutter (New Spark Machine Tool Inc., Suzhou, China), then, it was cut equally into two parts along the longitudinal centerline of the electrode. Finally, the sample was ground, polished, and finally etched at 75 °C in a picric acid solution for metallographic observation using a Keyence VW-9000 optical microscopy (KEYENCE Inc., Osaka, Japan).
The number and size of the inclusions in the electrode were examined using an automatic scanning electron microscope (FEI Aspex Explorer)(FEI Company, Hillsboro, OR, USA). Twenty-one squares were chosen at a certain area in the consumable electrode. The square size and the distance between two adjacent squares are shown in Figure 2. In Figure 2a, every seven squares equaled one set such as A-1, A-2, A-3 A-4, A-5, A-6, and A-7 belonged to Set-A. The inclusions examined in A-5~7, B-5~7, and C-5~7 were considered the same as those in the mother consumable electrode. A-1, B-1, and C-1 were considered as in the LMF. A-2, A-3, A-4, B-2, B-3, B-4, C-2, C-3, and C-4 were the mushy zones. The minimum examined area of ASPEX was 0.4 mm × 0.4 mm. Figure 2b shows the minimum examined area at the interface of the mushy zone and LMF.
Figure 3a shows the principle of non-aqueous electrolysis. Figure 3b indicates the device of non-aqueous solution electrolysis and extraction in the experiment. The cathode and anode poles were placed in two plastic beakers that were connected with rubber tubes, thus the electrolysis process could proceed normally. It could also separate the cathode product and the anode product (non-metallic inclusions). The electrolytic solution used in the experiment was 2% TEA [1% (m/V) tetramethylammonium chloride + 2% (V/V) triethanolamine + methanol], and the cathode and anode were connected to the copper plate and steel sample, respectively. The value of the DC current for electrolysis was 0.02 A. After electrolysis, the anode electrolysis products were collected. Then, the pure non-metallic inclusion powder was obtained using the extraction device on a filter paper. The pure non-metallic inclusion powder was ultimately collected in the sample tank, as shown in Figure 3c.

3. Mathematical Model

3.1. Basic Assumptions

To investigate the influence of the Saffman force on the migration behavior of nonmetallic inclusions in the LMF, a mathematical model was described based on the following assumptions:
(1)
The ESR process reaches a stable state, and the terminal of the consumable electrode is planar. Thus, the top metal/LMF interface (MLI) is an unmelted planar electrode wall, and the SFI is a planar interface. The thickness of the LMF was approximately 300 μm [16,17].
(2)
The melt in the LMF is an incompressible Newtonian fluid. The physical properties of the material used in the simulations were all isotropic and remained constant.
(3)
The melt velocity gradient remained stable in the LMF, and the migration of inclusion had no effect on the flow field.
(4)
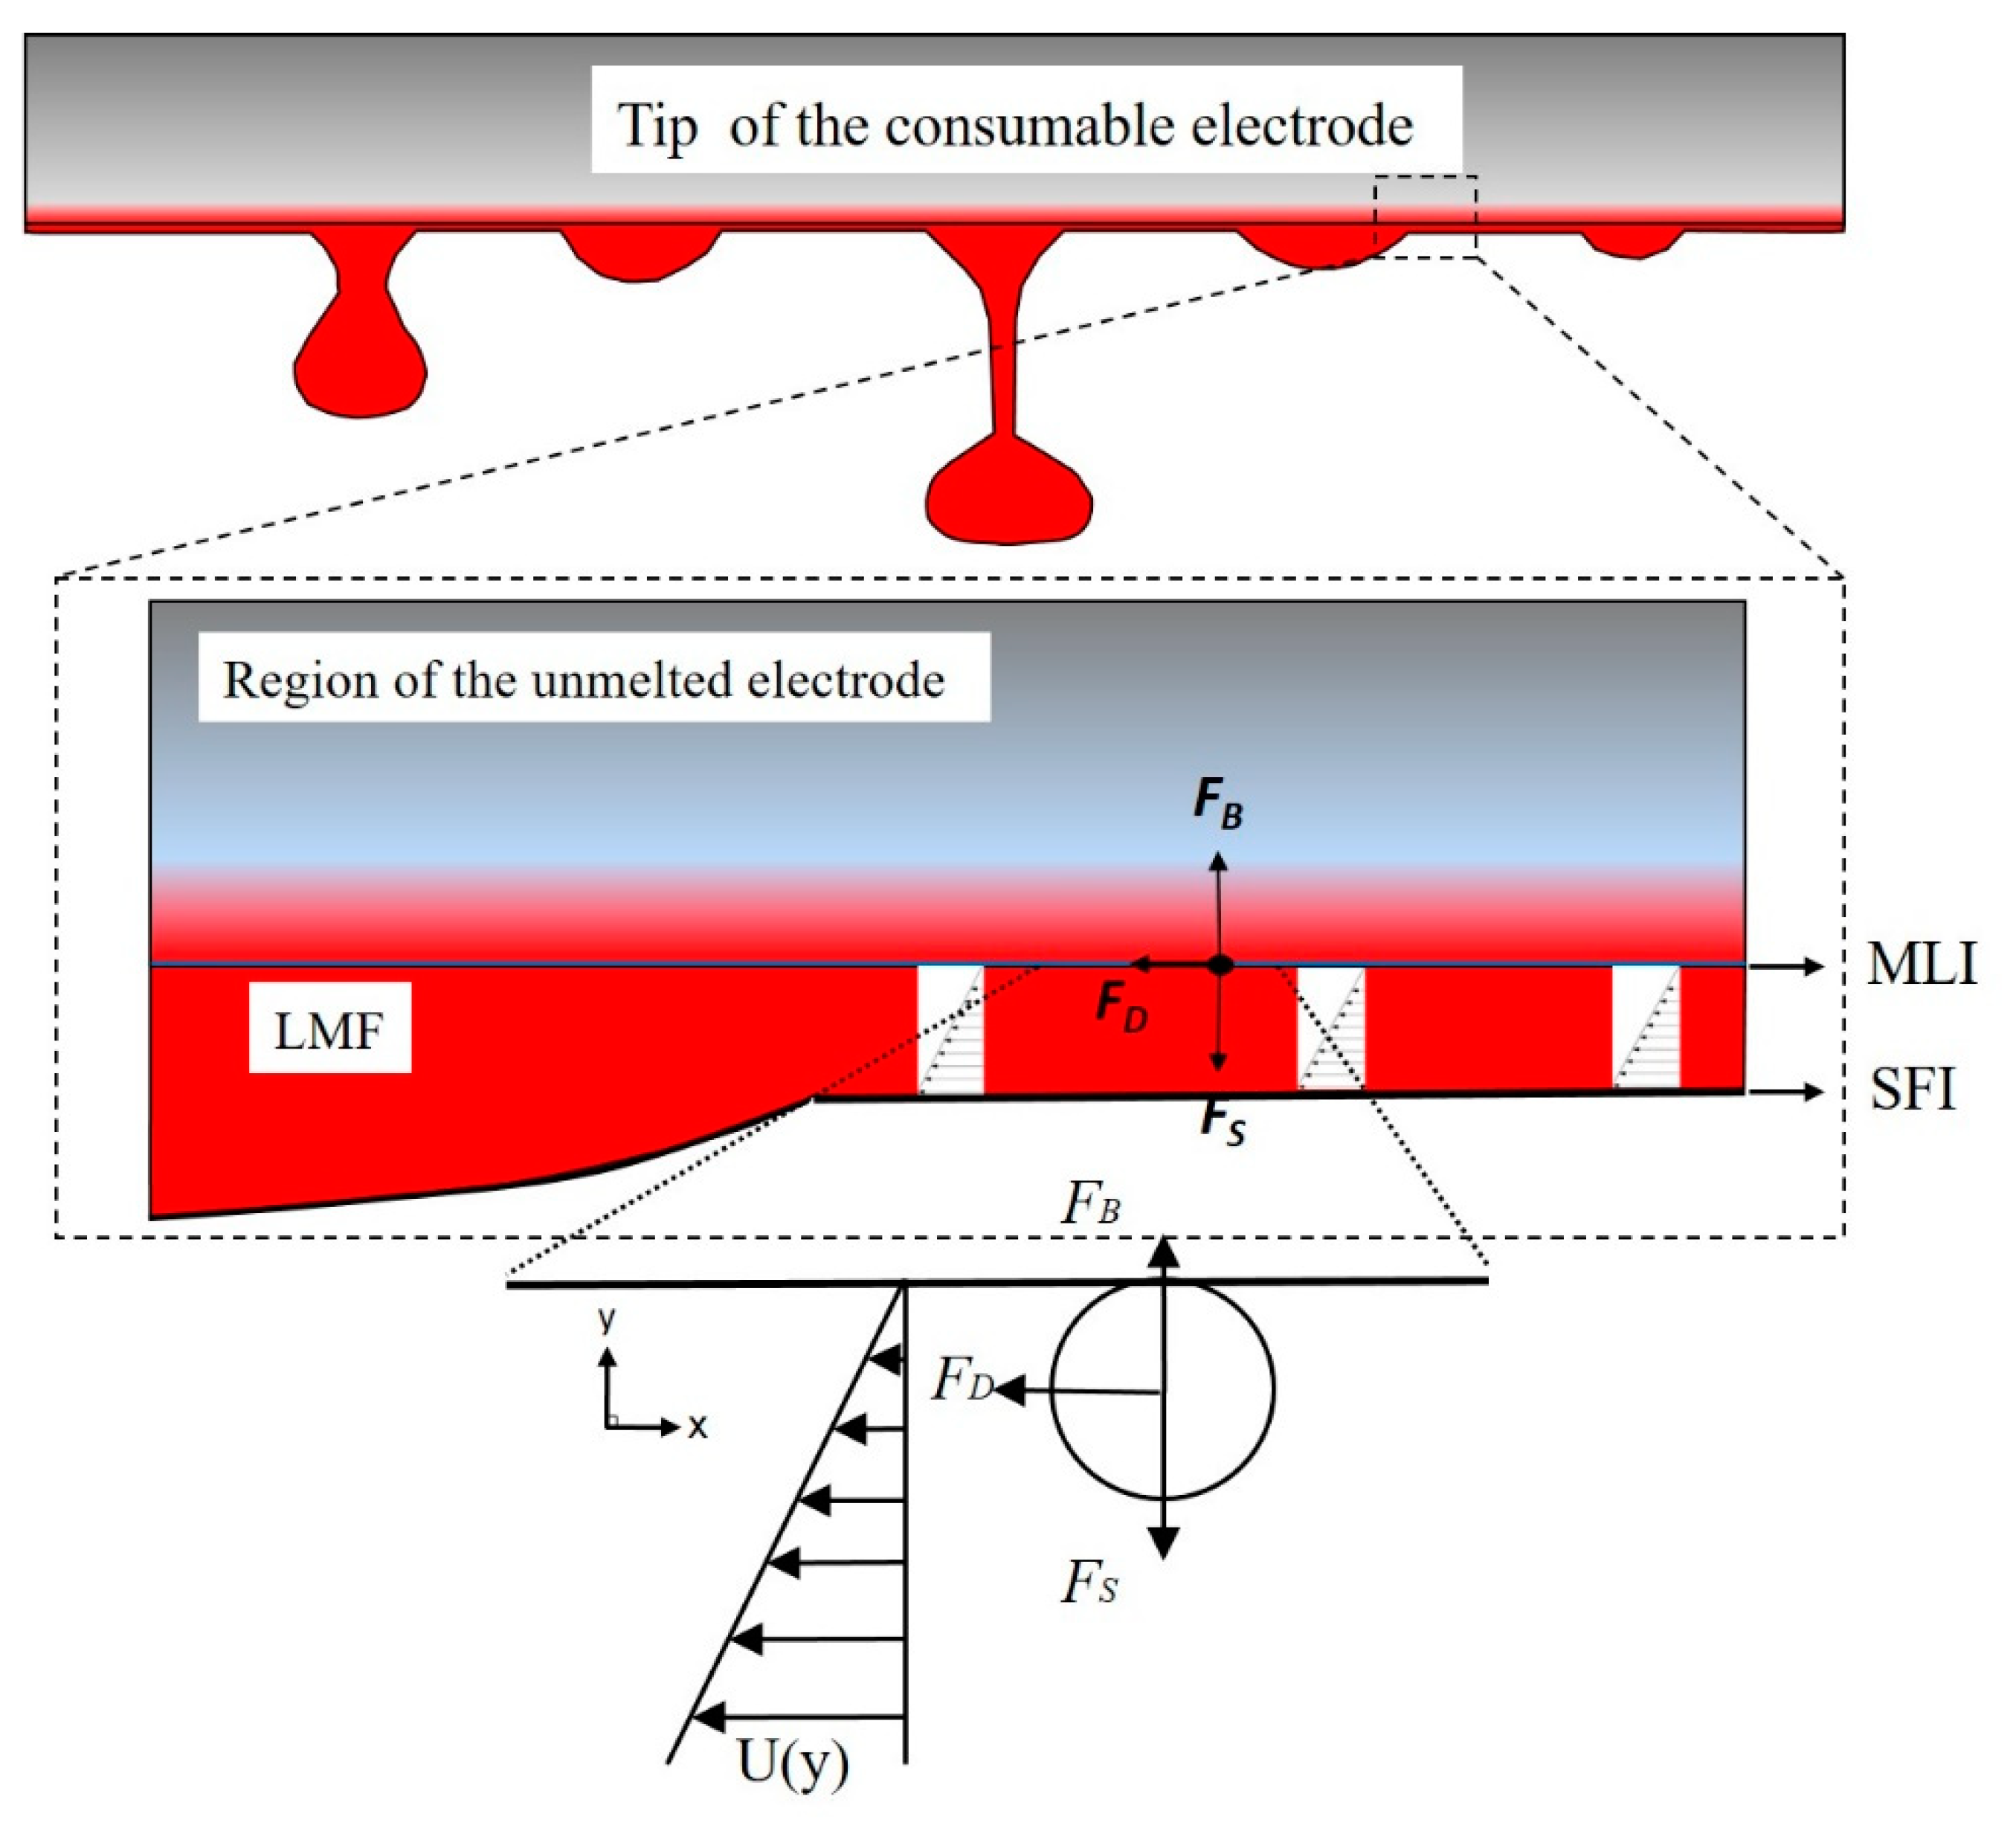
From the experiment, the morphology of the inclusions obtained was mostly spherical oxide with high-melting. Therefore, the inclusions were simplified to be rigid spheres in the simulation. The forces acting on the inclusions were the drag force, the buoyancy force, and the Saffman force; other forces were ignored.

3.2. Geometric Model

The geometric model was established according to the real tip of a GCr15 steel electrode, which is shown in Figure 4. In Figure 4a, there are three regions at the tip of the electrode: the unmelted tip of the consumable electrode, the mushy zone and the LMF. The enlarged microstructure at the interface of the LMF and mushy zone is shown in Figure 4b. The thickness of the LMF can also be seen in this figure. A liquid region 12 mm in length and 300 μm in thickness in the LMF was used as a geometric model in Figure 4c. In the marked LMF, the liquid metal usually flows from the right side to the left side and gathers to form a liquid bulge. Thus, the initial release position of the inclusion was set in the top right corner of the liquid region.

3.3. Fluid Flow

Continuity and time-averaged Navier–Stokes equations are used to describe the motion of the liquid metal:
ρ   τ + · ( ρ v ) = 0
( ρ v ) τ + · ( ρ v × v ) = p + · [ μ e f f ( v + v T ) ] + ρ g
where ρ is the density of the fluid; v is the velocity vector; p is the pressure difference; μ e f f is the effective viscosity of the fluid; and g is the gravitational acceleration.
The Reynold number of the fluid in the LMF is calculated as:
Re = ρ v L μ
where L is the characteristic size in the flow, and μ denotes the dynamic viscosity. Based on previous research [18], the density of the LMF was set at 6850 kg/m3. The melt velocity of the SFI was assumed to be 0.1 m/s. The thickness of the LMF, which was 300 μm, was set as a characteristic size. The dynamic viscosity of the fluid in the LMF was 0.0061 Pa · s. Thus, based on Equation (3), the Reynold number was calculated to be approximately 33.69. This indicates that the flow field in the LMF is a laminar flow.
The main boundary conditions for calculating the fluid flow field in the LMF are listed as follows:
(1)
It is a no-slip boundary condition at the MLI.
(2)
The flow melt velocity directs to the left side at the SFI.
(3)
The left wall of the LMF is a zero-pressure exit boundary condition.
(4)
The right wall of the LMF is an inlet boundary condition.
The left wall of the LMF is a zero-pressure exit boundary condition. The center point of the inclusion is captured by the left wall when it collides and is fixed on the boundary.
p0 = 0
where p0 is the pressure of the left wall.
The right wall of the LMF is an inlet boundary condition. The left wall is an outlet boundary condition. Therefore, the horizontal melt velocity of the SFI is set as VSFI m/s from right to left. As the top wall is a consumable electrode, the melt velocity of this region is zero. This indicates that there is a melt velocity gradient from the SFI to the MLI in the LMF and decreases from VSFI m/s to zero.
G = VSFI/h0
v f = G ( h 0 y )
where VSFI is the horizontal melt velocity of the SFI; G is the melt velocity gradient of the LMF; h0 is the thickness of the LMF; and v f is the melt velocity of the fluid.

3.4. Forces Acting on a Particle

As the electrode is remelted layer by layer, the inclusions enter into the LMF and are affected by various forces including the Saffman force, buoyancy force, pressure gradient force, Magnus force, added mass force, drag force, and so on [13,19,20,21,22,23,24,25,26]. The typical values/levels of these forces are listed in Table 1. The pressure gradient force, Magnus force, and added mass force can be ignored in comparison with the Saffman force and buoyancy force. Moreover, A. Kharicha et al. [27] reported that the melt velocity of the interface between the metal film and the slag could reach 0.24 m/s. Considering that the thickness of the LMF ranges within a hundred microns, the gradation of velocity is sufficiently large. The Saffman force is thus the main factor dominating the migration behavior of inclusions.
The movement of the inclusion is affected by three types of forces: the drag force produced by the flowing LMF, the buoyancy force induced by the density difference, and the Saffman force caused by the melt velocity gradient in the LMF, which can be seen in Figure 1.
The buoyancy force is represented by:
F B = ( ρ ρ p ) g V
where ρ p is the density of the inclusion.
The drag force [28,29] is expressed as:
F D = 18 μ ρ p d p 2 m p ( v f v p )
where F D is the drag force, d p is the diameter, m p is the mass of inclusion, and v p is the velocity of the inclusion.
The Saffman force [13,30] acting on the inclusion is written as:
F s = 1.615 d p 2 ρ μ ( v f , x v p , x ) G
where F s is the Saffman force caused by the melt velocity gradient ; v f , x is the melt velocity of the fluid in the horizontal direction; and v p , x represents the velocity of the inclusion in the horizontal direction.
The magnitude of the Saffman force increases with increasing particle diameter because the Saffman force is proportional to the particle diameter squared. The initial melt velocity of the inclusion was set as zero. When the central point of the inclusion collides with the boundary of the LMF, the inclusion will be captured by the liquid slag pool.

3.5. Solution Procedure

The commercial software COMSOL Multiphysics 5.3 (COMSOL Inc., Stockholm, Sweden) was employed to perform the numerical simulation. The calculation steps of the numerical model are listed as follows: first, LMF with a constant G was established in a solution domain; second, inclusions with different sizes were released at the top right corner of the solution domain; finally, the drag force, the buoyancy force, and the Saffman force were exerted on the inclusion in the LMF to calculate the trajectories of the inclusions. The SIMPLE algorithm was used to calculate the Navier–Stokes equation [31]. All equations were discretized by a second-order upwind scheme for higher accuracy. Before advancing, the iterative procedure continued until all normalized unscaled residuals were less than 10−6. The physical domain was discretized with a triangle mesh. The mesh independence was thoroughly tested. Due to the complexity of the coupling calculation, the time step was kept small to ensure that the above convergence criteria were fulfilled.
The physical parameters used in the numerical simulation are listed in Table 2 [31,32,33,34,35,36].

4. Results and Discussion

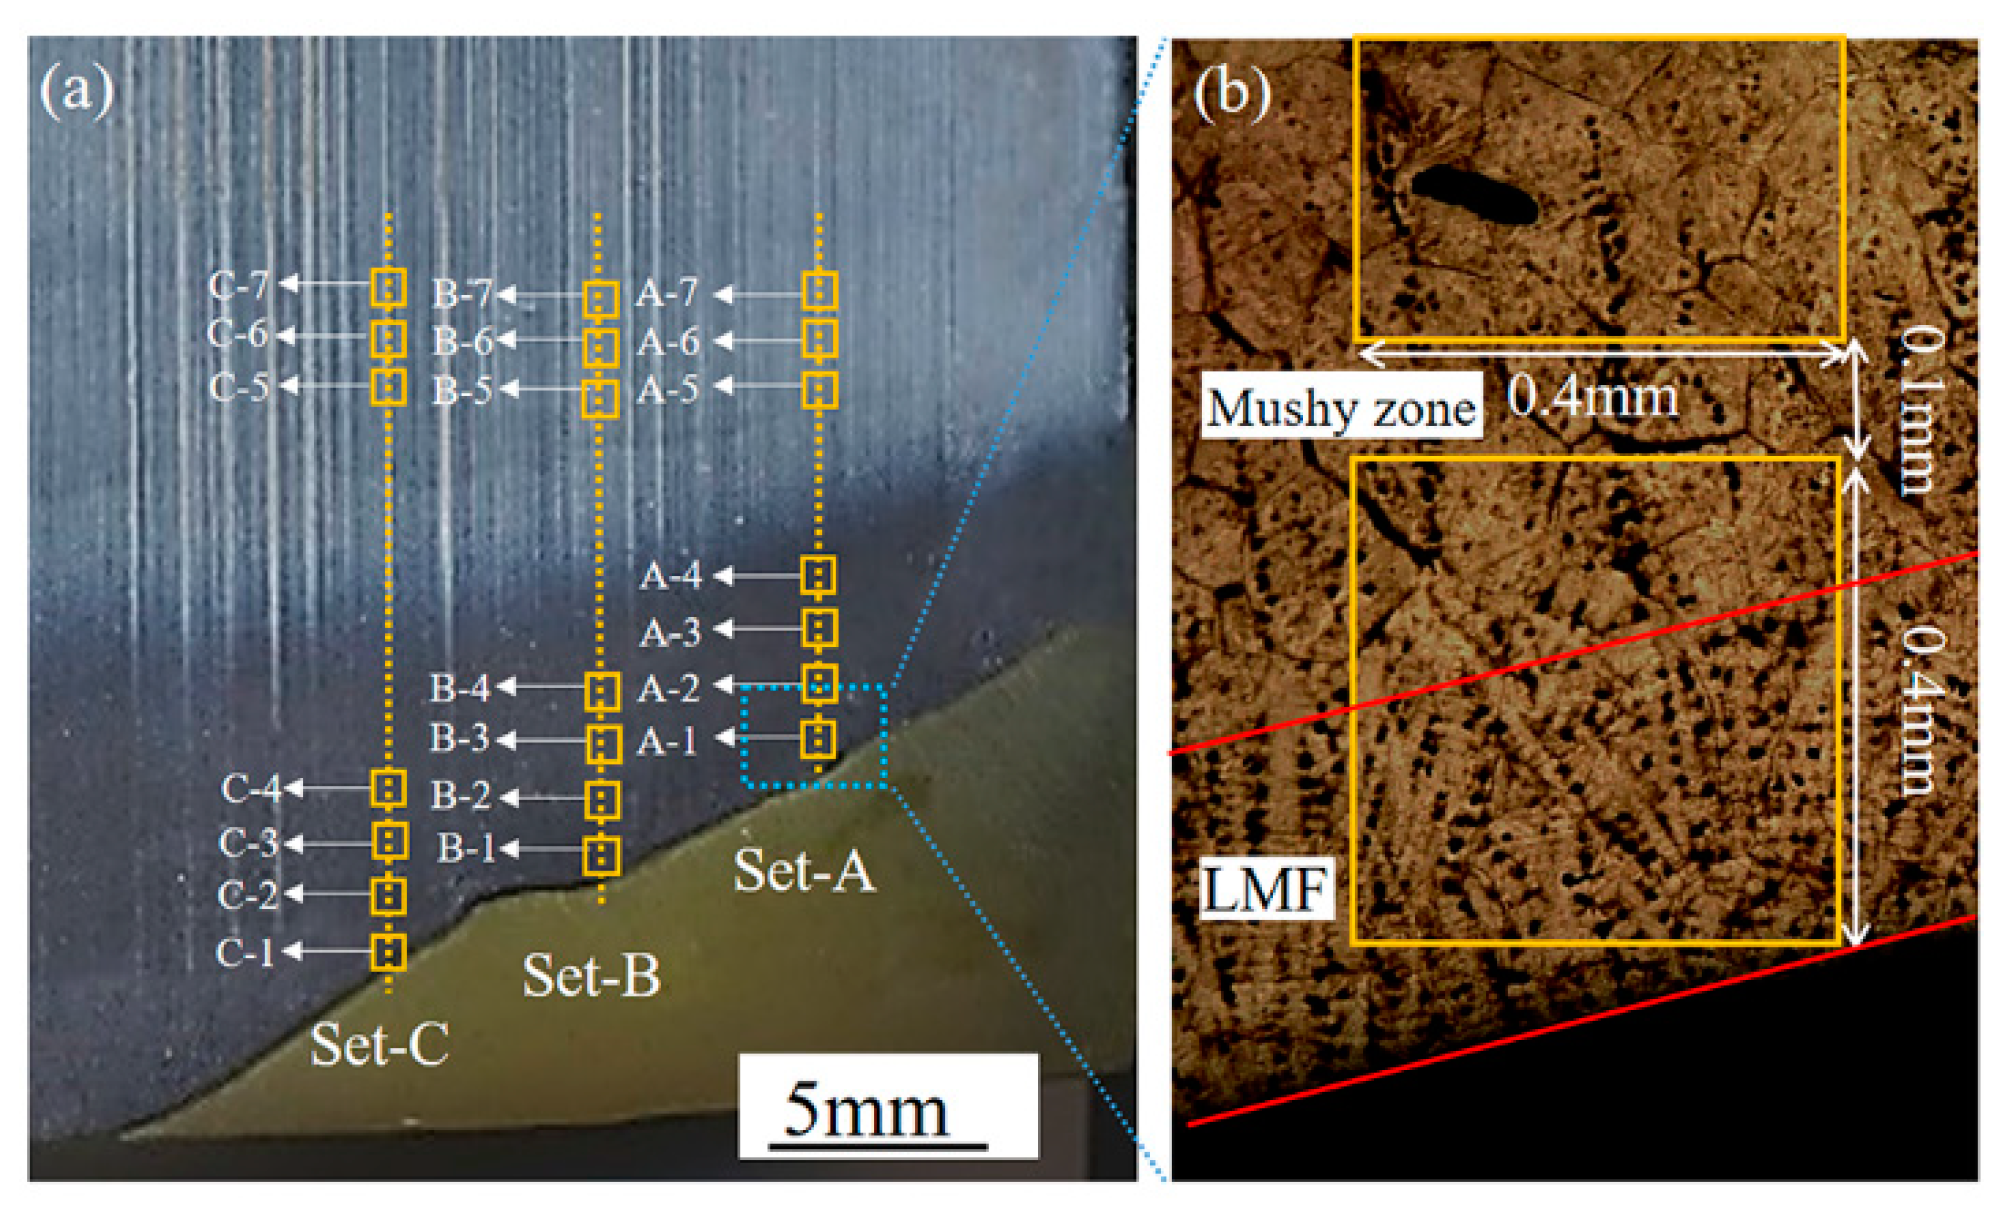
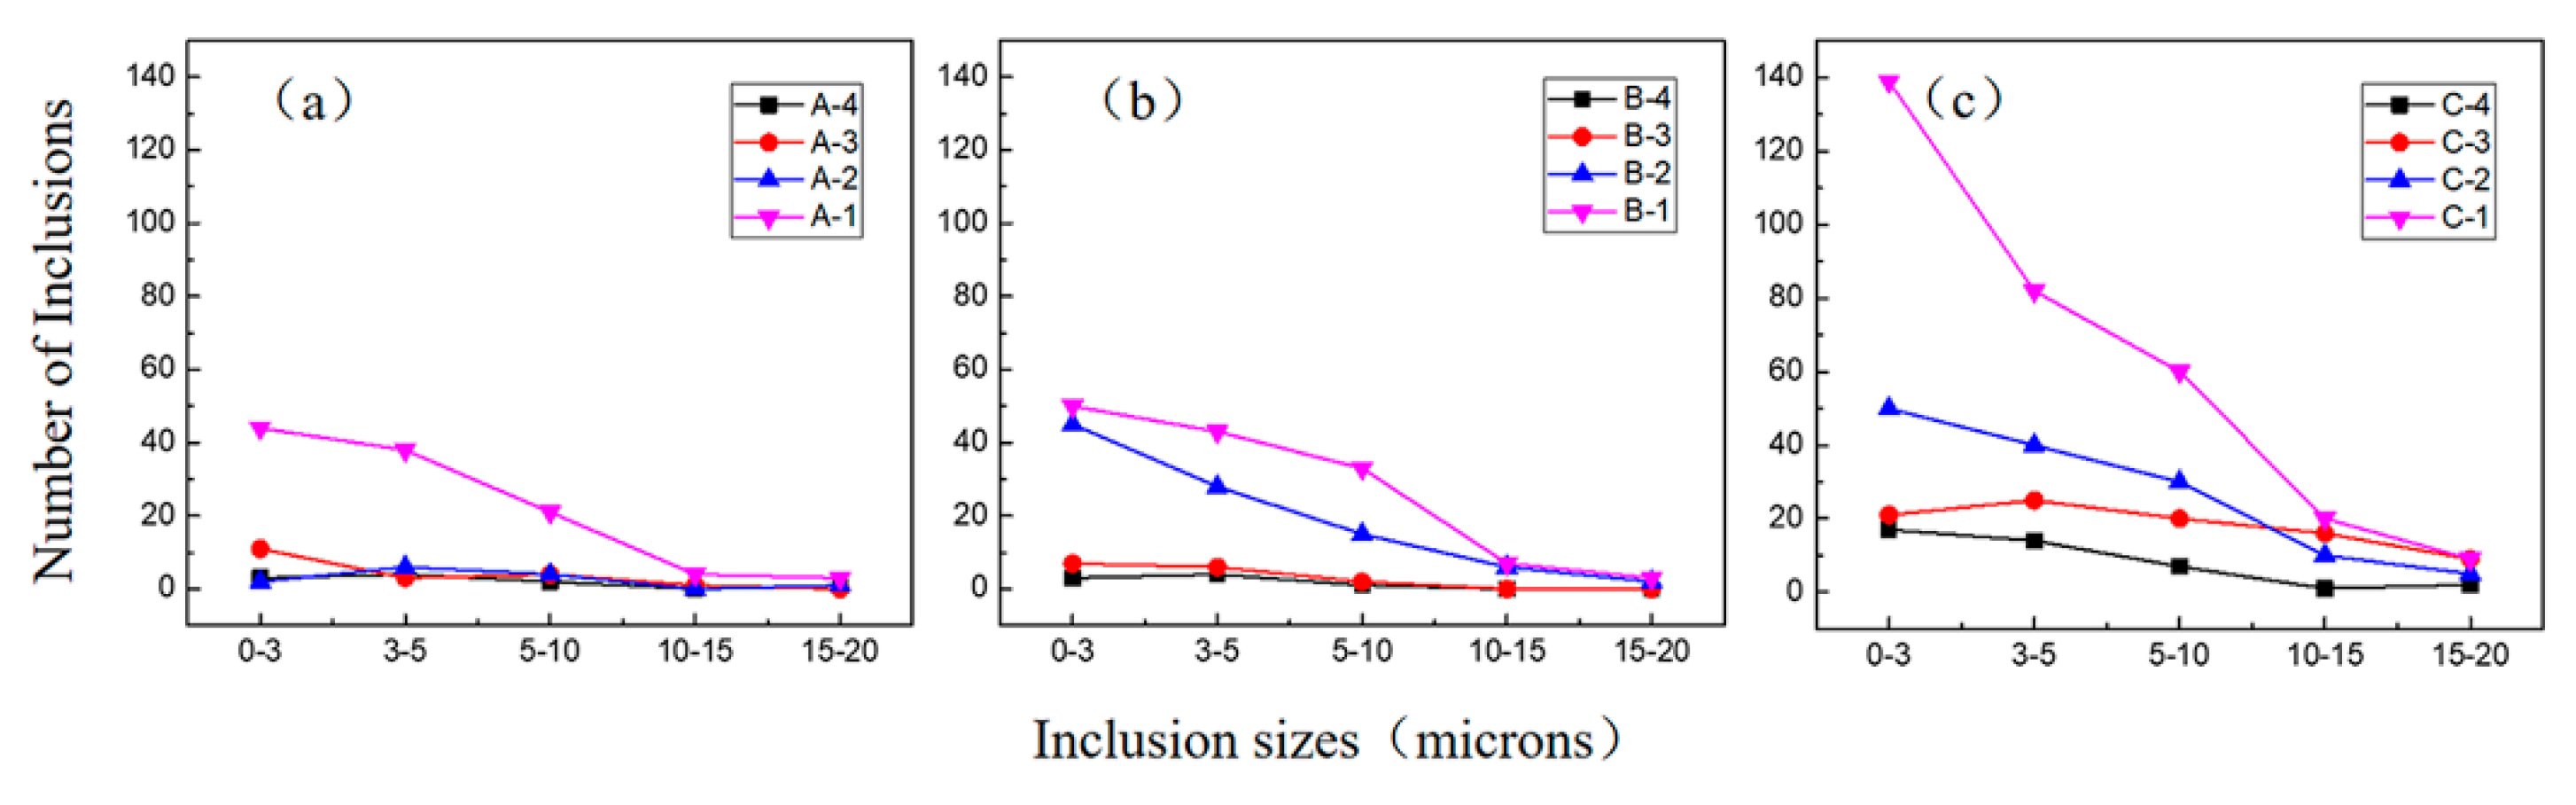
4.1. Experimental Result and Its Analysis

The number of inclusions in the LMF and mushy zone (detected region in Figure 2) is shown in Figure 5a. It is easy to see that ‘Set-C’ had the most inclusions among these three sets. The average number of inclusions in A-5~7, B-5~7, and C-5~7 were 22, 24, and 21 (0.4 mm × 0.4 mm area), respectively, which belong to the mother electrode region and have almost the same number of inclusions, as shown in Figure 5b.
Moreover, the distribution of the sizes of the inclusions in the LMF and mushy zones (detected region in Figure 2) is shown in Figure 6. It was found that 90.6 percent of the inclusions in the LMF were between 0 to 10 μm, only 9.4 percent were larger than 10 μm. The number of inclusions with a size of 0–10 μm in the center region of the LMF was significantly greater than that in the other two regions. From the statistical results in Figure 6, the number and size of the inclusions in ‘C-2, 3, 4’ were not much different from ‘A-2, 3, 4’ and ‘B-2, 3, 4’. However, in ‘C-1’, the number and size of the inclusions were much higher than that in ‘A-1’ and ‘B-1’. It can be deduced that the inclusions in the LMF would migrate from the outer region to the central region, which was also proved by the following simulation results below.
The morphologies of representative inclusions in LMF are shown in Figure 7. The inclusions were spherical, cube, and polygon shape. Furthermore, 80% of the inclusions were spherical oxide with a high-melting point and 20% were irregular in shape. Regarding the inclusions with irregular morphology, the dimensions were replaced by their equivalent spherical diameters (ds = s / π , ds denotes the diameter of irregular morphology; s represents the surface area of irregular morphology). Under this approximation, the sizes of the inclusions were 3 μm, 5 μm, and 20 μm, which was also helpful to the setting of the simulation parameters. Therefore, one of the basic assumptions was that the inclusions were simplified as rigid spheres in simulation.
In order to describe these phenomenon better, more details are discussed in the simulation results below.

4.2. Flow Field

Figure 8 presents the flow pattern in a 300 μm LMF. The horizontal melt velocity of the SFI was set as 0.01 m/s. As the top wall was a consumable electrode, the melt velocity of this region was zero. This indicates that there was a melt velocity gradient from the SFI to the MLI in the LMF that decreased from 0.01 m/s to zero.

4.3. Migration Behavior of Inclusion

Figure 9 and Figure 10 show the results of the migration behavior of inclusions with different sizes when VSFI was 0.01 m/s, 0.05 m/s, 0.10 m/s, and 0.20 m/s. It can be seen that the inclusions in LMF converged toward the center region, which also proved the previous experimental results.
The migration behaviors of inclusions with different sizes are shown in Figure 9a when the melt velocity of SFI (VSFI) was set as 0.01 m/s. The inclusions with sizes from 1 μm to 20 μm stayed at their initial location. The Saffman force generated by the velocity gradient was not enough to overcome the buoyancy of the inclusions themselves. The result is that the inclusions were attached to the tip of the consumable electrode and will stay at their initial location. The ‘Time’ shown in Figure 9a is the time for the inclusion to be captured by the calculation boundary defined in this study.
Furthermore, when the VSFI value increased to 0.05 m/s, it can be seen that the inclusion with a diameter of 1 μm moved from the initial position to the left wall (Figure 9b). The trajectory is basically a horizontal line. This indicates that the Saffman force acting on the inclusion is nearly balanced by its buoyancy force. With the increase in inclusion size, the inclusion moved easily to the bottom. It was found that the inclusion with a diameter of 10 μm was driven from the initial position to the SFI in 0.49 s (Figure 9(b5)), indicating that the size of the inclusion affects its migration behavior.
Additionally, VSFI was set as 0.10 m/s (Figure 10a). With the increasing size of the inclusion from 1 μm to 3 μm, the inclusions moved gradually to the SFI from their initial position to the left wall in the LMF. Moreover, when the size of the inclusion was larger than 5 μm, it was engulfed easily by the liquid slag pool.
Finally, when VSFI was 0.20 m/s (Figure 10b), it was found that the inclusions with different sizes migrated to the left wall or to the liquid slag pool in a shorter time than when VSFI was 0.20 m/s. Although the diameter of inclusion was 3 μm, it could still be driven to the liquid slag pool in 0.25 s. This demonstrates that the faster the melt velocity of the horizontal flow at the SFI, the larger the melt velocity gradient in the LMF. Therefore, the inclusion could move into the liquid slag pool easily. From the above analyses, the velocity gradient in the LMF will generate a Saffman force (big enough), so that the inclusions can overcome the buoyancy and migrate downward to the slag pool (Figure 9 and Figure 10). This is one of the main reasons why the inclusions can overcome the upward buoyancy force and move (downward) to the slag/LMF interface.

4.4. Statistical Analysis of Numerical Simulation Results

Table 3 displays the migration results of the inclusions with different sizes under different velocities of the SFI. According to Equation (9), the faster the melt velocity of the horizontal flow at the SFI, the larger the melt velocity gradient in the LMF. The Saffman force increases with increasing melt velocity gradient and the size of the inclusions. Under such conditions, the inclusion moves easily to the SFI and is then engulfed by the liquid slag pool. In addition, when the melt velocity gradient in the LMF becomes larger, the size effect is another important factor for inclusion removal, as shown in Figure 9. It is worth noting that the inclusion removal efficiency depends on the thickness of the LMF. If the melt velocity at the SFI remains stable, the smaller the thickness of the LMF, the larger the melt velocity gradient that will be achieved. The Saffman force can significantly reduce the number of inclusions with large sizes in the LMF and improve the quality of metallurgical products. From the above analyses, it was found that with the size of inclusions in the LMF increasing, the distance and time required for the inclusions to move to the slag/LMF interface were shorter, which indicated that inclusions with a larger size were easier to remove by ESR. This inference was also confirmed by previous studies such as Wang et al. [9] and Du et al. [37]. The larger the size of the inclusion, the easier it is to migrate to the liquid slag pool. In addition, the theoretical mechanism of the Saffman force in removing inclusions in the LMF during the ESR process provides a reliable theoretical reference for the development of ESR technology.

5. Conclusions

The experiments and numerical simulation results show that the migration behavior of inclusions with different sizes in the LMF at the electrode tip is greatly influenced by the Saffman force. The main conclusions in this study can be summarized as follows:
(1) In the experiment, the number and size of the inclusions in center region in LMF were larger than that in the other regions, which was the effect of aggregation. It was also found that 90.6 percent of the inclusions in the LMF were between 0 to 10 μm, and only 9.4 percent were larger than 10 μm. The results of the experiment and simulation both proved that the inclusions would converge to the center region in the LMF.
(2) The buoyancy of the inclusions in the LMF is greater than its own gravity. Under normal circumstances, the inclusions will float up to the bottom of the consumable electrode (electrode/LMF interface). From the simulation results, the velocity gradient in the LMF will generate a Saffman force (big enough), so that the inclusions can overcome the buoyancy and migrate downward to the slag pool.
(3) In the simulation, it was found that with the increase in the size of the inclusions in the LMF, the distance and time required for the inclusions to move to the slag/LMF interface were shorter. The result demonstrates that the inclusion with a larger size is easier to remove, which is consistent with previous studies.

Author Contributions

Conceptualization, Y.Z. and H.W.; methodology, C.S.; software, C.S.; validation, Q.L., Z.S., H.W., W.R., and Z.L.; formal analysis, C.S.; investigation, C.S.; resources, Y.Z.; data curation, C.S.; writing—original draft preparation, C.S.; writing—review and editing, T.Z. and Y.G.; visualization, Y.Z.; supervision, Y.Z. and Y.G.; project administration, Y.Z.; funding acquisition, Y.Z. All authors have read and agreed to the published version of the manuscript.

Funding

The authors gratefully acknowledge the financial support of the National Key Research and Development Program of China (2016YFB0300401, 2016YFB0301401), the National Natural Science Foundation of China (U1860202, U1732276, 50134010, 51704193), and the Science and Technology Commission of Shanghai Municipality (13JC14025000, 15520711000).

Conflicts of Interest

The authors declare no conflict of interest.

References

  1. Halfa, H. Characterization of electroslag remelted super hard high speed tool steel containing niobium. Steel Res. Int. 2013, 84, 495–510. [Google Scholar] [CrossRef]
  2. Reitz, J.; Wietbrock, B.; Richter, S.; Hoffmann, S.; Hirt, G.; Friedrich, B. Enhanced homogenization strategy by electroslag remelting of high-manganese TRIP and TWIP steels. Adv. Eng. Mater. 2011, 13, 395–399. [Google Scholar] [CrossRef]
  3. Chen, X.C.; Shi, C.B.; Guo, H.J.; Wang, F.; Ren, H.; Feng, D. Investigation of oxide inclusions and primary carbonitrides in inconel 718 superalloy refined through electroslag remelting process. Metall. Mater. Trans. B 2012, 43, 1596–1607. [Google Scholar] [CrossRef]
  4. Wang, H.; Zhong, Y.B.; Li, Q.; Li, W.Q.; Ren, W.L.; Lei, Z.S.; Ren, Z.M.; He, Q. Influences of the transverse static magnetic field on the droplet evolution behaviors during the low frequency electroslag remelting process. ISIJ Int. 2017, 57, 2164–2257. [Google Scholar] [CrossRef] [Green Version]
  5. Wang, H.; Zhong, Y.B.; Li, Q.; Fang, Y.P.; Ren, W.L.; Lei, Z.S.; Ren, Z.M. Visualization study on the droplet evolution behaviors in electroslag remelting process by superimposing a transverse static magnetic field. ISIJ. Int. 2016, 56, 255–263. [Google Scholar] [CrossRef] [Green Version]
  6. Li, Q.; Zhong, Y.B.; Sun, C.X.; Wang, H.; Zheng, T.X.; Ren, W.L.; Ren, Z.M. Effect of transverse static magnetic field on droplets transient and inclusions evolution during the electroslag remelting process of GCr15 ingots. Acta Metall. Sin. 2018, 31, 1311–1316. [Google Scholar] [CrossRef] [Green Version]
  7. Li, Z.B.; Zhou, W.H.; Li, Y.D. Mechanism of removal of non-metallic inclusions in the ESR process. Iron Steel 1980, 15, 20–26. [Google Scholar]
  8. Li, Z.B.; Zhang, J.W.; Che, X.Q. Control of content and composition of nonmetallic inclusion in ESR steel. J. Iron Steel Res. 1997, 9, 7–15. [Google Scholar]
  9. Wang, Q.; Wang, R.T.; He, Z.; Li, G.Q.; Li, B.K.; Li, H.B. Numerical analysis of inclusion motion behavior in electroslag remelting process. Int. J. Heat Mass Tran. 2018, 125, 1333–1344. [Google Scholar] [CrossRef]
  10. Huang, X.C.; Li, B.K.; Liu, Z.Q.; Li, X.L.; Sun, M.J. Numerical investigation and experimental validation of motion and distribution of nonmetallic inclusions in argon protection electroslag remelting process. Metals 2018, 8, 392. [Google Scholar] [CrossRef] [Green Version]
  11. Li, Z.B. Electroslag Metallurgy Theory and Practice; Metallurgical Industry Press: Beijing, China, 2010; pp. 53–54. [Google Scholar]
  12. Fu, J. An investigation of mechanism on the removal of oxide inclusions during ESR process. Acta Metall. Sin. 1979, 15, 526–539. [Google Scholar]
  13. Saffman, P.G. The lift on a small sphere in a slow shear flow. J. Fluid Mech. 1965, 22, 385–400. [Google Scholar] [CrossRef] [Green Version]
  14. Lei, H.; Zhao, Y.; Geng, D.Q. Mathematical model for cluster-inclusion’s collision-growth in inclusion cloud at continuous casting mold. ISIJ Int. 2014, 54, 1629–1637. [Google Scholar] [CrossRef] [Green Version]
  15. Gutiérrez, E.; Garcia-Hernandez, S.; Barreto, J.J. Mathematical analysis of the dynamic effects on the deposition of alumina inclusions inside the upper tundish nozzle. ISIJ Int. 2016, 56, 1394–1403. [Google Scholar] [CrossRef] [Green Version]
  16. Getselev, Z.N. Casting in an electromagnetic field. JOM 1971, 23, 38–39. [Google Scholar] [CrossRef]
  17. Karimi-Sibaki, E.; Kharicha, A.; Bohacek, M.J.; Wu, M.; Ludwig, A. A dynamic mesh-based approach to model melting and shape of an ESR electrode. Metall. Mater. Trans. B 2015, 46, 2049–2061. [Google Scholar] [CrossRef]
  18. Wang, Q.; Li, G.Q.; Gao, Y.; He, Z.; Li, B.K. A coupled mathematical model and experimental validation of oxygen transport behavior in the electro-slag refining process. J. Appl. Electrochem. 2017, 47, 445–456. [Google Scholar] [CrossRef]
  19. Wu, Q.F.; Zhong, Y.B.; Feng, M.L.; Lei, Z.S.; Ren, W.L.; Fan, Y.Y.; Ren, Z.M. The droplet evolution trend and purification efficiency in ESR process by superimposing a static magnetic field. J. Iron Steel Res. Int. 2012, 19, 425–429. [Google Scholar]
  20. Lei, H.; Jin, Y.; Zhu, M. Mathematical modelling of particle movement ahead of the solid-liquid interface in continuous casting. J. Mater. Sci. Technol. 2002, 18, 403–406. [Google Scholar]
  21. Ho, B.P.; Leal, L.G. Inertial migration of rigid spheres in two-dimensional unidirectional flows. J. Fluid Mech. 1974, 65, 365–400. [Google Scholar] [CrossRef]
  22. Wang, H.; Zhong, Y.B.; Li, Q.; Fang, Y.P.; Ren, W.L.; Lei, Z.S.; Ren, Z.M. Effect of current frequency on droplet evolution during magnetic-field-controlled electroslag remelting process via visualization method. Metall. Mater. Trans. B. 2017, 48, 655–663. [Google Scholar] [CrossRef]
  23. Shkin, A. Forces of a single-beam gradient laser trap on a dielectric sphere in the ray optics regime. Biophys. J. 1992, 61, 569–582. [Google Scholar] [CrossRef] [Green Version]
  24. Breault, R.W.; Rowan, S.L.; Monazam, E.; Stewart, K.T. Lateral particle size segregation in a riser under core annular flow conditions due to the Saffman lift force. Powder Technol. 2016, 299, 119–126. [Google Scholar] [CrossRef] [Green Version]
  25. Liu, L.G.; Sun, M. The added mass forces in insect flapping wings. J. Theor. Biol. 2018, 437, 45–50. [Google Scholar] [CrossRef]
  26. Murakata, Y.; Sung, M.G.; Sassa, K.; Asai, S. Visualization of collision behavior of particles simulating inclusions in a turbulent molten steel flow and its theoreticalanalysis. ISIJ Int. 2007, 47, 633–637. [Google Scholar] [CrossRef] [Green Version]
  27. Kharicha, A.; Ludwig, A.; Wu, M. 3D simulation of the melting during an electro-slag remelting process. LMPC 2011, 27, 41–48. [Google Scholar]
  28. Zhang, L.F.; Aoki, J.; Thomas, B.G. Inclusion removal by bubble flotation in a continuous casting mold. Metall. Mater. Trans. B 2006, 37, 361–379. [Google Scholar] [CrossRef]
  29. Song, X.P.; Cheng, S.S.; Cheng, Z.J. Numerical Computation for Metallurgical Behavior of Primary Inclusion in Compact Strip Production Mold. ISIJ Int. 2012, 52, 1824–1831. [Google Scholar] [CrossRef] [Green Version]
  30. Long, M.J.; Zuo, X.J.; Zhang, L.F.; Chen, D.F. Kinetic Modeling on Nozzle Clogging During Steel Billet Continuous Casting. ISIJ Int. 2010, 50, 712–720. [Google Scholar] [CrossRef] [Green Version]
  31. Kharicha, A.; Karimi-Sibaki, E.; Bohacek, J.; Wu, M.; Ludwig, A. Transient melting of an ESR electrode. LMPC 2016, 143, 1–8. [Google Scholar] [CrossRef]
  32. Huang, X.C.; Li, B.K.; Liu, Z.Q. Three-dimensional mathematical model of oxygen transport behavior in electroslag remelting process. Metall. Mater. Trans. B 2018, 49, 709–722. [Google Scholar] [CrossRef]
  33. Wang, Q.; Li, G.Q.; He, Z.; Li, B.K. A three-phase comprehensive mathematical model of desulfurization in electroslag remelting process. Appl. Therm. Eng. 2017, 114, 874–886. [Google Scholar] [CrossRef]
  34. Dong, Y.W.; Jiang, Z.H.; Cao, Y.L.; Yu, A.; Hou, D. Effect of slag on inclusions during electroslag remelting process of die steel. Metall. Mater. Trans. B 2014, 45, 1315–1324. [Google Scholar] [CrossRef]
  35. Kharicha, A.; Karimi-Sibaki, E.; Wu, M.H.; Ludwig, A. Review on Modeling and Simulation of Electroslag Remelting. Steel Res. Int. 2018, 89, S1. [Google Scholar] [CrossRef]
  36. Qi, Y.F.; Li, J.; Shi, C.B.; Zhang, Y.; Zhu, Q.T.; Wang, H. Effect of directional solidification of electroslag remelting on the microstructure and primary carbides in an austenitic hot-work die steel. J. Mater. Process. Technol. 2017, 249, 32–38. [Google Scholar] [CrossRef]
  37. Du, G.; Li, J.; Wang, Z.B. Effect of initial large-sized inclusion content on inclusion removal during electroslag remelting of H13 die steel. Ironmak. Steelmak. 2018, 45, 919–923. [Google Scholar] [CrossRef]
Figure 1. Force analysis of inclusion in the liquid metal film (LMF) where FB is the buoyancy force; FS is the Saffman force; and FD is the drag force (the inclusion is considered to be a solid sphere).
Metals 10 00647 g001
Figure 2. The distribution of the detected areas in the electrode tip of GCr15 steel (a) and the minimum examined area at the interface of the mushy zone and LMF (b).
Metals 10 00647 g002
Figure 3. Experimental device for non-aqueous solution electrolysis and extraction (a) schematic diagram of non-aqueous solution electrolysis; (b) non-aqueous solution electrolysis device and extraction device; (c) powder samples obtained after electrolytic extraction.
Metals 10 00647 g003
Figure 4. (a) Morphology of the tip of the consumable GCr15 steel electrode and (b) enlarged microstructure at the interface of the LMF and mushy zone. (c) Schematic diagram of the LMF, which was also used as the model in the numerical simulation.
Metals 10 00647 g004
Figure 5. (a) The number of inclusions in the LMF and mushy zone. (b) The number of inclusions in the mother electrode.
Metals 10 00647 g005
Figure 6. The inclusions with different sizes in the LMF and mushy zones for the electrodes: (a) Set-A, (b) Set-B, (c) Set-C.
Metals 10 00647 g006
Figure 7. The types and morphologies of the inclusions in the LMF in this study.
Metals 10 00647 g007
Figure 8. Melt velocity field of fluid in the LMF under the consumable electrode.
Metals 10 00647 g008
Figure 9. Migration behavior of inclusions with different sizes when VSFI is (a) 0.01 m/s and (b) 0.05 m/s: (a1) and (b1) 1 μm, (a2) and (b2) 2 μm, (a3) and (b3) 3 μm, (a4) and (b4) 5 μm, (a5) and (b5) 10 μm, and (a6) and (b6) 20 μm.
Metals 10 00647 g009
Figure 10. Migration behaviors of inclusions with different sizes when VSFI is (a) 0.10 m/s and (b) 0.20 m/s: (a1) and (b1) 1 μm, (a2) and (b2) 2 μm, (a3) and (b3) 3 μm, (a4) and (b4) 5 μm, (a5) and (b5) 10 μm, and (a6) and (b6) 20 μm.
Metals 10 00647 g010
Table 1. Typical forces acting on inclusions (dp = 5 μm) [13,19,20,21,22,23,24,25,26].
ForceFormulaParameter SettingTypical Value (N)
Saffman force F s = 1.615 d p 2 ρ μ ( v f , x v p , x ) G v f , x   = 0.10 (m/s)10−11
Buoyancy forceFB = ( ρ ρ p ) g V ρ ρ p   = 2950 (kg/m3)10−11
Drag force F D = 18 μ m p ( v f v p ) / ρ p d p 2 v f   = 0.10 (m/s)10−11
Pressure gradient force F d = π d p 3 p / 6 l p l = 1000 10−13
Magnus force F m = π ρ d p 3 ω ( v f v p ) / 8 ω   = 100   (rad/s)10−14
Added mass force F m = π d p 3 α p ( 2 ρ p + ρ ) / 12 α p = 100   (m/s2)10−13
Notes: d p denotes the diameter; G represents the melt velocity gradient of the LMF; ρ p is the density of the inclusion; ρ is the density of the fluid ; p / l is the pressure gradient in the direction of flow; v f represents the melt velocity of the fluid; v p is the velocity of the inclusion; ω is the angular velocity of the inclusion; and α p represents the fluid acceleration.
Table 2. Physical properties, geometry, and operating conditions used in the numerical simulation.
Physical Parameter of the LMFValue
Density of the LMF (kg/m3)6850
Dynamic viscosity of the LMF (Pa s)0.0061
Density of inclusion (kg/m3)3900
Particle diameter (μm)1/2/3/5/10/20
Thickness of the LMF (μm)300
Length of the LMF (mm)12
Melt velocity at the SFI (m/s)0.01/0.05/0.1/0.2
Table 3. Migration behaviors of inclusions with different sizes under different velocities of the slag/LMF interface (SFI).
VSFI (m/s)Diameter of the Inclusions (μm)
12351020
0.01
0.050.49s0.20s
0.100.39s0.16s0.07s
0.200.25s0.14s0.06s0.03s
Notes: ↑ means floating; ← indicates that the inclusions migrate to the left wall in the LMF. The values are the times required for the inclusions to be engulfed.

