Article

Influence of Sand Fines Transport Velocity on Erosion-Corrosion Phenomena of Carbon Steel 90-Degree Elbow

1
Mechanical Engineering Department, Universiti Teknologi PETRONAS, Perak 32610, Malaysia
2
Group Technical Solution PETRONAS, Menara Dayabumi, Kuala Lumpur 50050, Malaysia
*
Authors to whom correspondence should be addressed.
Metals 2020, 10(5), 626; https://doi.org/10.3390/met10050626
Submission received: 9 February 2020 / Revised: 27 February 2020 / Accepted: 7 March 2020 / Published: 11 May 2020

Abstract

:
Erosion-corrosion is an ineluctable flow assurance problem confronted in hydrocarbon transportation and production systems. In this work, the effect of sand fines velocity on the erosion-corrosion behavior of AISI 1018 carbon steel long radius 90° elbows was experimentally and numerically investigated for liquid-solid flow conditions. Experiments were effectuated for sand fines of mean diameter 50 µm circulated in a flow loop with three different velocities (0.5, 1 and 2 m/s). To elucidate the erosion-corrosion mechanism and degradation rate, the material loss analysis, multilayer paint modeling (MPM) and microscopic imaging technique were employed, with computational fluid dynamics (CFD) and discrete phase modeling (DPM) also capacitating to evaluate the erosion distribution. It was perceived that increasing slurry velocity significantly changes the particle-wall impaction mechanism, leading to an increase in material degradation in the elbow bottom section up to 2 times in comparison to the low transport velocity. The erosion scars and pits development at the elbows internal surface was found to govern the wear mechanism in the carbon steel and made downstream section susceptible to erosion and corrosion. The material removal mechanisms were ascertained to change from cutting to pitting and plastic deformation with an increase of sand fines transportation velocity from 0.5 m/s to 2 m/s.

1. Introduction

In the hydrocarbon industry, sand fines are continually churned out together with production fluids. An approach to deal with sand elimination, sand screens or gravel packs is deployed at the entrance of main production lines to control and minimize the production of sands. For example, the standard sand screen in hydrocarbon and mineral processing industries cannot restrain fines particles (less than 62.5 µm) from being entrained with the fluid phase [1]. These sand fines can progress through sand screens and will aggregate in severe erosion induced damages to pipe systems. Erosion may cause significant damage to piping systems in the hydrocarbon production industry and bring about equipment malfunction and necessary replacement of the production equipment. In order to alleviate the erosion of pipelines, the massive cost is directed annually. If erosion induced damage is not detected, it might lead to malfunction of equipment, flow changing devices and affects the operating safety of the whole process [2].
Erosion-corrosion is the cumulative degradation due to corrosion and erosion and is caused by one or more than two-phase flow under high transportation velocities in pipelines. Corrosion is the process of chemical or electrochemical degradation of the metal. However, erosive wear is completely mechanical. The cumulative effect of erosion and corrosion that in sync in fluid media is perceived as erosion-corrosion [3,4]. Erosion-corrosion can be circumvented by assuring that working conditions do not concede either erosion or corrosion. Based on statistical results from 2010 to 2015 for oil pipeline failure causes of the US, Europe, the UK and PetroChina which includes 432 oil pipeline failures, the top cause for oil pipeline failures is erosion/or corrosion [5].
In hydrocarbon production, when erodent has to be transported elbow pipe configurations are inclined to erosive wear because of the high transport velocity rate required to keep the particle motion [6,7]. In this sense, flow changing devices such as elbows are more likely to wear during the abrasive particle conveying and considered an incapacitate part of multiphase transportation pipelines [8]. The piping components are commonly manufactured with carbon steel due to its cost-effectiveness and good thermal properties even with less corrosion resistance [9,10].
Zhang et al. [11] evaluated the effects of erosion in austenitic stainless steel tubing for different impact angles under slurry flow. By visualizing the surface morphology, they concluded that erosive wear mechanisms depends on impact angles and varied significantly with change of impact angles, the craters were shallow and longer at low impact angles and deep wide and more circular at high impact angles. Lin et al. [12] decoupled the relation between the erosion of stainless steel and erodent sizes using a direct impingement test. Erosion test reveals that erosion ratio rises with the increase of erodent size but 75 μm sand erodent disintegrates more material. It is also observed that even the 75 μm sand erodent is smaller and generate decisive erosion on the material surface because of 75 μm sand sharpness is higher than sand erodent with a bigger size. Kumar et al. [1] studied sand fines erosion behavior in carbon steel elbows for air-sand flow conditions both experimentally and numerically and found maximum erosion location at the exit of the elbow.
Alam [13] investigated the solid particle erosion of five types of steel using a direct impact test. It was reported that the erosive wear of the specimen increases with erodent concentration. Higher erodent concentration turns out in severe particles-wall impactions and disintegrates more material from the target surface. Liu et al. [14] performed erosion-corrosion testing using a carbon steel 90° elbow to assess the effect flow velocity in the corrosive medium for single phase flow conditions. Zeng et al. [15] designed a 90-degree elbow to study erosion-corrosion of carbon steel; however, it was noticed that the technique adopted to mount carbon steel specimen into the test elbow geometry could cause flow disturbances and influence hydrodynamics.
In CFD approach numerical models have been implemented to predict the penetration rate in different geometrical configurations and compared with experimental measurements to validate the results. Chen et al. [16] adopted discrete element model (DEM) and CFD techniques to quantify the erosion rate of different elbow configuration with 150 μm sand particles and found the location maximum erosion induced damage closest to exit for all elbows configurations. Mansouri et al. [17] study the importance of turbulence models and found that some models had over predicted erosion density for particle size less than 250 μm, gave sufficient accuracy for particle size greater than 250 μm diameter. Although CFD was a widely adopted method for predicting elbow erosion, one of the inhibitions of this approach is that CFD does not account for corrosion damage.
Mechanistic understanding of the erosion-corrosion mechanism due to sand fines is significantly limited at this point, ascribed to the credence that particle less than 62.5 μm, called fines, cause no significant erosion. A thorough search of the relevant literature yielded limited research on the influence of sand fines transport speed on the erosion-corrosion mechanism of the 90-degree carbon steel long radius elbow configurations. Another inhibition found in the available erosion-corrosion literature on the elbow configurations is that there is no corroboration for the fount of erosion-corrosion due to the low transportation velocities.
It has been confirmed from a review of the literature that the available studies focusing on the influence of sand fines on the erosion-corrosion of 90-degree carbon steel elbow are very limited. Furthermore, though it was reported in the direct impact test measurements that smaller particles significantly erode metals as well as it also have a profound effect on the mechanistic behavior of the target material. The available studies of elbow configurations confine to a particle size greater than 150 μm to simulate the liquid-solid erosion process that does not stipulate the influence of sand fines on erosion-corrosion rate and extent of erosion-corrosion. Therefore, the present study is intended to bridge the above gapes found in the literature by presenting a comprehensive study on erosion-corrosion of 90° elbows configuration of 1018 CS due to sand fines in liquid-solid flow conditions.
The study of the 90-degree elbow in erosion-corrosion research is significant since it is the common configuration that is the most influential on erosion failure under industrial operating conditions [18,19]. The flow field developed along the curvature of the elbow escalates particles in the direction of the wall leads to deviation in particle trajectories before impact and due to fluid flow and particles impact the target area with different impact angles enhance the erosion in the larger angle elbow [20]. In the present research, the influence of sand fines velocity on carbon steel 90-degree long radius elbow erosion-corrosion mechanism in liquid-solid flow conditions for 0.5, 1 and 2 m/s flow velocities were studied using material loss analysis, microscopic imaging and multilayer paint modeling approach. Moreover, the computational fluid dynamics (CFD) with discrete phase modeling (DPM) such as erosion rate distribution and particle tracking inside elbow computational domain were systematically studied to understand the erosion-corrosion phenomena.

2. Experimental Methods and Materials

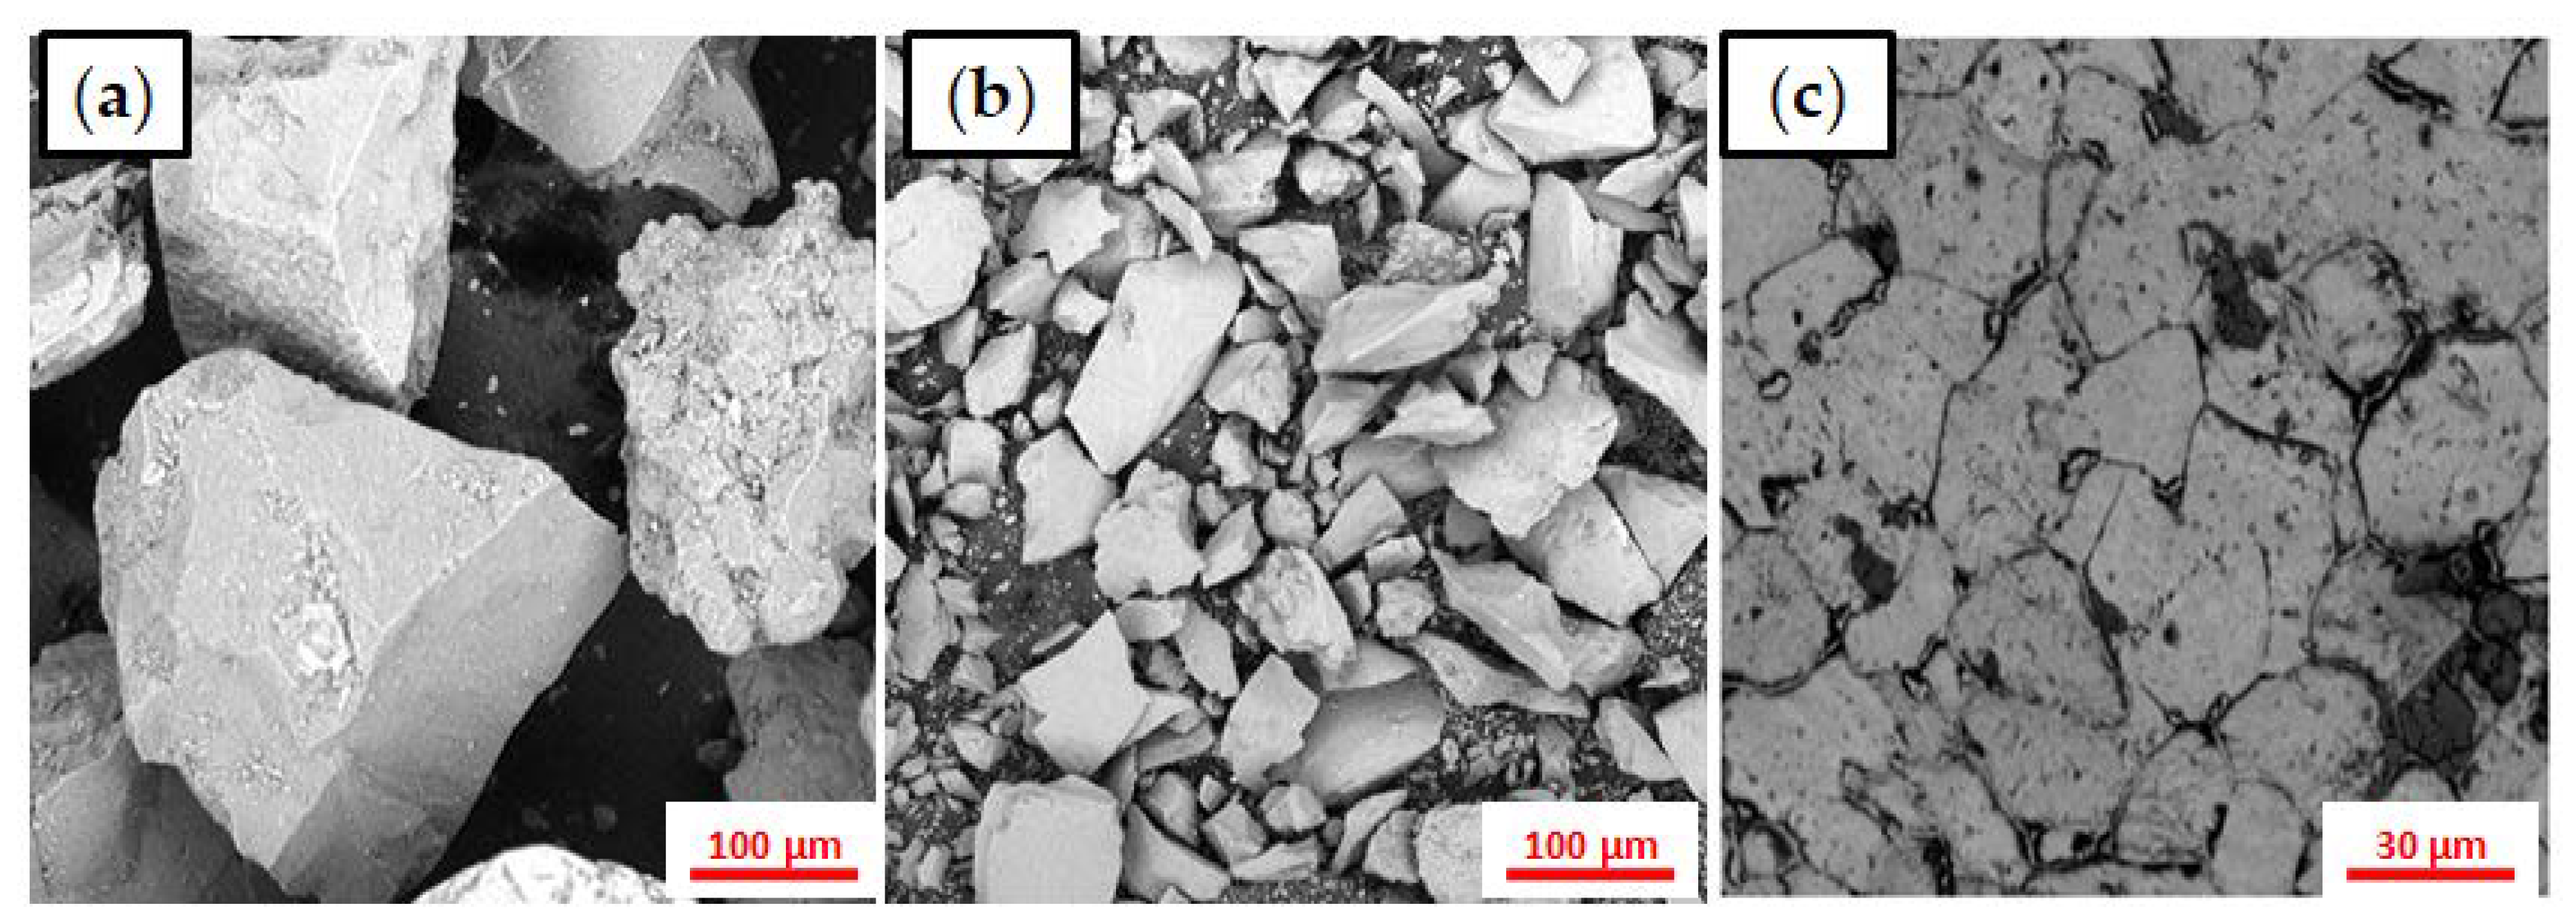
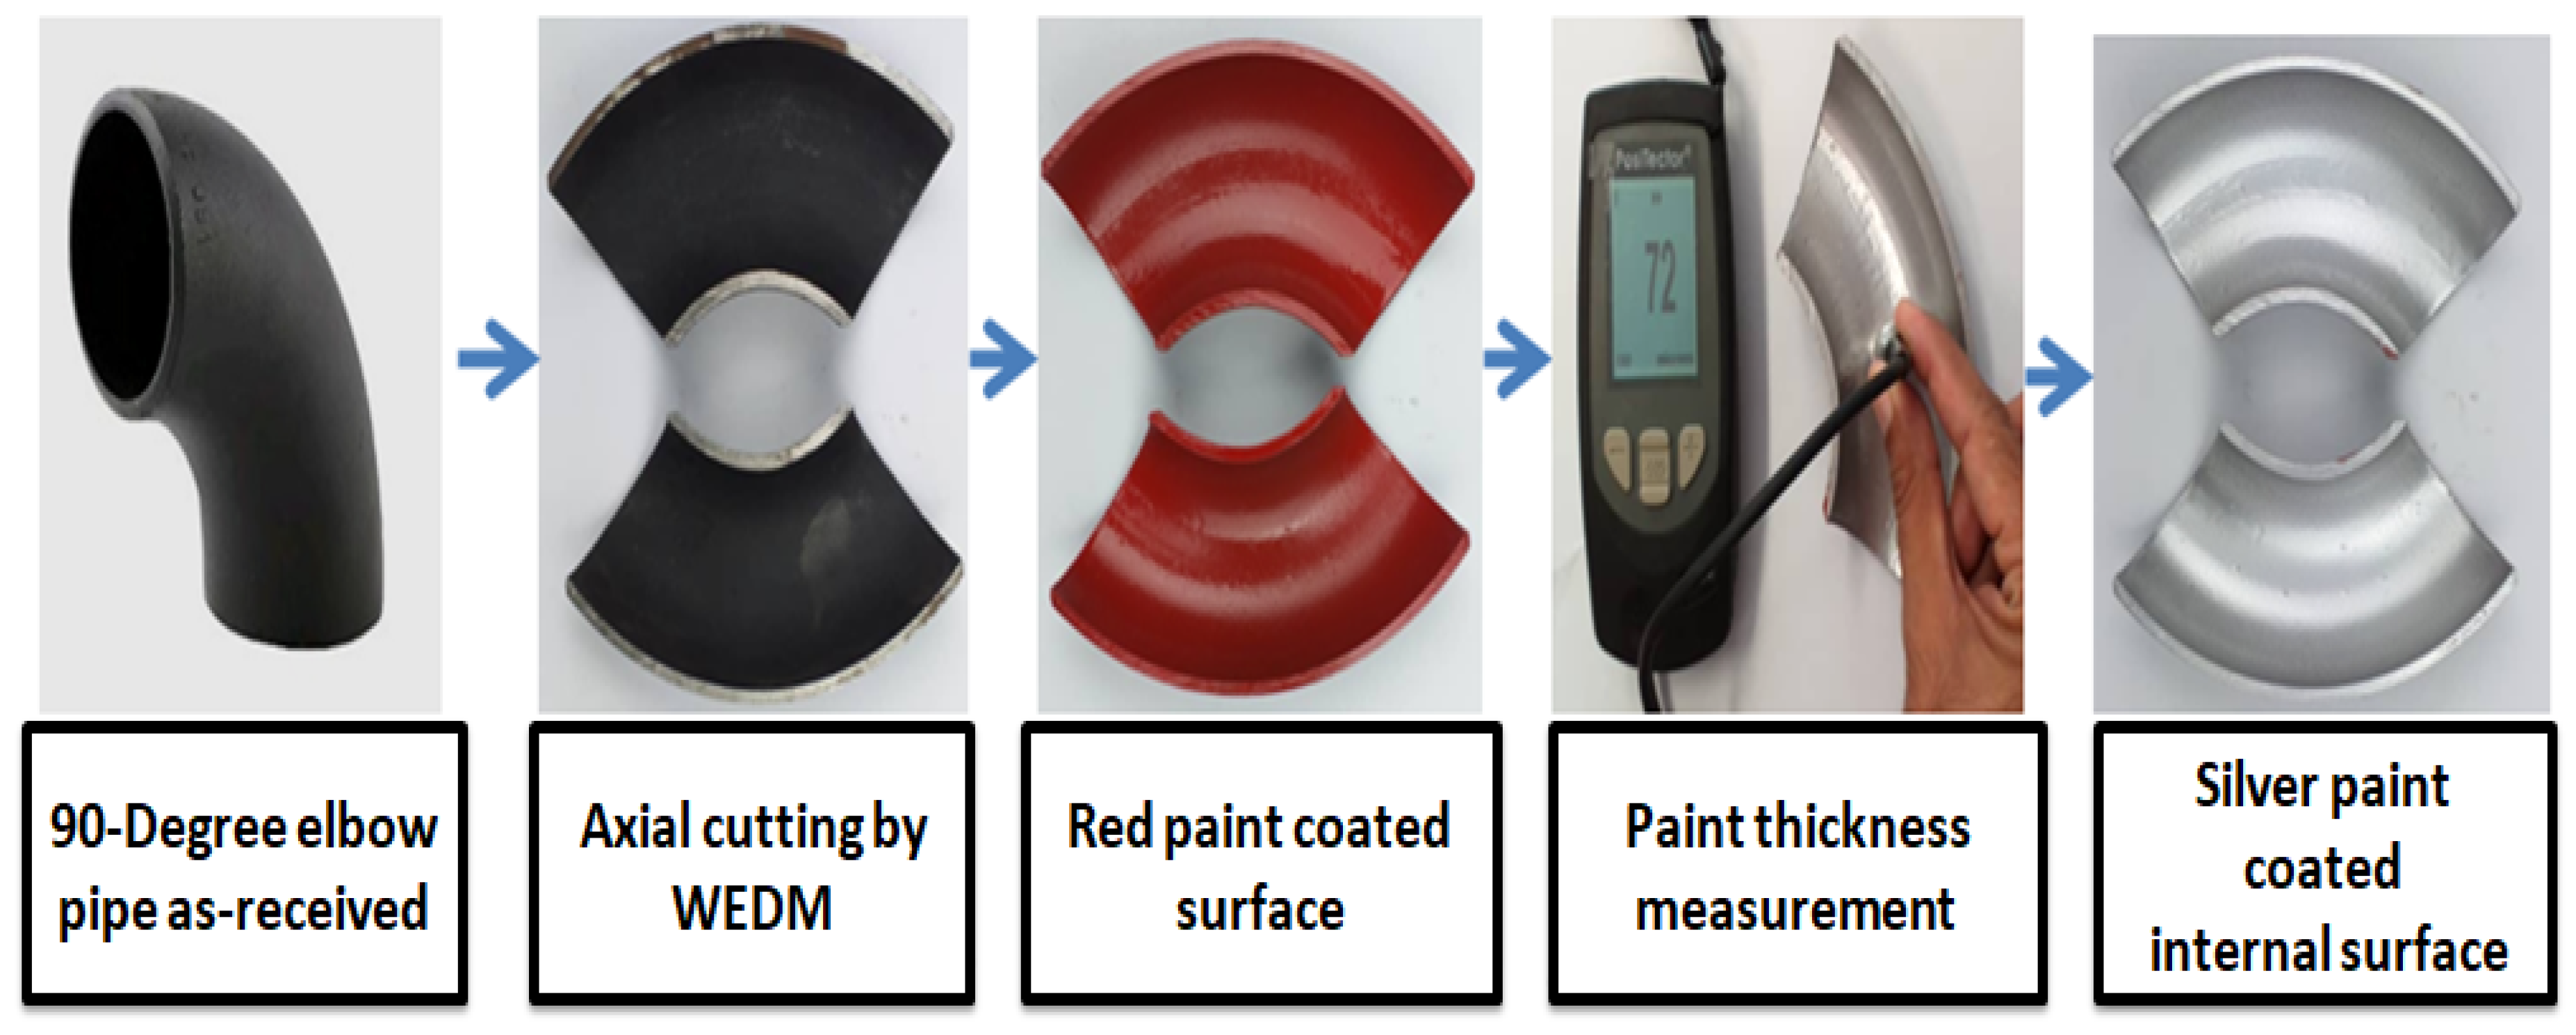
The specimens selected in the erosion-corrosion evaluation were AISI 1018 CS elbows with a 50.8 mm internal diameter, bend angle 90-degree and a pipe thickness of 3.5 mm. All as received elbows were axially cut into the two-section bottom half (BH) and the upper half (UH) as illustrated in Figure 1. Erosion-corrosion experiment was performed for water-sand flow containing sand fines with an average size of 50 ± 2 µm measured using a laser scattering particle size distribution (Malvern Mastersizer 2000, Worcestershire, UK). Table 1 lists the chemical compositions of the test elbow of AISI 1018 carbon steel, which is the most common material of piping components, was selected as a study material. The microstructure and wear surface morphology of the elbow samples were examined with a scanning electron microscope (SEM; Phenom ProX, PhenomWorld, Eindhoven, The Netherlands). For the SEM analysis, square samples of 10 mm size were cut from the test elbow inlet and outlet by wire electrical discharge machining (WEDM) process after the erosion-corrosion test. The elbow specimen was cut in two sections BH and UH from the as-received samples, ground and polished with variable speed pneumatic angle grinding and polishing machine to reduce the level of surface roughness of internal surface before the test. Two different sand particles were utilized in this study, 450 µm mean size for validation case and 50 µm for all cases of erosion-corrosion. Figure 2 shows scanning electron microscope (SEM) images of the erosive sand and carbon steel material employed. The multilayer paint modeling (MPM) was adopted to understand erosion distribution analysis at the internal surface of elbow samples. To extract the location of particle impaction, red paint color coat of uniform thickness coated at an internal surface followed by silver color as illustrated in Figure 3.

Multiphase Flow Loop Apparatus and Medium

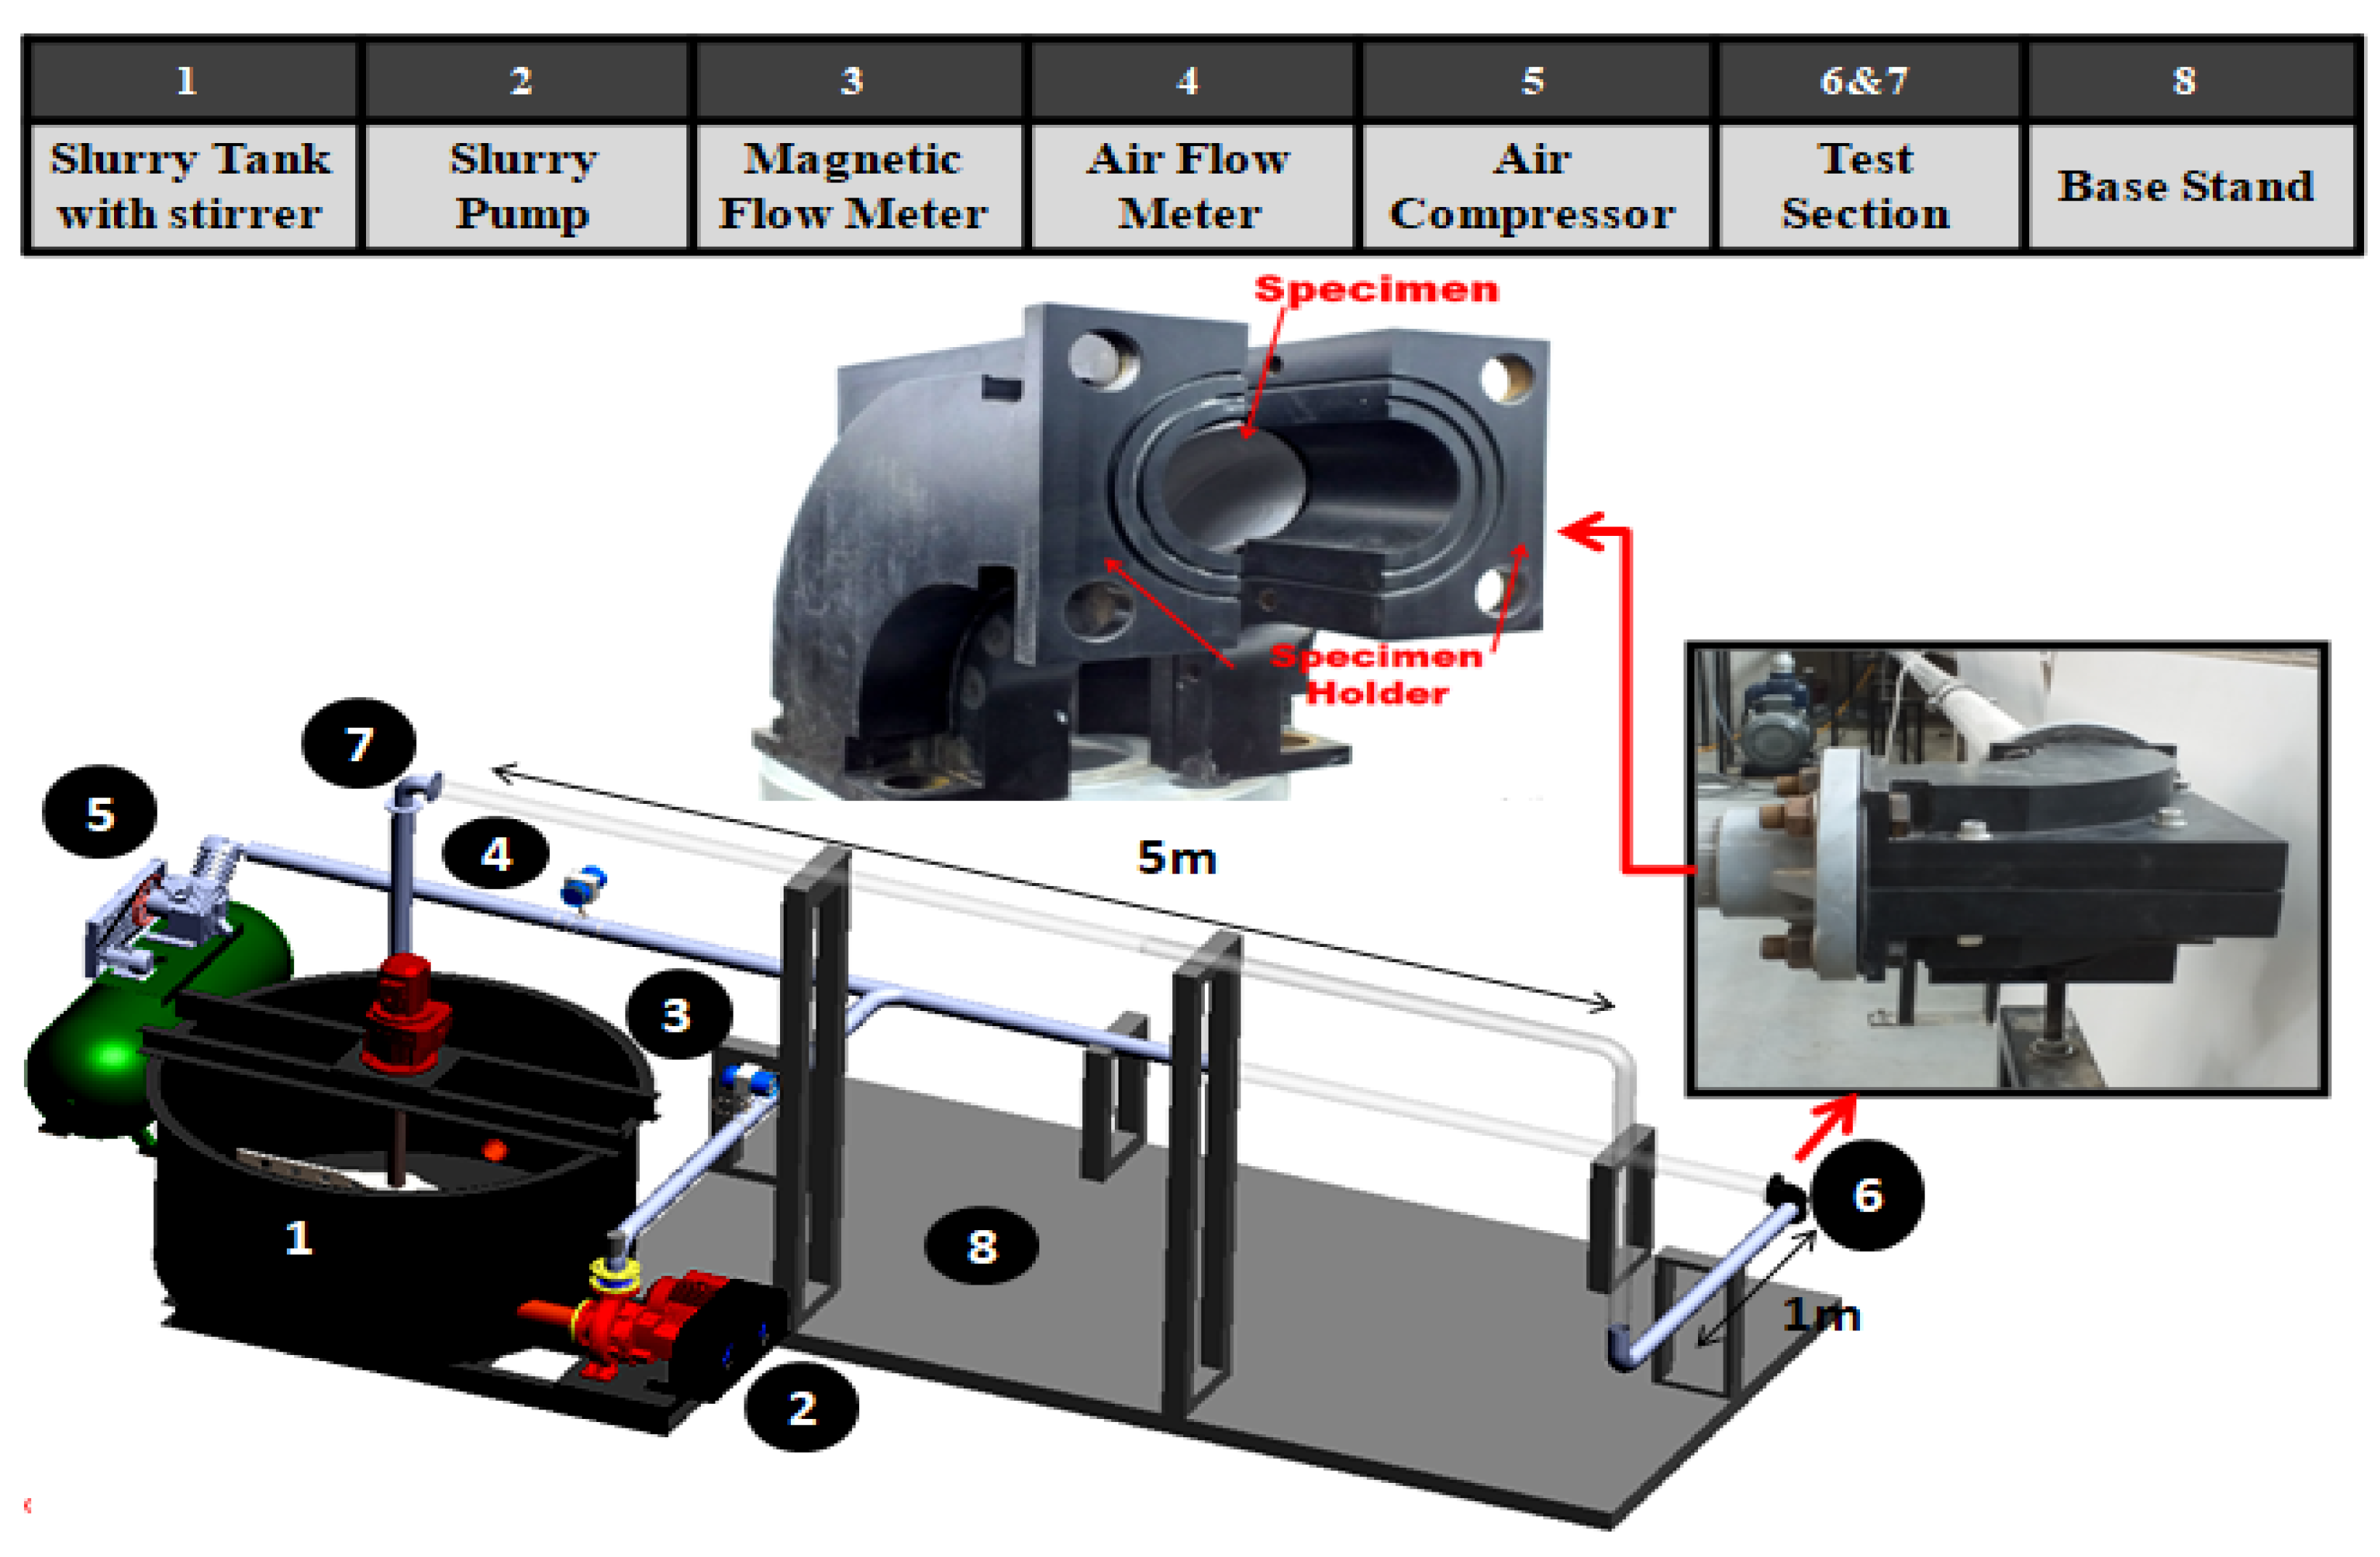
An experimental flow loop setup selected to perform the slurry erosion experiment of the 90° elbow configuration is schematically outlined in Figure 4. The setup was locally fabricated and configured to perform the erosion-corrosion tests in multiphase flow conditions consisted of a slurry tank with a stirrer, a flow meter and a slurry pump with a variable speed controller. Sand fines with a chemical composition (Table 2) of 2 wt. % concentration and the average size of 50 μm (Figure 2) were mixed with tap water to make a sand-water slurry. The erosion-corrosion medium was re-circulated at 0.5, 1 and 2 m/s velocities for 60 h in a closed flow loop. The resulting erosion-corrosion patterns were visualized using an SEM. Each specimen weight loss was tested before and after a test to quantify the erosion-corrosion rate. The eroded weight was measured to quantify the erosion rate in kg/s-m2. The test section design employed in the experimental study is shown in Figure 4. The experimental test section blocks were fabricated using a thermoplastic material, with a concavity of elbow configuration machined inside to place specimens for evaluation of erosion-corrosion performance in multiphase flow conditions. A detail description of the test section has been provided in a previous study [21,22]. Experiments were performed for a duration of 1 h for multilayer paint modeling and 60 h for erosion-corrosion test cases so that a measurable weight loss was acquired. Although the experimental setup has an air inlet at station 5, in this study, only the liquid-solid flow will be addressed.

3. Numerical Simulation

For liquid-solid flow, the performance of the flow loop setup described and the measurements reported with it was validated using multilayer Paint modeling (MPM) and CFD-DPM simulation. The ANSYS FLUENT code was employed for current research of erosive wear quantification. CFD tools offer the advancement of computational capabilities in providing better accuracy of solving flow physics in complex geometries.

3.1. Carrier and Dispersed Phase Model

The governing partial differential equations FLUENT uses to solve the carrier and dispersed phase model are represented generically as Equations (1) and (2):
ρ t + ρ V = 0
t ( ρ V ) + ρ ( V V ) = P + ( τ = ) + ρ g + S M
In Equation (2) ρ is the water density, V is the water instantaneous velocity, τ is the stress tensor, P is the pressure ρg is the body force due to gravity, SM is the momentum due to the sand phase. The dispersed phase model is represented by the second law of motion the governing equation can be expressed, respectively, as:
m p d u p d t = F D + F P + F V M + F G
In Equation (3) mp is the particle mass, FD is the drag force, FP pressure force, FVM mass force due to particles and the FG buoyancy force.

3.2. Erosion Model and Erodent Particle Rebound Equation

In this study, the erosion model defined by Oka and Yoshida [23] is adopted to understand the erosion mechanism of elbow geometric configuration under slurry flow which is a most accurate model for the erosion prediction of elbow geometries [19,20] and is defined as:
E R = 1 × 10 9 × ρ w k F ( θ ) ( H v ) k 1 ( V p V ) k 2 ( d p d ) k 3
In Equation (4) ρw is the wall material density, ϴ particle incidence angle, Hv is the wall material Vickers hardness, VP erodent incidence speed, V′ is the reference erodent speed, dp is the erodent size and d′ is the reference erodent size. During the simulations, collisions between particles and wall erosion were modeled using the Grant and Tabakoff model [24]. Where en and et are restitution coefficients to represent a change in normal and tangential coordinates as outlined in Equations (5) and (6):
e n = u p 2 u p 1
e t = v p 2 v p 1
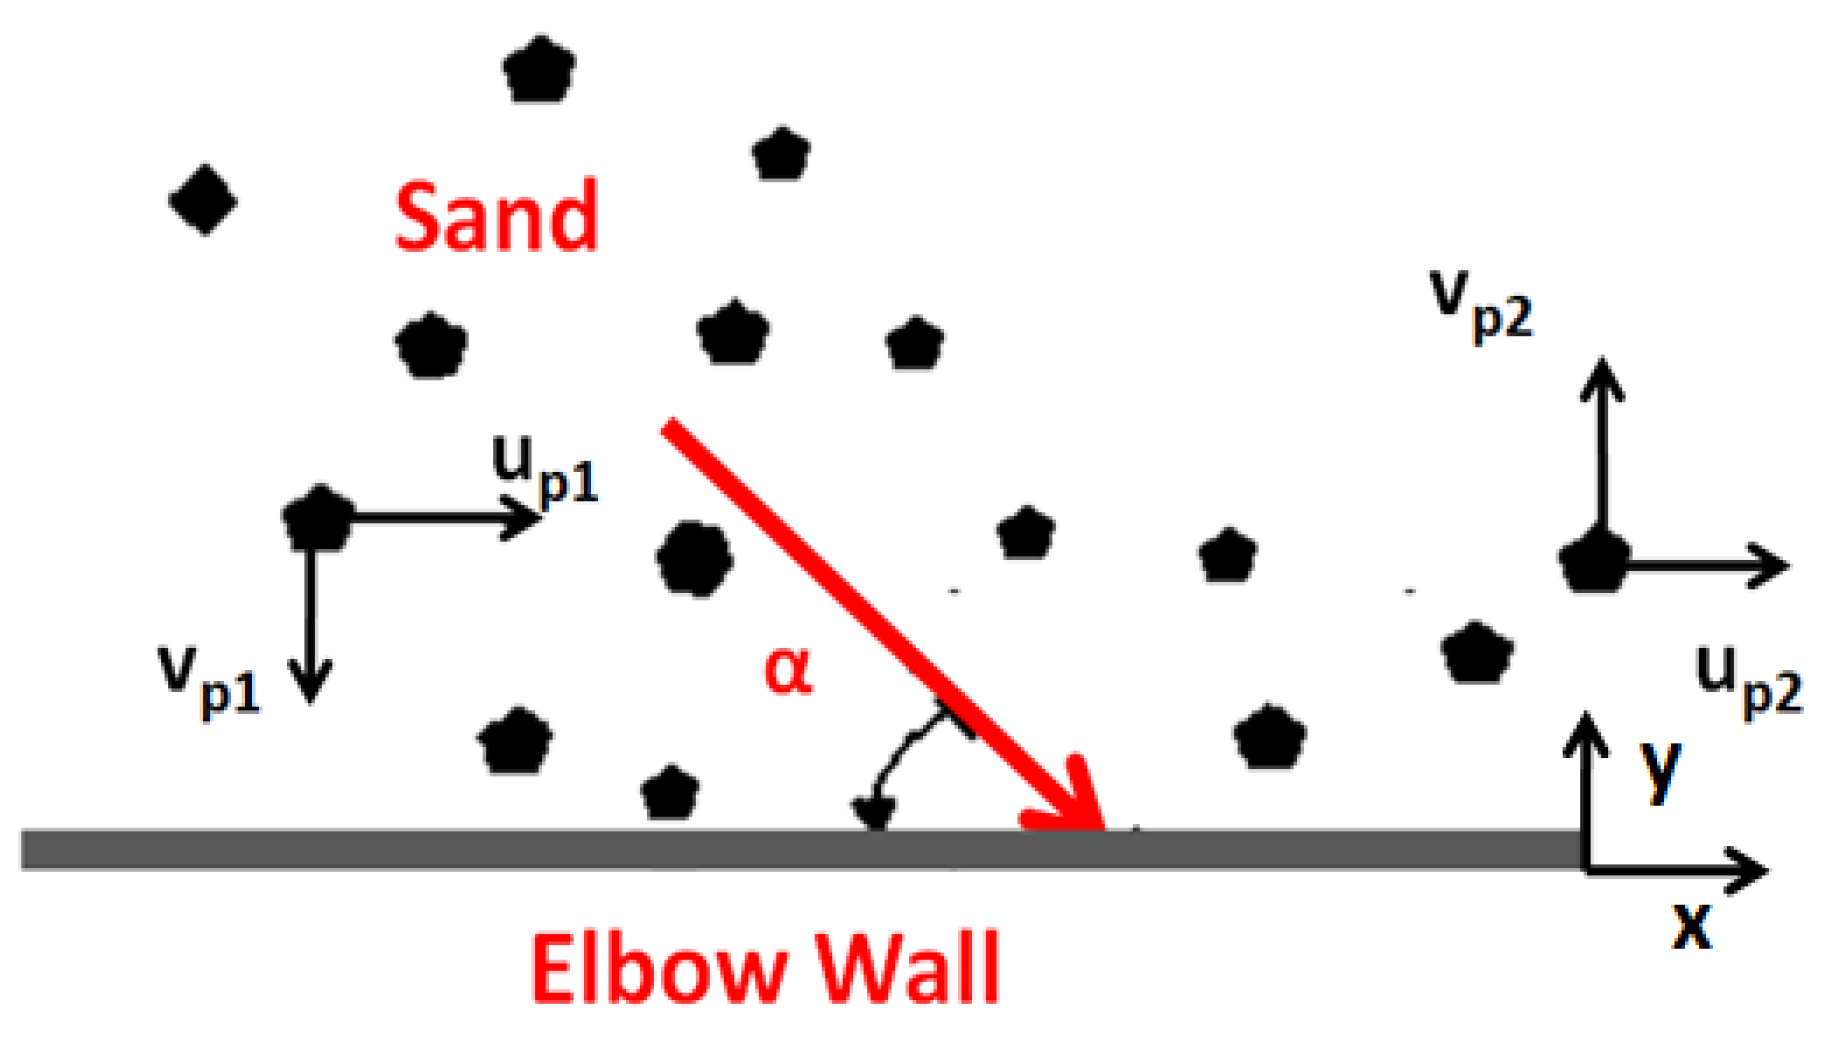
In these equations, u and v is the velocity component in normal and tangential direction before and after the collision, as shown in Figure 5. The particle rebound model is represented as follow:
e n = 0.993 1.76 α + 1.56 α 2 0.49 α 3
e t = 0.988 1.66 α + 2.11 α 2 0.67 α 3
where α is the erodent incidence angle.

3.3. Turbulence Model

For the present research, the k–ε turbulence model was implemented to extract the flow profile since the fluid flow at a Reynolds number between 2.85 × 10⁴ and 2.28 × 10⁵ (calculated based on the dimension of pipeline and flow parameters). This indicates a turbulent flow since the Reynolds number was much higher than 4000. Zhang and Liu [25] identified the certainty by comparison of various turbulence correlations and found that the k-epsilon correlation accurately predicts the flow field in elbows geometry. The k-ε model pertains to two important parameters: turbulent kinetic energy (k) and the turbulence dissipation rate (ε). Equation (9) represents the mean kinetic energy.
( ρ k ) t + d i v ( ρ i v ) = d i v ( p u ¯ + 2 μ u e i j ¯ ρ 1 2 u i . u i u j ¯ ) 2 μ e i j . e i j ¯ + ( ρ u i u j ¯ . E i j )
where Eij is the mean rate of deformation tensor. For high viscosity, generally, turbulence flow has fewer occurrences. Such an aspect influence impact velocity and particle impact angle.

3.4. CFD Modeling

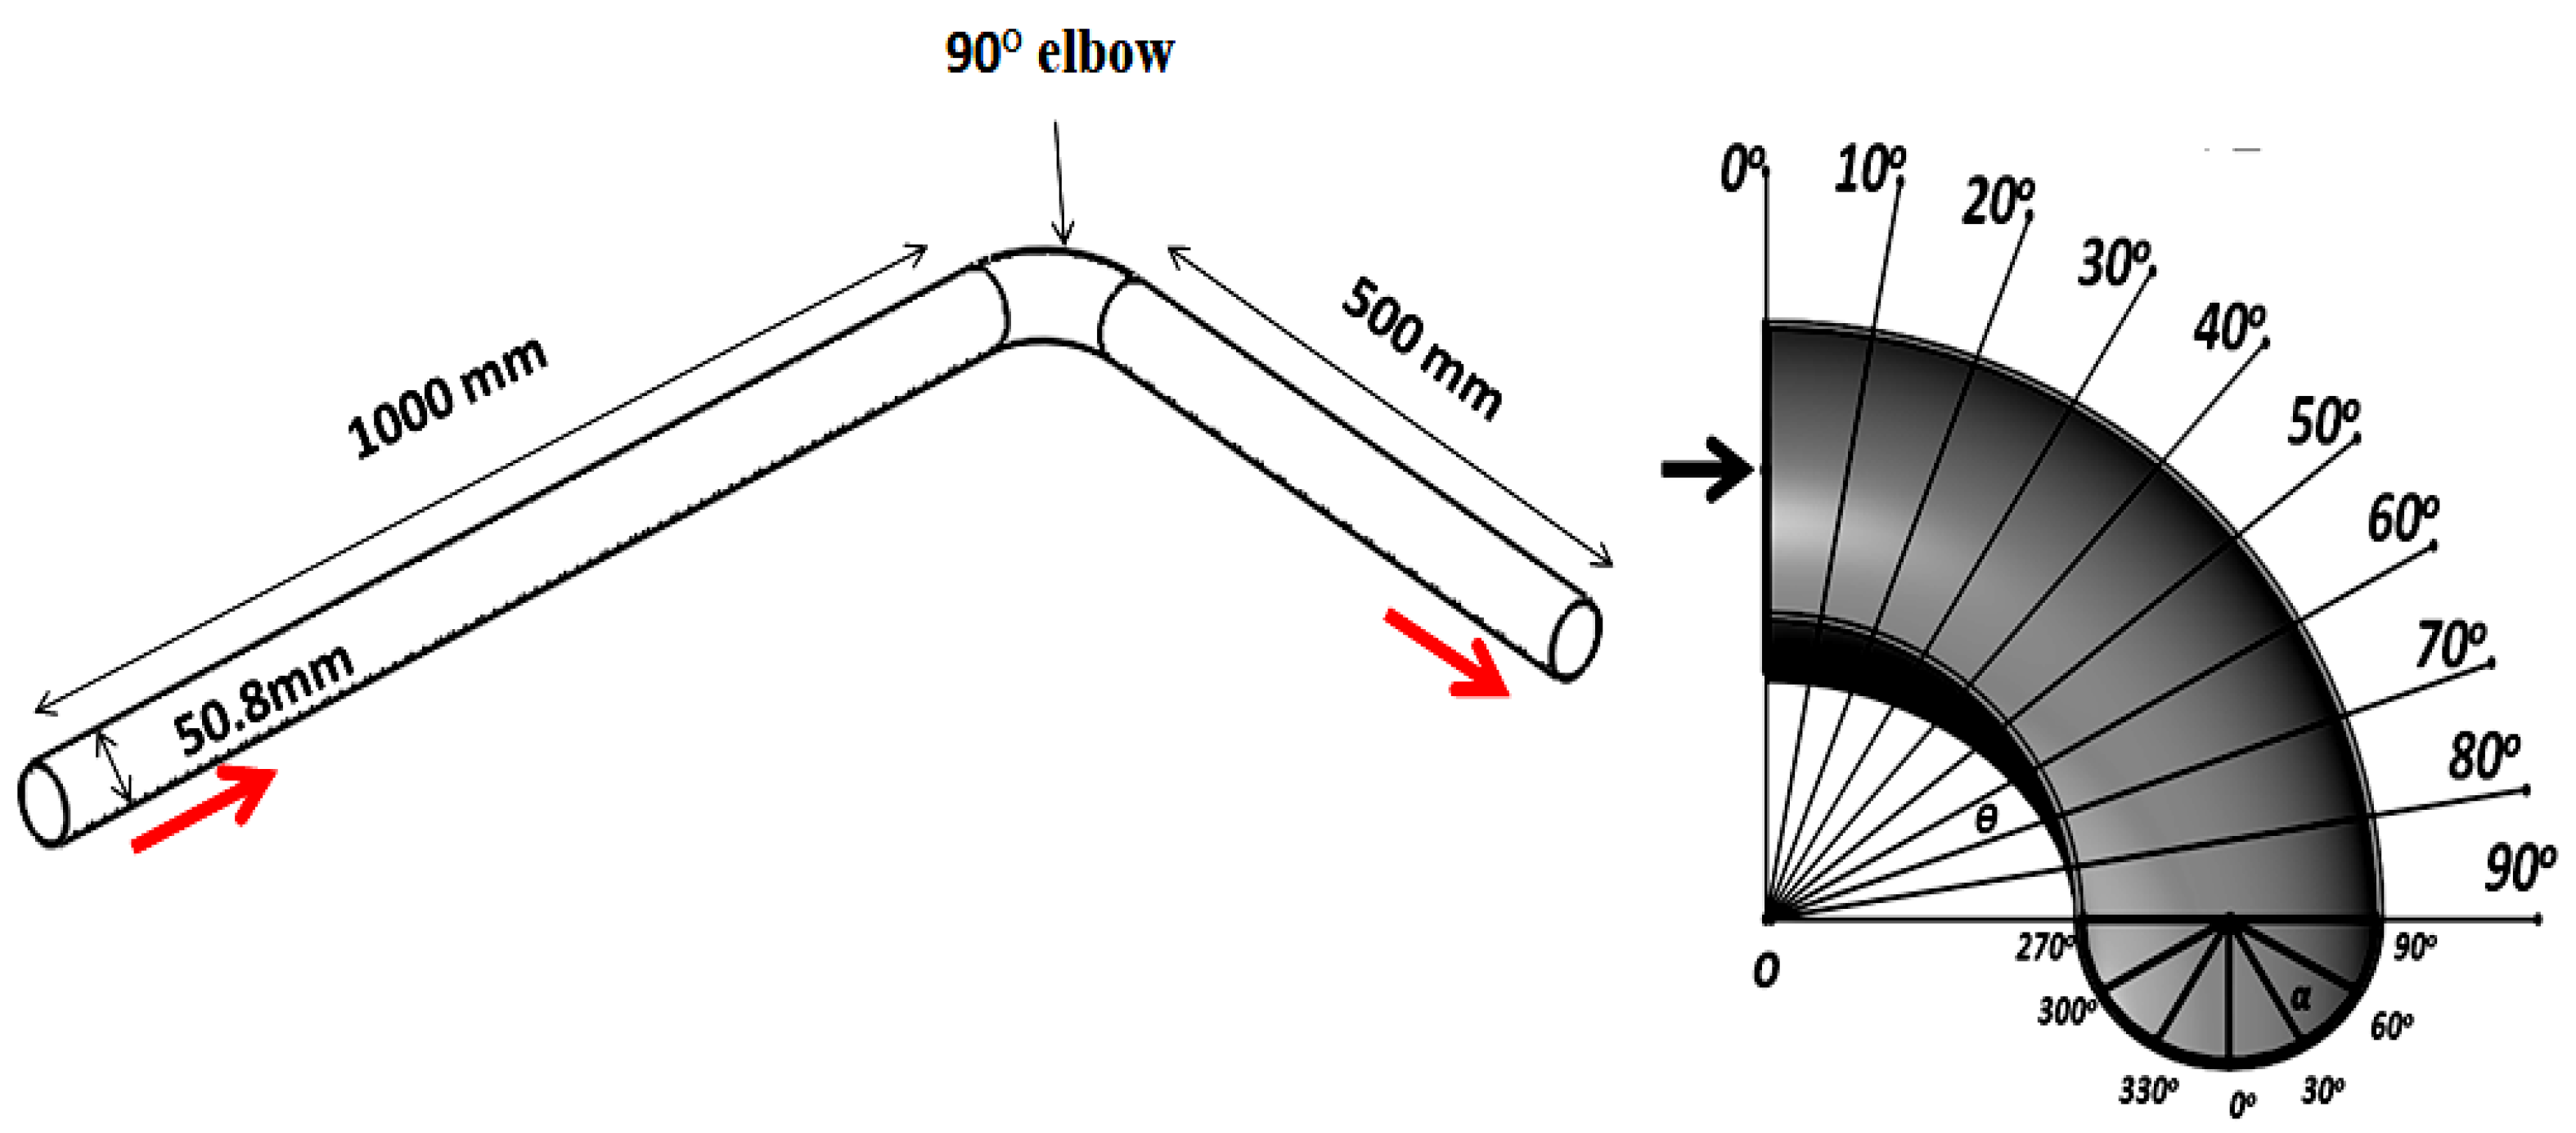
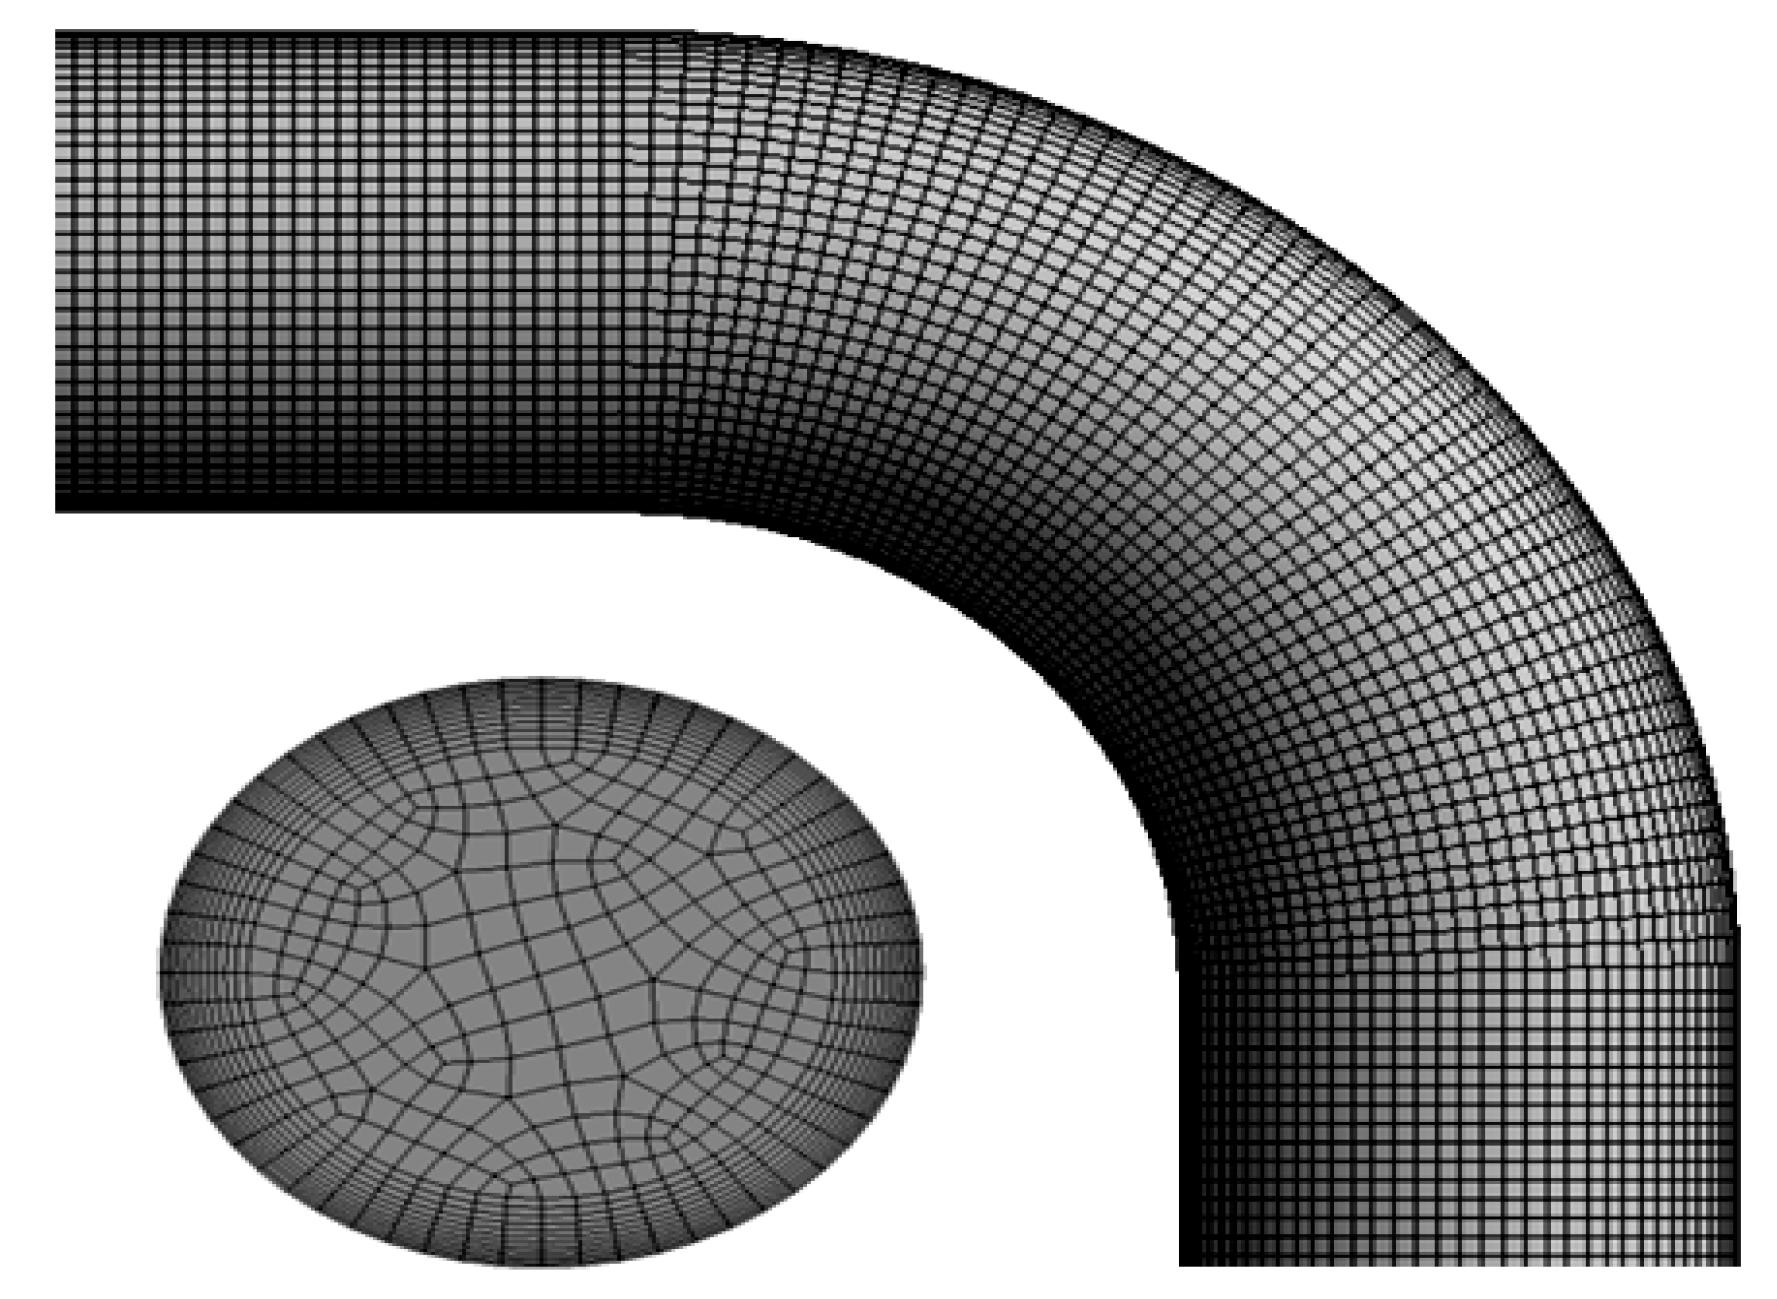
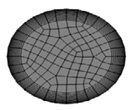
The geometry consists of a carbon steel 50.8 mm internal diameter 90-degree elbow configuration with an added upstream length of 1000 mm and 500 mm is added downstream for horizontal-horizontal orientation. Figure 6 showed the geometry of the computational domain. For numerical simulation, the flow domain was solved and generated using hexahedral mesh (Figure 7) with 524,000 elements and size of 0.003 m, which gives a provision of stable and minimization of numerical diffusion error in the numerical simulations. To capture flow pattern more accurately near the wall gradual refinement technique adopted near the vicinity of the walls. To initiate the numerical simulation, the boundary condition must be set as a slurry inlet, pressure outlet and elbow wall. For present simulation flow velocity was specified by 0.5 m/s, 1 m/s and 2 m/s normal to the boundary and zero-gauge pressure at the outlet. The simulation solver chosen for the present study was pressure based steady-state with the convergence criterion of 1 × 10⁻⁶ and the SIMPLE algorithm to discretize the carrier phase and disperse phase. For CFD-DPM simulation the mesh statistics and refinement with mesh independence study and validation with the previous experimental study were performed and discussed in the next section.

3.5. Mesh Independence

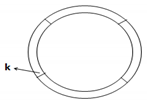
Three mesh resolutions were analyzed for this study to adjudge mesh independence. All three meshes were hexahedral and generated with the ANSYS pre-built meshing module. For the k-epsilon turbulence model refinement of the grid is important to assure that y+ value less than 1 in the first element is not outside the laminar layer and away from the wall, parameters for the mesh is listed in Table 3.
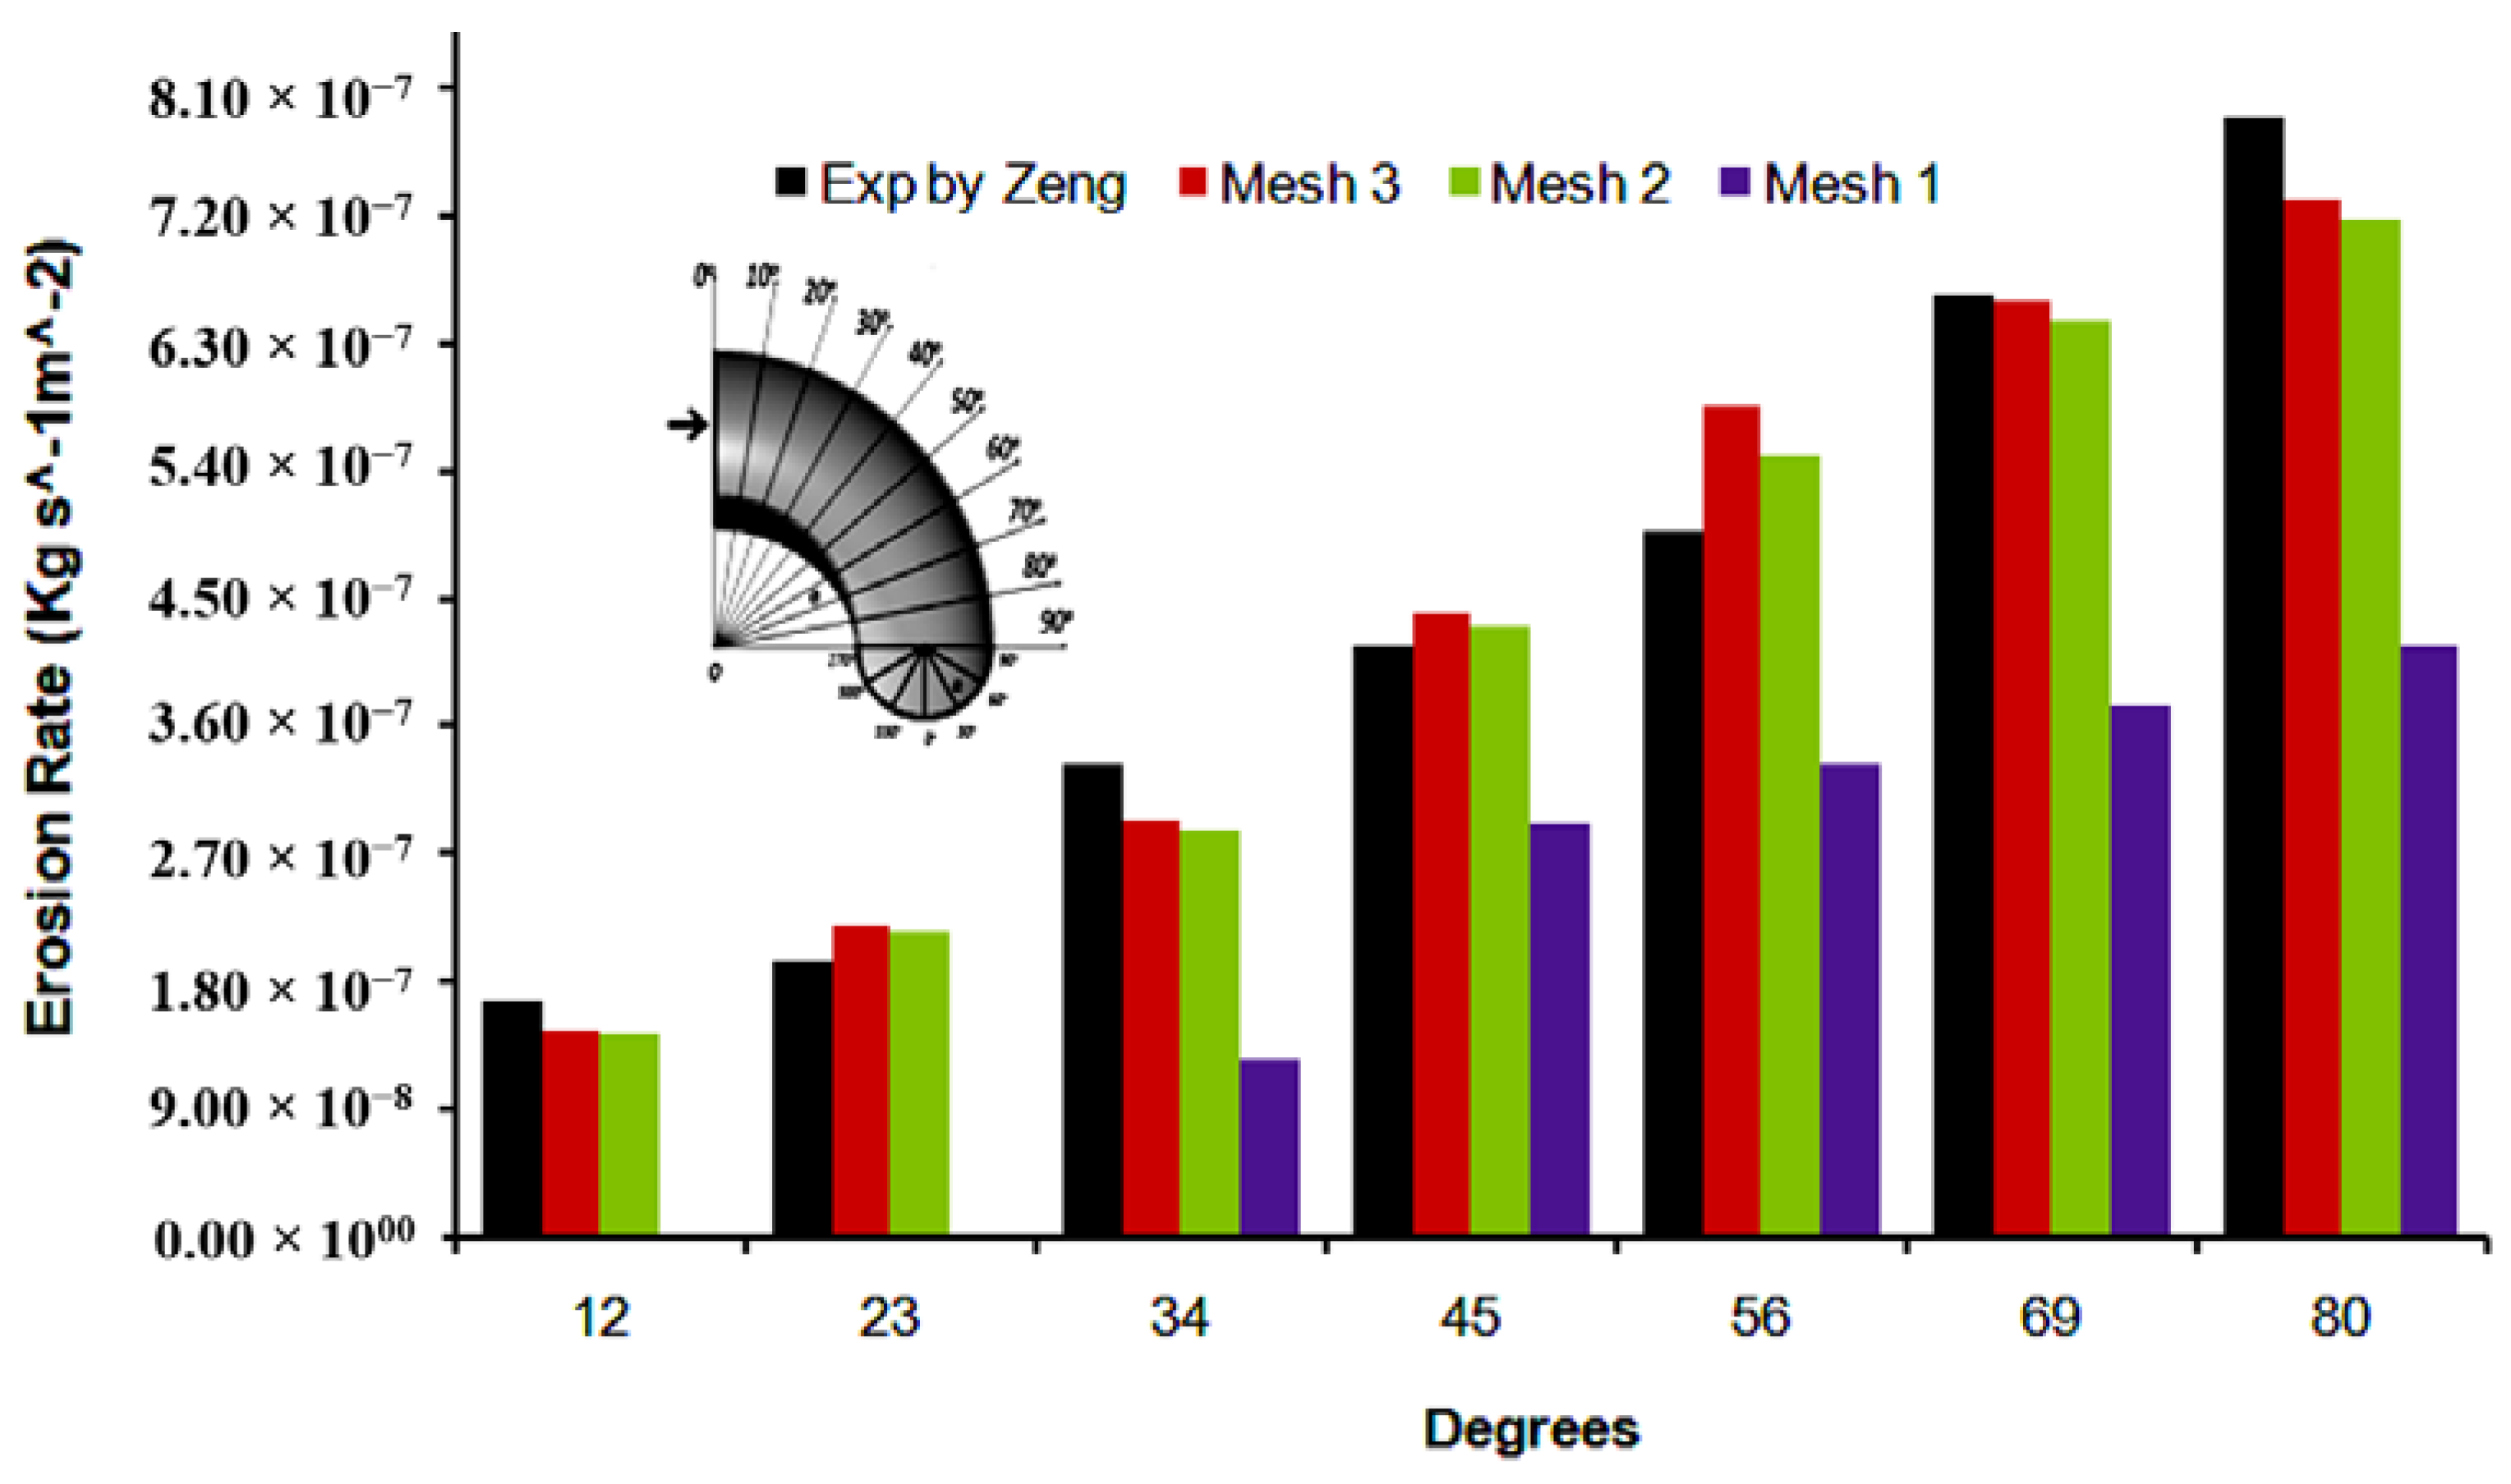
The validation of predicted erosion distribution was conducted by comparing the maximum erosion rate measurements along the curvature with the experimental findings of Zeng et al. [15]. The flow conditions are shown in Table 4. Figure 8 shows the erosion rate along the elbow curvature obtained using three different meshes by CFD-DPM and the experimental result by Zeng et al. [15]. In can be observed that, for this geometry, no matter which type of mesh is used, most of the erosion is predicted to occur close to the outlet location in the bend. The erosion rate was quantified from three grid sizes, producing significant differences from coarse mesh to fine mesh as presented in Figure 9. As the difference in the quantified erosion rate from mesh 2 and mesh 3 was less than 2%, the mesh 2 was in good agreement for minimizing run-time and memory use. Based on the study, the numerical simulations of the current study were performed considering the mesh 2.

4. Results and Discussion

4.1. Validation

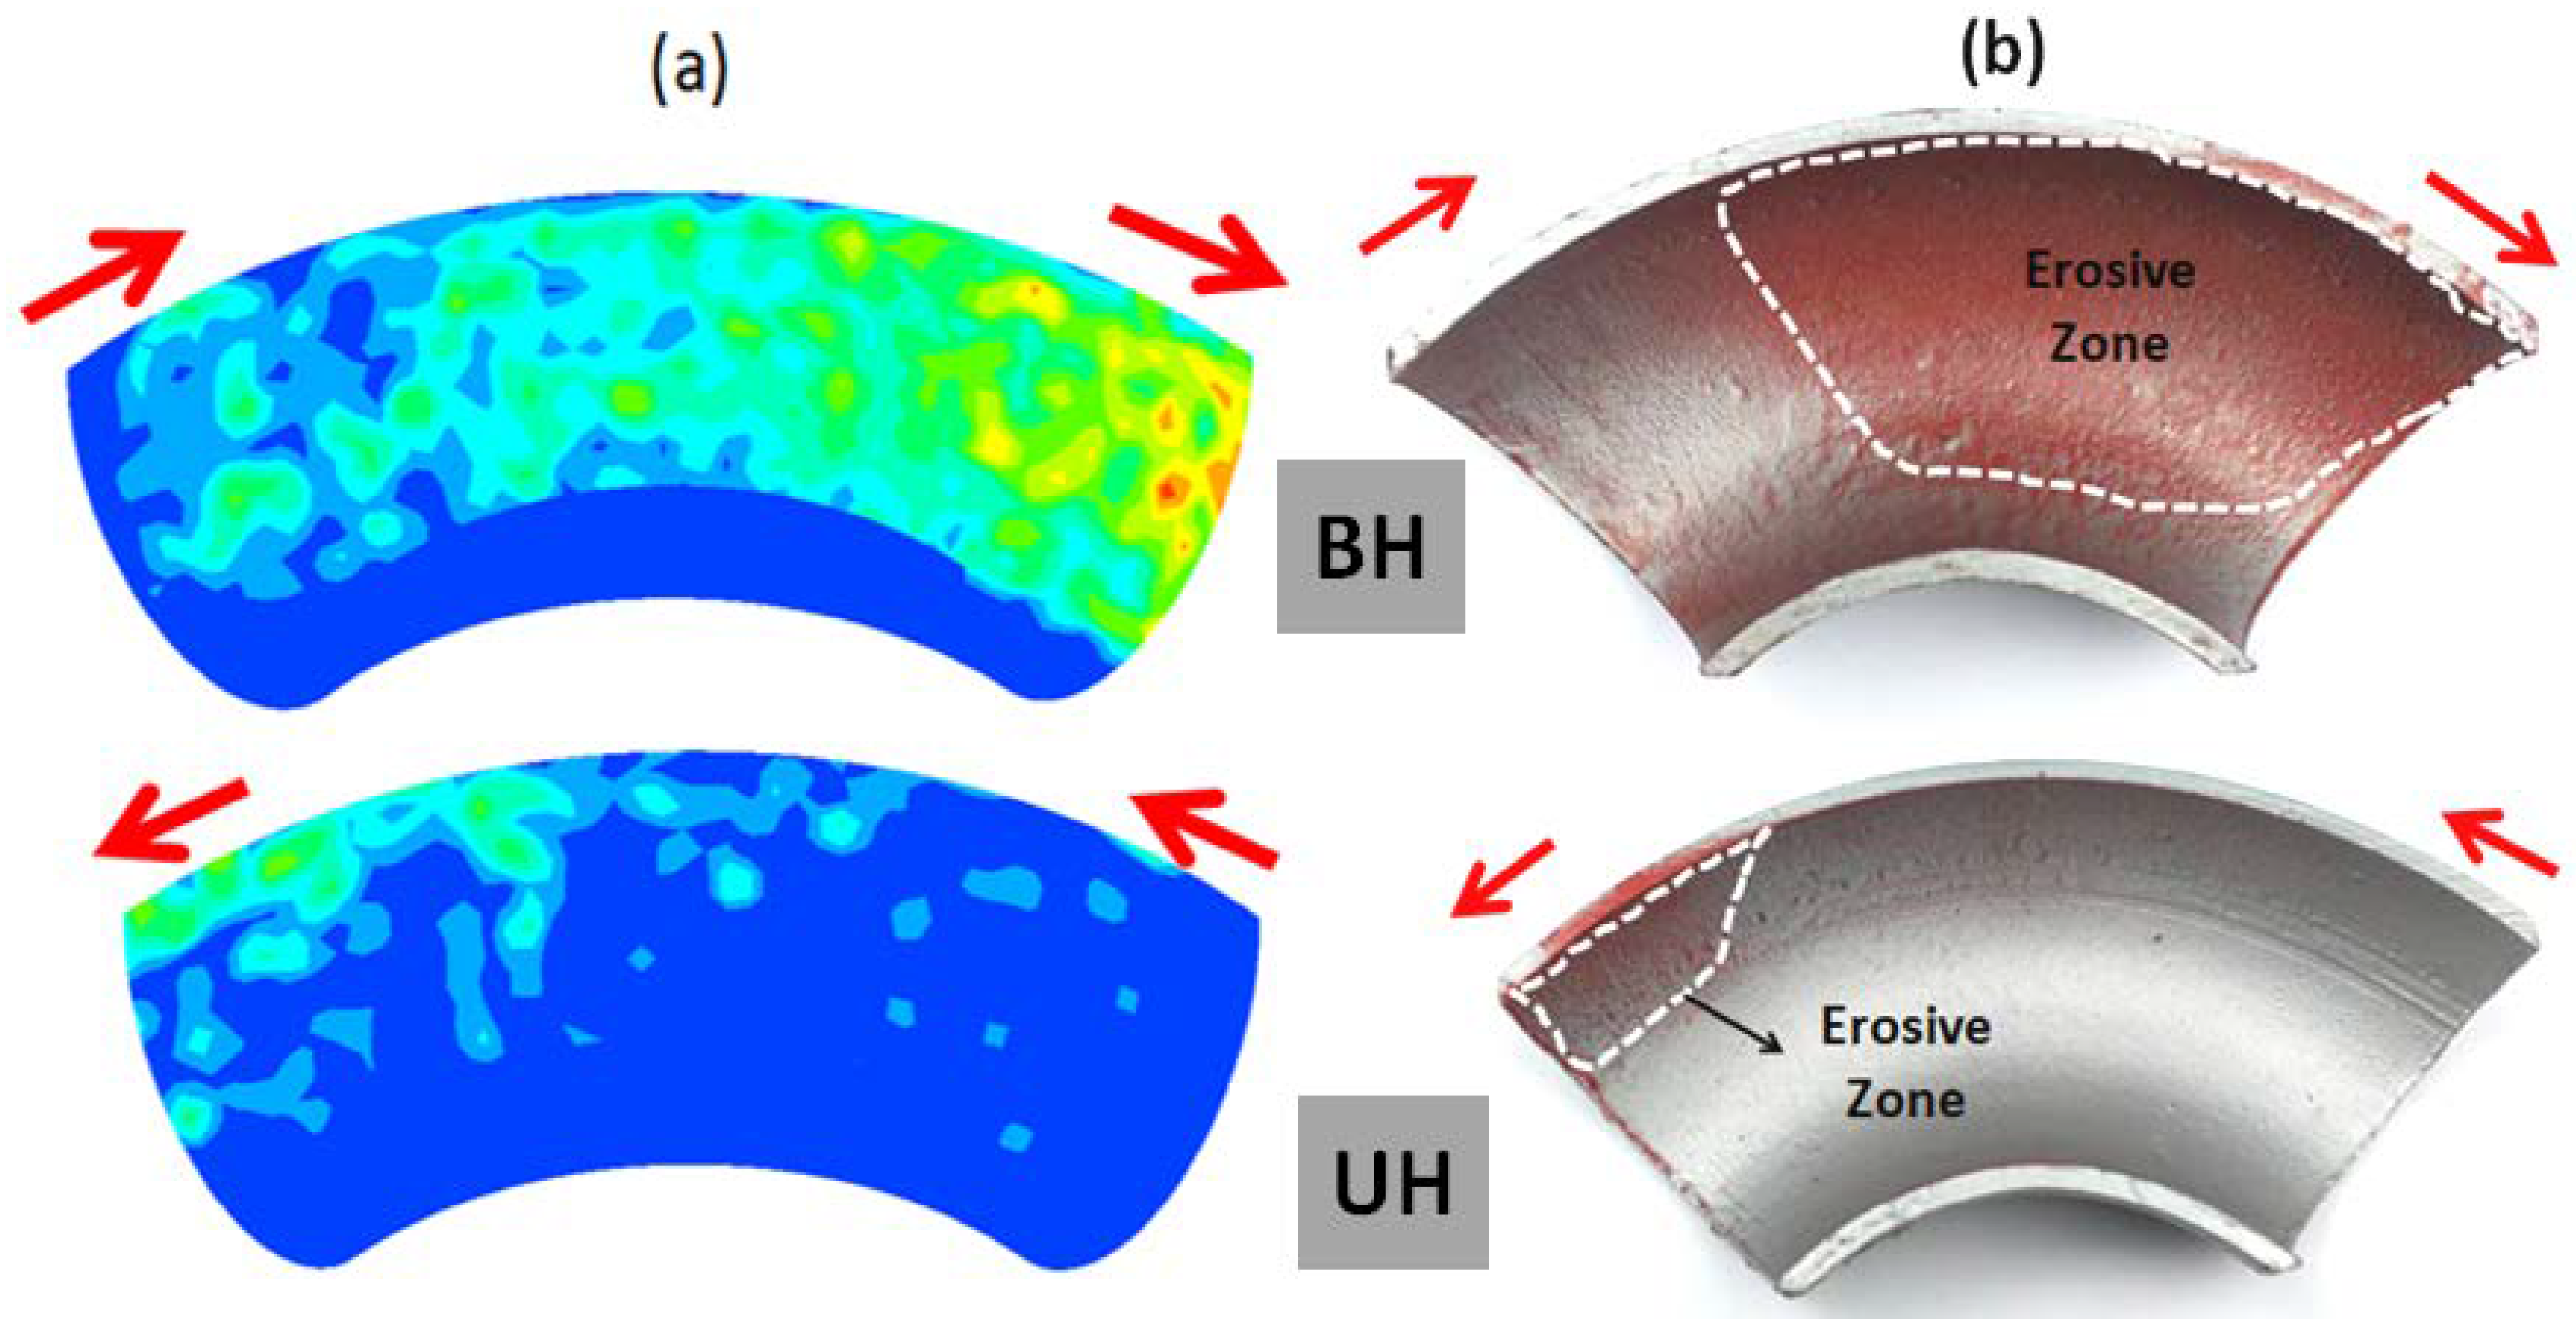
The performance of the flow loop setup described in Section 2 and the measurements reported with it was validated using multilayer Paint modeling (MPM) and CFD-DPM simulation. The operating conditions of the experiment and simulation case were set similar to Zeng et al. [15] experiments with a slurry velocity of 4 m/s with sand concentration 1.2% (wt/wt) and the obtained results were compared to identify the erosion zone. Figure 10a and b present the comparison between the extracted erosion patterns obtain through CFD-DPM and MPM. These patterns suggest that the erosive zone location obtains using MPM and CFD-DPM matches closely with each other as shown in Figure 10.
According to Zeng et al. [15] study the maximum erosion location found within 60-degree and 90-degree adjacent to elbow exit. The results obtained from the validation study identified erosive zone within 62-degree and 90-degree adjacent to the outlet. Thus, the adopted CFD model and experimental setup employed for liquid-solid study can be used to obtain erosion induced damage and location. Since the DPM erosion pattern matches closely with the multilayer paint modeling, it can be inferred that the CFD model is validated and further study by varying flow velocity can be carried out.

4.2. Influence of the Slurry Speed on the Erosion Profile and Erosion Rate

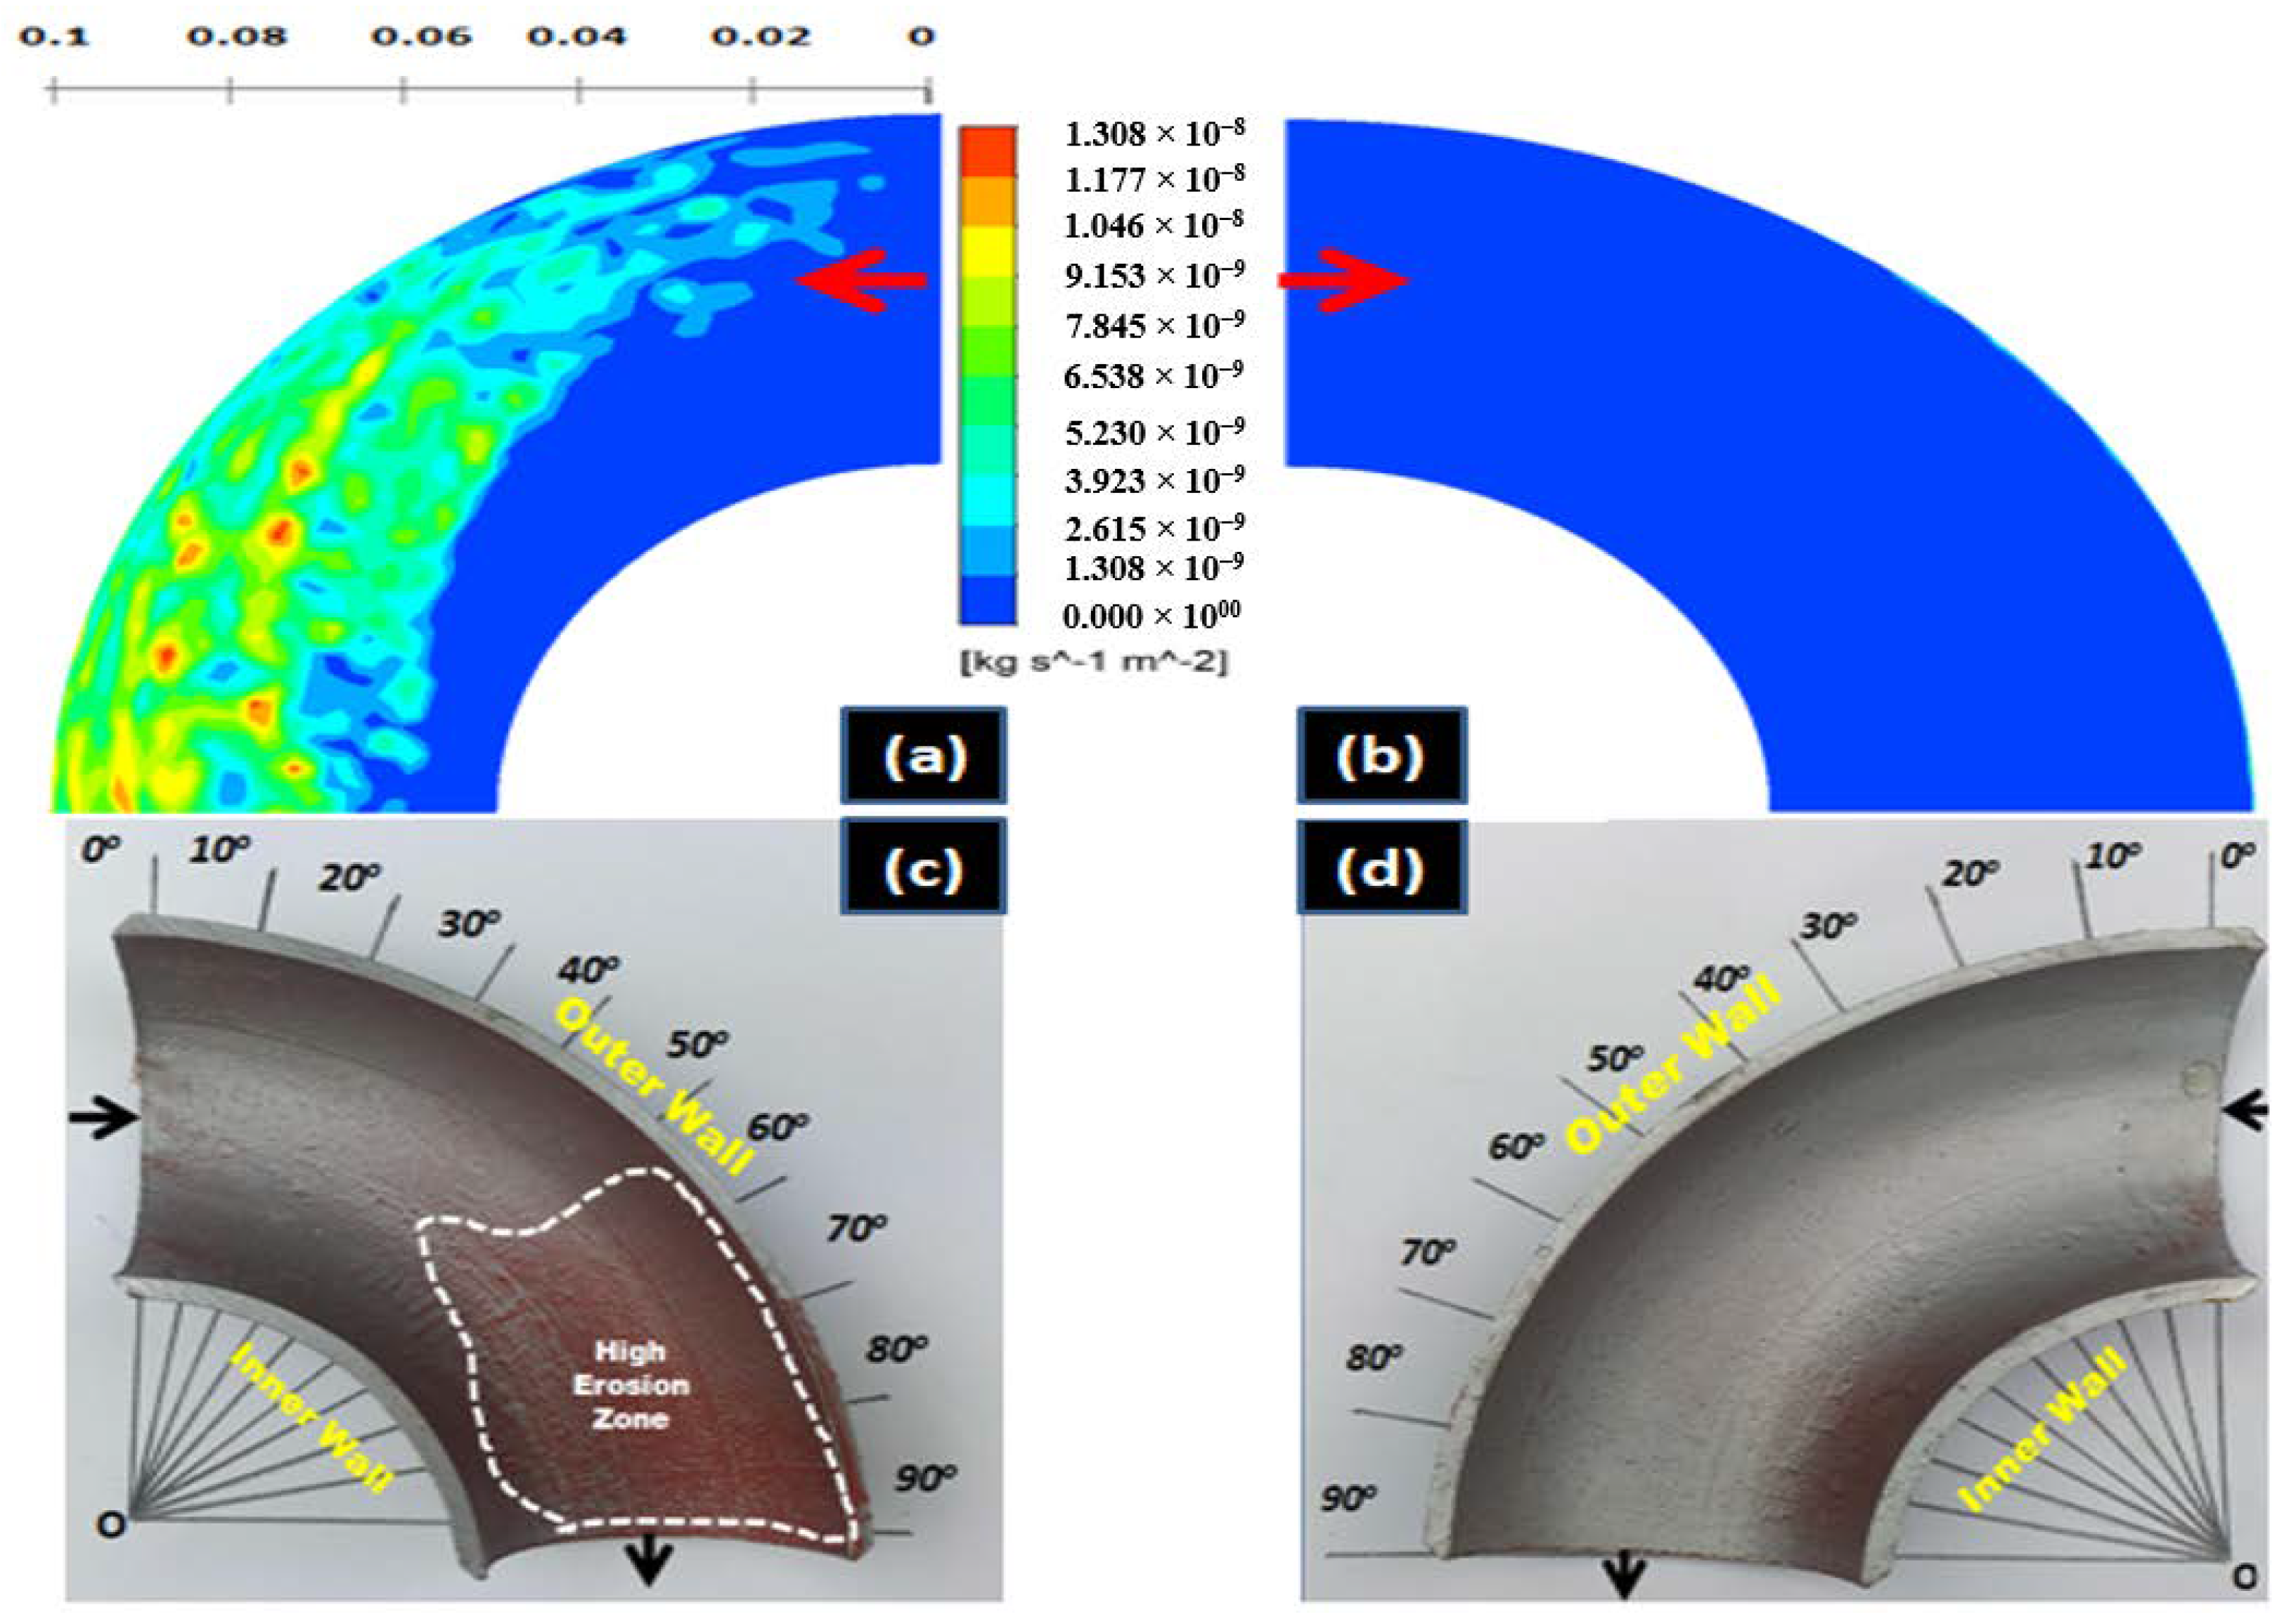
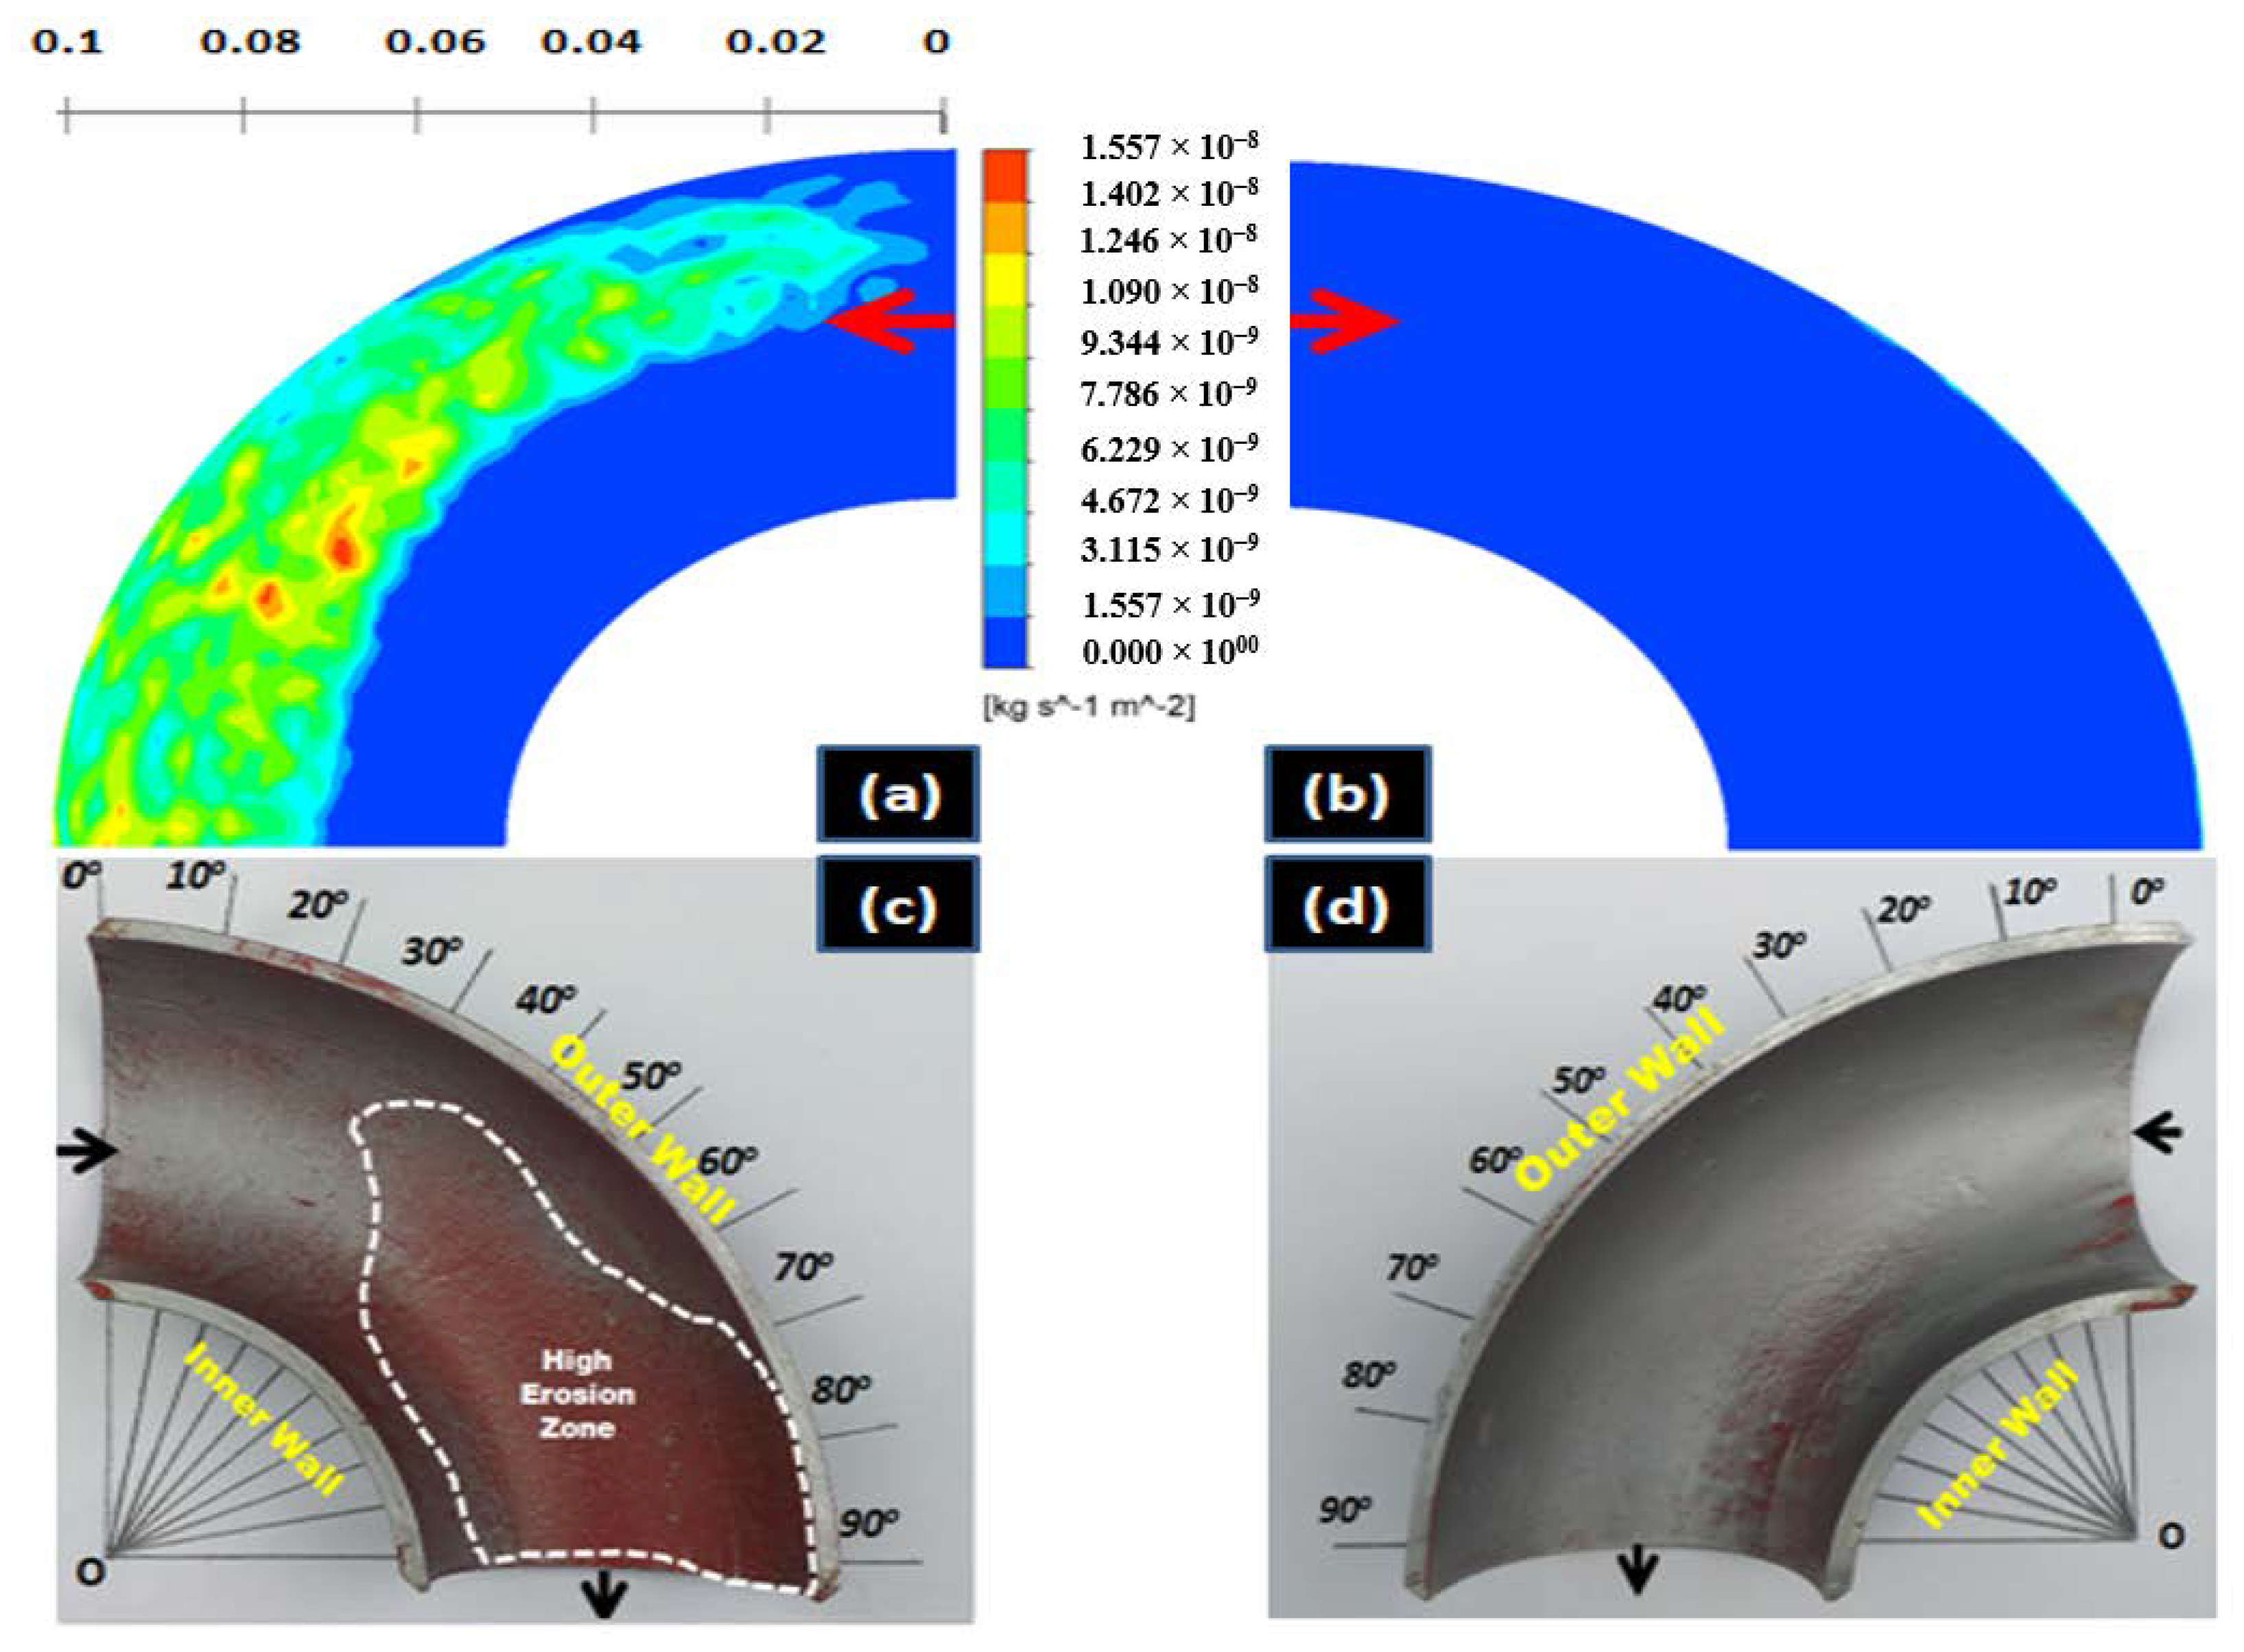
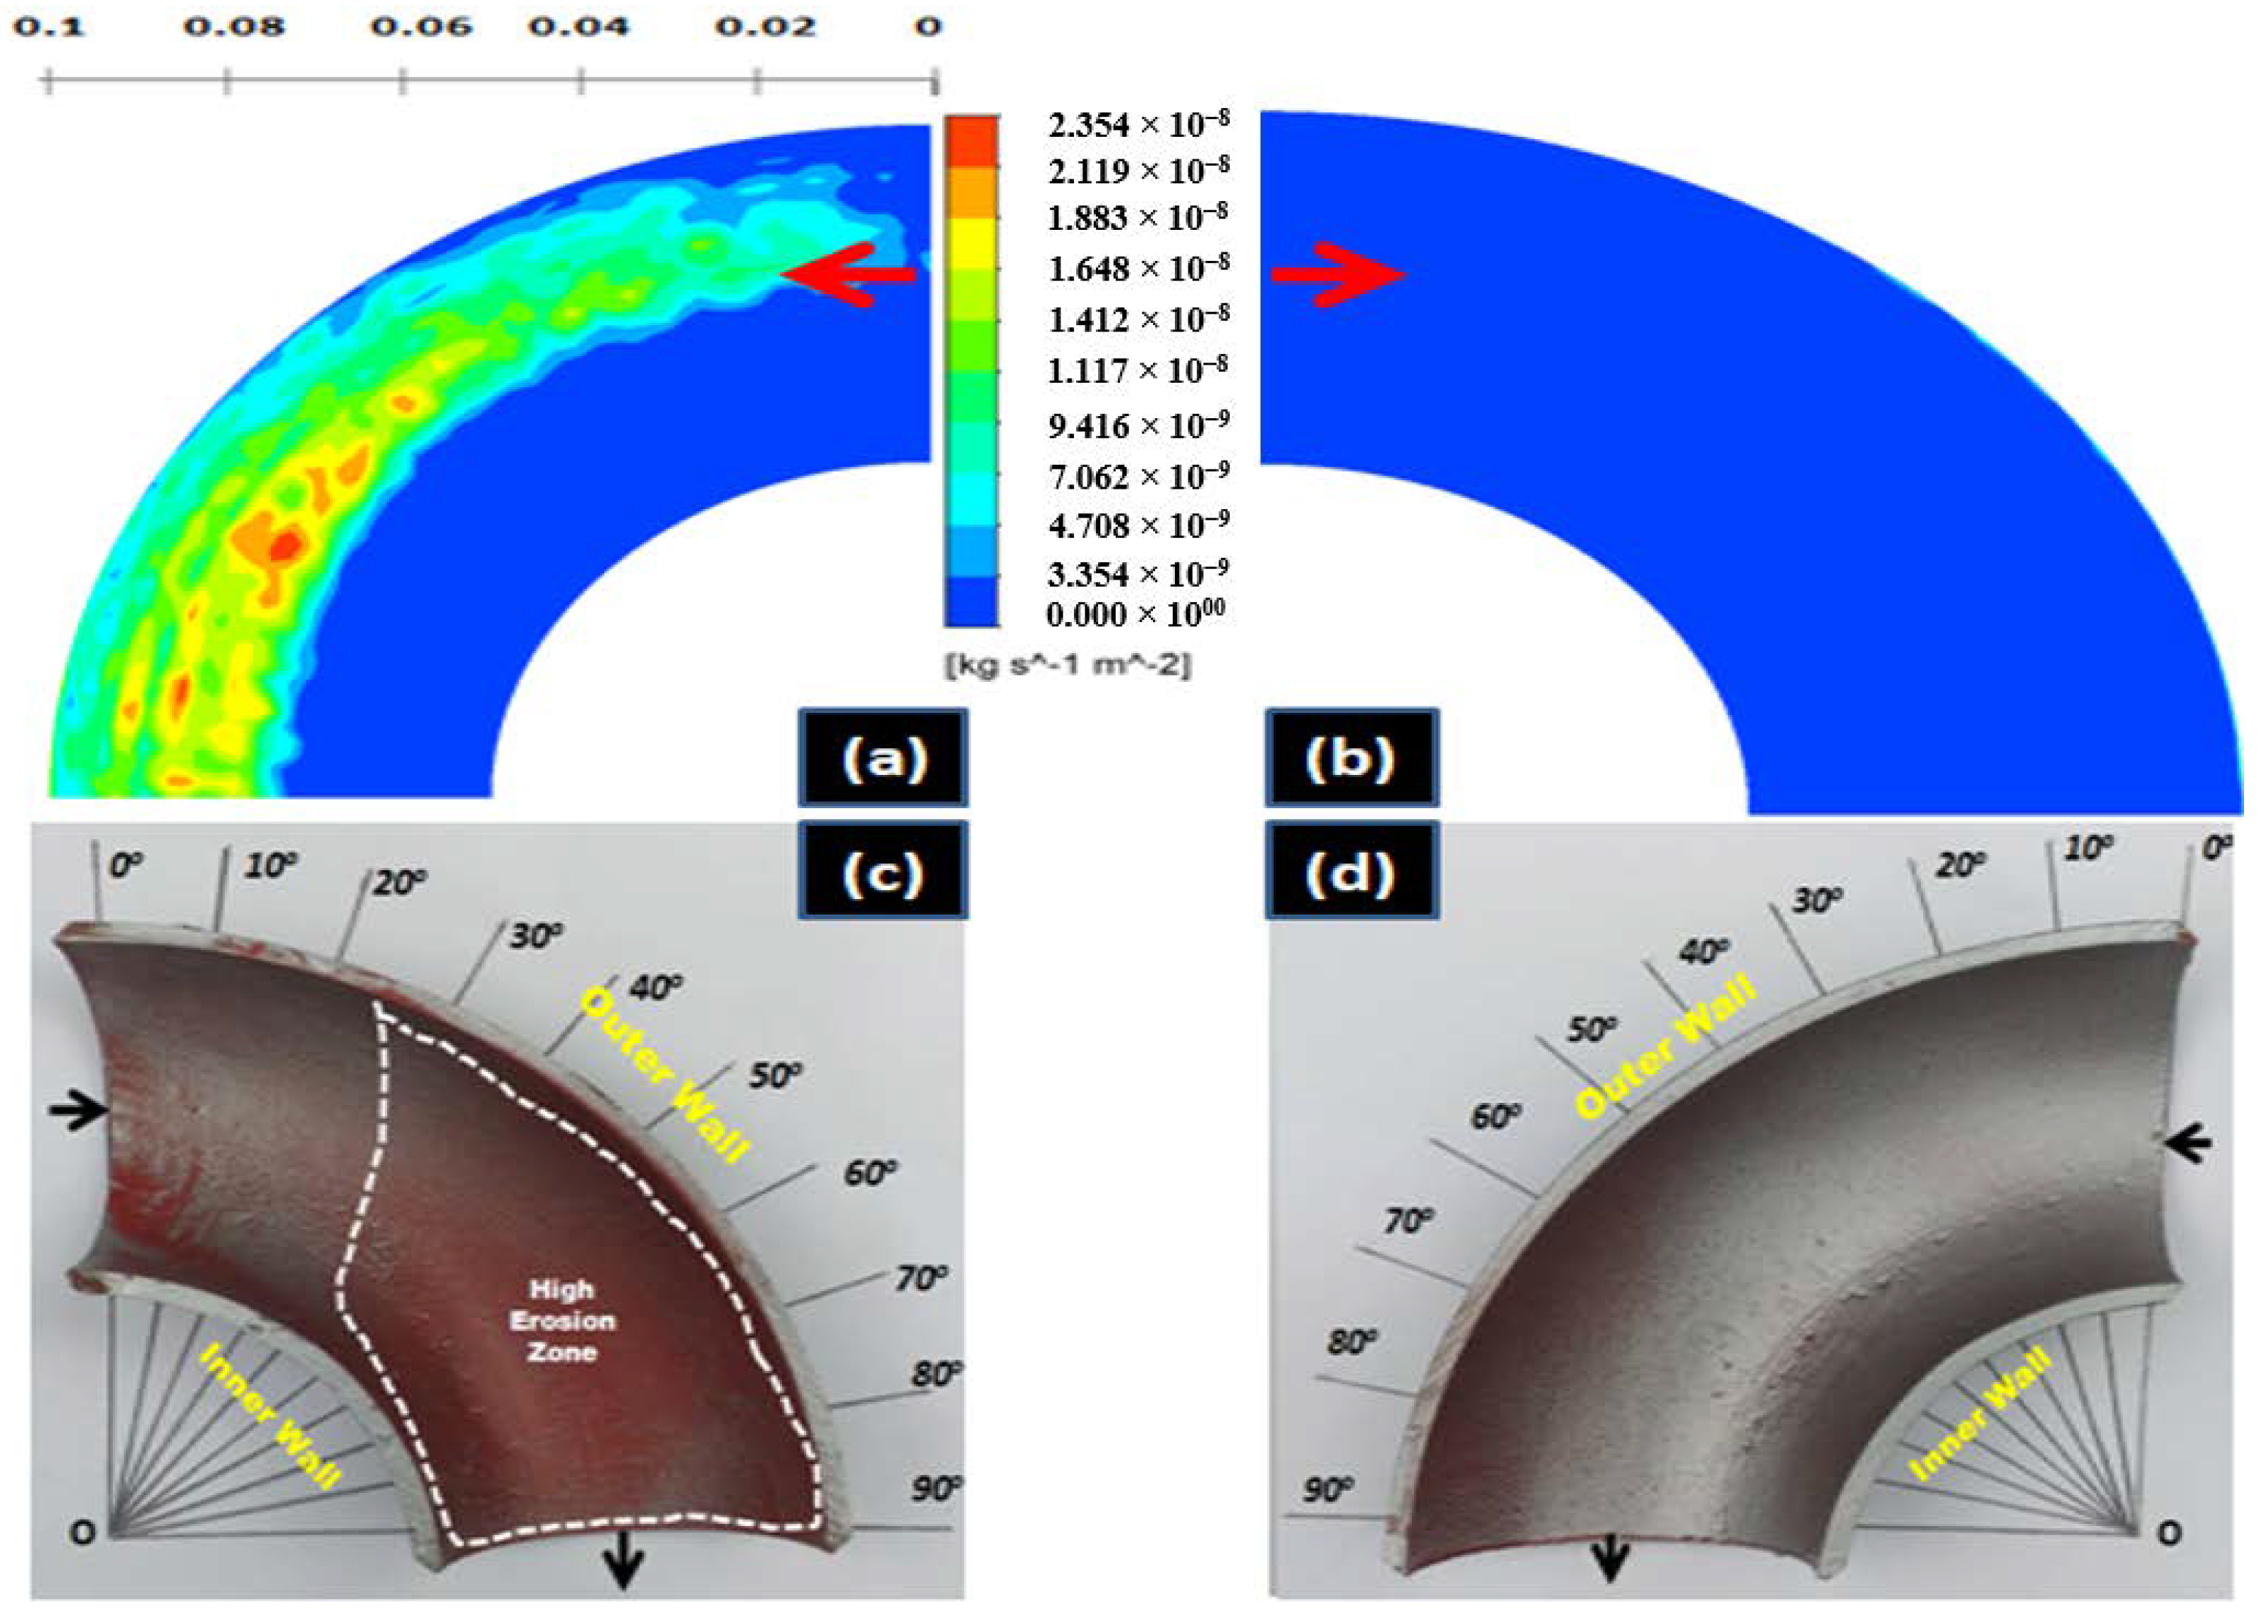
Figure 11, Figure 12 and Figure 13 present the comparison of extracted DPM erosion contour with MPM experiments of 90-degree elbow, for the slurry velocity of 0.5 m/s, 1 m/s and 2 m/s with 2 wt.% sand fines concentration in water. In slurry flow, the erosion distribution depends on carrier phase velocity, erodent size and a path followed by erodent particles towards the wall surface.
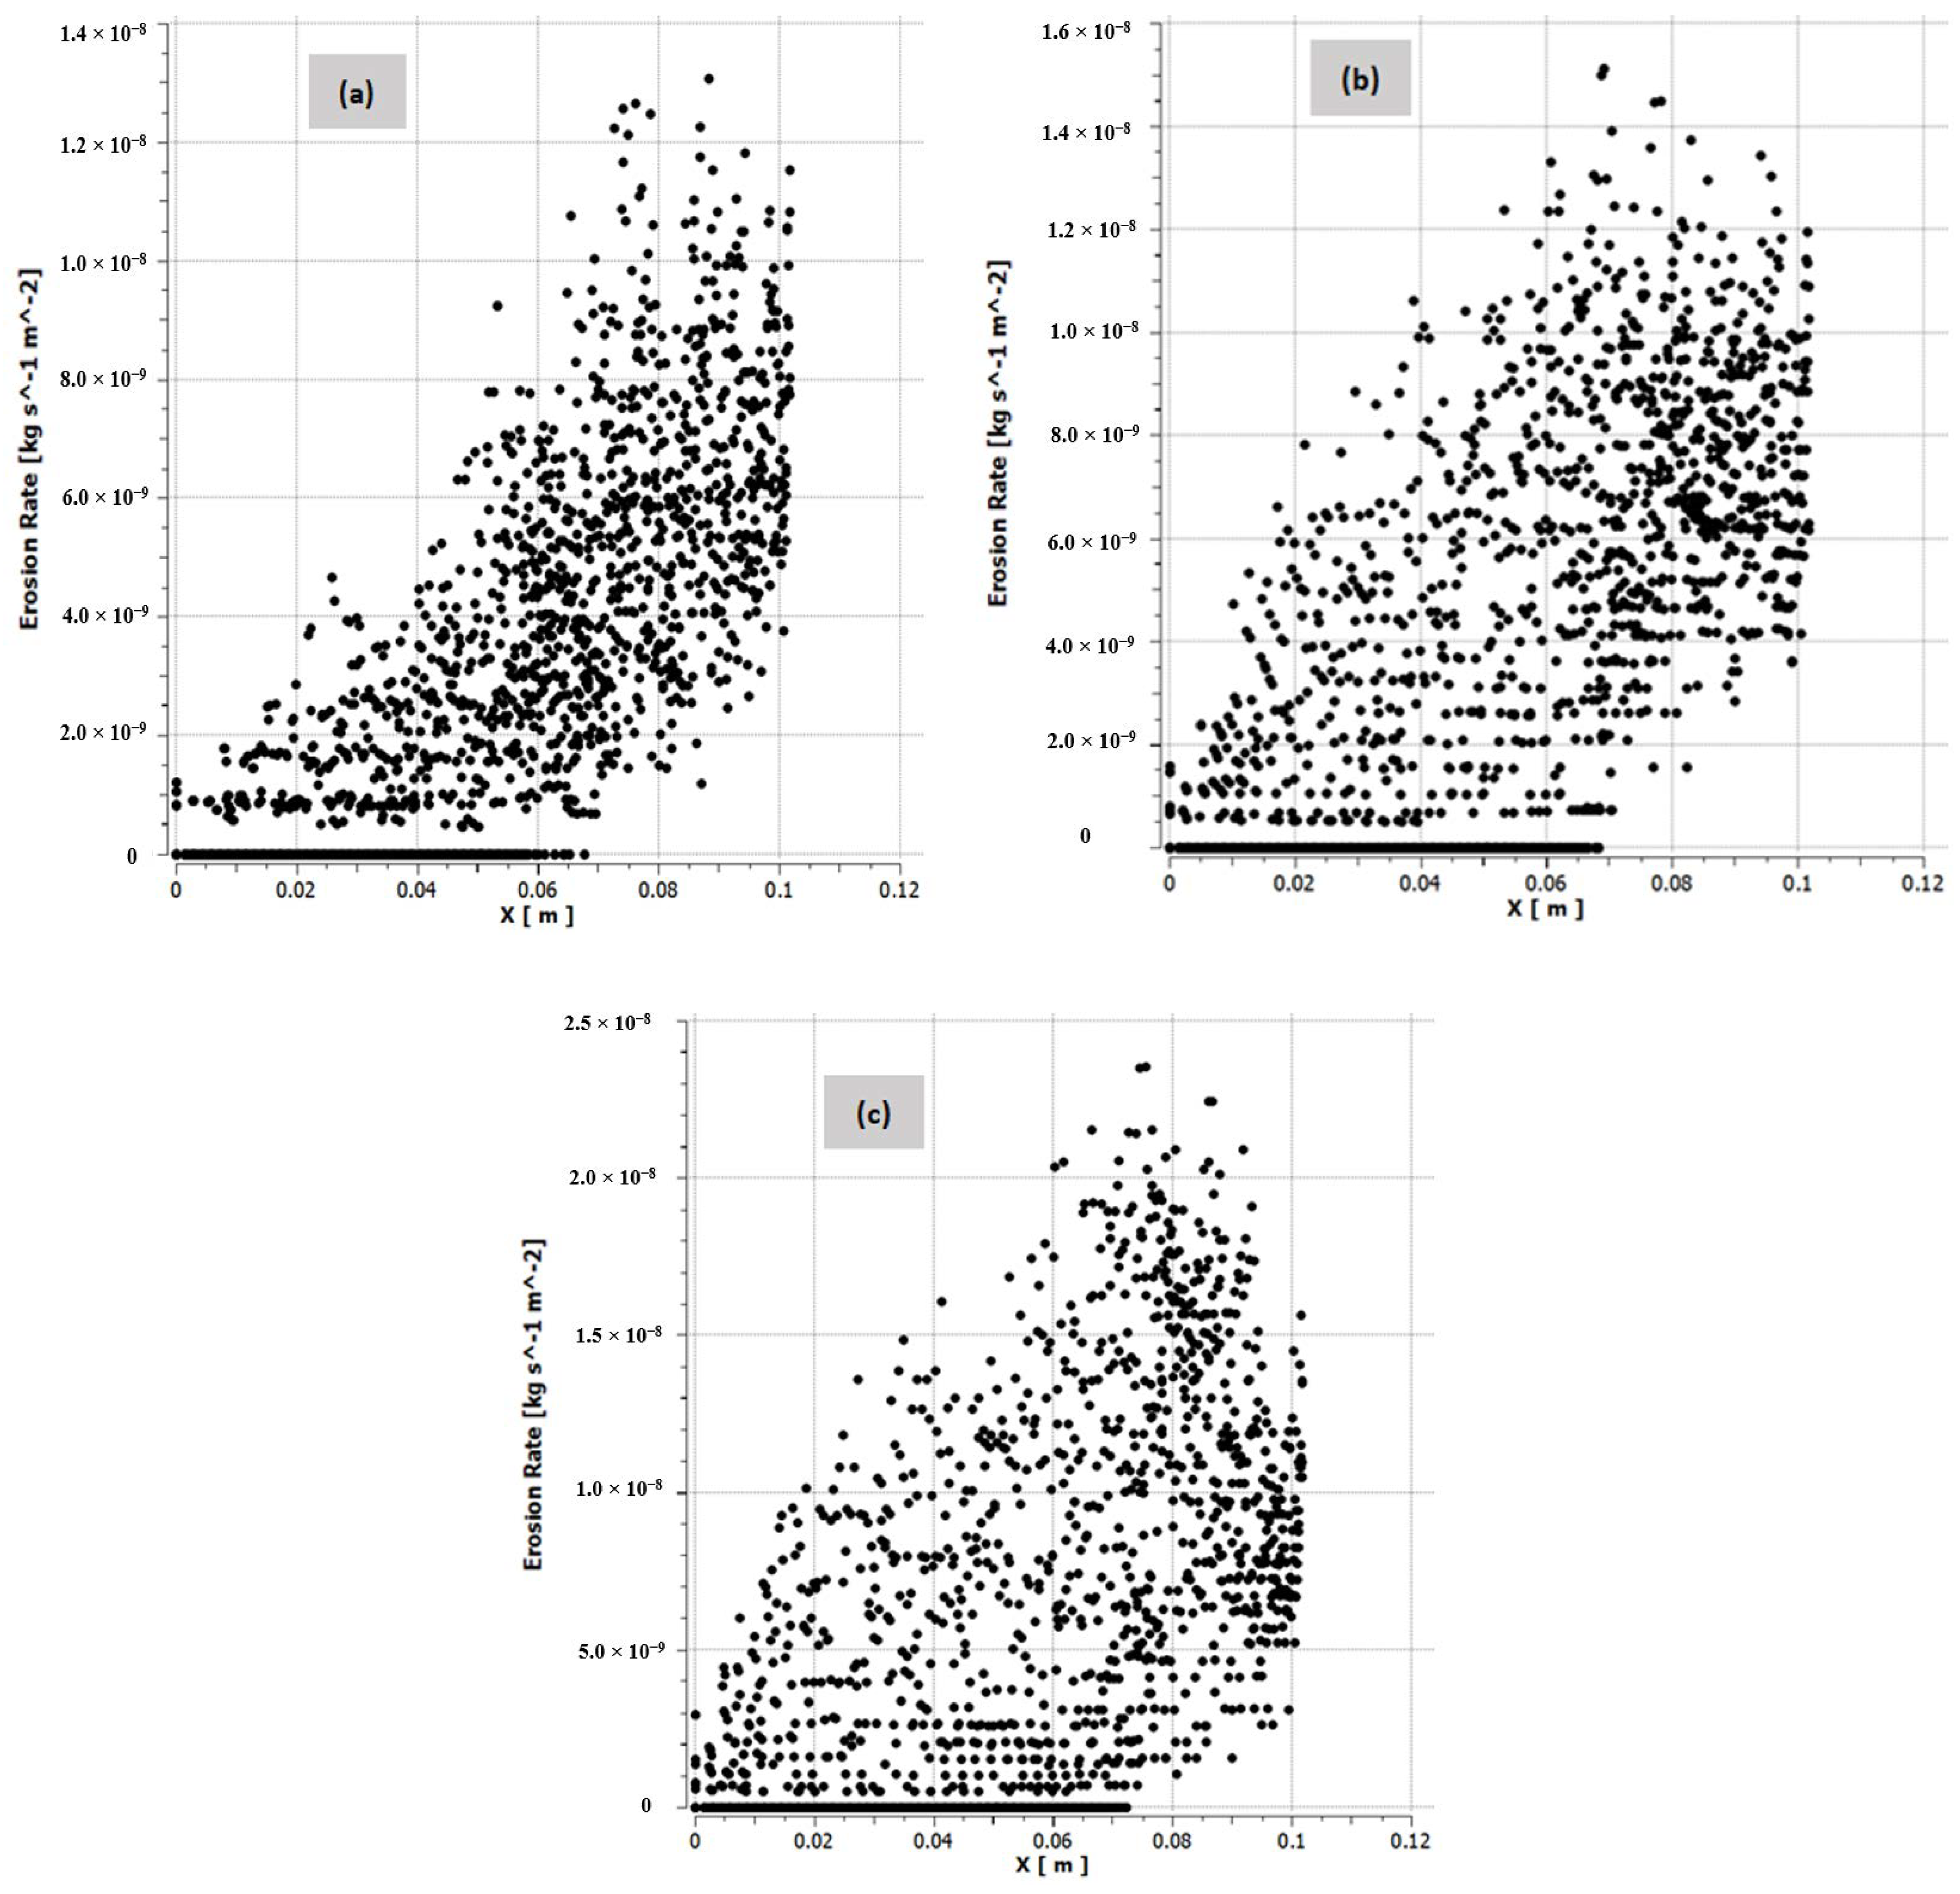
The erosion distribution detailed in Figure 14 was plotted between inlet X = 0 and outlet X = 0.1 m to understand the erosion behavior in the AISI 1018 carbon steel 90-degree elbows for different slurry velocities and the erosion rate of the elbow with the maximum erosive region. Figure 14 depicts for slurry transported at 0.5 m/s erosion peak occurs between location X = 0.06 and X = 0.1 m. The large erosive zone generated in the bottom elbow section for all flow velocities due to the increase of particle-wall interaction at high speed under gravitational force in the horizontal-horizontal orientation.
Figure 11, Figure 12 and Figure 13 display that the increase of flow velocity escalates the maximum erosion rate and erosion region. Also, the increase in flow velocity causes numerous particles-wall impacts with high kinetic energy and leads to maximum erosion zone on the elbow bottom wall surface. The MPM result demonstrates the (bottom half and upper half) patterns of paint removal for three sets of experiments with slurry velocities of 0.5 m/s,1 m/s and 2 m/s. All experiments and simulations were carried out in the horizontal orientation with 50 μm (mean size) sand fines. The maximum eroded region was where the elbow experiences the severe erosive wear; the downstream area about 60–90° at the bottom half section for flow velocity of 0.5 m/s. In contrast, the maximum eroded region for flow velocities of 1 m/s and 2 m/s was between axial angles of 30–90°. The erosive wear here incurs due to the cumulative impaction of sand fines as well as sliding due to gravitational effects present in the horizontal orientation.
The maximum erosion rate of 90-degree elbow was 2.35 × 10⁻⁸ kg/s-m2 located in the bottom section for 2 m/s flow velocity. The simulation results show that the maximum erosive zone at all flow velocities are located bottom wall and the reduction in erosion rate was observed for 1 m/s and 0.5 m/s transport velocity with a maximum erosion rate of 1.557 × 10⁻⁸ kg/s-m2 and 1.308 × 10⁻⁸ kg/s-m2 located in the bottom wall. Figure 14a, it can be seen that for 90-degree elbow with flow velocity 2 m/s when 0.08 < X < 0.1 the high erosive zone leads to a considerable increase in erosion rate and for 0 < X < 0.08, the medium erosive zone is created at the bottom wall.
Figure 14b clearly depicts at transport velocity of 1 m/s at 0.06 < X < 0.1 high erosive wear disintegrate bottom wall of the bend and for 0 < X < 0.06, the less erosive wear induced at the wall of the bend, in Figure 14c, for a slurry velocity of 2 m/s at 0.06 < X < 0.1 the high erosive wear with considerable high erosion rate is seen at the bottom wall, which is the most likely to cause wear and tear and cause bend wear failure. From this simulation study, it is clear that the flow velocity is primarily suspected of altering the erosion pattern. This can be observed in Figure 14. By comparing elbow erosion rate results show that the slurry velocity of 2 m/s is approximately 1.8 times more erosive compared to 0.5 m/s and 1.51 times in comparison to 1 m/s flow velocity. Refer Figure 14b,c, the erosion rate is maximum between location X = 0.06 m and X = 0.1 m under the slurry velocity of 1 m/s and 2 m/s at downstream. Although a slight divergence trend of erosion distribution was seen in Figure 14a, slurry velocity 0.5 m/s had associated maximum erosion between X = 0.08 m and X = 0.1 m adjacent to the outlet of 90-degree elbow. However, the simulation results and MPM experiment also show that the slurry velocity has no decisive effect on the peak erosive zones. Moreover, the erosion zone observed with an MPM in the bottom and on the elbow extrados is associated with the sand fines trajectories.
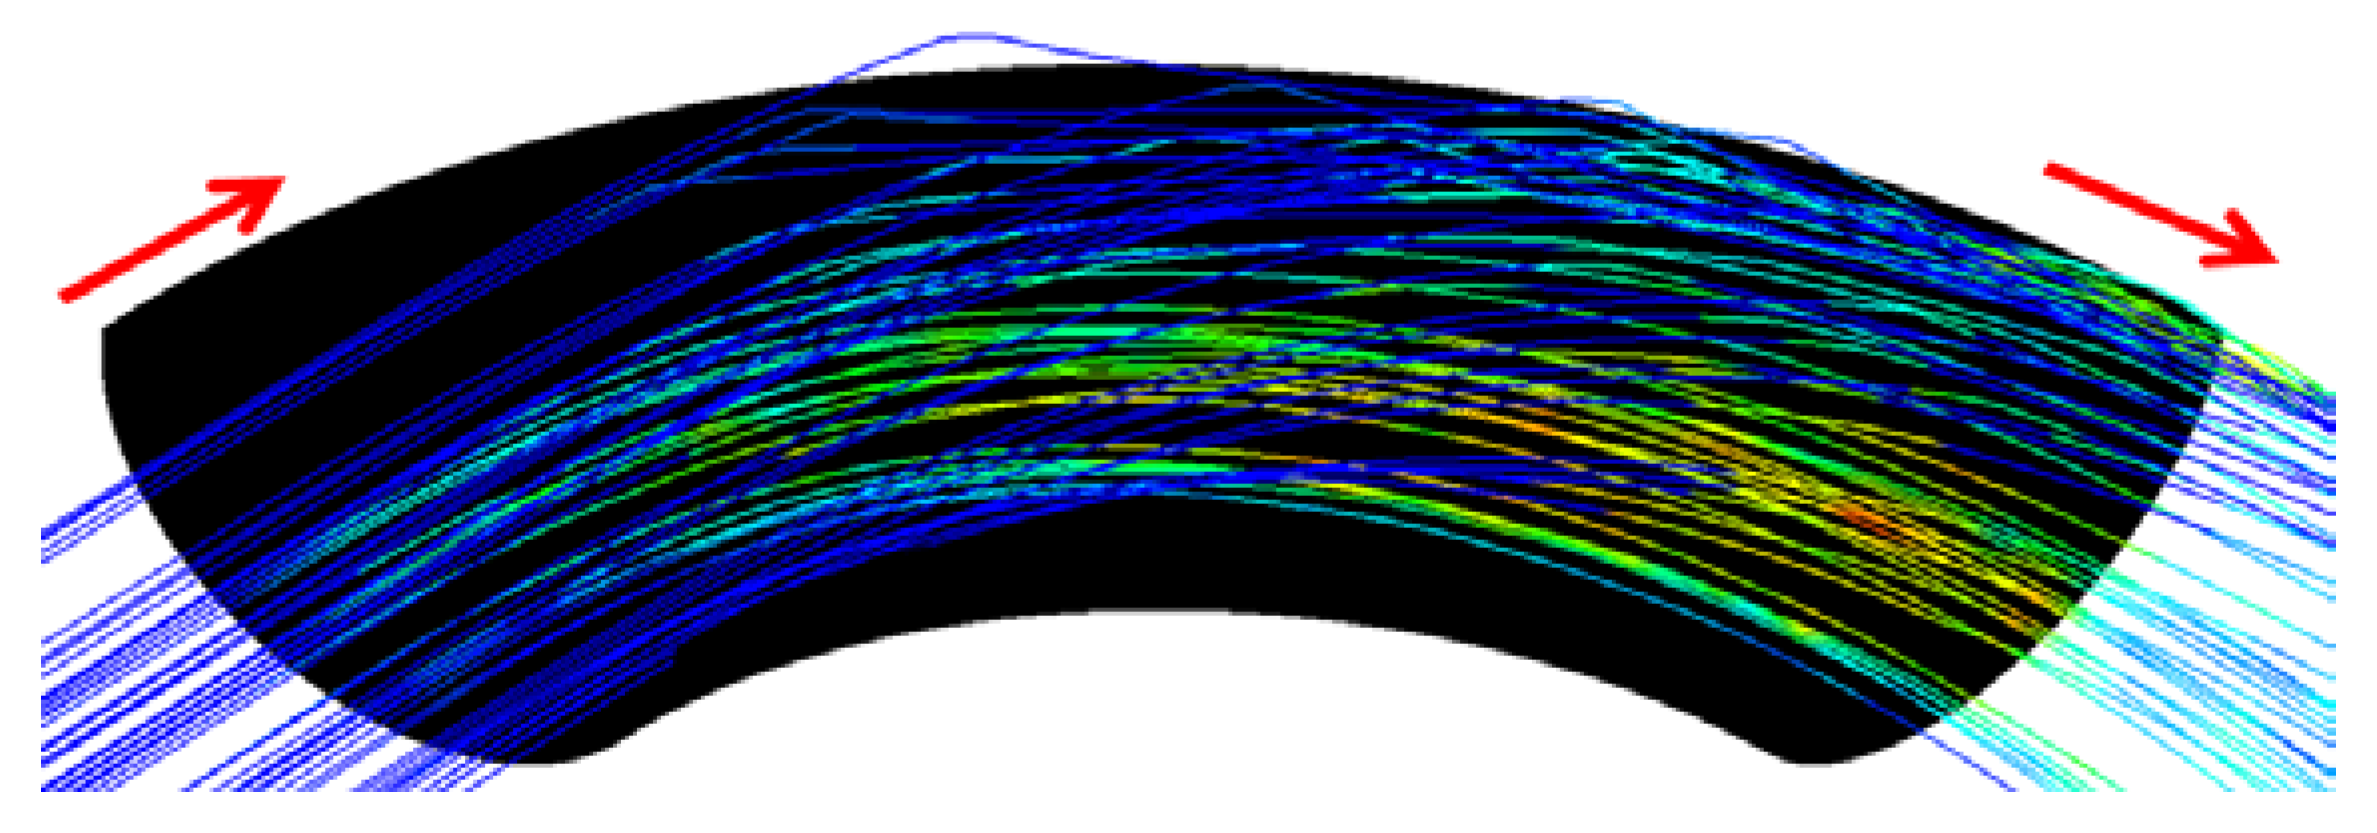
To further understand the particle-wall interaction at downstream, the path of sand particle transported through 90-degree elbows was extracted. Based on the path followed by a sand particle in Figure 15, some conclusions were drawn: the zone of peak erosion generated downstream was the result of a re-directed particle path towards the elbow exit section. Cumulative mechanisms of sliding wear and the redirected particle at the bottom half (BH) section caused the maximum erosion downstream near the outlet of the elbow, consistent with findings reported by other authors [2,26]. The slurry flow in the elbow aggravates the flow turbulence and thus increases the mass transfer and enhances the degradation rates. This corresponds to the pattern observed in the DPM and MPM since the kinetic energy pertains to dispersed phase mass and transport velocity of the dispersed phase. This simulation result trend is identical to the MPM observations in terms of the overall particle impaction location. However, the MPM results clearly show the trace of particle impaction at the inner wall of the elbow pipe. In comparison, the CFD-DPM contours do not accurately predict impaction location at the inner wall.
Another observation from the DPM and MPM study reveals that for the identical flow, as slurry velocity escalates from 0.5 m/s to 2 m/s, sand fines on the bottom section redirects towards the upper section outer wall. As a result, the outer wall of elbow inferred maximum particle wall impaction due to entrained sand fines that are mostly concentrated adjacent to the outlet regardless of the transport velocity changes. This anomaly stipulates that the elbow displays perceptible local erosive wear characteristics. The 90-degree elbow configuration experienced high erosive wear as the flow velocity increased and induces more serious damage [27,28]. The high erosion zone identified by the CFD-DPM method matched closely with visual inception from flow loop experiments.

4.3. Identification of the Erosion-Corrosion Regions Using SEM

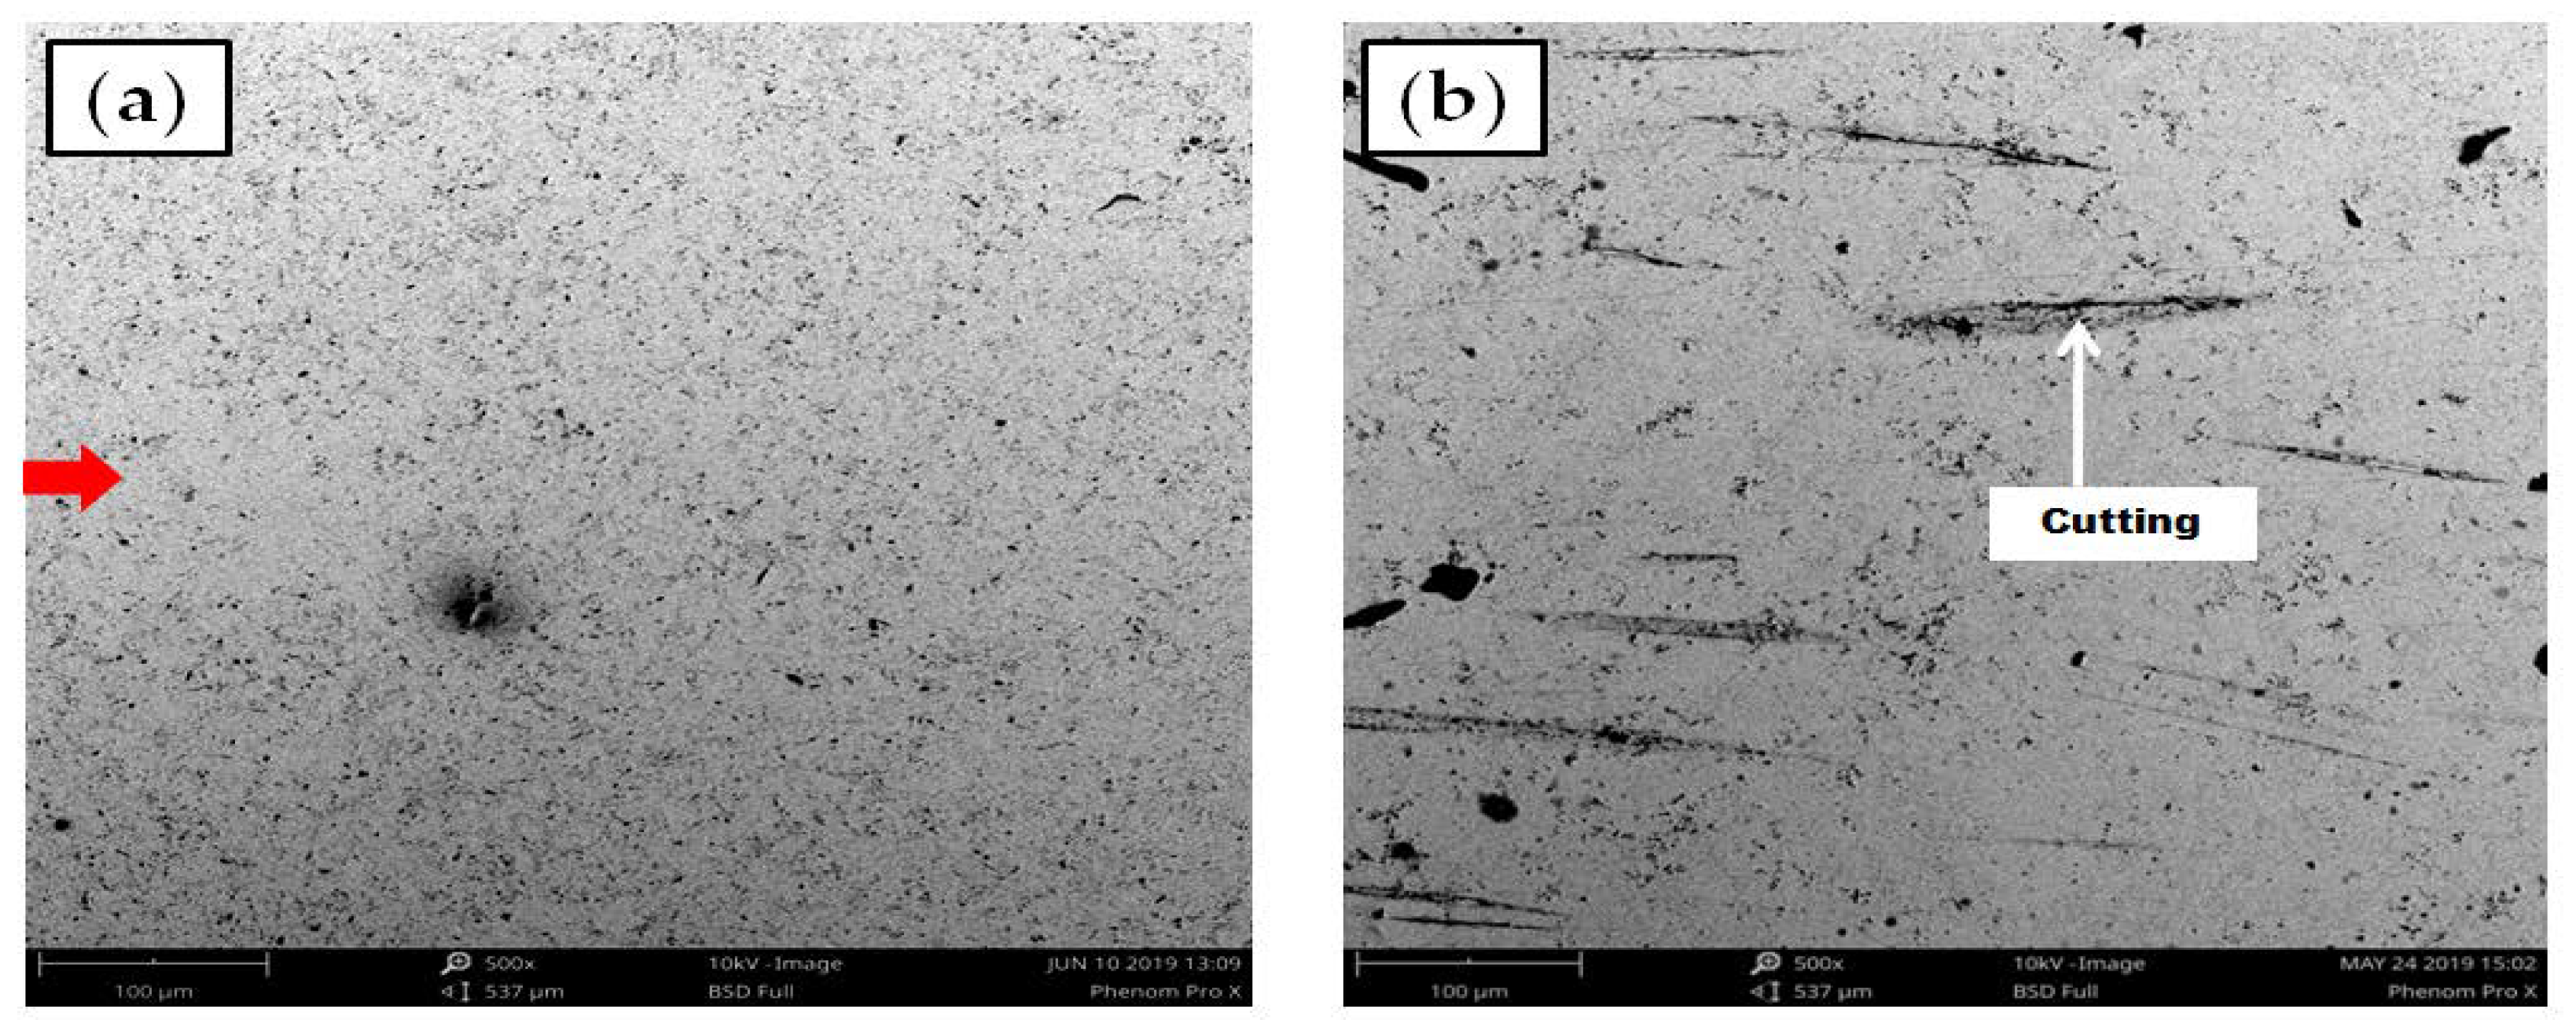
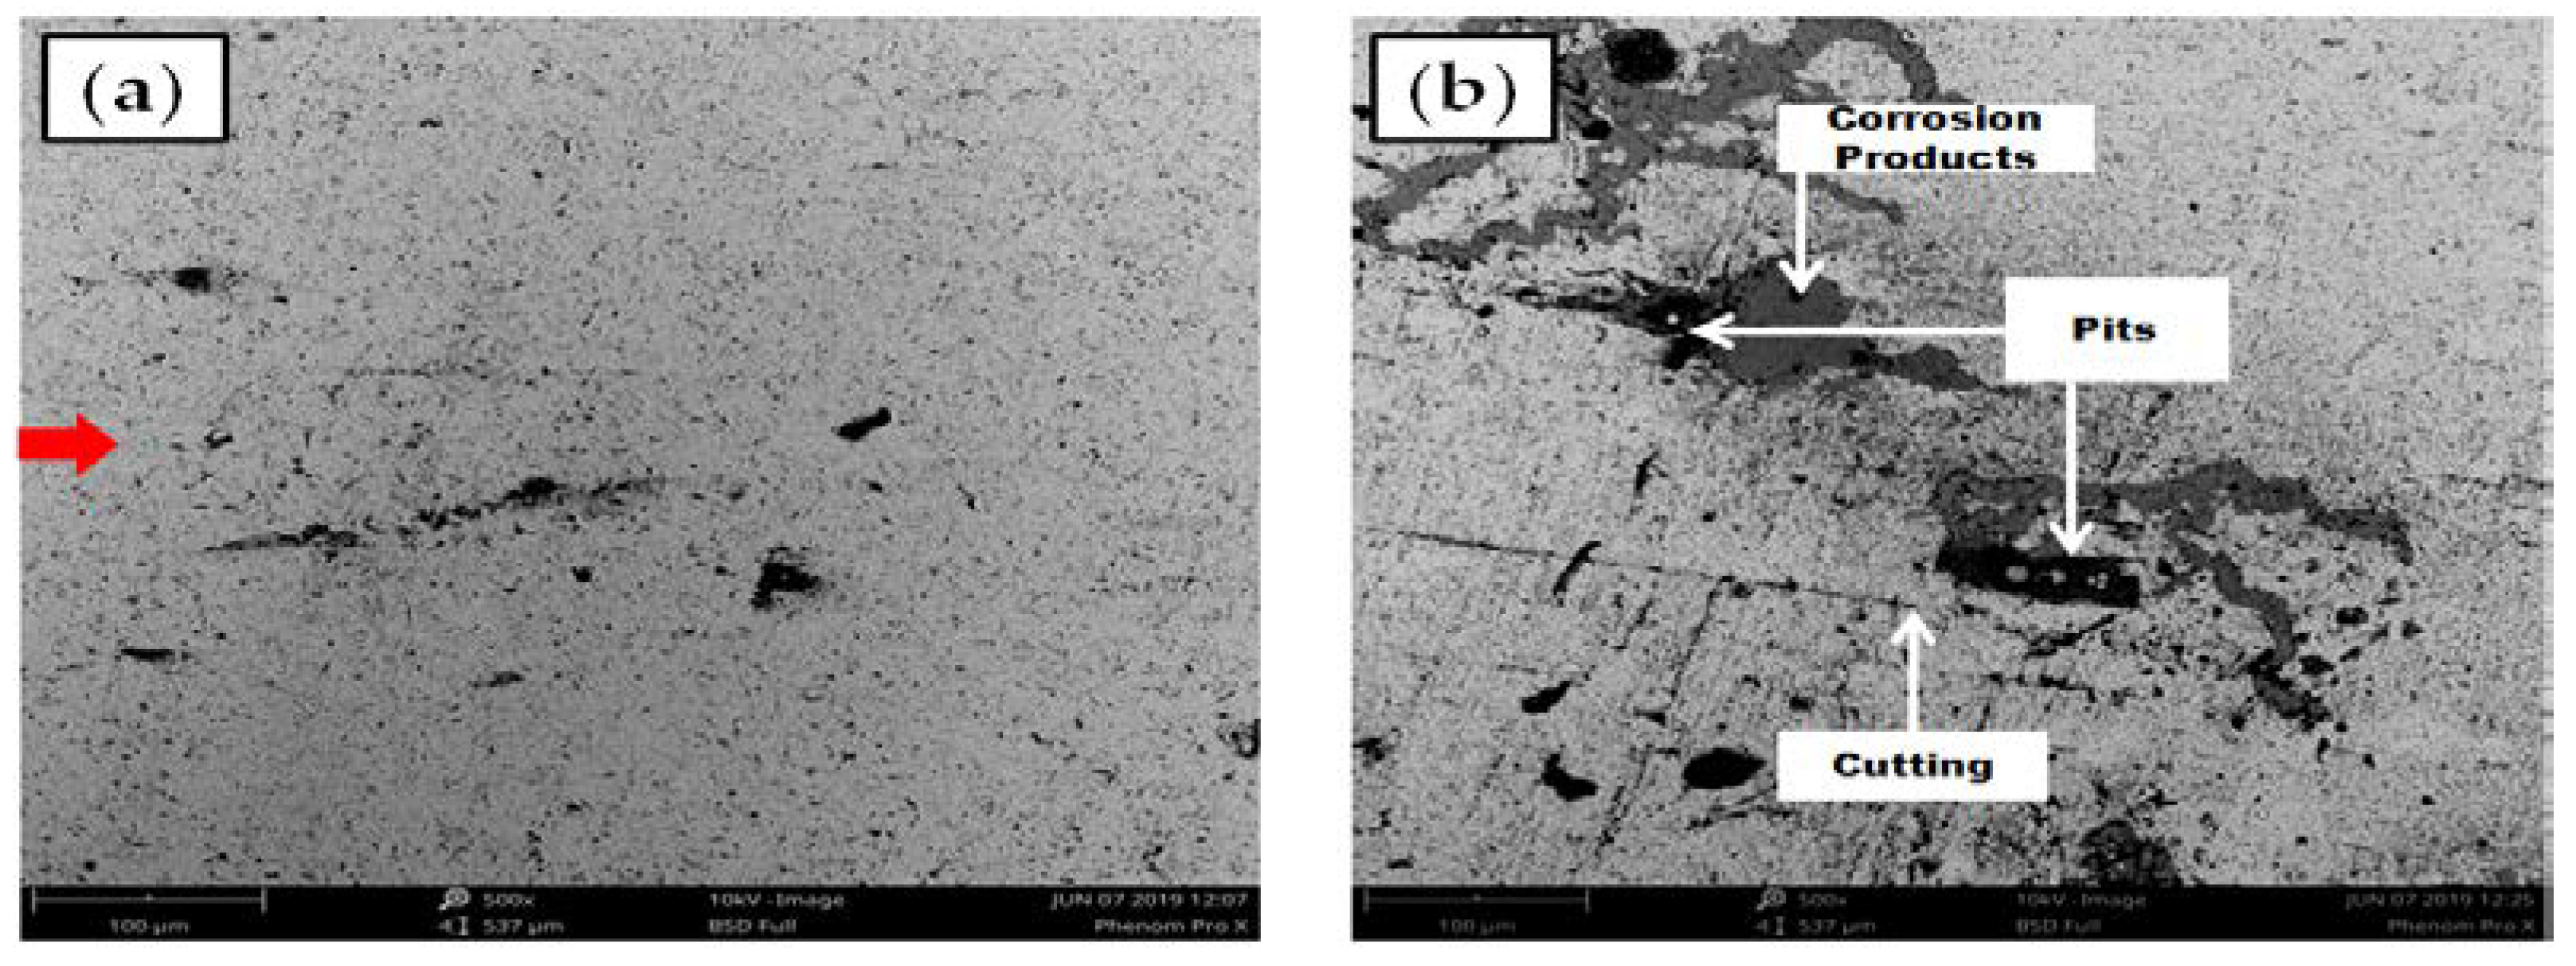
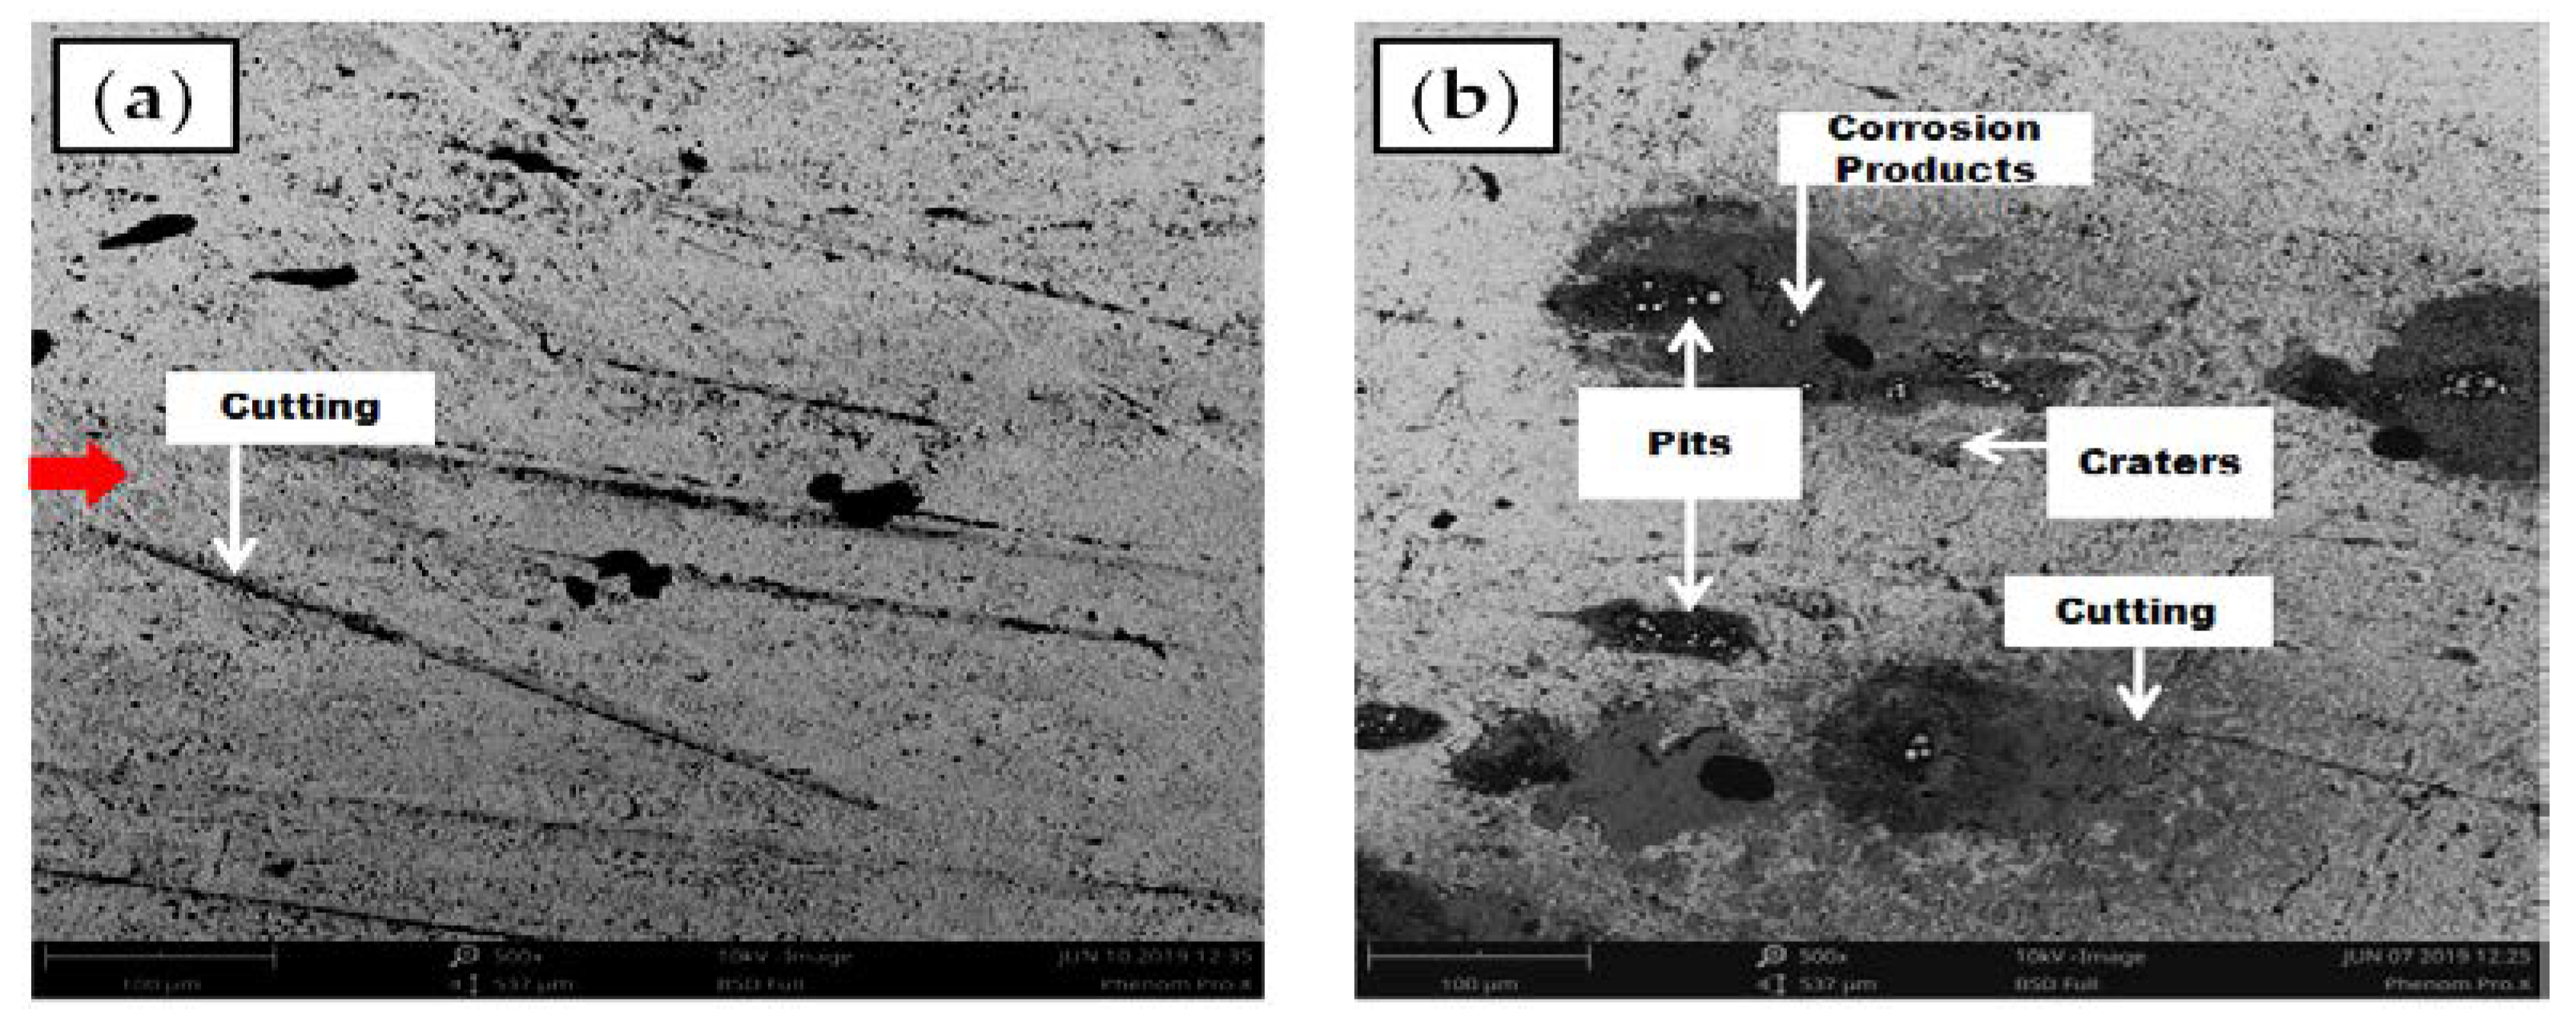
To qualitatively study the influence of sand fines transportation velocity on erosion-corrosion, the SEM images of the inlet and outlet section of 90-degree elbow internal walls were analyzed using a Phenom ProX and the sample images of the upstream and downstream section after the 60 h test are shown in Figure 16, Figure 17 and Figure 18. For SEM, the specimens were cleaned with ethanol, dried with a heat gun, to remove sand fines deposits after the erosion-corrosion test. Figure 16, Figure 17 and Figure 18 show the resulted images containing normal pits, erosion scars and corrosion attack on the elbow internal surface for different flow velocities at inlet and outlet after SEM analysis. It can be seen from Figure 16, Figure 17 and Figure 18 as the slurry velocity increases, the erosion-corrosion of 90-degree carbon steel elbow become more severe at the outlet with larger erosion-corrosion damage seen toward downstream for a slurry transport speed of 2 m/s as collated to lower flow velocities.
Microscopic images demonstrate that the erosion-corrosion pattern at the inlet and outlet sections of the elbow is not identical. Multiple impacts of sand fines at the bottom wall of the elbow generate scratches and ensue plastic deformation in the downstream section. Furthermore, plastic deformation resulted in work-hardened layer formation and makes the elbow internal surface highly vulnerable to corrosion [29]. Moreover, the wide traces of corrosion attack, pitting and cutting action were identified downstream when the elbow was impacted with high slurry velocity. It must be noted, the number of pits increased as the slurry velocity increased. However, the damage originating from the low sand fines velocity seem did not propagate through the substrate and did not lead to severe damage. SEM analysis also confirmed the change in the pit’s development mechanism with an increase of sand fines transport velocity. The results clearly indicate at 1 m/s transport velocity the pits perforation sites were elongated in the flow direction (Figure 17b) which is the sign of low angle particle impaction at escalated speed. With an increase in velocity to 2 m/s both elongated and circular pits propagation (Figure 18b) clearly visible after the test which may indicate low and high angle particle impaction. A closer descry at the worn surface manifests that in addition to the pitting, the elbow outlet section at 2 m/s flow velocity is composed of contiguous impact craters which are evidence of plastic deformation due to the sand fines impactions.

4.4. Mass Loss

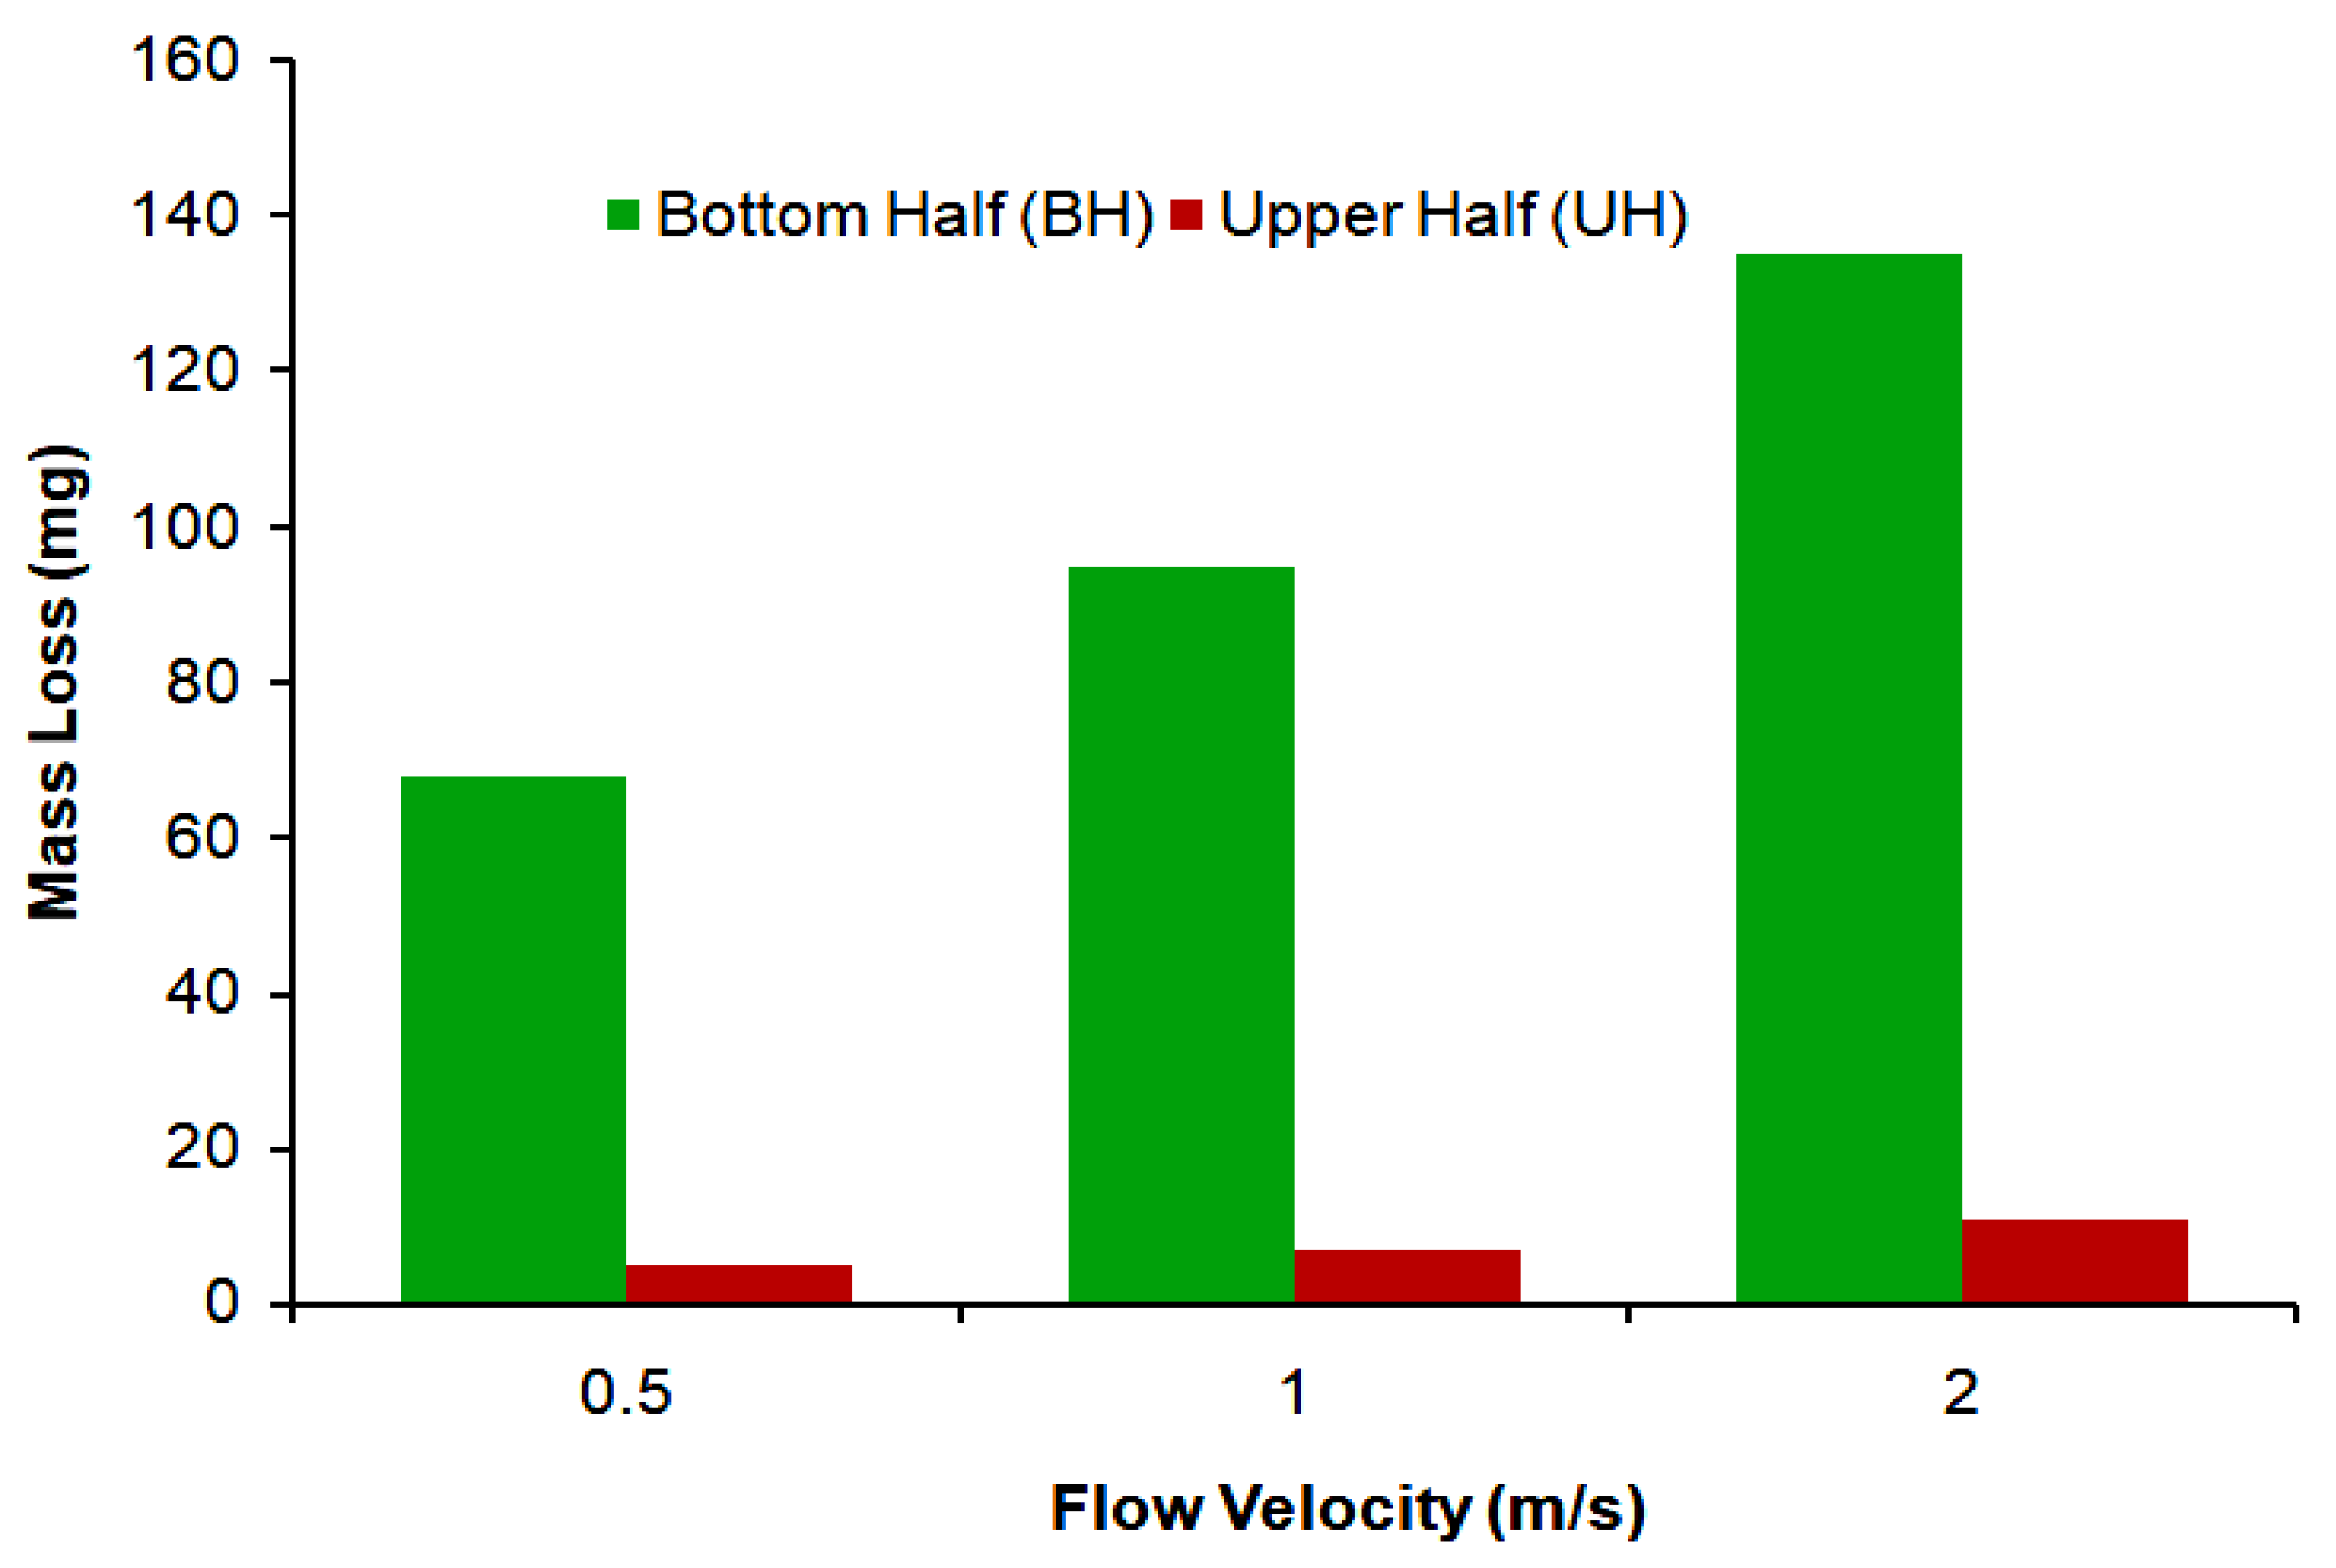
After the erosion-corrosion with different flow velocities, the mass loss after 60 h test time in the BH and the UH section of the elbow is shown in Figure 19, respectively. In general, for high particle velocities, the kinetic energy and impact force of the particles are greater and result in more severe the erosion [30] but it can be seen from Figure 19 the mass loss of the BH and the UH section of the 90-degree elbow significantly increases with the escalation of slurry velocity at the same time and resulting in greater mass loss. The mass-loss rates differed for the BH and UH section of the elbow between 68 and 135 mg for the BH, between 5 and 11 mg for a UH section at a slurry speed of 0.5, 1 and 2 m/s as outlined in Figure 19. The mass loss of the elbow escalates with increasing flow velocity due to the increase of particle-wall interaction under turbulent conditions because the erosion of the bend by the particles is mainly concentrated in the flow fields. The slurry transportation velocity through the 90-degree elbow strongly influences the severity of the material loss rate. The experimental results obtained by mass loss analysis show a linear increase with flow velocity with a maximum mass loss was observed when the elbow specimen was subjected to a transport velocity of 2 m/s. It is inferred that eroded mass increased at high slurry transport velocity. This can be ascribed to an escalation of kinetic energy, resultantly increasing the material disintegration rate from the elbow wall.
A substantial increase in mass loss rate up to 2 times can be observed in a 90-degree elbow configuration when slurry flow changed from 0.5 m/s to 2 m/s. However, it was elucidated that the mass-loss rate increased approximately 1.4 times with an increase in slurry recirculation from 0.5 m/s to 1 m/s as shown in Table 5. The result of the eroded mass trend in elbow configuration is reconcilable with the measured results in the literature [14]. The peak erosion-corrosion rate manifested in the bottom half (BH) section due to horizontal-horizontal elbow configuration. Moreover, the elbow upper half (UH) section experiences minimal weight loss compared to the bottom half (BH) elbow section. Hence it can be concluded that the bottom half (BH) of the elbow section, sand fines slide around the elbow internal wall. Consequently, these particles cause erosion and impact the bottom half (BH) of the elbow with high velocities and angles due to the presence of gravitational force in horizontal-horizontal orientation.
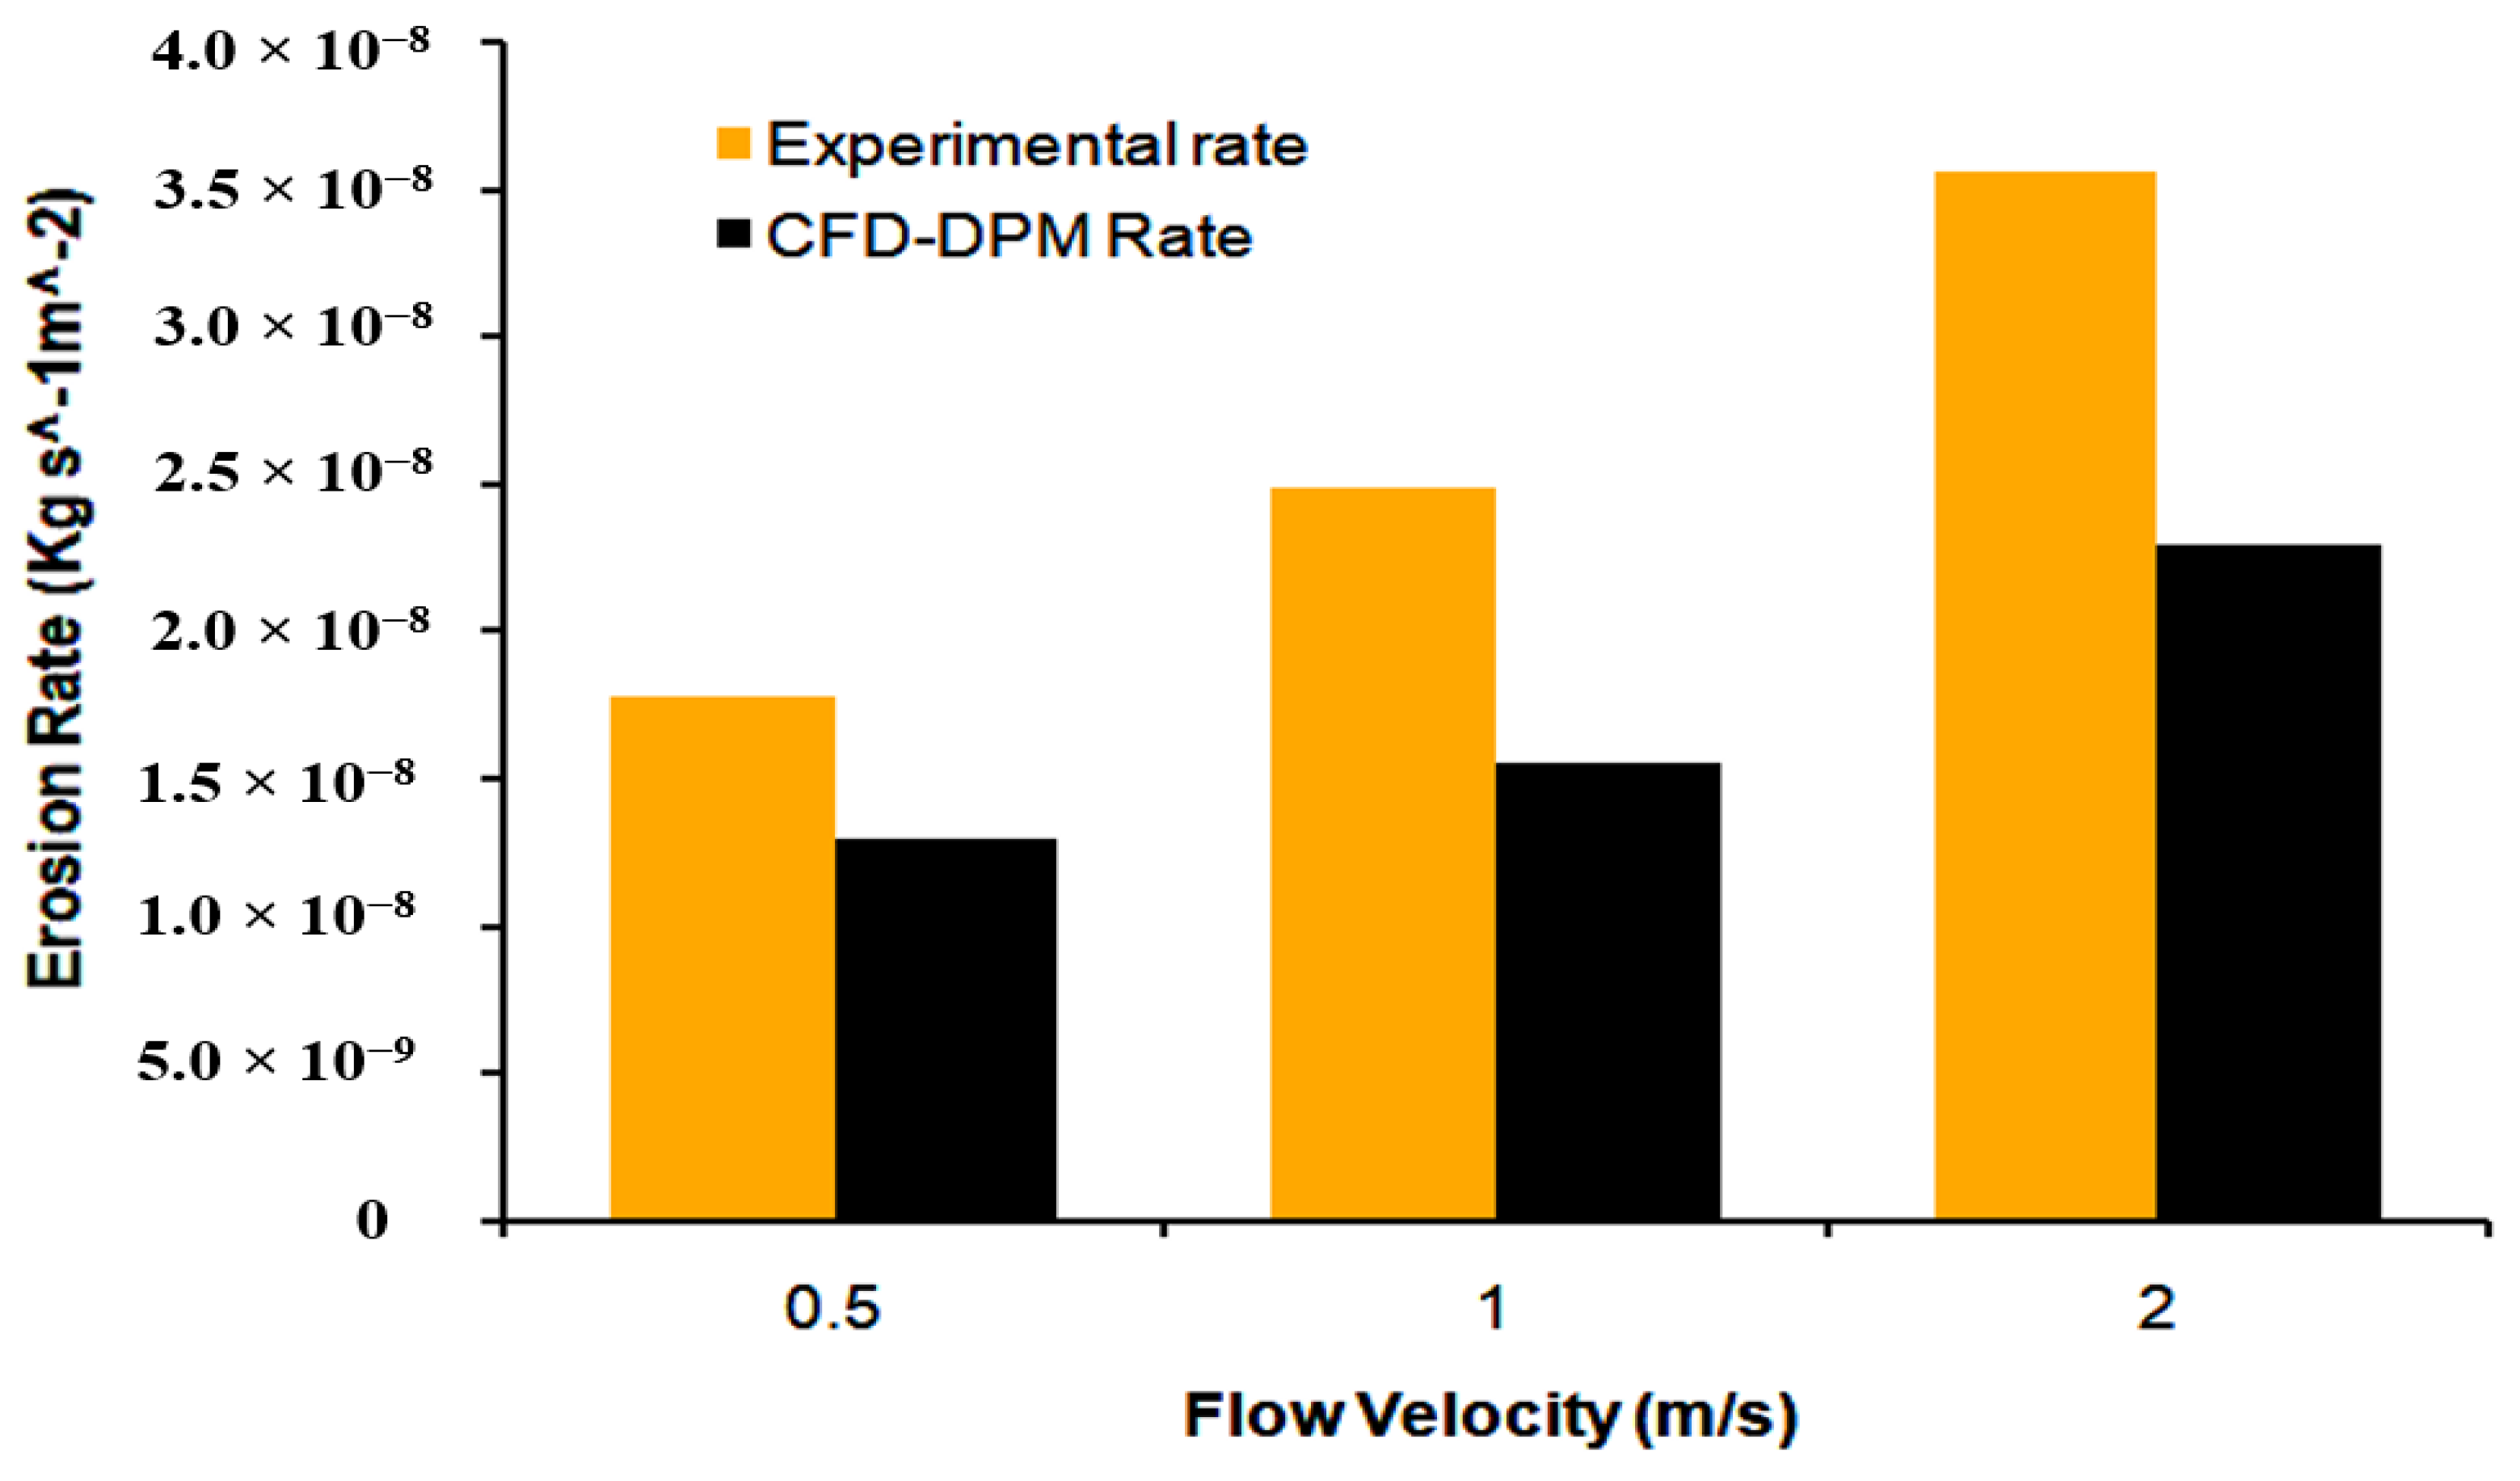
For a confrontation with the DPM simulation result, the quantified erosion-corrosion rate at different slurry velocities, specified as kg/s-m2, is outlined in Figure 20. The CFD-DPM results concur qualitatively with the MPM erosion pattern; however, quantitatively the mass loss rate calculated by the Oka erosion model was less compared to the mass loss rate obtained through the experiment. Another point to mention is that the CFD-DPM model takes no account of the corrosion interaction during the erosion simulation which may underpredict the erosion rate. Moreover, the quantitative agreement was quite reasonable. Another observation from the MPM study reveals that for the identical flow, as slurry velocity changes from 0.5 m/s to 2 m/s, sand fines on the bottom section redirects towards the upper section outer wall. Consequently, the outer wall of the elbow inferred maximum particle wall impaction due to entrained particles that were mostly concentrated near the outlet. The erosion-corrosion damage increase with the escalation in slurry transport velocity with maximum particle impaction adjacent to the outlet, which is consistent with the observations found in the literature [2,14,15].

5. Conclusions

The erosion-corrosion characteristics of a 90-degree long radius AISI 1018 carbon steel elbow were analyzed by multilayer paint modeling, mass loss analysis, SEM and CFD-DPM coupling methods. The influence of sand fines transport velocity on the erosion-corrosion rate was investigated by a closed-loop flow experiment. Meanwhile, the simulation results of DPM erosion were collated with the experimental erosion-corrosion rate. The conclusions drawn from the current research can be outlined as follows:
Changes in the sand fines transport velocity alter erosion distribution and escalate particle-wall interaction and transform particle impact angles from low to high, therefore, enhance the erosion rate. In addition, the transport velocity has not significantly influenced the location of the peak erosion zone; however, it enhances the degradation rate with transport velocity escalation.
  • The eroded pattern of 90-degree elbows indicates that the erosion-corrosion mechanism alters with flow field conditions. The pitting and cutting action increased at high transport velocity, showing an ascent in kinetic energy of the dispersed phase. The results also indicate the signs of low and high angle particle impaction at 2 m/s flow velocity which may contribute to the development of elongated and circular pits on elbow internal surface.
  • In liquid-solid flow, the erosion-corrosion rate weighs more in the bottom half section as compared to the top of the 90-degree elbow. The experimental analysis indicates that slurry transport at 2 m/s through 90-degree elbow aggravates material disintegration up to 2 times in comparison to the low transport velocity. The weight loss analysis and CFD-DPM contours show particle wall impaction was maximum in the bottom section towards downstream adjacent to elbow outlet.
  • The highest erosive wear originated from a combination of the cutting and pitting adjacent to the elbow outlet. Sand fines tended to redirect the path at the downstream; facilitating erosion scars and pits development in the region. A closer descry at the worn surface manifests that in addition to the pitting, the contiguous impact craters materialized which are evidence of plastic deformation due to the sand fines impactions. The cumulative effect of pitting and cutting escalates erosion-corrosion in the flow direction.
The present study provides meaningful data on sand fines erosion that aid in the development of new submicron models and computational strategies to ameliorate the prediction of sand fines erosion. In addition, the errors in the predicted erosion CFD-DPM results indicate scantiness in modeling the flow field and particle-turbulence interactions of submicron particles that require further scrutiny. Furthermore, the sand fines erosion working mechanism for different levels of particle loading in carrier fluid is not well studied and entails further investigation.

Author Contributions

R.K. and H.H.Y. conceived and designed the test setup; R.K. performed the experiments, collected the required qualitative and quantitative results and wrote the manuscript; H.H.Y. supervised the project and data analysis; W.P. guided the results analysis and route of research. M.Z.b.A. and F.A.D. guided in funding acquisition. All authors have read and agreed to the published version of the manuscript.

Funding

This research work was made possible by YUTP-FRG Grant 0153AA-H19 from the Universiti Teknologi PETRONAS internal research fund.

Conflicts of Interest

The authors declare no conflict of interest.

References

  1. Kumar, P.G.; Smith, B.R.J.; Vedapuri, D.; Subramani, H.J.; Rhyne, L.D. Sand Fines Erosion in Gas Pipelines–Experiments and CFD Modeling, Proceedings of the CORROSION 2014, San Antonio, TX, USA, 9–13 March 2014; NACE International: Houston, TX, USA, 2014; p. 12. [Google Scholar]
  2. Elemuren, R.; Evitts, R.; Oguocha, I.; Kennell, G.; Gerspacher, R.; Odeshi, A. Slurry erosion-corrosion of 90° AISI 1018 steel elbow in saturated potash brine containing abrasive silica particles. Wear 2018, 410–411, 149–155. [Google Scholar] [CrossRef]
  3. Ayyagari, A.; Hasannaeimi, V.; Grewal, H.S.; Arora, H.; Mukherjee, S. Corrosion, Erosion and Wear Behavior of Complex Concentrated Alloys: A Review. Metals 2018, 8, 603. [Google Scholar] [CrossRef] [Green Version]
  4. Toor, I.U.; Irshad, H.M.; Badr, H.M.; Samad, M.A. The Effect of Impingement Velocity and Angle Variation on the Erosion Corrosion Performance of API 5L-X65 Carbon Steel in a Flow Loop. Metals 2018, 8, 402. [Google Scholar] [CrossRef] [Green Version]
  5. Dai, L.; Wang, D.; Wang, T.; Feng, Q.; Yang, X. Analysis and Comparison of Long-Distance Pipeline Failures. J. Pet. Eng. 2017, 2017, 7. [Google Scholar] [CrossRef] [Green Version]
  6. Duarte, C.A.R.; de Souza, F.J.; dos Santos, V.F. Mitigating elbow erosion with a vortex chamber. Powder Technol. 2016, 288, 6–25. [Google Scholar] [CrossRef]
  7. Finnie, I. Erosion of surfaces by solid particles. Wear 1960, 3, 87–103. [Google Scholar] [CrossRef]
  8. Vieira, R.E.; Kesana, N.R.; McLaury, B.S.; Shirazi, S.A.; Torres, C.F.; Schleicher, E.; Hampel, U. Experimental investigation of the effect of 90° standard elbow on horizontal gas–liquid stratified and annular flow characteristics using dual wire-mesh sensors. Exp. Therm Fluid Sci. 2014, 59, 72–87. [Google Scholar] [CrossRef]
  9. Tawancy, H.M.; Al-Hadhrami, L.M.; Al-Yousef, F.K. Analysis of corroded elbow section of carbon steel piping system of an oil–gas separator vessel. Case Stud. Eng. Fail. Anal. 2013, 1, 6–14. [Google Scholar] [CrossRef] [Green Version]
  10. Islam, M.A.; Alam, T.; Farhat, Z.N.; Mohamed, A.; Alfantazi, A. Effect of microstructure on the erosion behavior of carbon steel. Wear 2015, 332–333, 1080–1089. [Google Scholar] [CrossRef]
  11. Zhang, J.; Kang, J.; Fan, J.; Gao, J. Study on erosion wear of fracturing pipeline under the action of multiphase flow in oil & gas industry. J. Nat. Gas Sci. Eng. 2016, 32, 334–346. [Google Scholar] [CrossRef]
  12. Lin, N.; Arabnejad, H.; Shirazi, S.A.; McLaury, B.S.; Lan, H. Experimental study of particle size, shape and particle flow rate on Erosion of stainless steel. Powder Technol. 2018, 336, 70–79. [Google Scholar] [CrossRef]
  13. Alam, T.; Farhat, Z.N. Slurry erosion surface damage under normal impact for pipeline steels. Eng. Fail. Anal. 2018, 90, 116–128. [Google Scholar] [CrossRef]
  14. Liu, J.; BaKeDaShi, W.; Li, Z.; Xu, Y.; Ji, W.; Zhang, C.; Cui, G.; Zhang, R. Effect of flow velocity on erosion–corrosion of 90-degree horizontal elbow. Wear 2017, 376–377, 516–525. [Google Scholar] [CrossRef]
  15. Zeng, L.; Zhang, G.A.; Guo, X.P. Erosion–corrosion at different locations of X65 carbon steel elbow. Corros. Sci. 2014, 85, 318–330. [Google Scholar] [CrossRef]
  16. Chen, J.; Wang, Y.; Li, X.; He, R.; Han, S.; Chen, Y. Erosion prediction of liquid-particle two-phase flow in pipeline elbows via CFD–DEM coupling method. Powder Technol. 2015, 275, 182–187. [Google Scholar] [CrossRef]
  17. Mansouri, A.; Arabnejad, H.; Karimi, S.; Shirazi, S.A.; McLaury, B.S. Improved CFD modeling and validation of erosion damage due to fine sand particles. Wear 2015, 338–339, 339–350. [Google Scholar] [CrossRef]
  18. Pei, J.; Lui, A.; Zhang, Q.; Xiong, T.; Jiang, P.; Wei, W. Numerical investigation of the maximum erosion zone in elbows for liquid-particle flow. Powder Technol. 2018, 333, 47–59. [Google Scholar] [CrossRef]
  19. Khan, M.R.; Ya, H.H.; Pao, W.; Majid, M.A.A. Numerical Investigation of Sand Particle Erosion in Long Radius Elbow for Multiphase Flow; Springer: Singapore, 2019; pp. 41–49. [Google Scholar]
  20. Pereira, G.C.; de Souza, F.J.; de Moro Martins, D.A. Numerical prediction of the erosion due to particles in elbows. Powder Technol. 2014, 261, 105–117. [Google Scholar] [CrossRef]
  21. Khan, R.; Ya, H.H.; Pao, W. An Experimental Study on the Erosion-Corrosion Performance of AISI 1018 Carbon Steel and AISI 304L Stainless Steel 90-Degree Elbow Pipe. Metals 2019, 9, 1260. [Google Scholar] [CrossRef] [Green Version]
  22. Khan, R.; Ya, H.H.; Pao, W.; Khan, A. Erosion–Corrosion of 30°, 60° and 90° Carbon Steel Elbows in a Multiphase Flow Containing Sand Particles. Materials 2019, 12, 3898. [Google Scholar] [CrossRef] [Green Version]
  23. Oka, Y.I.; Yoshida, T. Practical estimation of erosion damage caused by solid particle impact: Part 2: Mechanical properties of materials directly associated with erosion damage. Wear 2005, 259, 102–109. [Google Scholar] [CrossRef]
  24. Grant, G.; Tabakoff, W. Erosion Prediction in Turbomachinery Resulting from Environmental Solid Particles. J. Aircr. 1975, 12, 471–478. [Google Scholar] [CrossRef]
  25. Zhang, R.; Liu, H. Numerical simulation of solid particle erosion in a 90 degree bend for gas flow. In Proceedings of the International Conference on Offshore Mechanics and Arctic Engineering—OMAE, San Francisco, CA, USA, 8–13 June 2014. [Google Scholar]
  26. Zeng, L.; Shuang, S.; Guo, X.P.; Zhang, G.A. Erosion-corrosion of stainless steel at different locations of a 90° elbow. Corros. Sci. 2016, 111, 72–83. [Google Scholar] [CrossRef]
  27. Rajahram, S.S.; Harvey, T.J.; Walker, J.C.; Wang, S.C.; Wood, R.J.K. Investigation of erosion–corrosion mechanisms of UNS S31603 using FIB and TEM. Tribol. Int. 2012, 46, 161–173. [Google Scholar] [CrossRef]
  28. Davis, C.; Frawley, P. Modelling of erosion–corrosion in practical geometries. Corr. Sci. 2009, 51, 769–775. [Google Scholar] [CrossRef]
  29. Aminul Islam, M.; Farhat, Z.N.; Ahmed, E.M.; Alfantazi, A.M. Erosion enhanced corrosion and corrosion enhanced erosion of API X-70 pipeline steel. Wear 2013, 302, 1592–1601. [Google Scholar] [CrossRef]
  30. Cheng, J.; Dou, Y.; Zhang, N.; Li, Z.; Wang, Z. A new method for predicting erosion damage of suddenly contracted pipe impacted by particle cluster via CFD-DEM. Materials 2018, 11, 1585. [Google Scholar] [CrossRef] [Green Version]
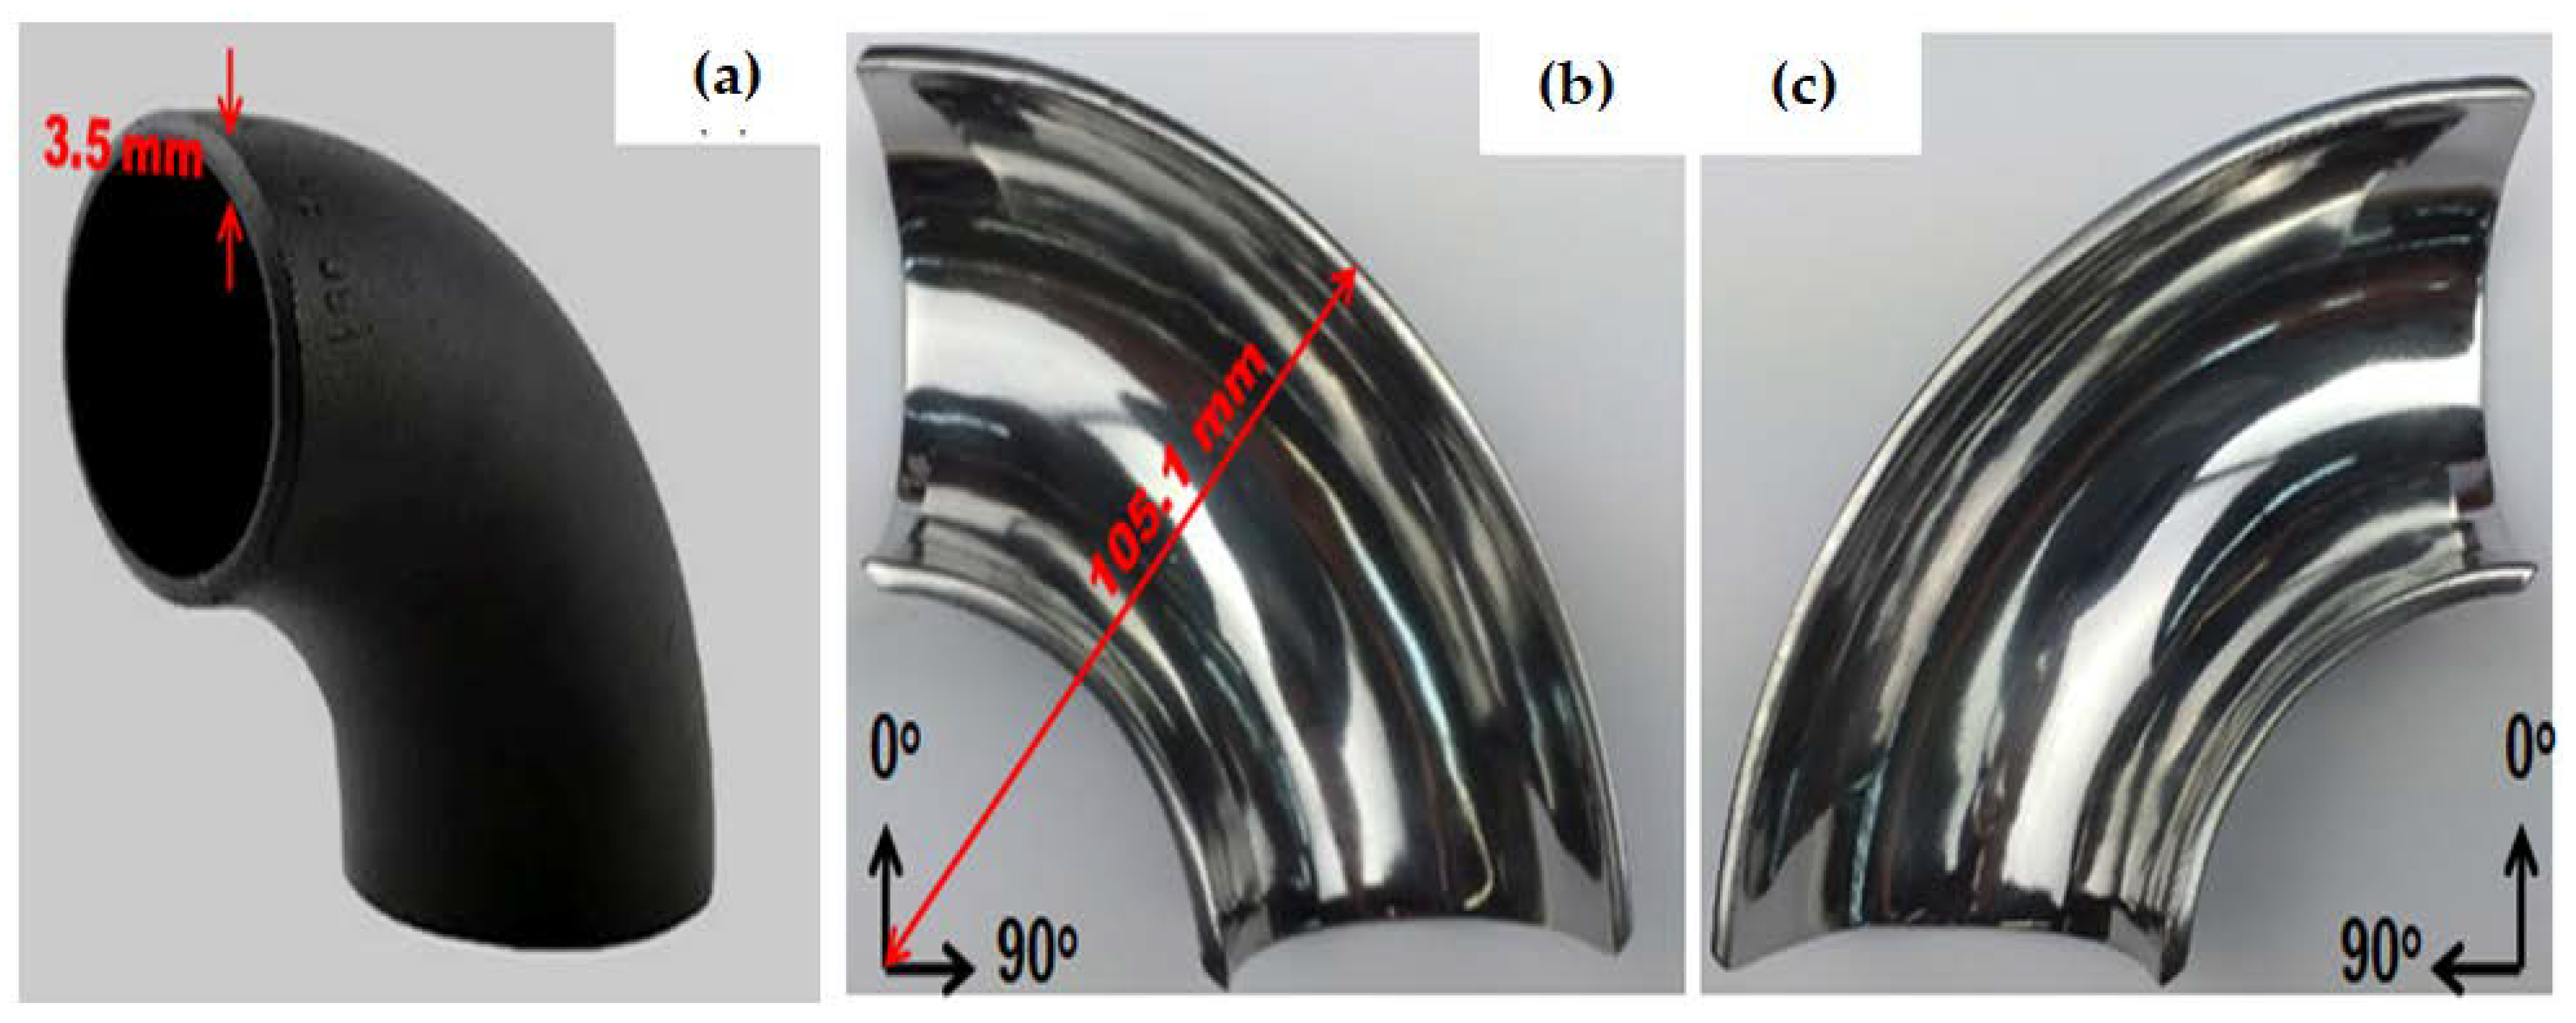
Figure 1. Ninety-Degree elbow specimen. (a) As received1018 CS (b,c) fine polished axially cut section.
Metals 10 00626 g001
Figure 2. Microstructures of (a) 450 µm sand, (b) 50 µm sand fines and (c) 1018 CS.
Metals 10 00626 g002
Figure 3. Multilayer paint modeling (MPM) sample preparation stages.
Metals 10 00626 g003
Figure 4. The experimental setup used for the present investigation.
Metals 10 00626 g004
Figure 5. Sand and Elbow wall impact.
Metals 10 00626 g005
Figure 6. Computational geometry.
Metals 10 00626 g006
Figure 7. Computational mesh.
Metals 10 00626 g007
Figure 8. Predicted computational fluid dynamics (CFD) Erosion Using Three Different Meshes (a) Mesh 1 (b) Mesh 2 and (c) Mesh 3.
Metals 10 00626 g008
Figure 9. Comparison of numerical and experimental erosion rates along the elbow outer wall for the three different mesh sizes.
Metals 10 00626 g009
Figure 10. Erosion zone at the elbow internal wall for a slurry velocity of 4 m/s: (a) discrete phase modeling (DPM) simulation (b) Multilayer paint modeling.
Metals 10 00626 g010
Figure 11. Comparison of erosion pattern for 90° elbow, between prediction and MPM experiments at 0.5 m/s. (a) bottom section (CFD) (b) upper section (CFD) (c) bottom section (MPM) (d) upper section (MPM).
Metals 10 00626 g011
Figure 12. Comparison of erosion pattern for 90-degree elbow, between prediction and MPM experiments at 1 m/s. (a) bottom section (CFD) (b) upper section (CFD) (c) bottom section (MPM) (d) upper section (MPM).
Metals 10 00626 g012
Figure 13. Comparison of erosion pattern for 90-degree elbow, between prediction and MPM experiments at 2 m/s. (a) bottom section (CFD) (b) upper section (CFD) (c) bottom section (MPM) (d) upper section (MPM).
Metals 10 00626 g013
Figure 14. DPM Erosion rate distribution for different flow velocity in 90° carbon steel elbow (a) 0.5 m/s (b) 1 m/s (c) 2 m/s.
Metals 10 00626 g014
Figure 15. Particle trajectories at 2 m/s flow speed in the bottom half elbow section.
Metals 10 00626 g015
Figure 16. Microscopic images of 90-degree elbow BH section after the test at 0.5 m/s flow velocity (a) inlet (b) outlet.
Metals 10 00626 g016
Figure 17. Microscopic images of 90-degree elbow BH section after the test at 1 m/s flow velocity (a) inlet (b) outlet.
Metals 10 00626 g017
Figure 18. Microscopic images of 90-degree elbow BH section after the test at 2 m/s flow velocity (a) inlet (b) outlet.
Metals 10 00626 g018
Figure 19. Mass loss in 90-degree AISI 1018 carbon steel BH and UH elbows section after exposure of flow for 60 h.
Metals 10 00626 g019
Figure 20. Comparison of predicted erosion rate with the experimental rate of 90-degree elbow for different flow velocities.
Metals 10 00626 g020
Table 1. Elbow material (wt. %).
1018 CS
SiCrCuPCSNiMnFe
0.260.210.250.0450.20.0350.30.5298.18
Table 2. Silica Sand (wt. %).
SiO2Al2O3Fe2O3Na2OMgOCaO
98.081.170.280.030.220.22
Table 3. Mesh independence statistics.
Mesh Study
Mesh123
No of cells356912524000876313
No of the node on k121212
Erosion rate (Maximum) (nm/s)0.0530.0920.093
Metals 10 00626 i001 Metals 10 00626 i002 Metals 10 00626 i003 Metals 10 00626 i004
Table 4. Flow conditions for validation case.
Experimental Parameters from Zeng et al. [15]
Target surface materialCarbon Steel
Erodent Particle Sand
Erodent Diameter450 µm
Erodent Density2650 kg/m3
ShapeSemi-round
Sand Concentration1.2 wt.%
Erodent Mass Flow Rate0.235 kg/s
Material Density7800 kg/m3
Carrier FluidWater
Flow Velocity4 m/s
Table 5. Rates of tested 90-degree elbows 1018 CS for liquid-solid flow.
MethodVL (m/s)Mean Particle Size (µm)Particle Concentration (Wt. %)Mass Loss Rate (kg/m2·s)
Exp0.55021.79 × 10−8
Exp15022.48 × 10−8
Exp25023.56 × 10−8
CFD0.55021.30 × 10−8
CFD15021.56 × 10−8
CFD25022.30 × 10−8