Article

Recovery of Rubidium and Cesium Resources from Brine of Desalination through t-BAMBP Extraction

Department of Resources Engineering, National Cheng Kung University, No.1, DaxueRoad, Tainan City 70101, Taiwan
*
Author to whom correspondence should be addressed.
Metals 2020, 10(5), 607; https://doi.org/10.3390/met10050607
Submission received: 23 April 2020 / Revised: 3 May 2020 / Accepted: 6 May 2020 / Published: 8 May 2020
(This article belongs to the Special Issue Recovery and Recycling of Valuable Metals)

Abstract

:
50 billion cubic meters of brine every year creates ecological hazards to the environment. In order to reuse brine efficiently, rubidium and cesium were recovered in this experiment. On the other hand, the main impurities which were needed to be eliminated in brine were lithium, sodium, potassium, calcium, and magnesium. In the procedure, seawater was distilled and evaporated first to turn into simulated brine. Perchloric acid was then added into simulated brine to precipitate potassium perchlorate which could reduce the influence of potassium in the extraction procedure. After that, t-BAMBP and ammonia were separately used as extractant and stripping agent in the extraction and stripping procedures to get rubidium hydroxide solutions and cesium hydroxide solutions. Subsequently, they reacted with ammonium carbonate to get rubidium carbonate and cesium carbonate. In a nutshell, this study shows the optimal parameters of pH value to precipitate potassium perchlorate. Besides, pH value in the system, the concentration of t-BAMBP and ammonia, organic phase/aqueous phase ratio (O/A ratio), reaction time, and reaction temperature in solvent extraction step were investigated to get high purities of rubidium carbonate and cesium carbonate.

1. Introduction

According to the investigation of the United Nations, more than 1 billion people in the world currently live in the areas with scarce water resources. Moreover, this number will reach 1.8 billion by 2025 [1]. In response to the shortage of freshwater resources, seawater desalination technology has developed rapidly since the beginning of the 20th century [2]. However, as seawater desalination is common now, waste brine also causes considerable harm to the environment. For example, waste brine will change the composition of seawater and affect the ecosystem. In order to reuse waste brine, some elements such as lithium, magnesium, calcium, and chlorine are recycled from brine recently [3]. In this study, rubidium and cesium were extracted from brine through the hydrometallurgy method. It is expected to achieve the goal of recovering valuable metals, reducing waste, and protecting the environment.
Based on the report of the U.S. Geological Survey (USGS), the rubidium and cesium resources are mainly from primary minerals such as carnallite, garnet, and lepidolite [4,5,6,7,8]. The main reservoirs are Namibia, Zimbabwe, Afghanistan, and some other countries. Rubidium and cesium respectively have only 90,000 tons of reserve, and the difficulty of mining makes them rarer. Although rubidium and cesium are not common, they are valuable and useful in many areas. Therefore, it is important to recover rubidium and cesium or its compounds from waste brine which can reduce the reliance of primary mineral and create the economic value of brine.
Rubidium and cesium have a wide range of using [9,10,11,12]. For industry activities, rubidium and cesium metals are the material of television, radar, infrared filter, radiant energy receiver, and reconnaissance telescope [13]. On the other hand, rubidium carbonate (Rb2CO3) and cesium carbonate (Cs2CO3) can be raw materials of glasses and increase stability and durability. Additionally, rubidium carbonate and cesium carbonate are easy to turn into other compounds such as rubidium chloride (RbCl) and cesium nitrate (CsNO3). Rubidium chloride can be used to produce sleeping pills, sedatives, and treatment of bipolar disorder [14,15,16,17]. Cesium nitrate can be used as a light refraction regulator in the optical fiber industry and glass industry [18]. Due to the unlimited development of rubidium and cesium compounds, many countries try various methods to get rubidium and cesium and apply them in industries.
Nowadays, rubidium and cesium are mainly recovered from saline lake and ores through a solvent extraction method with t-BAMBP extractant [19,20,21,22]. On the other hand, because impurities could be removed efficiently through chemical precipitation and make higher purification of compounds, it was chosen to be the procedure before solvent extraction in this experiment. During the chemical precipitation process, perchloric acid (HClO4) was added into the brine to selectively precipitate potassium perchlorate (KClO4). Due to the reduction of potassium, it could avoid the adverse effects which potassium create in the follow-up processes. Moreover, t-BAMBP and ammonia were used in the solvent extraction procedure to separate rubidium, cesium, and other impurities such as lithium, sodium, potassium, calcium, and magnesium efficiently. To sum up, the chemical precipitation method and solvent extraction method were used in this experiment to get high purities of rubidium and cesium resources and made them be able to reuse in the industries.

2. Material and Methods

2.1. Materials

In this experiment, the simulated brine was got from seawater through distillation and evaporation. The metal compositions of simulated brine are measured by inductively coupled plasma optical emission spectrometry (ICP-OES) and the concentrations are shown in Table 1.
In the whole process, perchloric acid (HClO4) was purchased from Sigma-Aldrich (St. Louis, MO, USA) (70%) to selectively precipitate potassium perchlorate. Sodium hydroxide (NaOH) and sulfuric acid (H2SO4) were separately acquired from Applichem Panreac (Barcelona, Spain) (≥98%) and Sigma-Aldrich (St. Louis, MO, USA) (≥98%). They were used in the extraction process to adjust the pH value. Kerosene was purchased from CPC Corporation (Kaohsiung, Taiwan) to dilute the extractant. t-BAMBP was purchased from Realkan Corporation (Beijing, China) (≥90%) for the extraction process, and ammonia (NH4OH) was purchased from Sigma-Aldrich (St. Louis, MO, USA) (30–33%) for the stripping process. In the final process, ammonium carbonate ((NH4)2CO3) was acquired from Sigma-Aldrich (St. Louis, MO, USA) (≥90%) to produce rubidium carbonate and cesium carbonate. During the analysis procedure, ICP rubidium standard solution, ICP cesium standard solution, and ICP multi-element standard solution were acquired from High-Purity Standards, Inc. (North Charleston, SC, USA). The nitric acid (HNO3) was purchased from Sigma-Aldrich (St. Louis, MO, USA) (HNO3 ≥ 65%) and diluted to 1% to be the background value and thinner for ICP analysis.

2.2. Equipment

The materials and products were analyzed by X-ray fluorescence spectrometer (XRF; ZSX100s, SPECTRO Analytical Instruments Inc., Kleve, Germany) and inductively coupled plasma optical emission spectrometry (ICP-OES; Varian, Vista-MPX, PerkinElmer, Waltham, MA, USA). In the separated process, 445 mm × 730 mm × 505 mm of funnel shaker (FS-12; Shin Kwang Precision Industry Ltd., New Taipei City, Taiwan) was used to shake 500 mL of separating funnels at 3000 rpm. On the other hand, the thermostatic bath (XMtd-204; BaltaLab, Vidzemes priekšpilsēta, Rīga, Latvia) was used to maintain the temperature during the extraction process and stripping process. In the procedure of producing compounds, rotary evaporators (BUCHI R-300; BÜCHI Labortechnik AG, Flawil, Switzerland) was used to evaporate solutions under low pressure and high purity of rubidium carbonate and cesium carbonate could be precipitated.

2.3. Experimental Procedures

2.3.1. Chemical Precipitation

Chemical precipitation procedure was used to remove potassium in this experiment. In the process, the potassium which was in simulated brine would be selectively precipitated as potassium perchlorate by adding perchloric acid. Removal of potassium could reduce the co-extracted effect in the solvent extraction process. The parameter of chemical precipitation such as effect of pH value was investigated. Precipitation rate was calculated according to Equation (1) and the flow diagram is shown in Figure 1.
P ( % ) = [ M ] 0 [ M ] [ M ] 0 × 100
P is Precipitation rate, [ M ] 0 is metal concentration of leach liquor, [ M ] is metal concentration of leach liquor after precipitation.

2.3.2. Solvent Extraction–Extraction Process

In this study, t-BAMBP was diluted into kerosene and used as the extractant to separate rubidium and cesium from other impurities such as lithium, sodium, potassium, calcium, and magnesium. The extraction process was divided into two stages. Cesium was extracted in the first stage, and Li, Na, K, Ca, Mg, and Rb were still in the aqueous phase. Rubidium was then extracted in the second stage, and other impurities were in the aqueous phase as well.
To calculate the efficiency of extraction, distribution ratio and extraction percentage were used in this process. Distribution ratio, D, was the concentration ratio of the metal in the organic phase to the metal in the aqueous phase at equilibrium. The distribution ratio can be written as Equation (2).
D = [ M ] org [ M ] aq = C i C f C f × V aq V org
Ci is the initial concentration of metal ions in aqueous phase, Cf is the equilibrium concentration of metal ions in aqueous phase. Vaq and Vorg are separately the volume of aqueous phase and organic phase.
Based on the distribution ratio, the extraction percentage can be written as Equation (3).
E ex   ( % ) = D D + V aq / V org · 100
D is the distribution ratio. Vaq and Vorg are separately the volume of aqueous phase and organic phase.
In the extraction process, the parameters such as the pH value of aqueous phase, the concentration of t-BAMBP, the O/A ratio, the reaction time, and the reaction temperature were all presented in the form of extraction percentage.

2.3.3. Solvent Extraction–Stripping Process

Ammonia was the stripping agent in this experiment which could strip the rubidium and cesium from the organic phase. The stripping efficiency is written as Equation (4).
E st   ( % ) = Σ M aq Σ M org × 100
ΣMaq is the concentration of metal ion in aqueous phase after stripping, and ΣMorg is the concentration of metal ion in organic phase before stripping.
The flow diagram of whole solvent extraction process is shown in Figure 2. After the first and the second stages of extraction, the concentration of ammonia, the O/A ratio, and the reaction temperature were investigated in the form of stripping percentage in the stripping process.

3. Results and Discussion

3.1. Removal of Potassium

Because potassium would be co-extracted with rubidium and cesium in the extraction process, the perchloric acid (HClO4) was added into simulated brine to selectively precipitate potassium perchlorate (KClO4) at −5 °C and 10 min. The precipitation percentages in different pH values are shown in Figure 3 and the final compositions of simulated brine are shown in Table 2. In this procedure, the precipitation percentage of KClO4 was 98.5% at −5 °C and pH 2.

3.2. First Stage of Solvent Extraction for Cs

In the first stage of solvent extraction, t-BAMBP was used to separate Cs and other metal ions. Due to the property of t-BAMBP, only K, Rb, and Cs were able to be extracted efficiently. In this study, the values of them in the first stage of solvent extraction were analyzed by ICP-OES and turned into the extraction percentage.

3.2.1. Effect of pH Value of the Aqueous Phase

Because t-BAMBP is an extractant which is suitable for alkalic condition, the pH values were adjusted to 8–14 with 0.1 M t-BAMBP and O/A ratio 1:1 at reaction time 15 min and 25 °C in this experiment. Figure 4 shows that the extraction percentage of K+ and Rb+ were observed almost 0% to 5% at any pH value and the percentage of Cs+ was observed above 99% from pH 8 to pH 12. In the condition of pH 13 and pH 14, emulsification happened and reduced the extraction percentage. Due to these situations, the optimal pH value of the aqueous phase was set to pH 8 which has a high extraction percentage of Cs+ and could reduce the usage of sodium hydroxide.

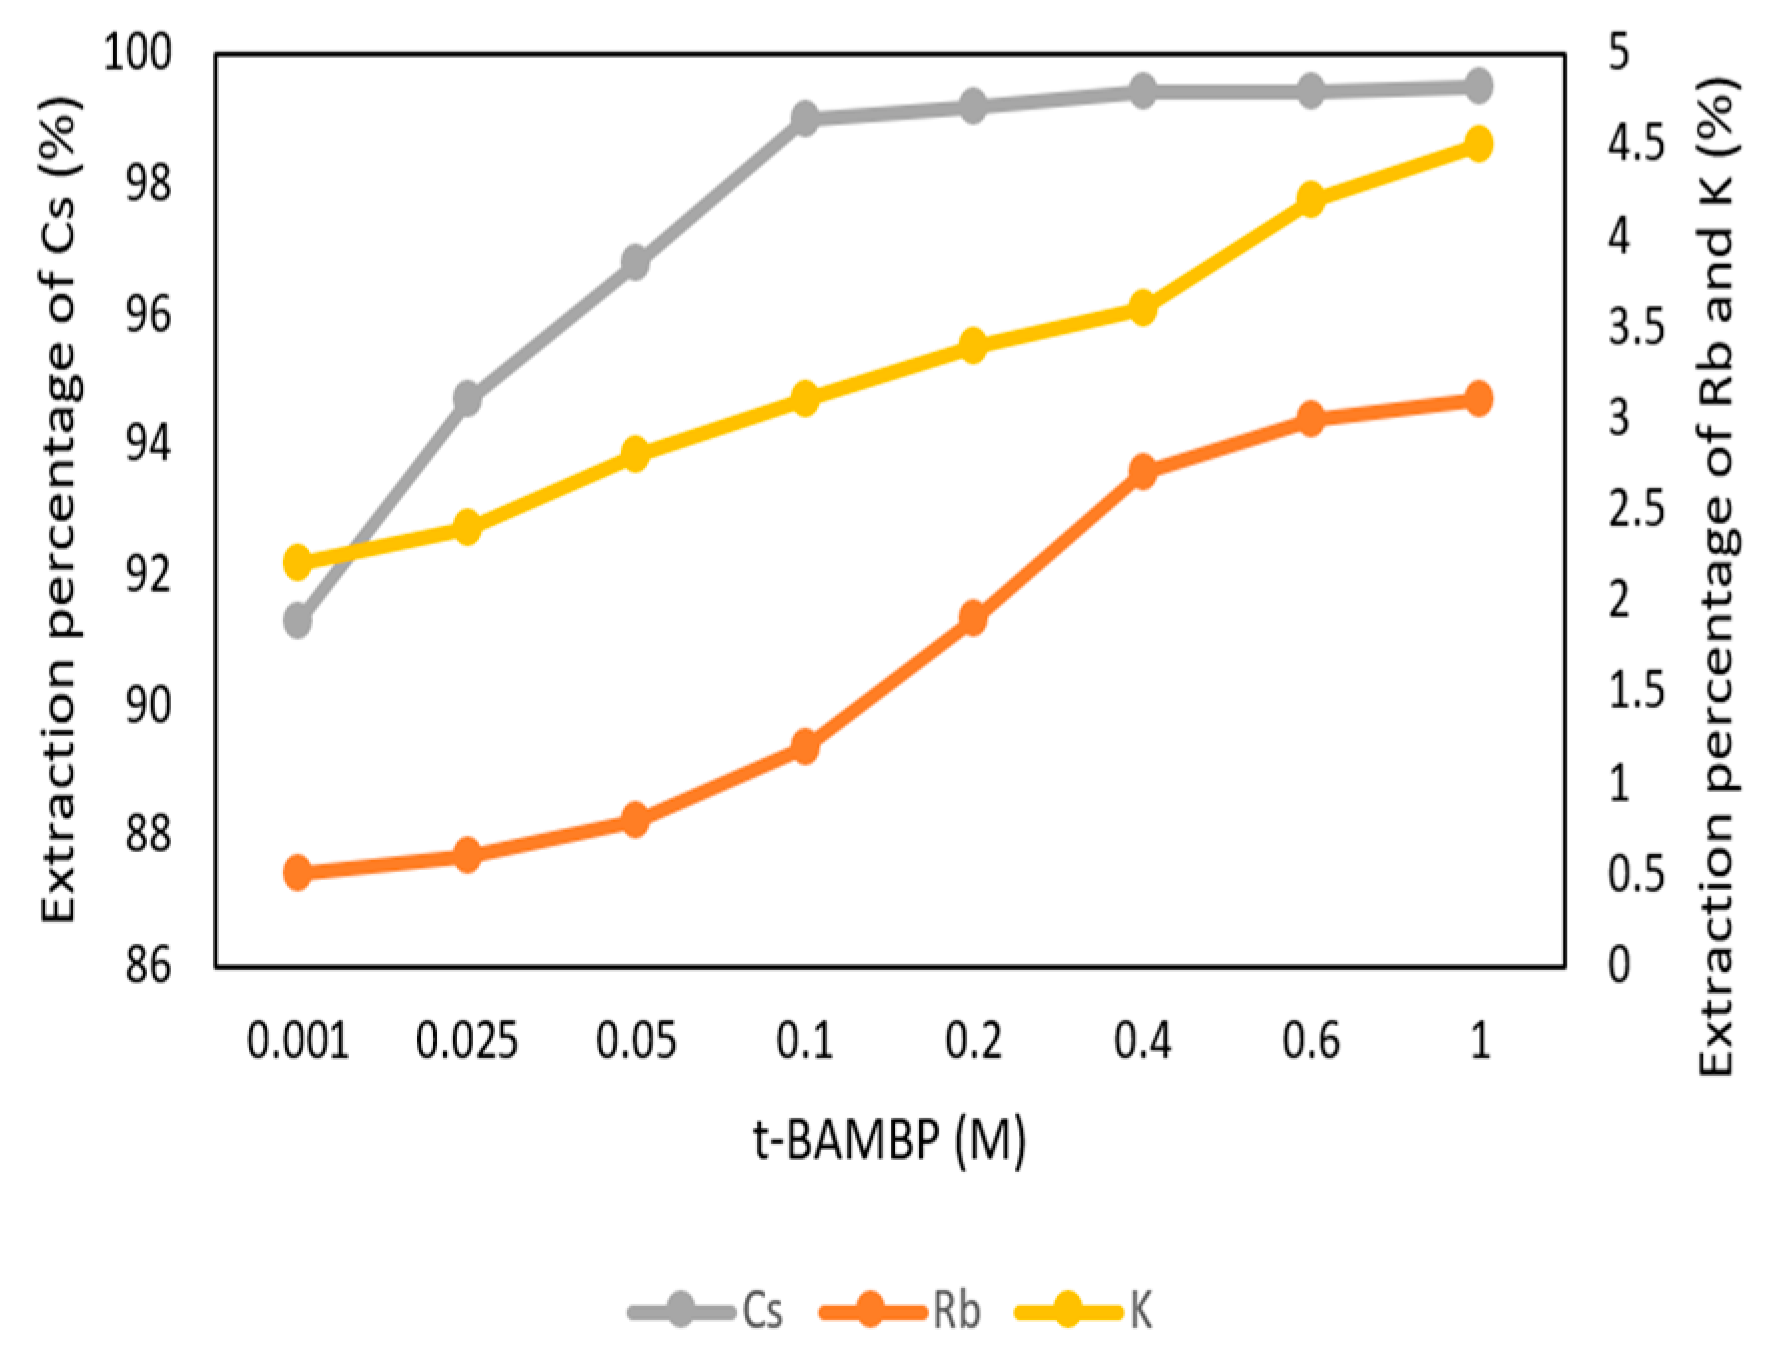
3.2.2. Effect of t-BAMBP Concentration

The conditions of t-BAMBP concentration were set up from 0.001 M to 1 M at pH 8 and O/A ratio 1:1 at reaction time 15 min and 25 °C in this step. Figure 5 shows that the extraction percentage of Cs+ from 0.001 M to 0.1 M increased gradually and became stable. The reason was that a higher concentration of the extractant enabled more Cs+ to be caught. However, the extraction percentage of K+ and Rb+ started to increase with a higher concentration of extractant. This was because K+ and Rb+ were extracted by excess extractant and made an adverse effect on this system. Due to this condition, the optimal parameter of t-BAMBP concentration was chosen as 0.1 M.

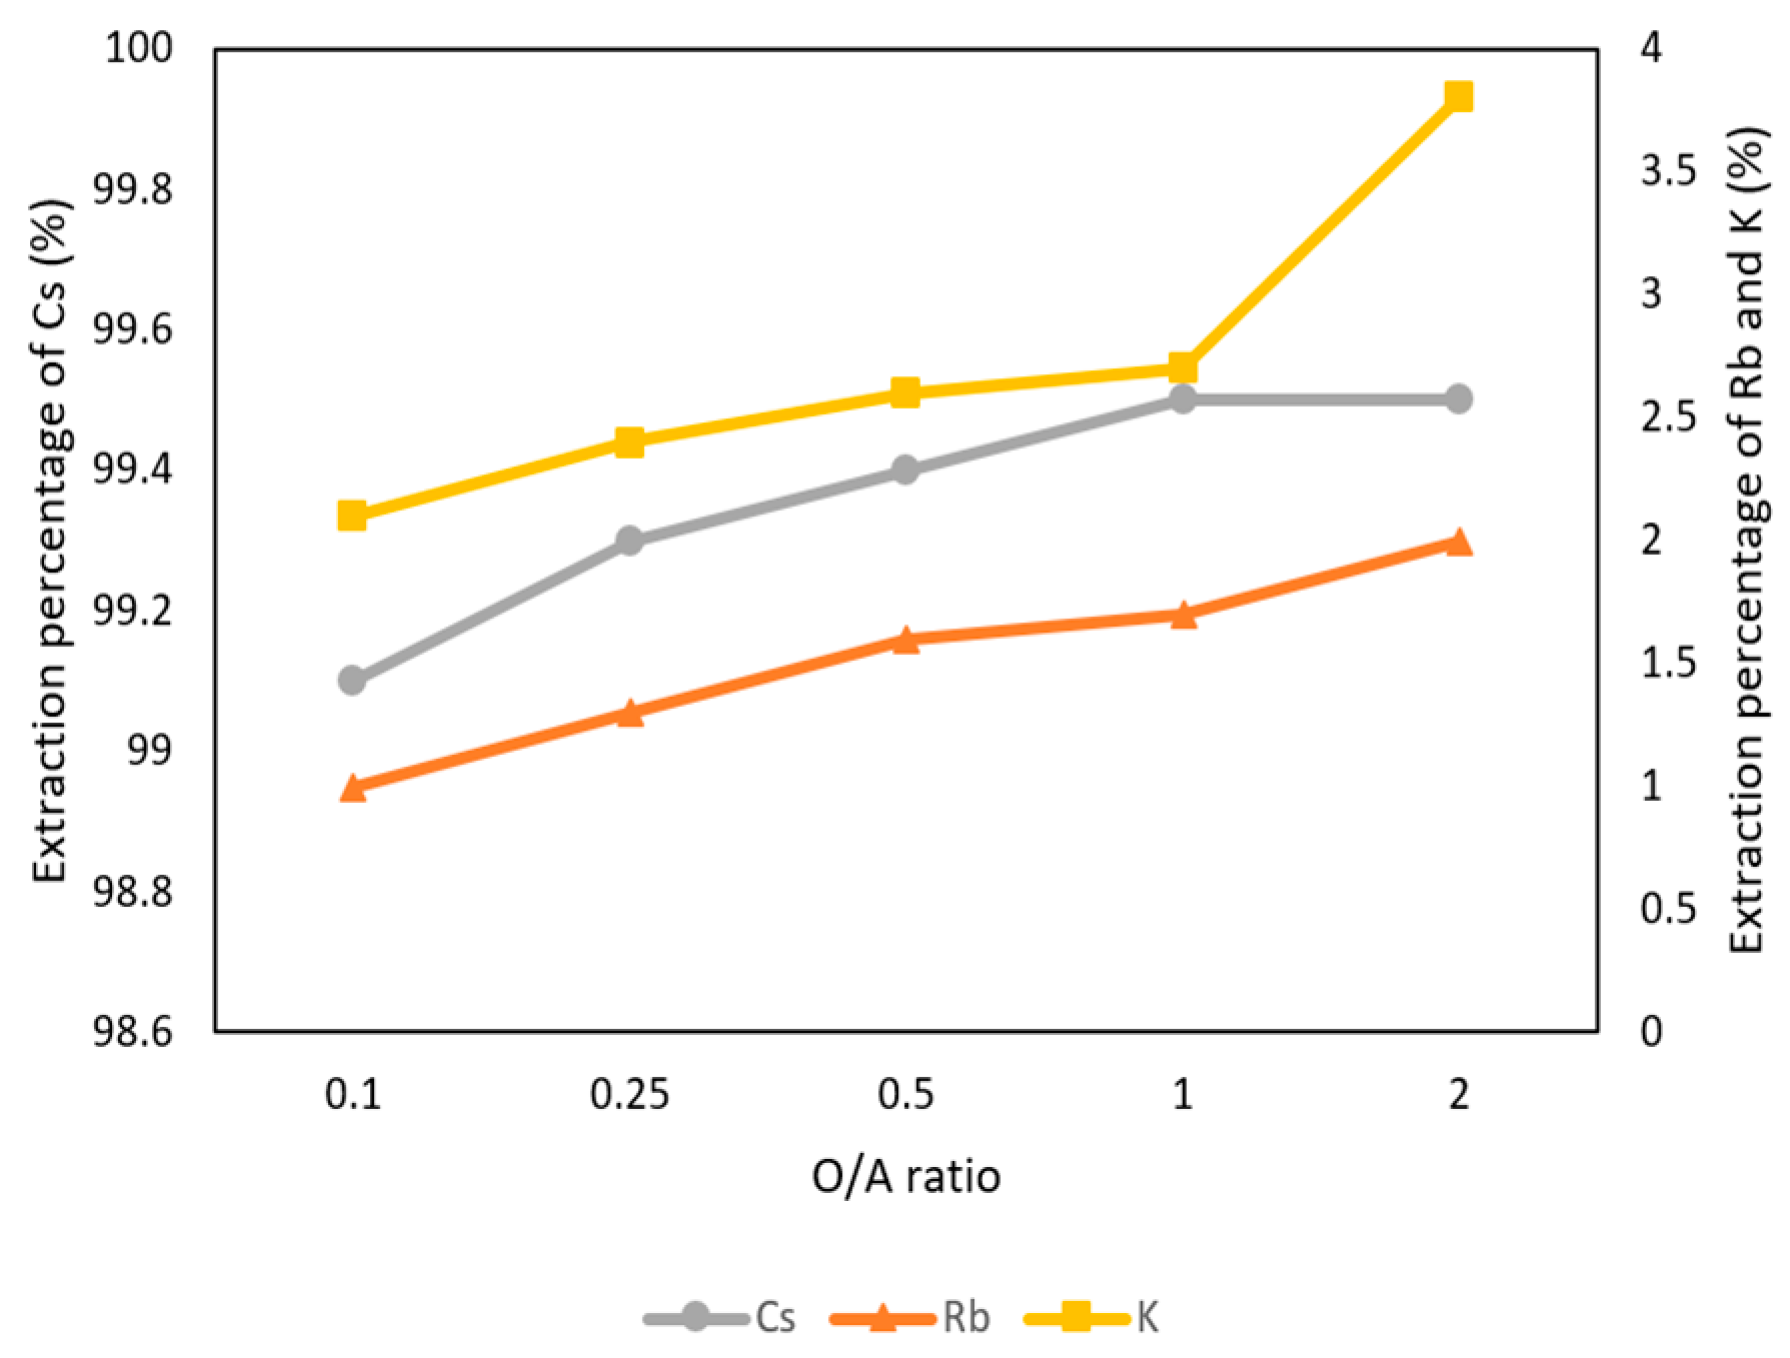
3.2.3. Effect of O/A Ratio

Figure 6 shows the O/A ratios were set from 0.1 to 2 with 0.1 M t-BAMBP at pH 8 and at reaction time 15 min and 25 °C. The result shows that the extraction percentages of Cs+ maintain above 99% with different O/A ratios, which means that Cs+ were almost extracted. However, when the O/A ratio was greater than 0.5, the extraction percentage of K+ and Rb+ increased gradually above 2%. This was because K+ and Rb+ were extracted by excess extractant as well. Hence, in order to get a high concentration of Cs+ and avoid the impurities, the O/A ratio of 0.1 was an optimal parameter in this step.

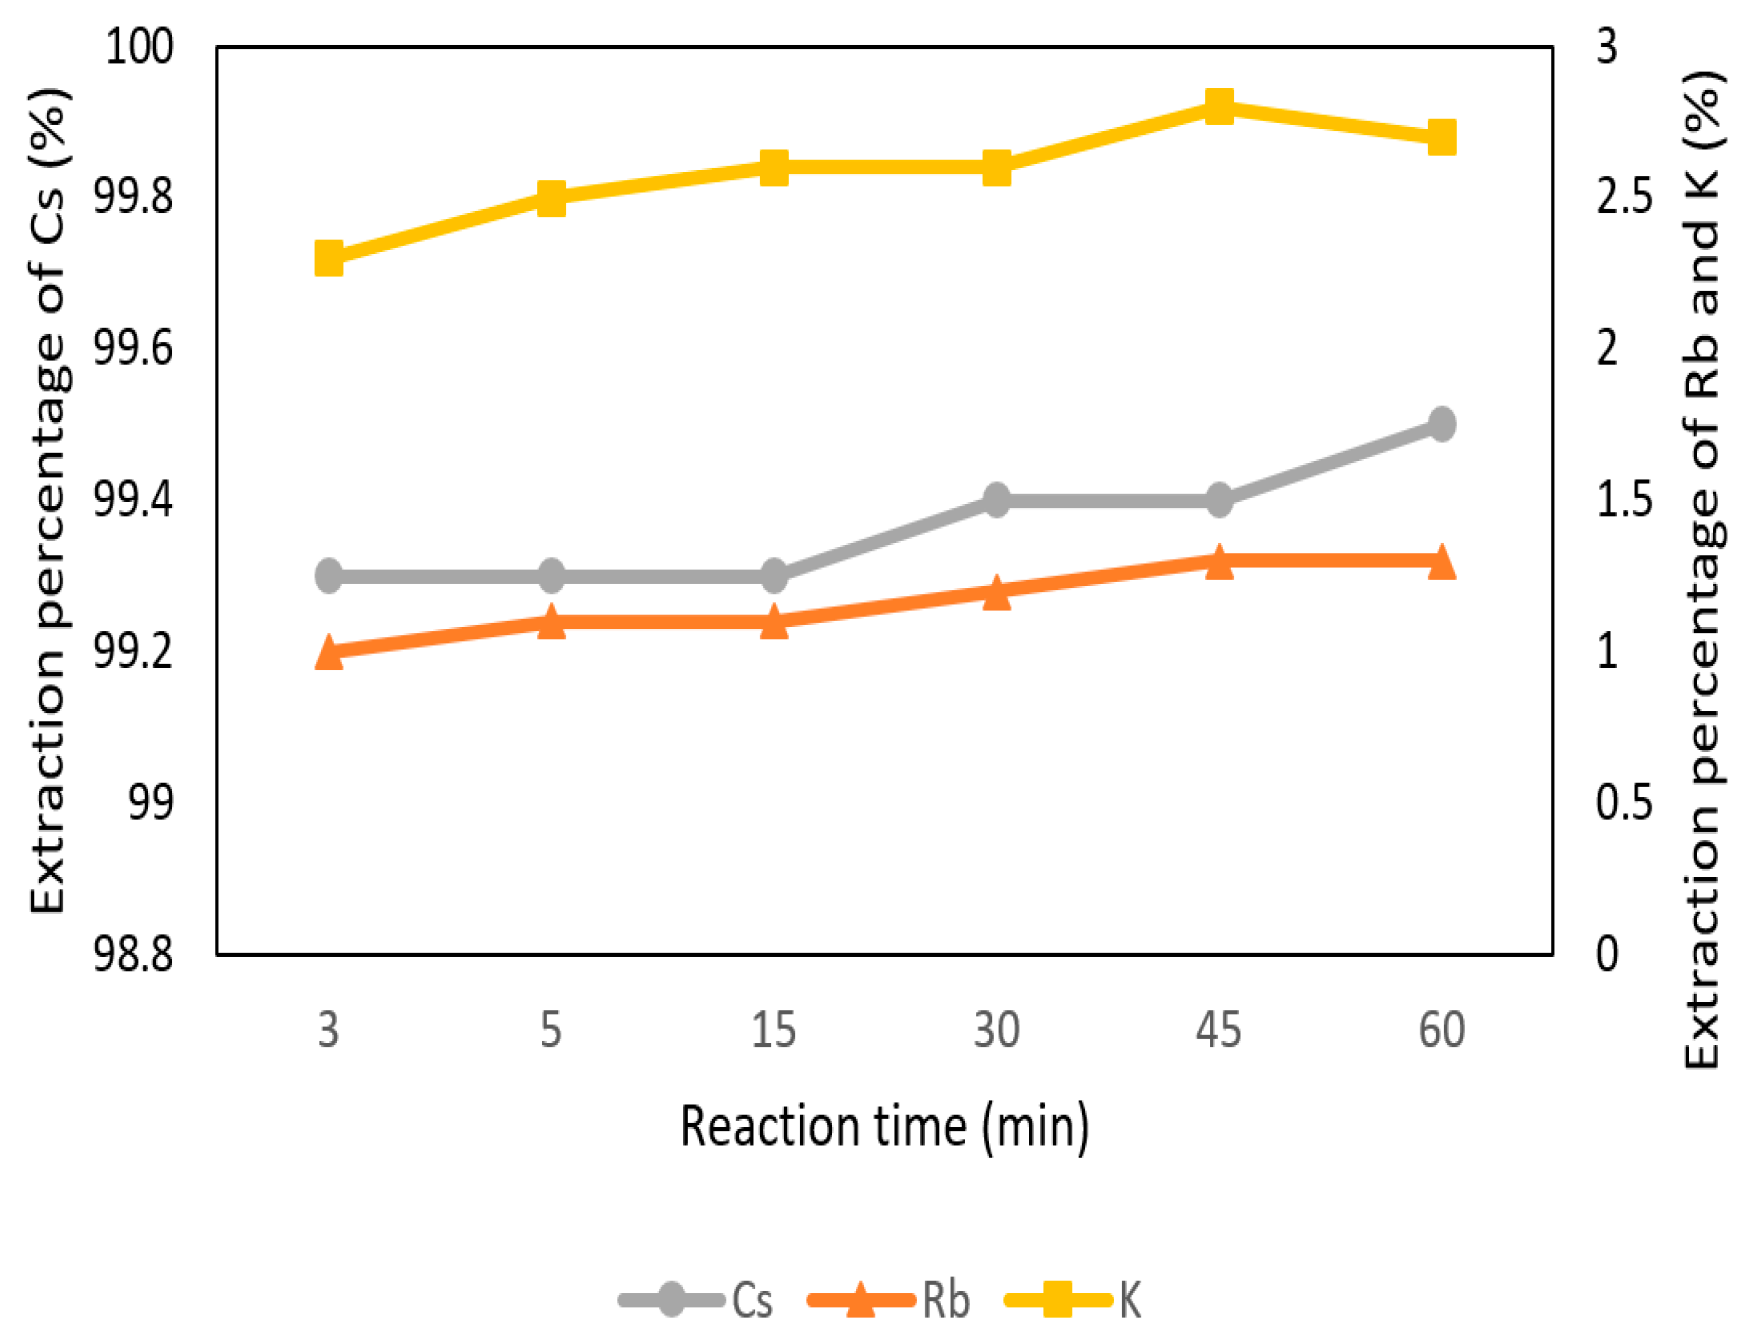
3.2.4. Effect of Reaction Time

The effect of reaction time was set from 3 min to 60 min with 0.1 M t-BAMBP at pH 8 and O/A ratio 1:1 at 25 °C. In Figure 7, the extraction percentage of Cs+ was very stable from 3 min to 60 min. K+ and Rb+ were at equilibrium and low extraction percentage as well. It shows that the reaction of t-BAMBP was fast and reaction time was not a significant influence in the extraction process. On account of this condition, 3 min was chosen.

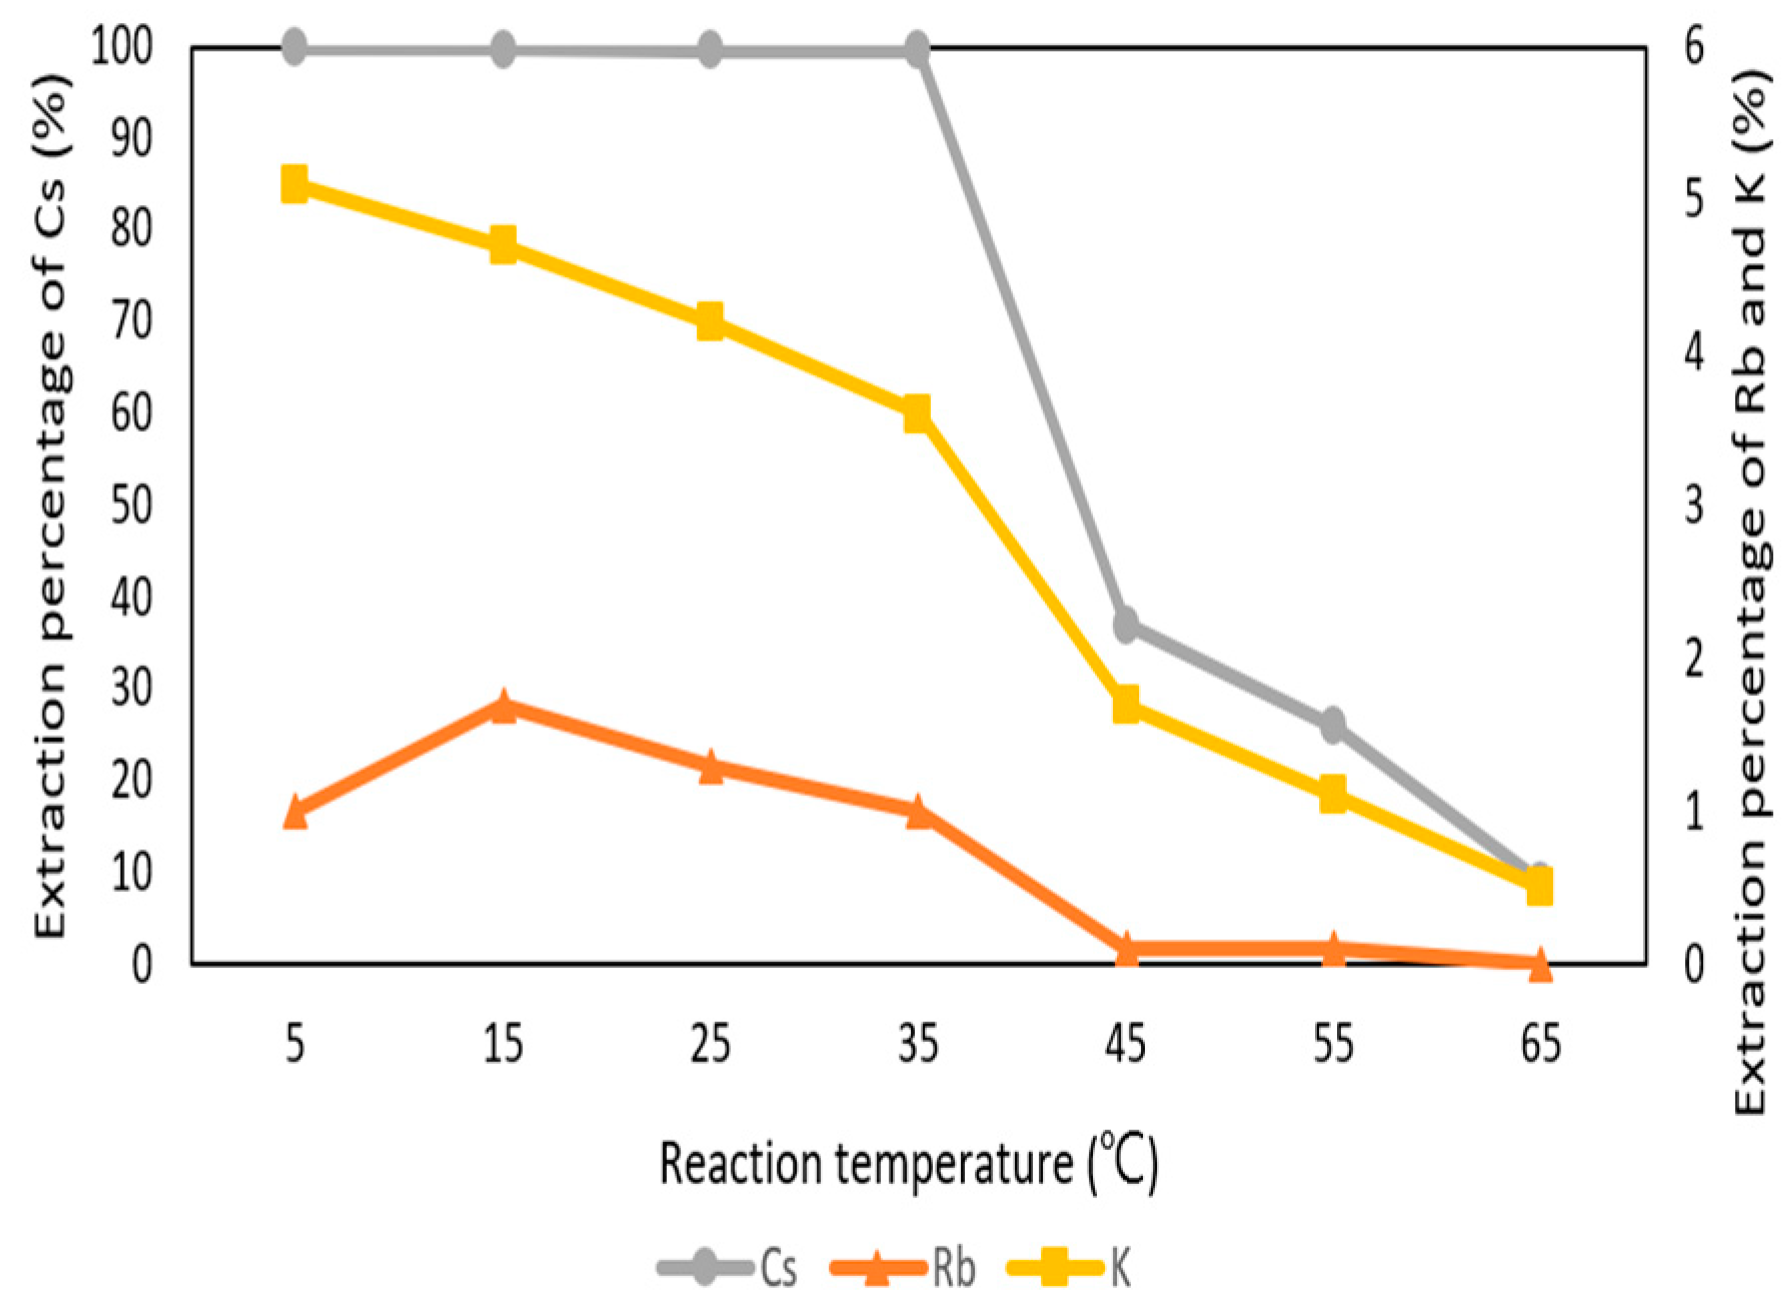
3.2.5. Effect of Reaction Temperature

Figure 8 shows the reaction temperature was a significant parameter in the extraction process. The effect of reaction temperature was set from 5 °C to 65 °C with 0.1 M t-BAMBP at pH 8 and O/A ratio 1:1 at 3 min. The percentage of extraction decreased drastically from 35 °C to 45 °C. This is because t-BAMBP extracted metal ions with exothermic reaction and the high temperature caused the decrease of distribution ratio. Finally, the extraction percentages of Cs+, K+, and Rb+ were respectively 99.8%, 5.2%, and 1% with the condition of pH 8 of the aqueous phase, 0.1 M t-BAMBP, O/A ratio of 0.1, 3 min reaction time, and 35 °C reaction temperature. Compared to other studies, this study shows the high extraction percentage of Cs+ with lower pH value and O/A ratio at the low temperature and Cs+ could be separated from Rb, K, and other impurities such as lithium, sodium, potassium, calcium, and magnesium.

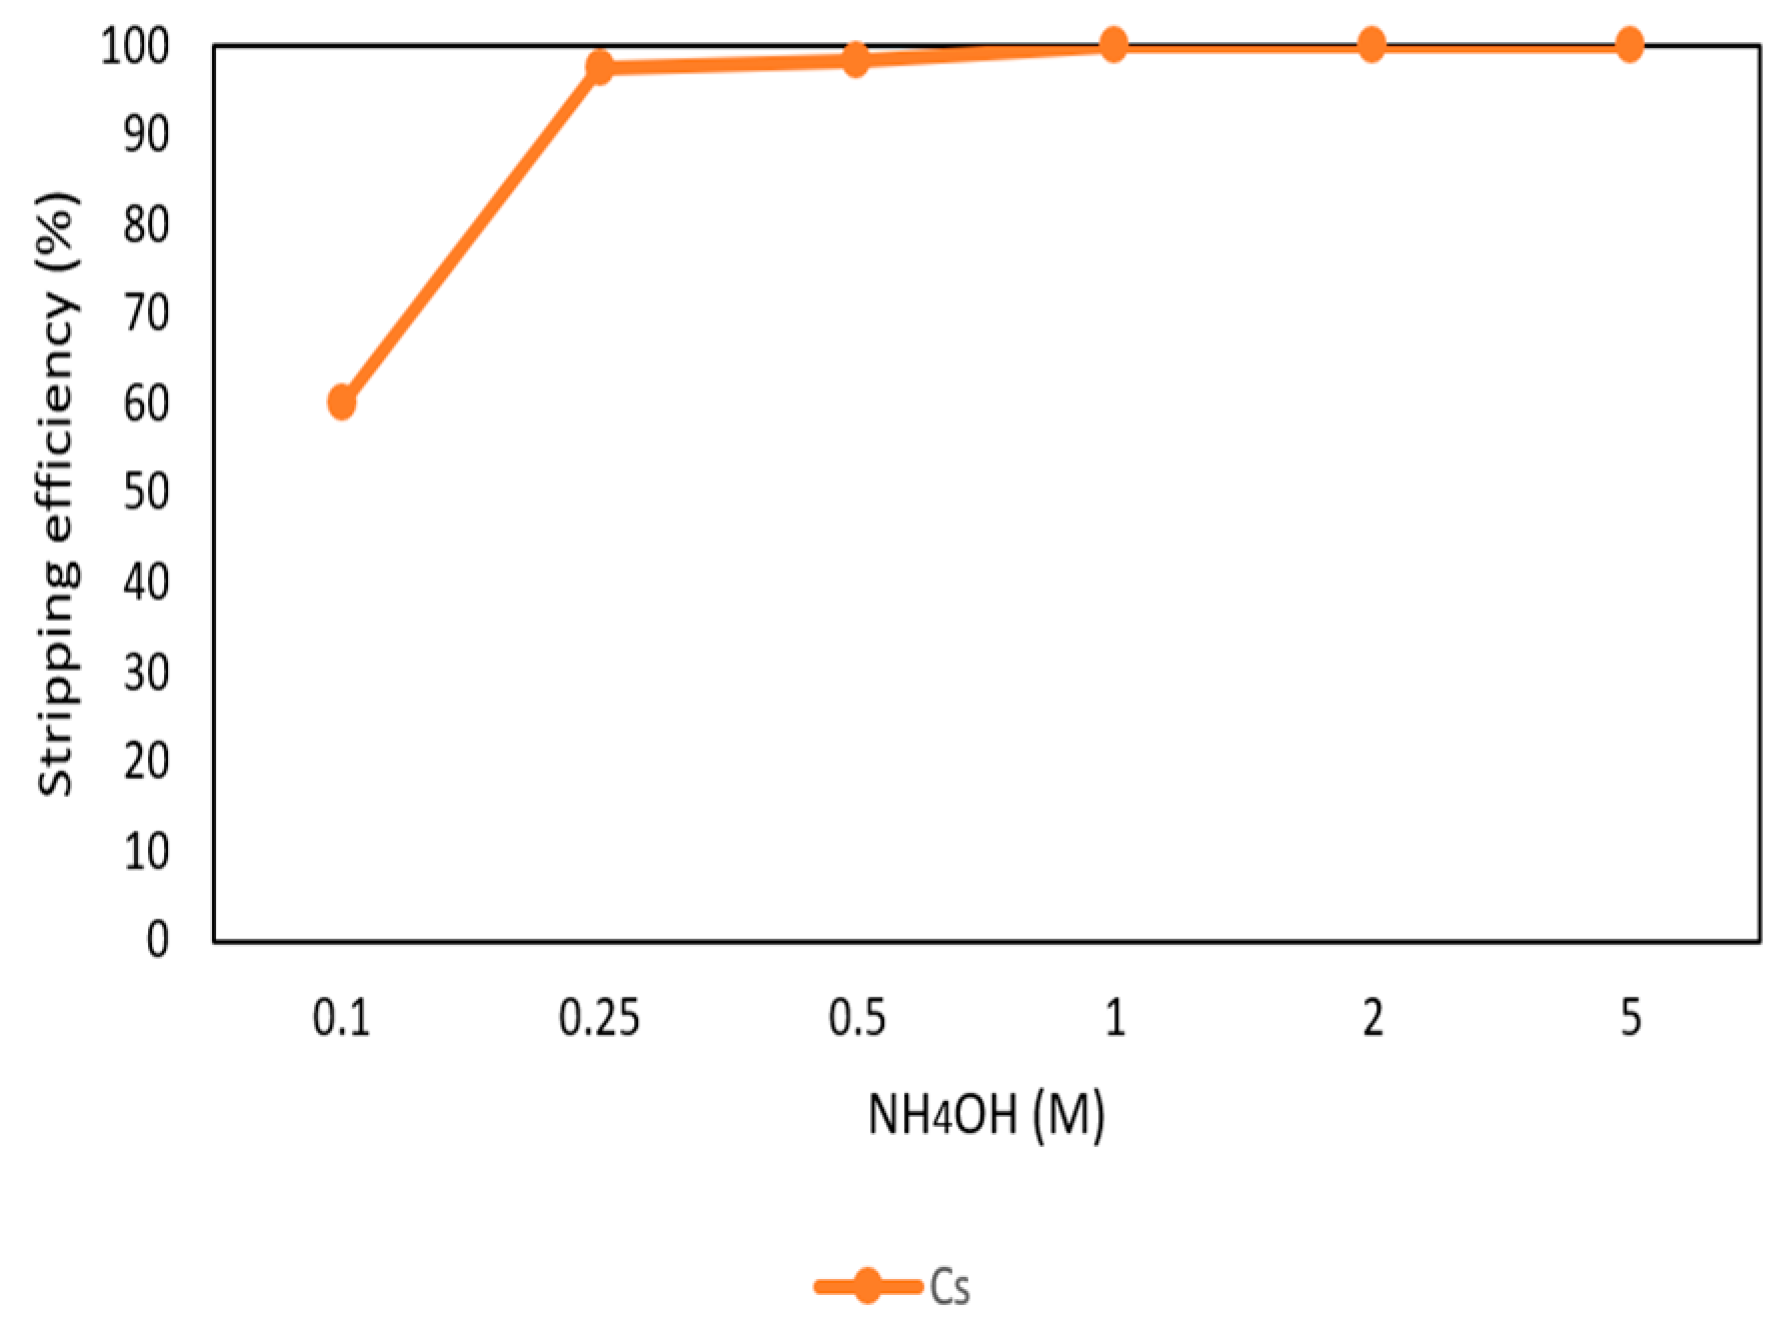
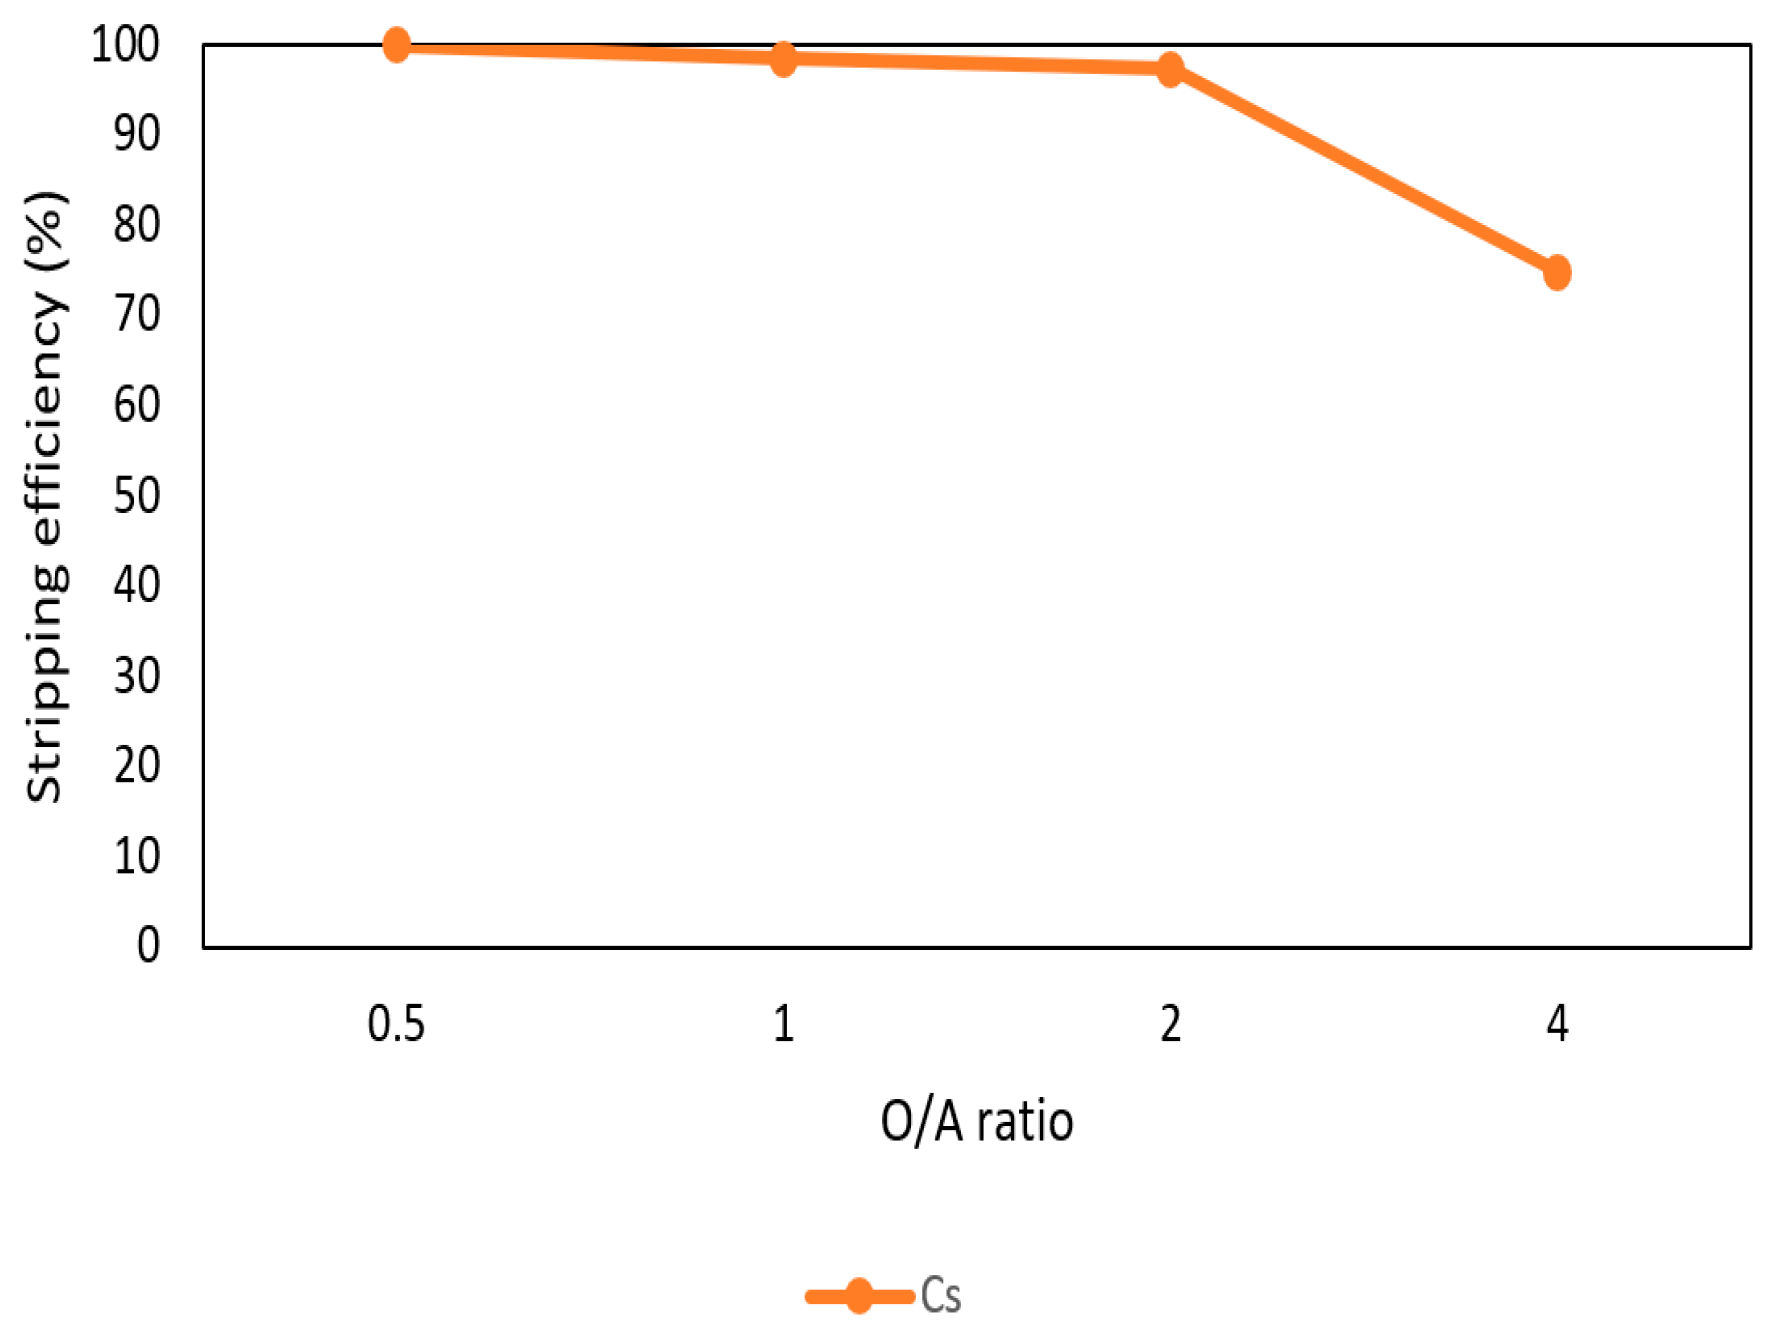
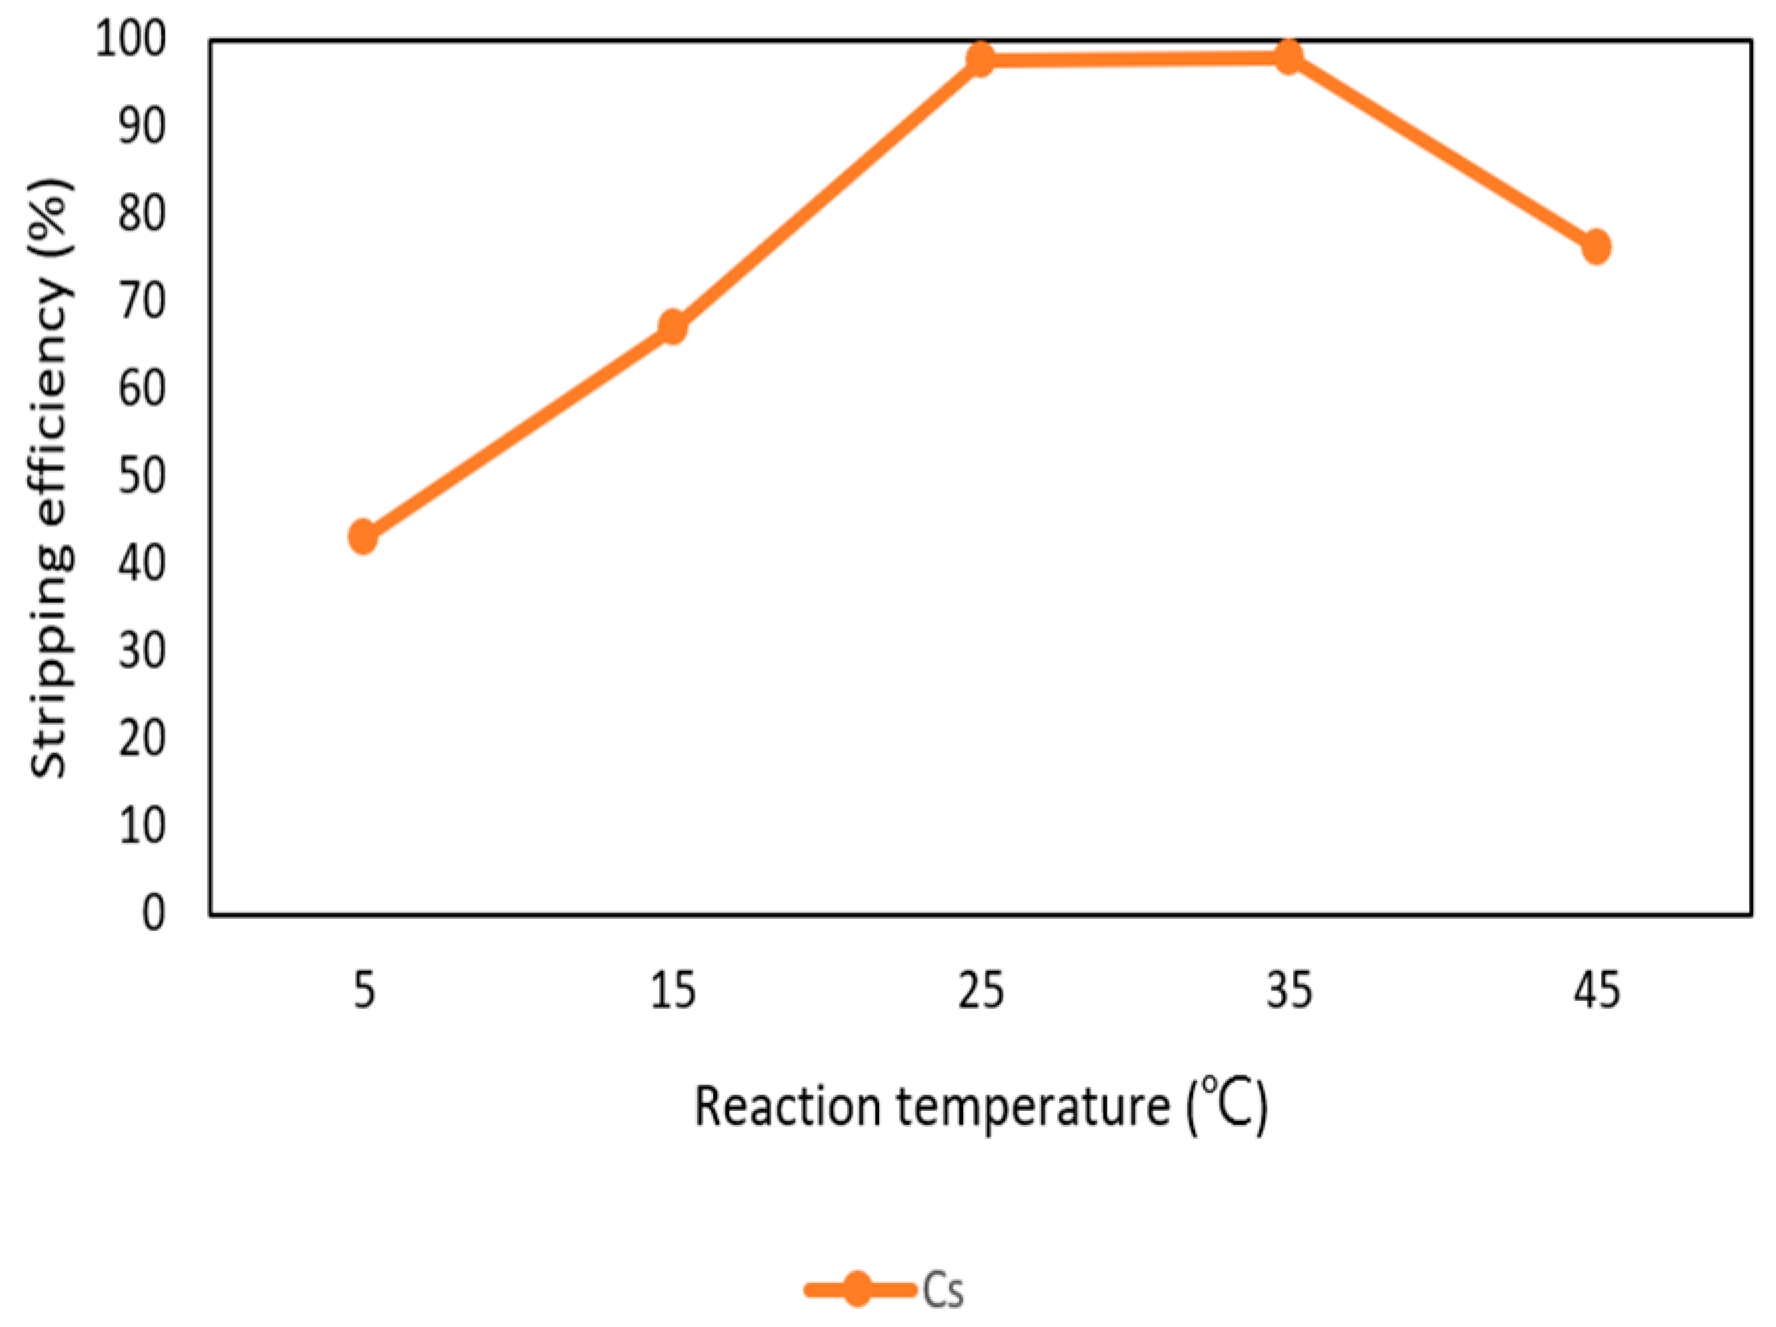
3.2.6. Stripping of Cs from the Organic Phase through Ammonia

After the extraction process, 420 mg/L of cesium was in the organic phase and needed to be stripped. In this process, NH4OH was chosen as a stripping agent and the effect of NH4OH was presented in Figure 9, Figure 10 and Figure 11. Because the stripping efficiencies of rubidium and potassium were low in this procedure, only stripping efficiency of cesium was investigated. Figure 9 shows that when the concentration of NH4OH increased, the stripping efficiency increased as well and become equilibrium in the situation of 1 M, 2 M, and 5 M. Therefore, the optimal concentration of NH4OH was 1 M in the procedure. Figure 10 shows that the stripping efficiency decreased drastically when O/A ratio was 4. It means that insufficient NH4OH was unable to strip the Cs+. Due to this condition, O/A ratio 2 was the optimal condition to get a high concentration of Cs+. Figure 11 presents the stripping efficiency with reaction temperature. Because t-BAMBP has great extracting ability at lower temperatures, it made NH4OH unable to strip Cs+. However, if the temperature was above 35 °C, NH4OH decomposed to NH3 first which was unable to strip Cs+. Hence, the stripping temperature was chosen at a room temperature of 25 °C in this step. Finally, the stripping efficiency of Cs+ was almost 99.9% in the first stripping process.

3.3. Second Stage of Solvent Extraction for Rb

After the first stage of solvent extraction, metals were separated into two systems. One system was cesium, and another system was rubidium with other impurities such as lithium, sodium, potassium, calcium, and magnesium. In the second stage of solvent extraction, t-BAMBP was also chosen as extractant to separate rubidium with other impurities. Among the rest of the impurities, only K could be extracted by t-BAMBP due to the property of extractant. In this case, the values of K and Rb were presented to analyze the optimal condition.

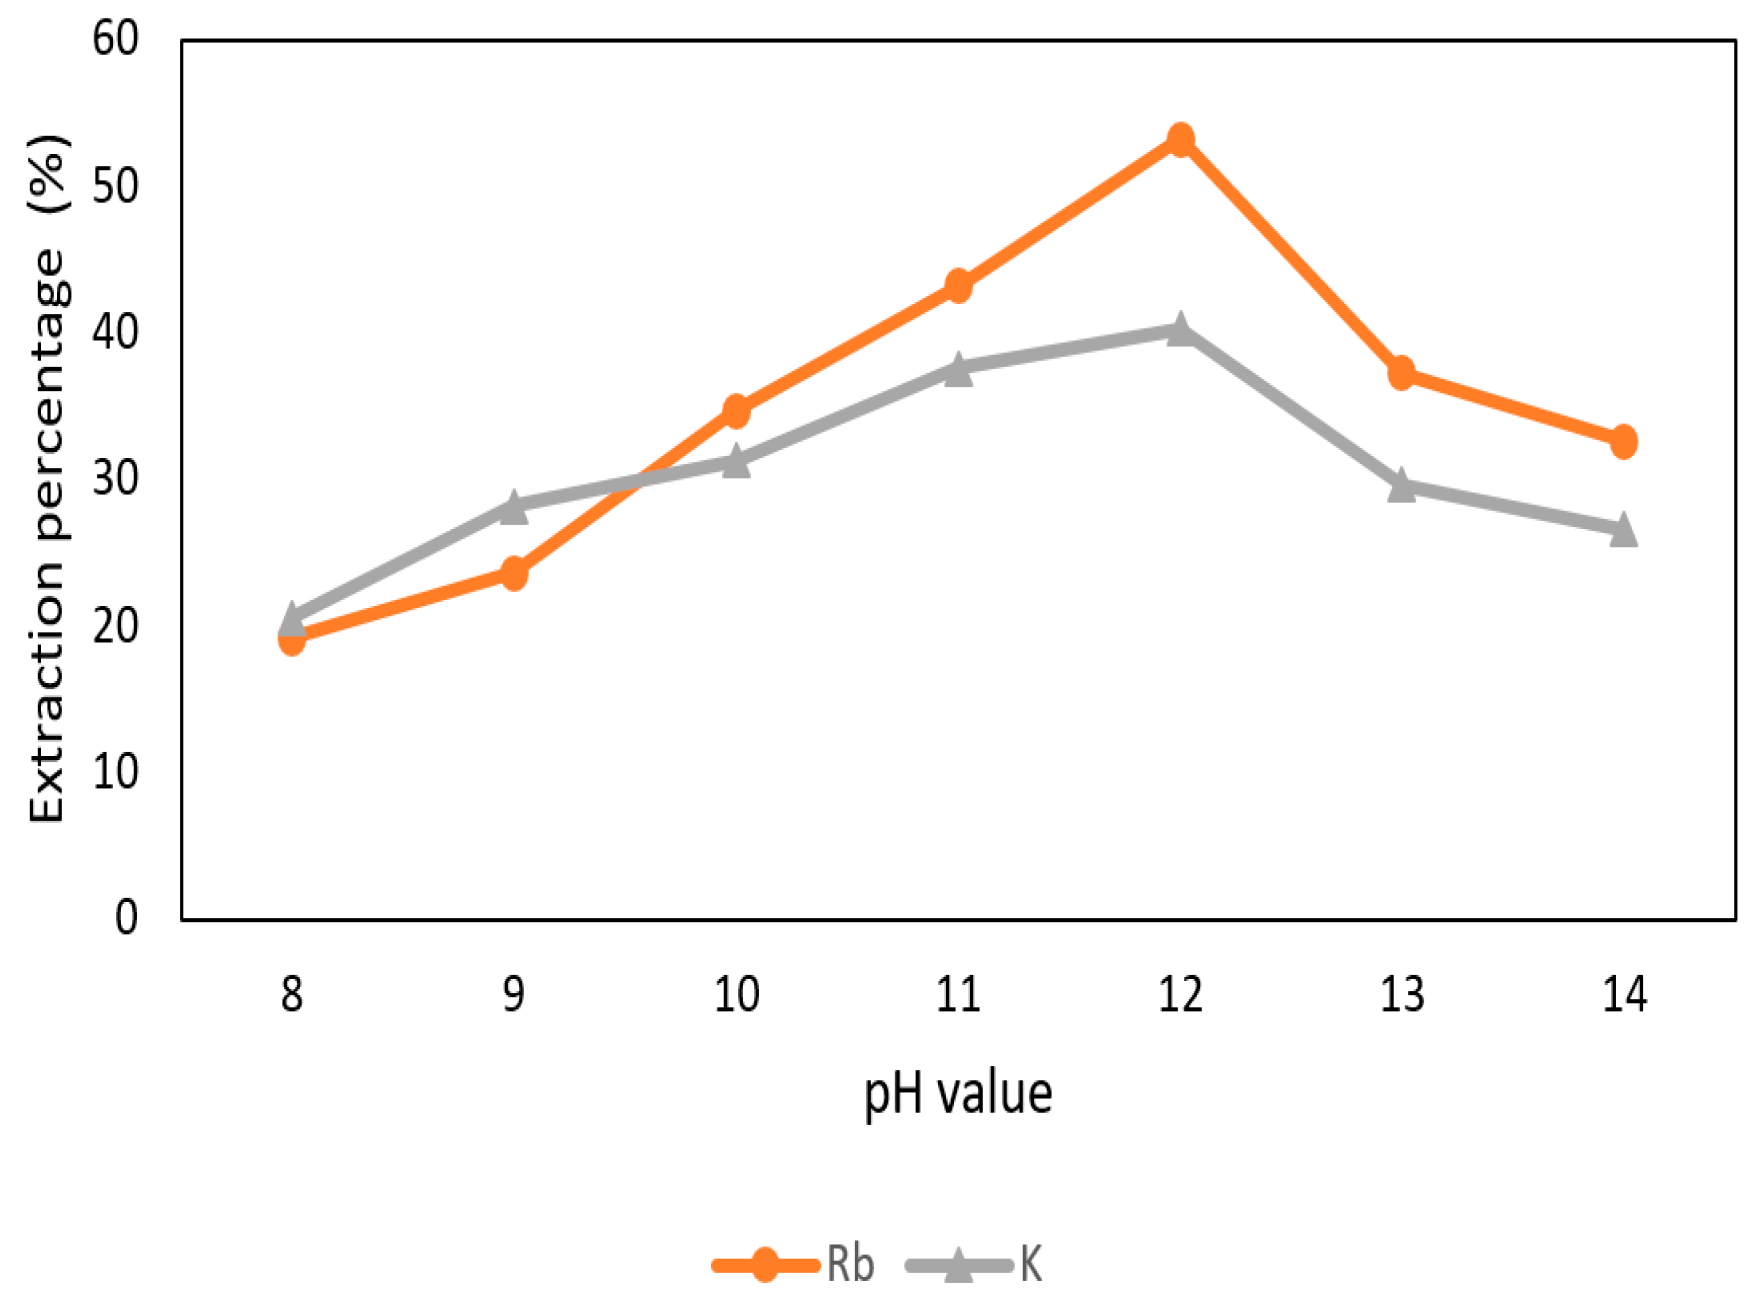
3.3.1. Effect of pH Value of the Aqueous Phase

The effect of pH value of the aqueous phase in the extraction and separation of Rb+ and K+ was shown in Figure 12. The pH values were adjusted to 8 to 14 with 0.1 M t-BAMBP and O/A ratio 1:1 at reaction time 15 min and 25 °C. The extraction percentage of Rb+ and K+ increased when the pH value raised up and declined at pH 13 and pH 14 due to the emulsification. In order to extract more Rb+, pH 12 value was chosen in this procedure.

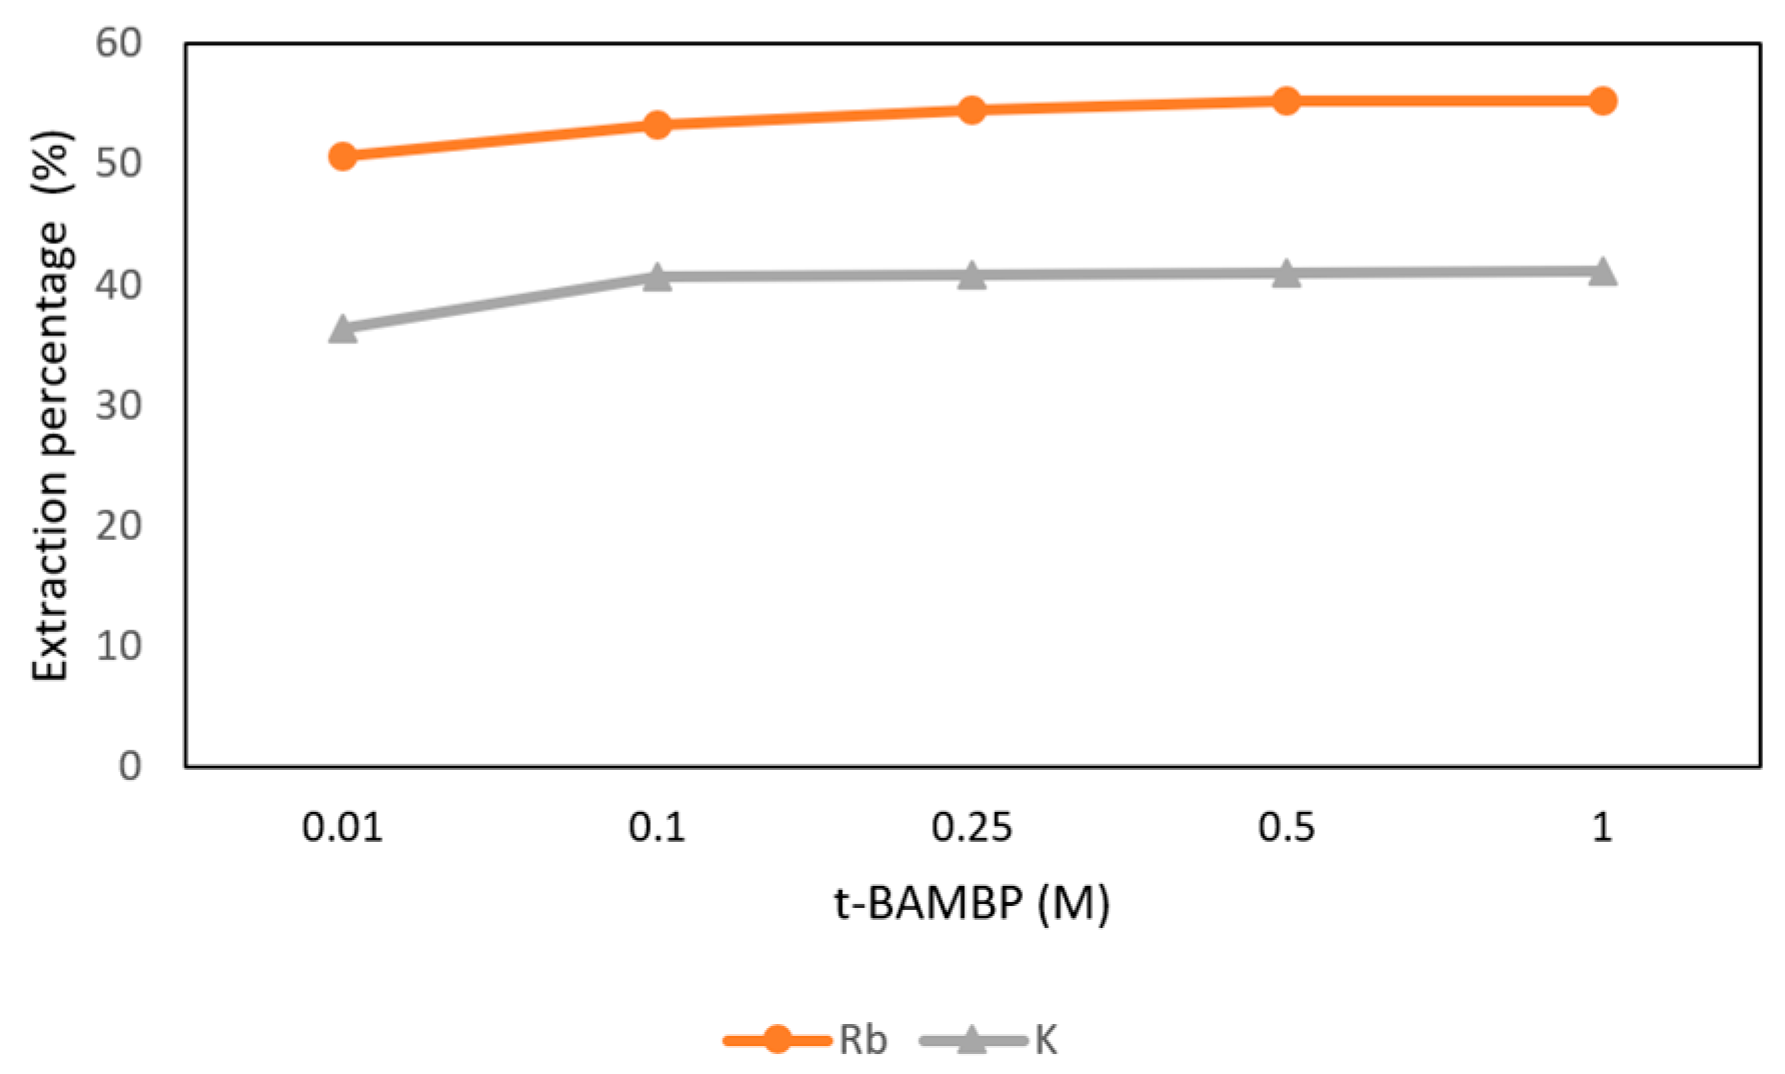
3.3.2. Effect of t-BAMBP Concentration

The conditions of t-BAMBP concentration from 0.01 M to 1 M at pH 12 and O/A ratio 1:1 at reaction time 15 min and 25 °C were set in this step. Figure 13 shows that the extraction percentages of Rb+ from 0.01 M to 1 M were about 50% and the percentages of K+ were about 40%. In order to get more rubidium, 0.5 M t-BAMBP was chosen in this procedure.

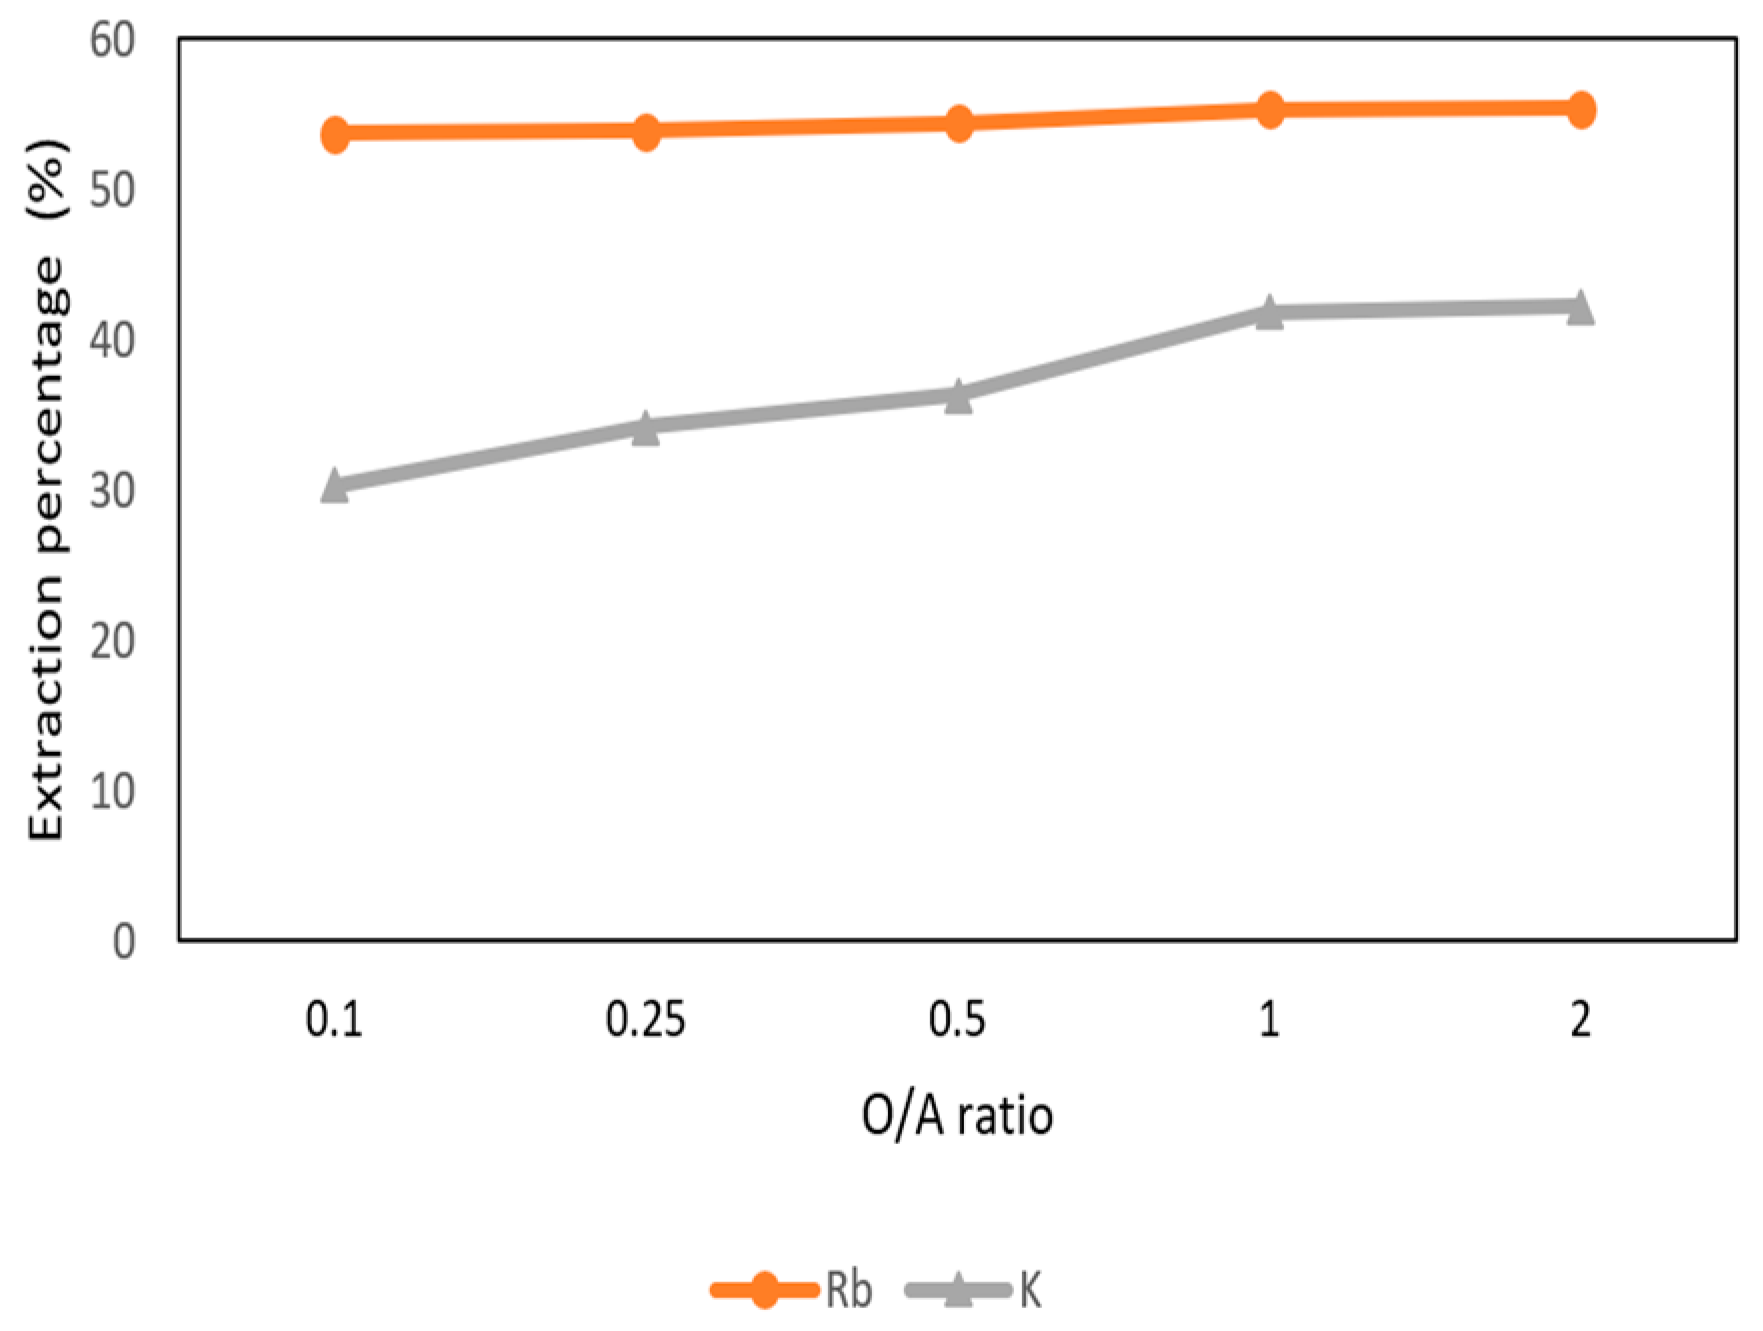
3.3.3. Effect of O/A Ratio

Figure 14 shows the O/A ratio was set from 0.1 to 2 with 0.5 M t-BAMBP at pH 12 and at reaction time 15 min and 25 °C. The result shows that the extraction percentages of Rb+ maintain above 50% with different O/A ratios. However, when the O/A ratio was greater than 0.1, the extraction percentage of K+ increased gradually. Hence, in order to get a high concentration of Rb+ and avoid the impurities, the O/A ratio 0.1 was an optimal parameter in this step.

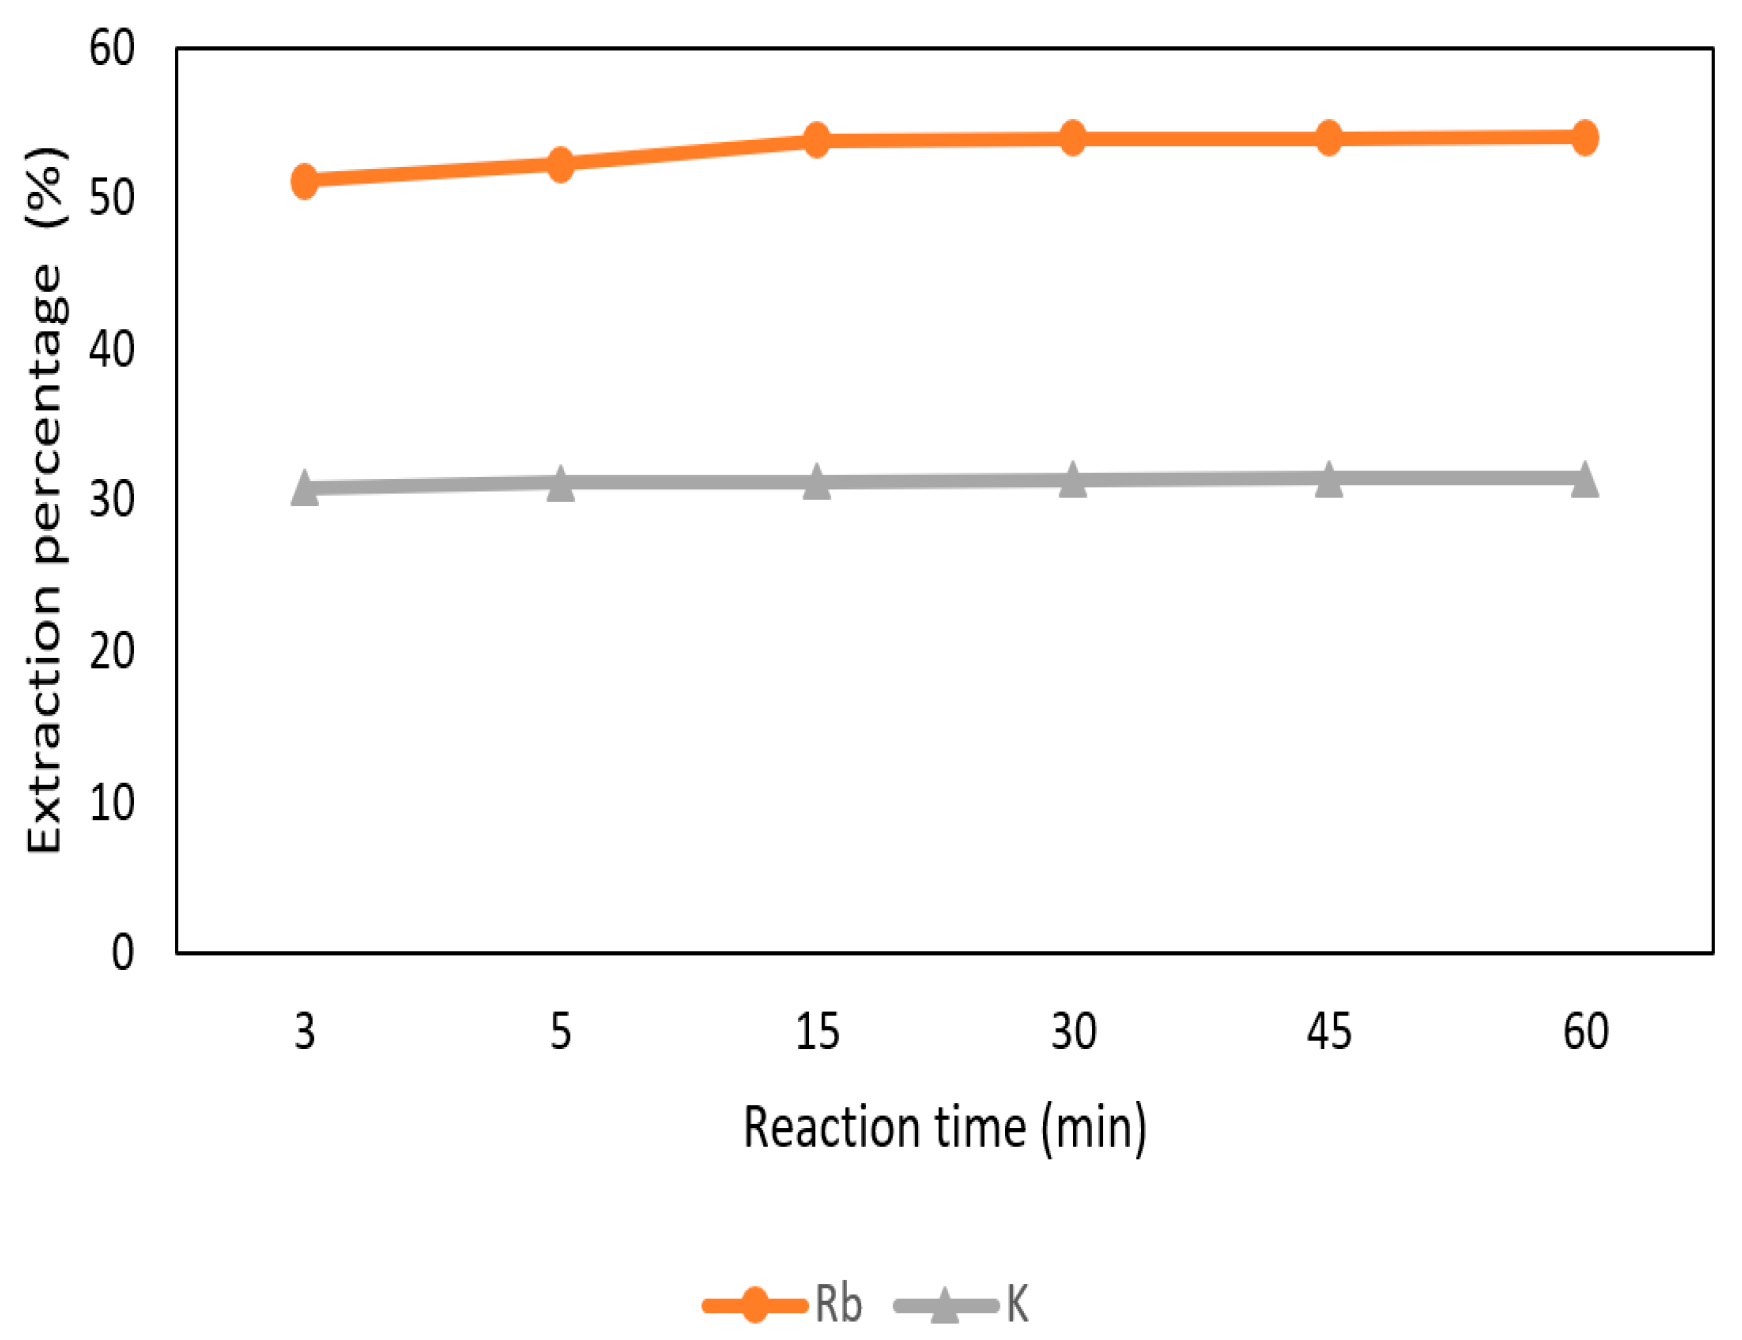
3.3.4. Effect of Reaction Time

The effect of reaction time was set from 3 min to 60 min with 0.5 M t-BAMBP at pH 12 and O/A ratio 0.1:1 at 25 °C. In Figure 15, the extraction percentage of Rb+ increased gradually from 3 min to 15 min and became stable. On the other hand, the extraction percentage of K+ was almost 30% from 3 min to 60 min. Hence, 15 min of reaction time was chosen in this process to extract rubidium.

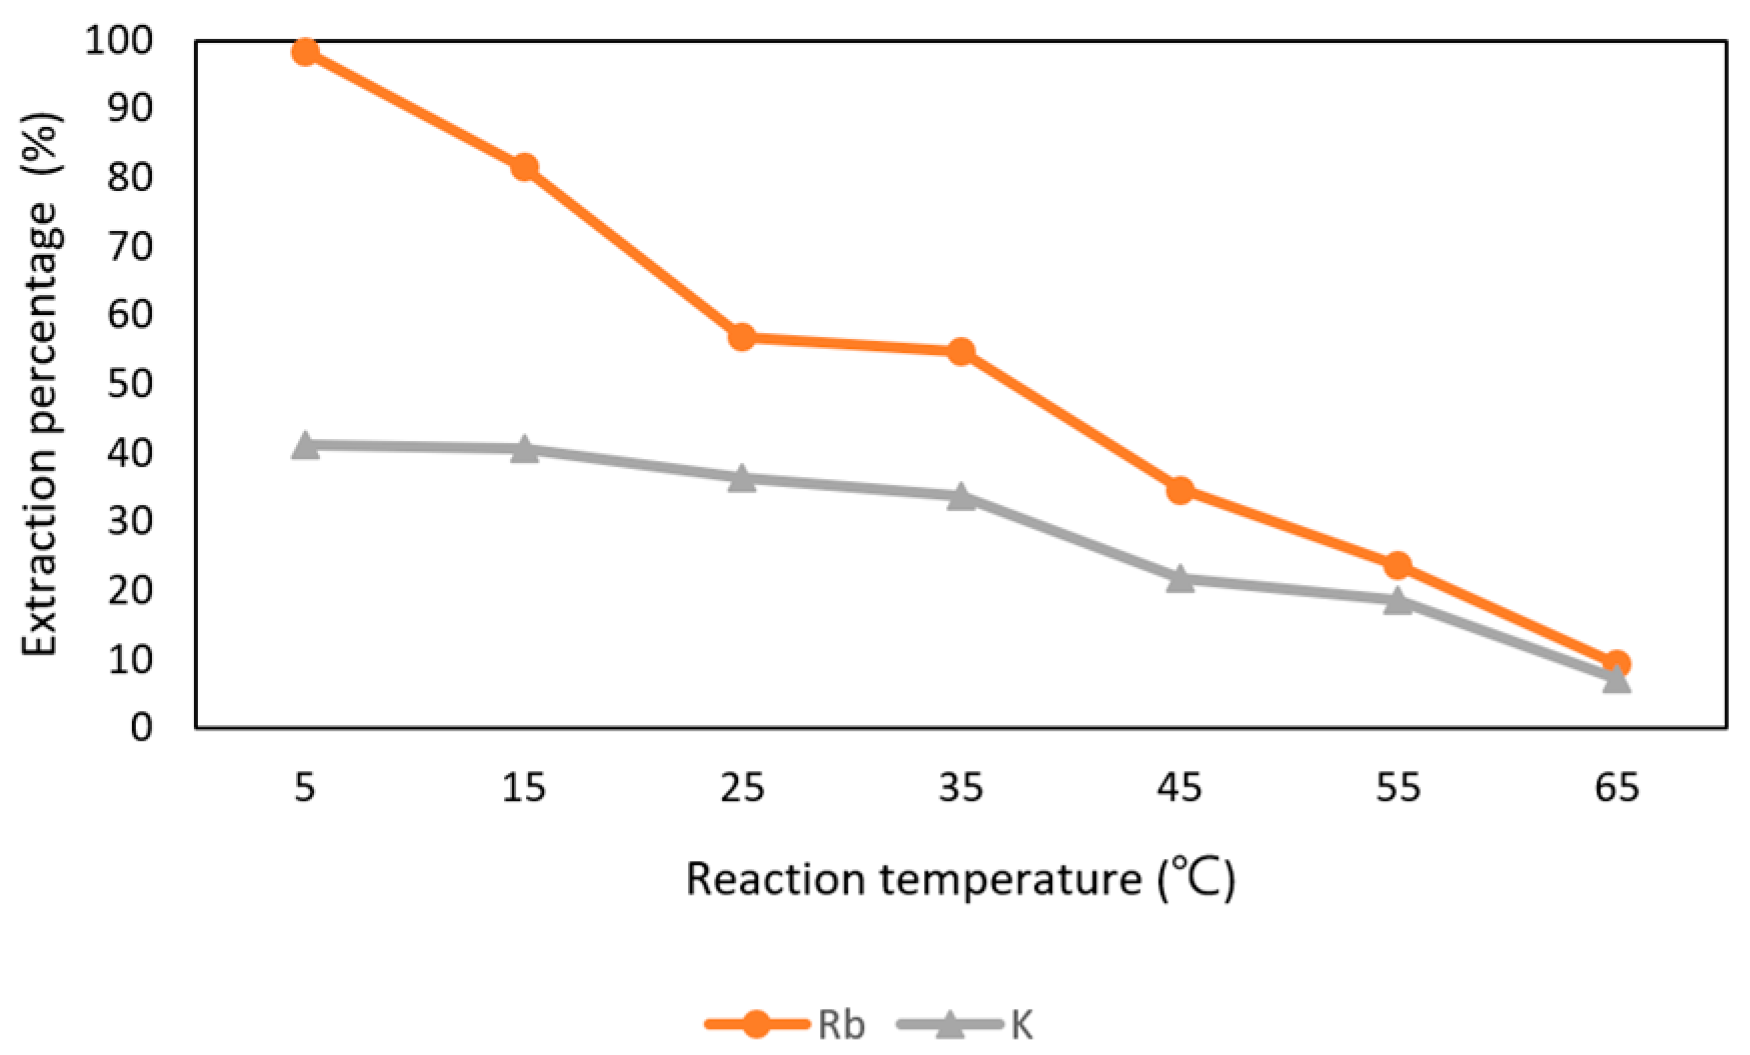
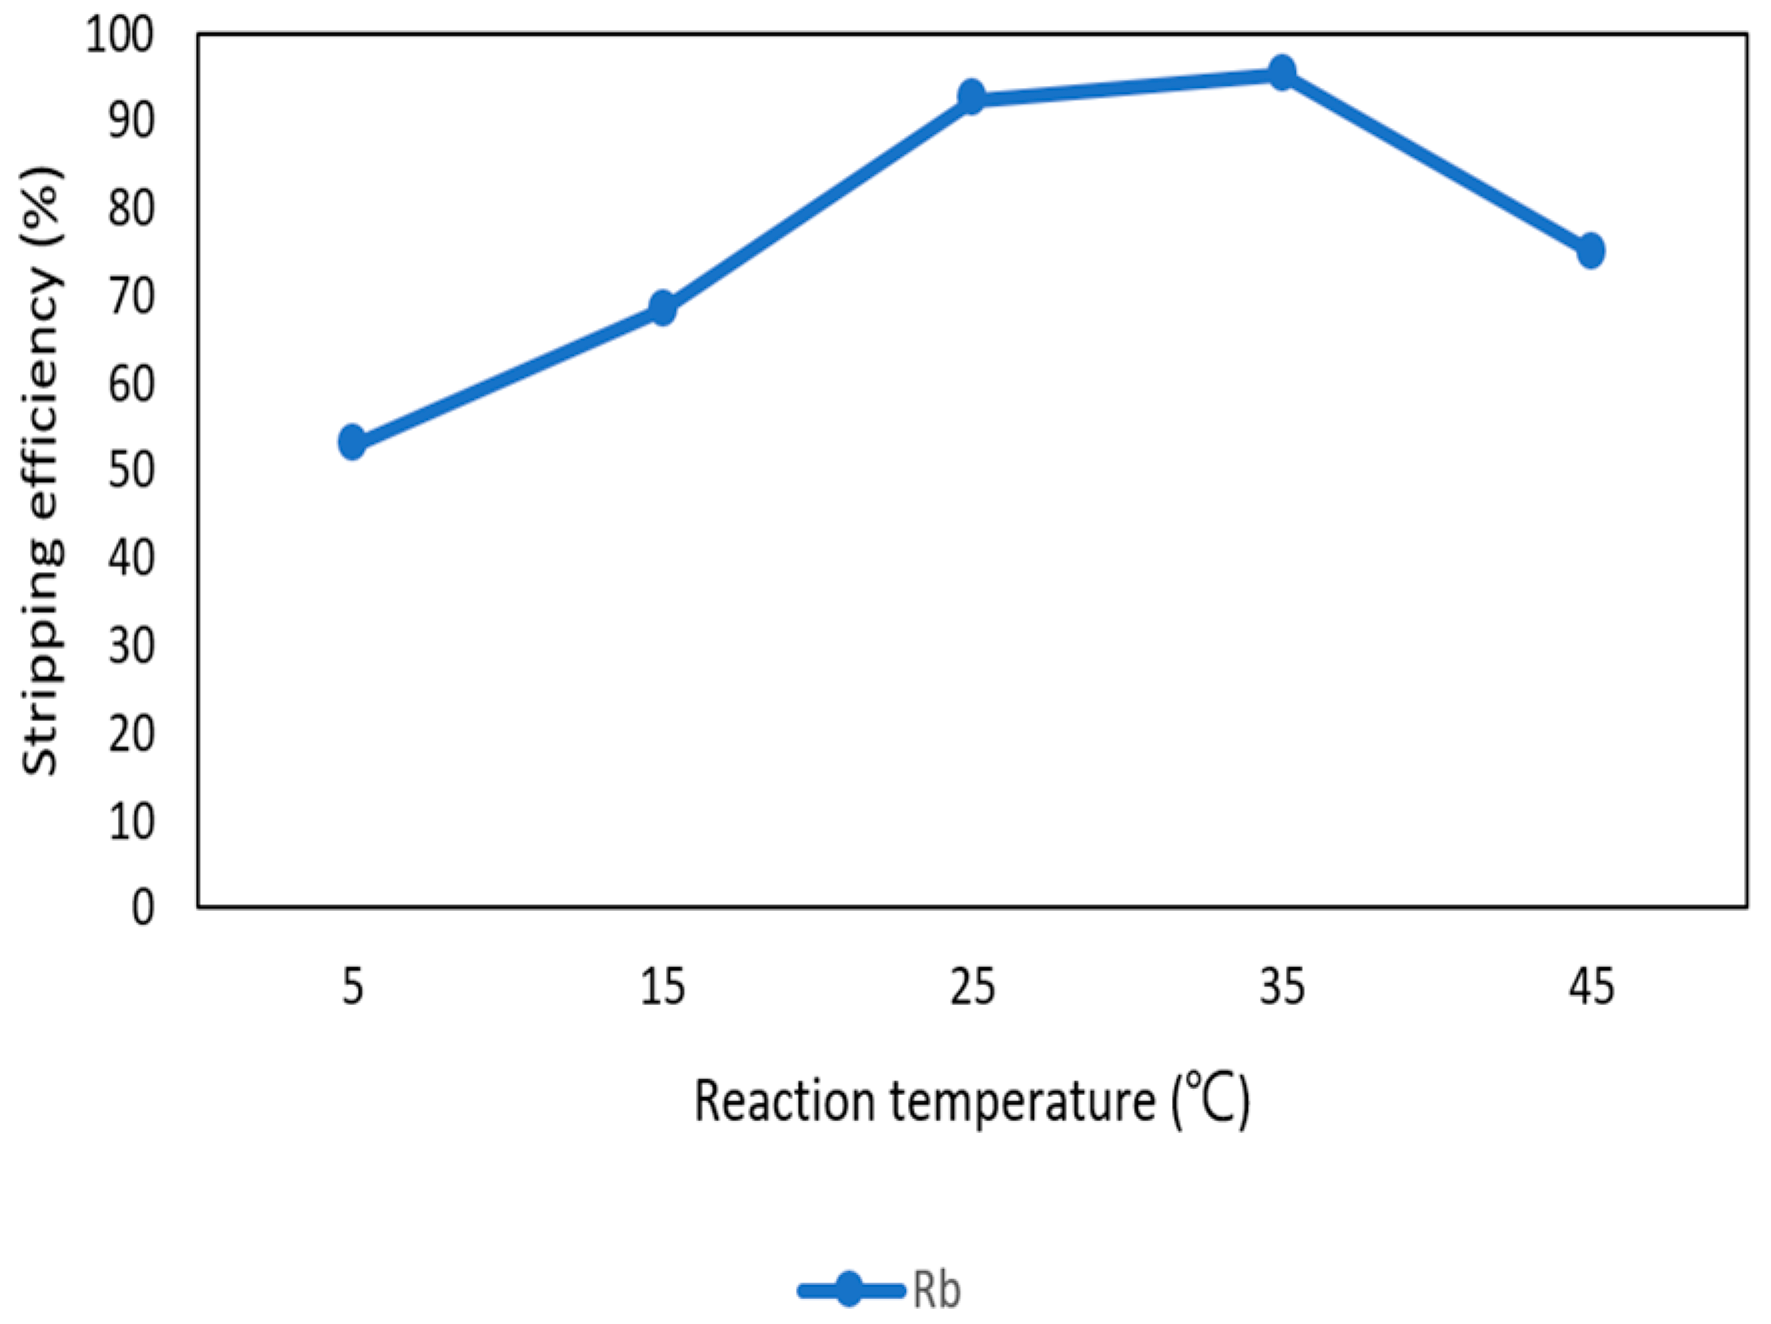
3.3.5. Effect of Reaction Temperature

In Figure 16, it shows that Rb+ was influenced by the reaction temperature. The effect of reaction time was set from 5 °C to 65 °C with 0.5 M t-BAMBP at pH 12 and O/A ratio 0.1:1 at 15 min. The extraction percentage of Rb+ was about 98% at 5 °C and decreased drastically after 5 °C. The percentage of 35 °C was 56.8% and only about 10% at 45 °C. In order to extract more Rb+, 5 °C was chosen as the optimal parameter. Finally, the extraction percentage of Rb+ and K+ and were respectively 98.3% and 41.3% with the condition of pH 12 of the aqueous phase, 0.5 M t-BAMBP, O/A ratio of 0.1, 15 min reaction time, and 5 °C reaction temperature. Compared to other studies, this study shows the almost same extraction percentage of Rb+ with lower pH value and O/A ratio at low temperature.

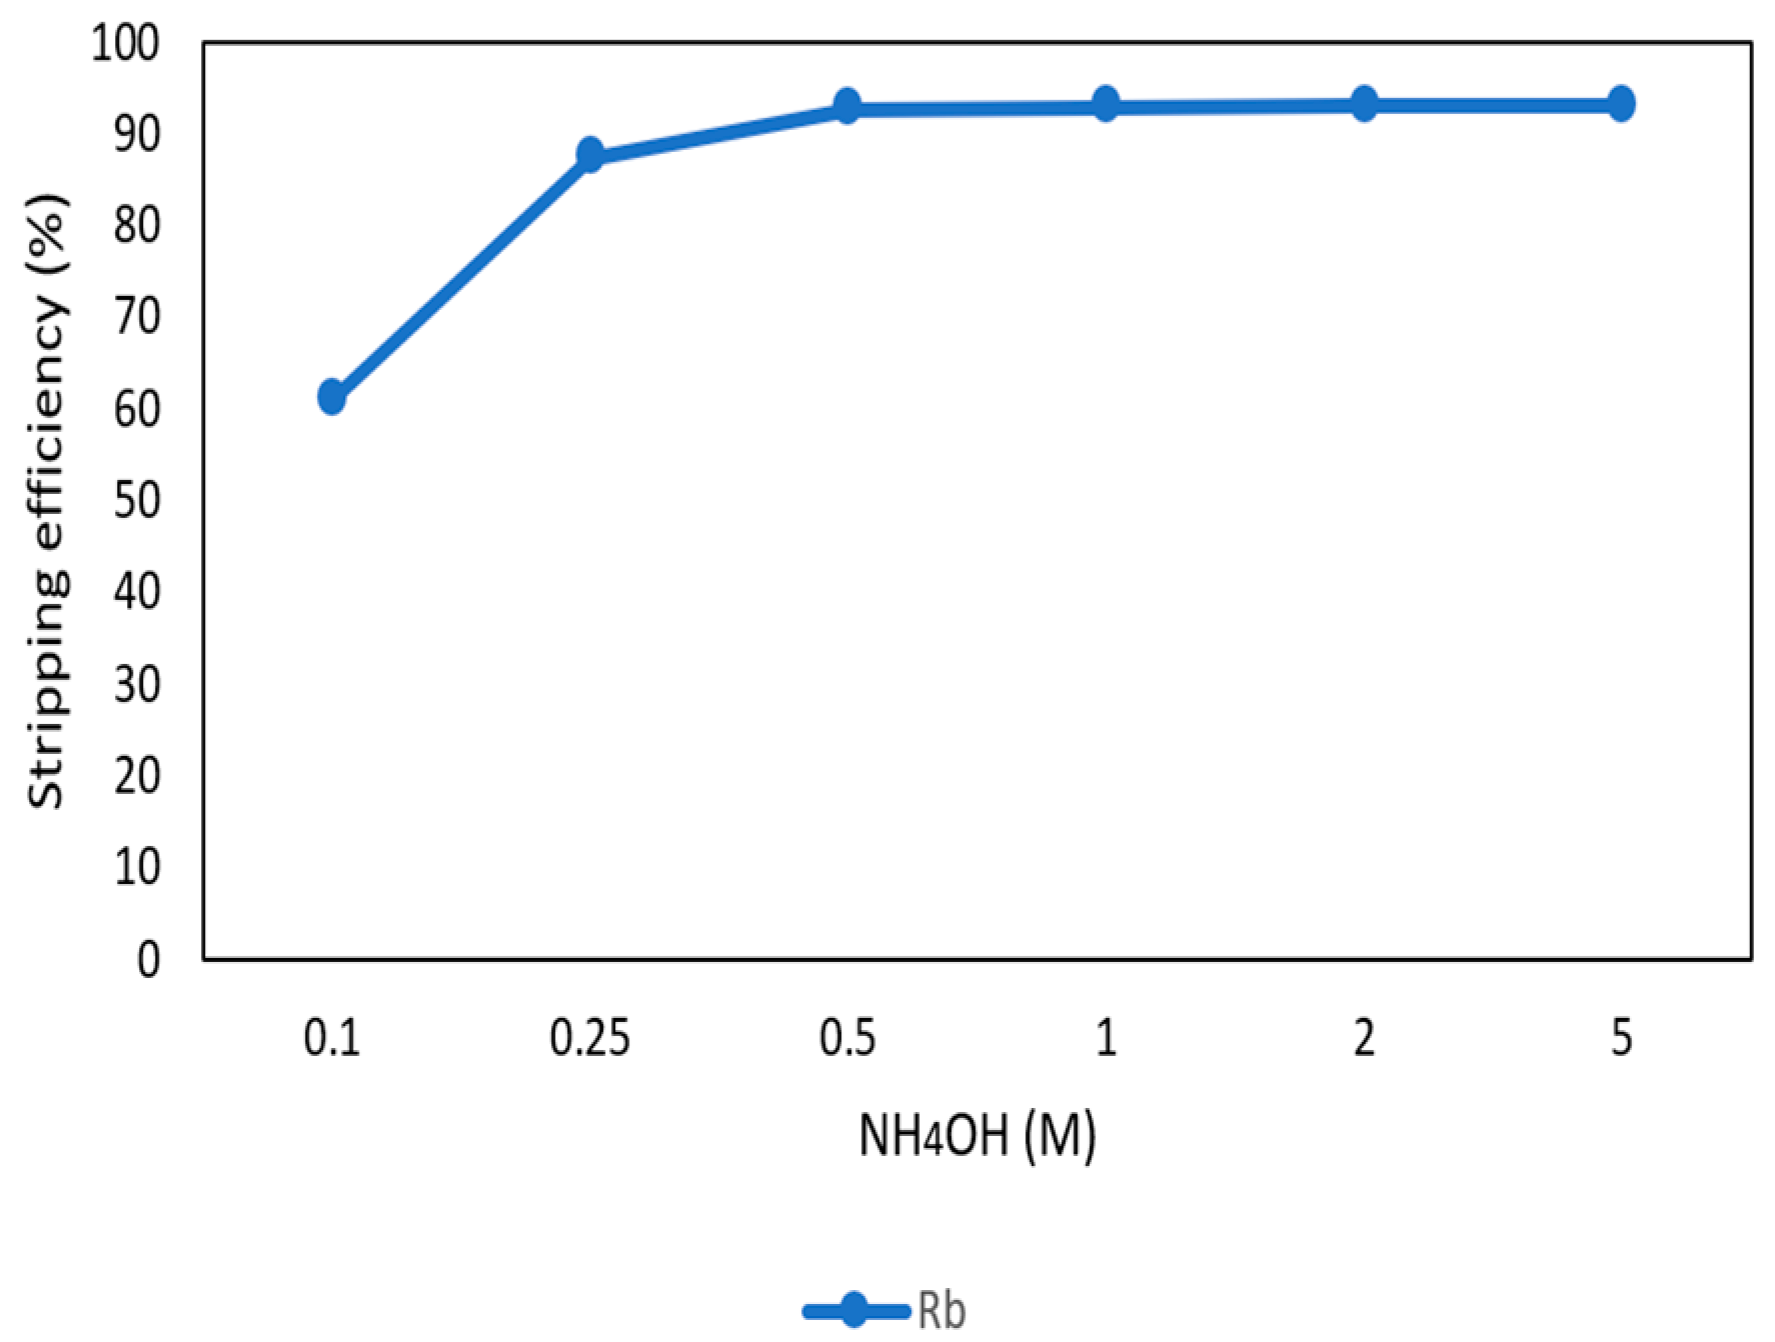
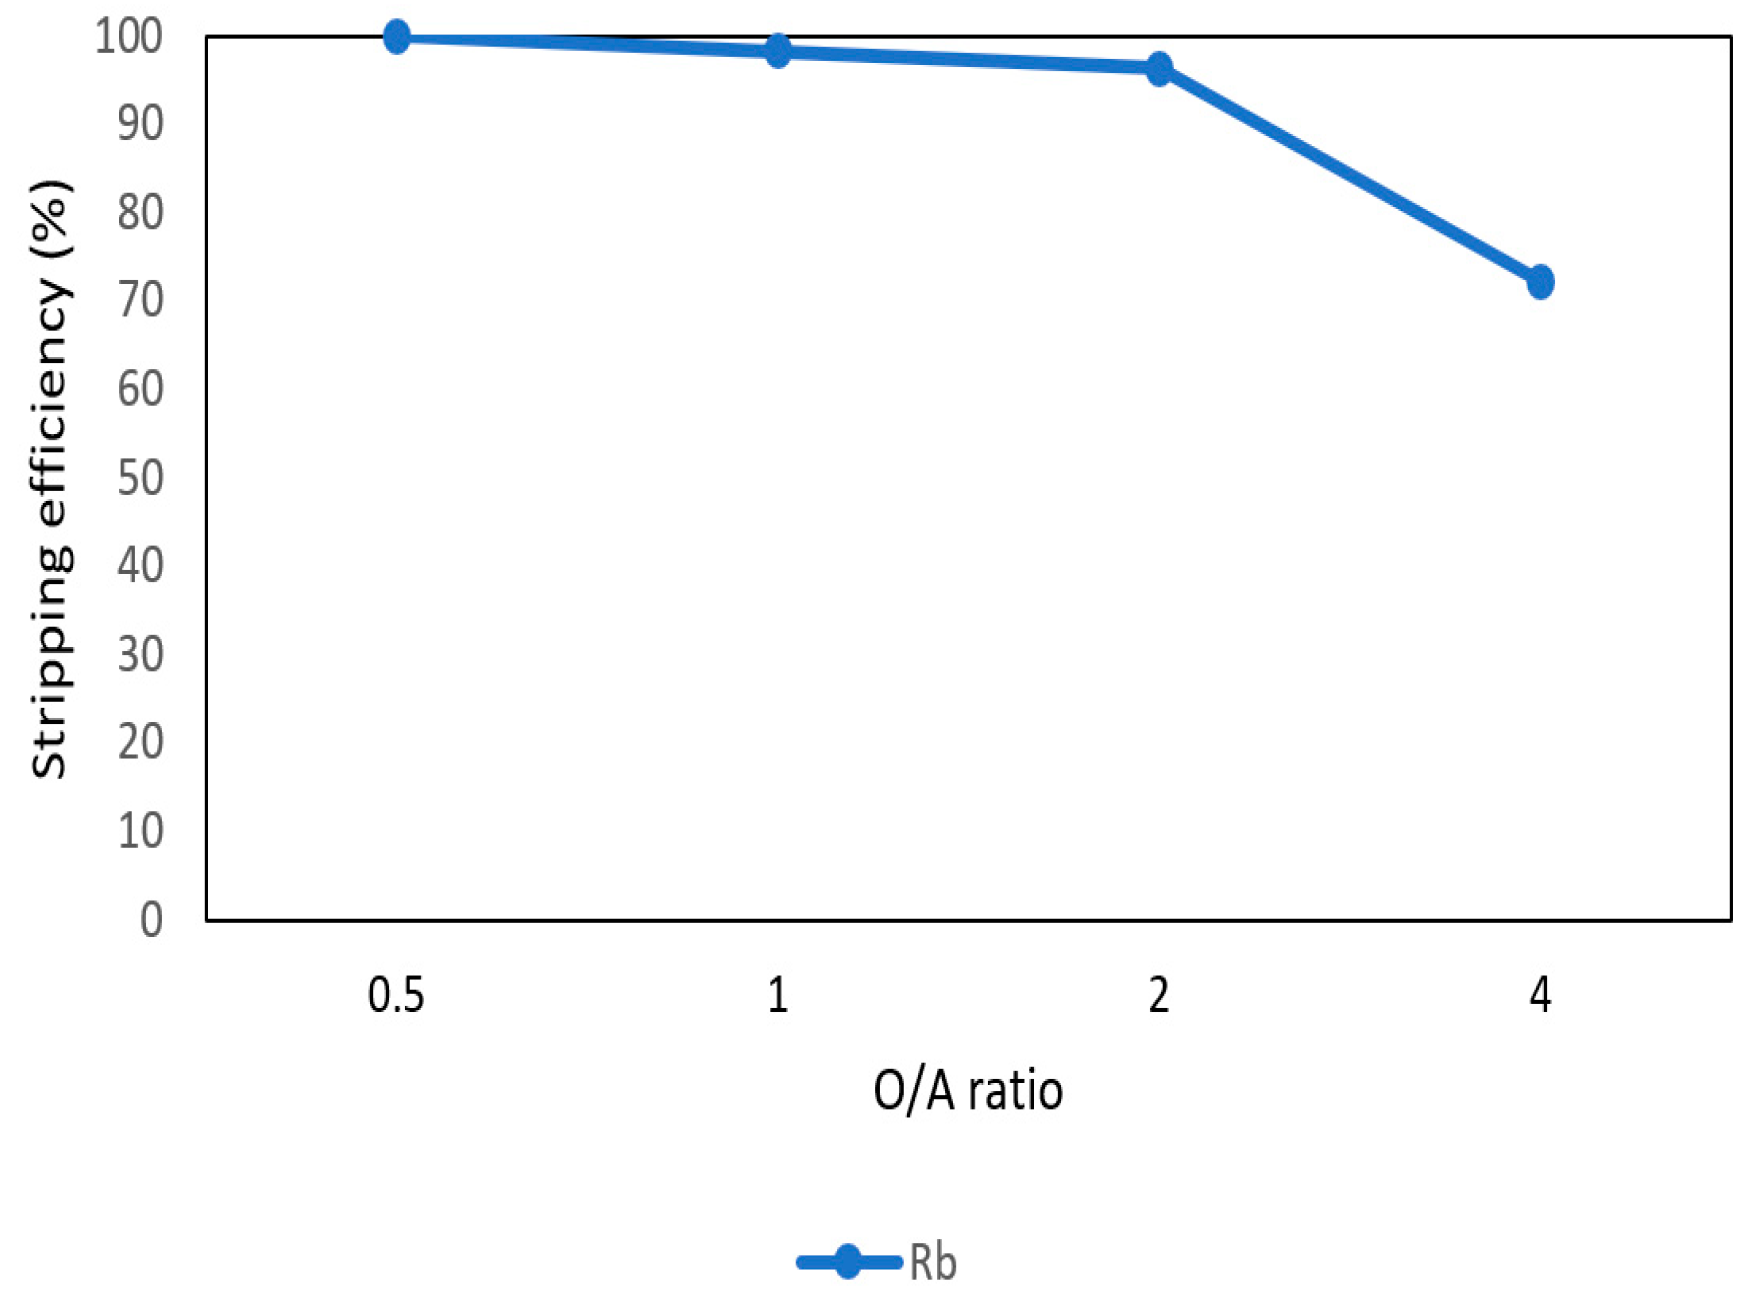
3.3.6. Stripping of Rb from the Organic Phase through Ammonia

After the second stage of the extraction process, 70 mg/L of rubidium was in the organic phase and needed to be stripped. In this process, NH4OH was chosen as a stripping agent as well and the effect of NH4OH concentration was presented in Figure 17, Figure 18 and Figure 19. Because the stripping efficiencies of potassium was low in this procedure, only stripping efficiency of rubidium was investigated. Figure 17 shows that when the concentration of NH4OH increased from 0.1 M to 0.5 M, the stripping efficiency of Rb+ increased as well. However, efficiency became equilibrium in the situation of 0.5 M, 1 M, 2 M, and 5 M. Therefore, the optimal concentration of NH4OH was 0.5 M in this step. Figure 18 shows that the stripping efficiency of Rb+ was above 90% and decreased at O/A ratio 4. Due to this condition, O/A ratio 2 was the optimal condition. Figure 19 presents the stripping efficiency with reaction temperature. Like the situation of Cs+, the stripping efficiency of Rb+ was lower at the low temperature and gradually rose with increase in temperature. Hence, the stripping temperature was chosen as 35 °C in this procedure. Finally, the stripping efficiency of Rb+ was almost 95% in the second stripping process. After the extraction and stripping of Cs+ and Rb+, the optimal parameters of solvent extraction are shown in Table 3 and Table 4, and the components of stripping solutions are shown in Table 5 and Table 6.

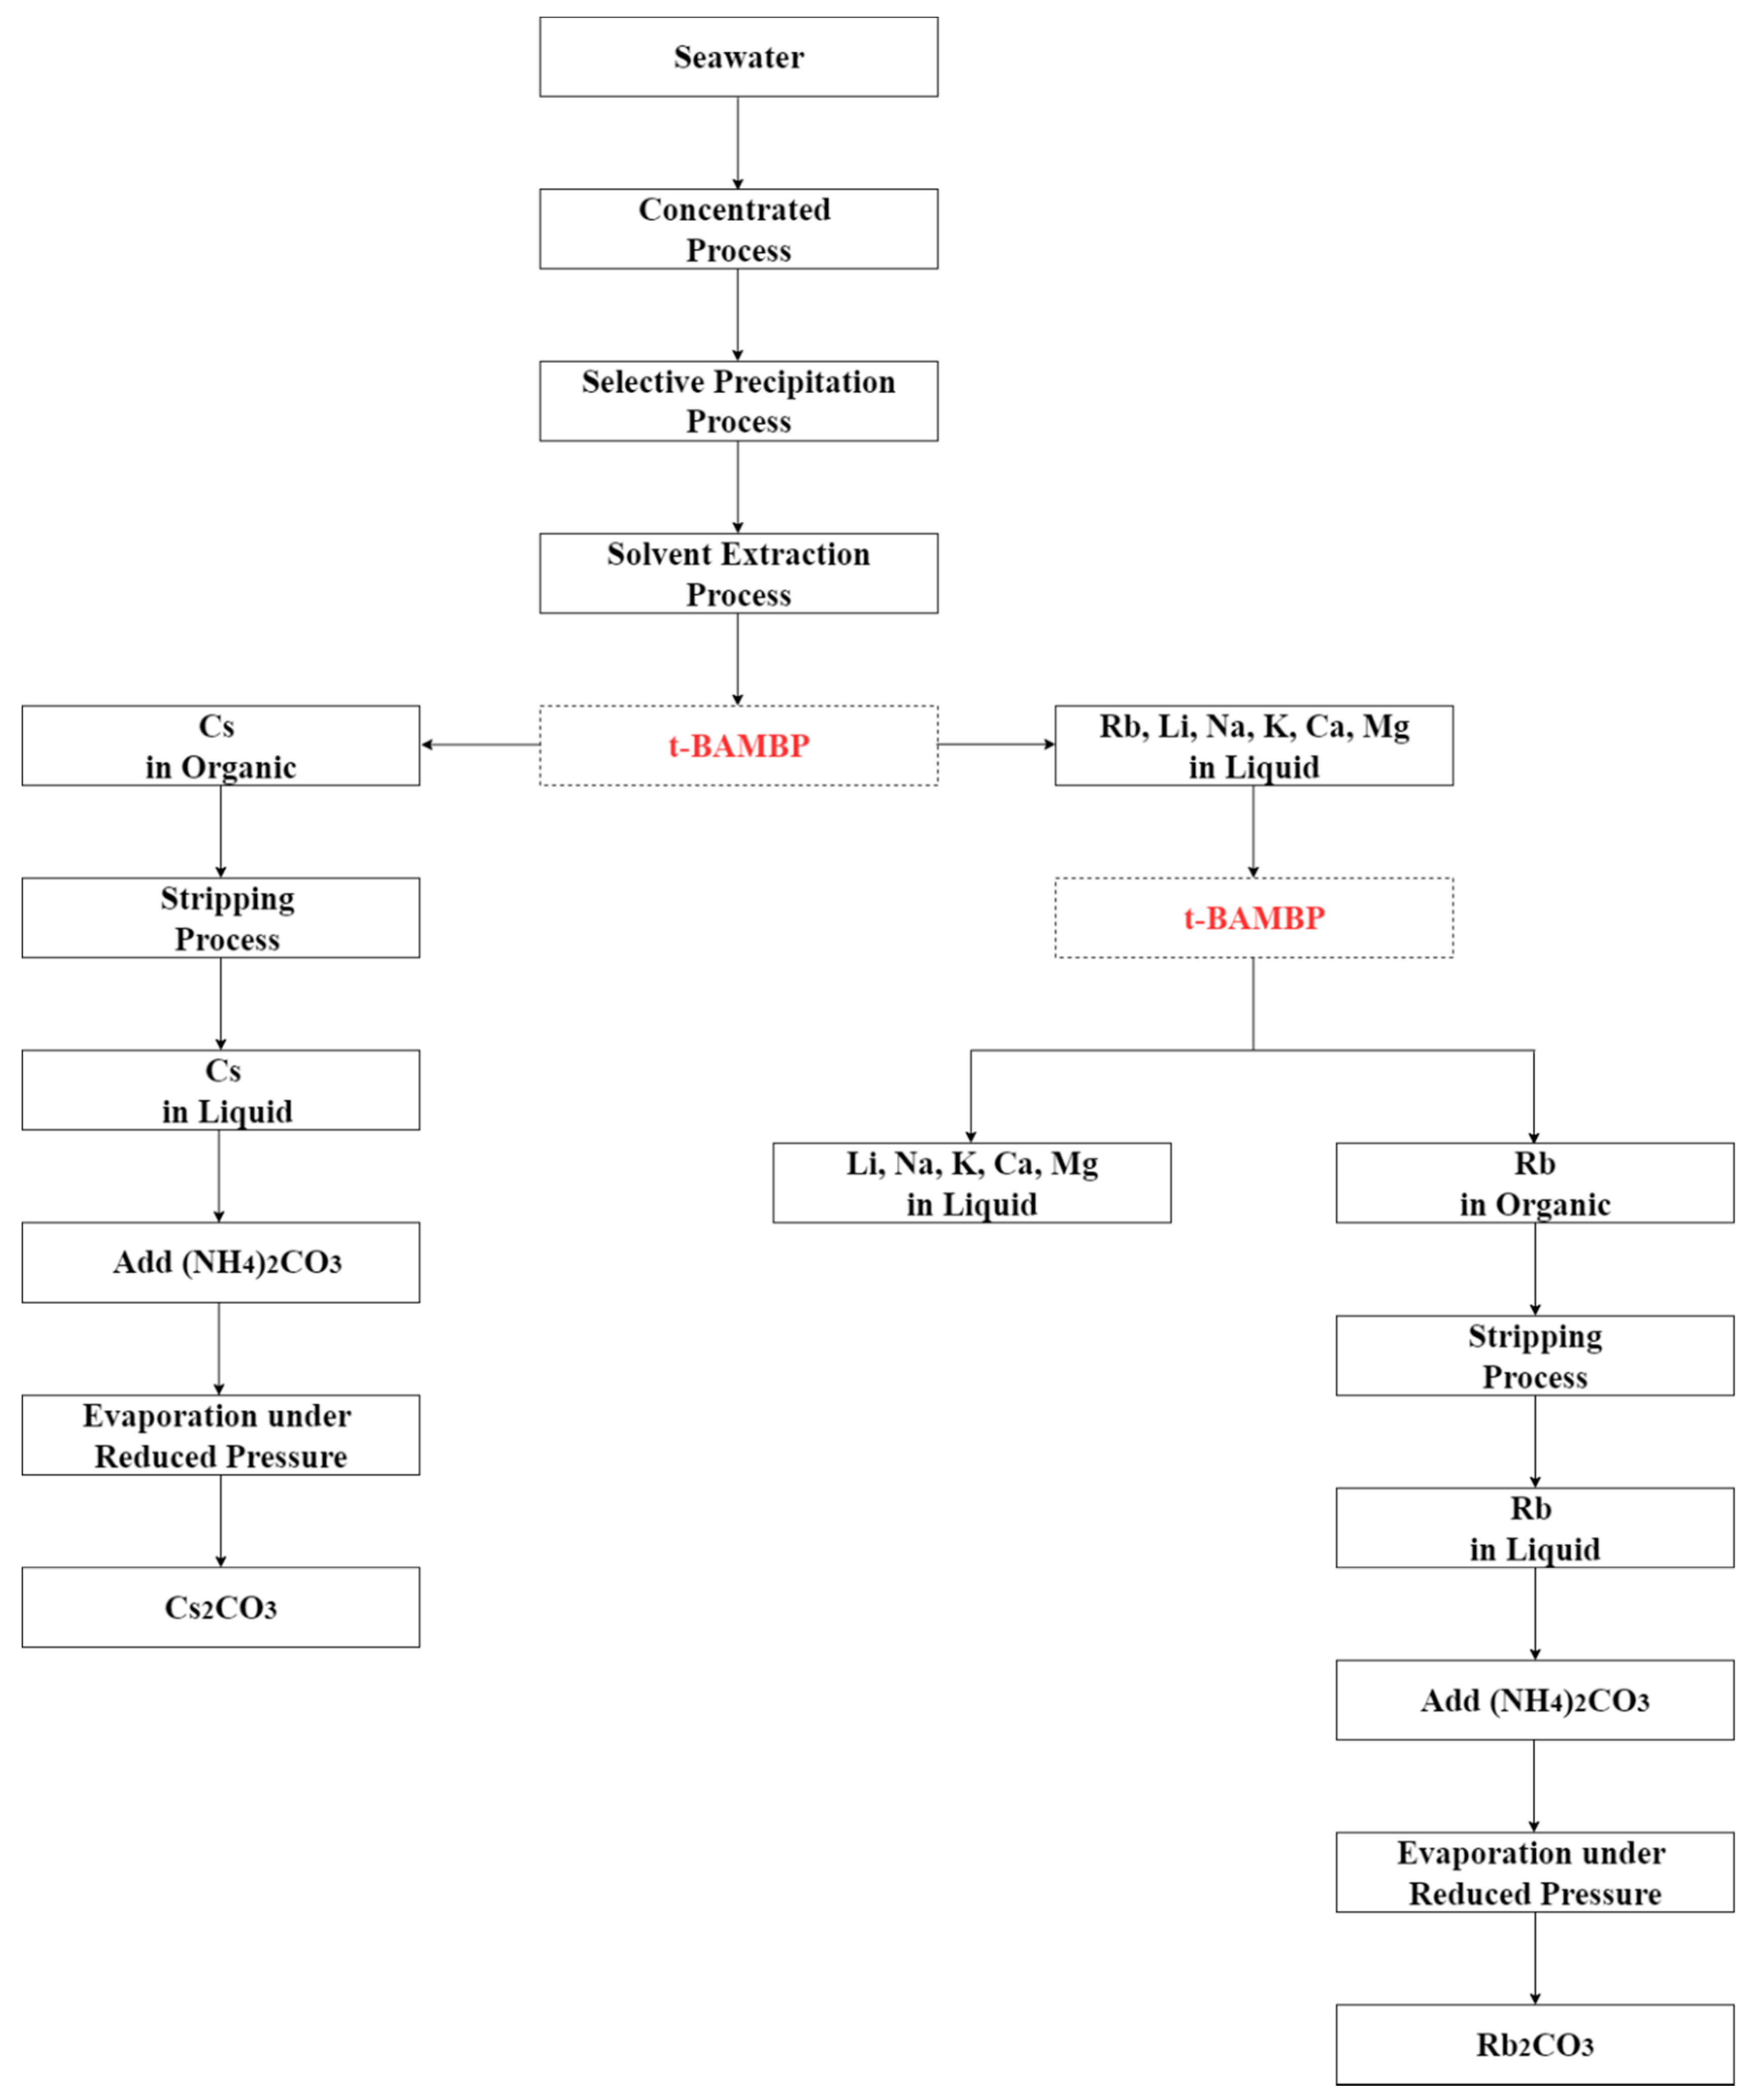
3.4. Production of Rubidium Carbonate and Cesium Carbonate

In order to get stable compounds of rubidium and cesium, ammonium carbonate was added into rubidium hydroxide solutions and cesium hydroxide solutions to produce rubidium carbonate solutions and cesium carbonate solutions. The reaction situations were shown in Equations (5) and (6).
(NH4)2CO3(s) + RbOH(aq)→ Rb2CO3(aq) + NH3(aq) + H2O(l)
(NH4)2CO3(s)+CsOH(aq)→Cs2CO3(aq)+NH3(aq)+H2O(l)
The rubidium carbonate solutions and cesium carbonate solutions were then put into rotary evaporators and evaporated under low pressure and temperature and precipitate the purity of 98.0% of rubidium carbonate and 98.9% of cesium carbonate. After chemical precipitation and solvent extraction, the ICP-OES analyses are shown in Table 7.

4. Conclusions

Hydrometallurgy method was used to separate rubidium and cesium effectively from the desalination brine in this study. The recommended recovery process is shown in Figure 20. The brine was treated by chemical precipitation and solvent extraction to recover rubidium and cesium. Perchloric acid was added into brine to pH 2 at −5 °C to precipitate potassium perchlorate which could reduce the influence of potassium in the extraction procedure. After that, t-BAMBP and ammonia were used as extractant and a stripping agents. The results show that 0.1 M t-BAMBP was used as extractant to separate cesium and impurities under the optimal condition of pH 8, O/A ratio 0.1, 3 min reaction time, and 35 °C reaction temperature. Then, cesium was stripped by using 1 M ammonia under O/A ratio 2 and 25 °C reaction temperature. On the other hand, the results show that 0.5 M t-BAMBP was used as extractant to separate rubidium and potassium under the optimal condition of pH 12, O/A ratio 0.1, 15 min reaction time, and 5 °C reaction temperature. In the stripping process, 0.5 M ammonia under O/A ratio 2 and 35 °C reaction temperature are the optimal parameters. Finally, the rubidium carbonate and cesium carbonate were produced by adding ammonium carbonate. By these processes, the purity of rubidium carbonate and cesium carbonate were 98.0% and 98.9%.

Author Contributions

Conceptualization, W.-S.C. and C.-H.L.; methodology, W.-S.C. and C.-H.L.; validation, W.-S.C. and C.-H.L.; formal analysis, C.-H.L. and Y.-F.C.; investigation, C.-H.L., Y.-F.C. and K.-W.T.; resources, C.-H.L., Y.-F.C. and Y.-J.C.; data curation, C.-H.L., K.-W.T., Y.-J.C. and Y.-A.C.; writing—original draft preparation, C.-H.L.; writing—review and editing, C.-H.L., K.-W.T., Y.-J.C. and Y.-A.C.; visualization, C.-H.L.; supervision, W.-S.C.; project administration, W.-S.C. All authors have read and agreed to the published version of the manuscript.

Funding

This research received no external funding.

Conflicts of Interest

The authors declare no conflict of interest.

References

  1. The United Nations World Water Development Report 2012; UNESCO: Paris, France, 2012.
  2. Wangnick, K. 2004 IDA Worldwide Desalting Plants Inventory; Wangnick Consulting: Gnarrenburg, Germany, 2004. [Google Scholar]
  3. Kumar, A.; Phillips, K.; Thiel, G.; Schröder, U.; Lienhard, J. Direct electrosynthesis of sodium hydroxide and hydrochloric acid from brine streams. Nat. Catal. 2019, 2, 106–113. [Google Scholar] [CrossRef]
  4. U.S. Geological Survey. Mineral Commodity Summaries 2015; U.S. Geological Survey: Reston, VA, USA, 2015; p. 196. [CrossRef]
  5. U.S. Geological Survey. Mineral Commodity Summaries 2016; U.S. Geological Survey: Reston, VA, USA, 2016; p. 202. [CrossRef]
  6. U.S. Geological Survey. Mineral Commodity Summaries 2017; U.S. Geological Survey: Reston, VA, USA, 2017; p. 202. [CrossRef]
  7. U.S. Geological Survey. Mineral Commodity Summaries 2018; U.S. Geological Survey: Reston, VA, USA, 2018; p. 200. [CrossRef]
  8. U.S. Geological Survey. Mineral Commodity Summaries 2019; U.S. Geological Survey: Reston, VA, USA, 2019; p. 200. [CrossRef]
  9. Li, Z.; Wakai, R.; Walker, T. Parametric modulation of an atomic magnetometer. Appl. Phys. Lett. 2006, 89, 134105. [Google Scholar] [CrossRef] [PubMed] [Green Version]
  10. Yen, C.; Yano, Y.; Budinger, T.; Friedland, R.; Derenzo, S.; Huesman, R. Brain tumor evaluation using pet and Rb-82. Clin. Nucl. Med. 1981, 6, 448. [Google Scholar] [CrossRef]
  11. Groeger, S.; Pazgalev, A.; Weis, A. Comparison of discharge lamp and laser pumped cesium magnetometers. Appl. Phys. B 2005, 80, 645–654. [Google Scholar] [CrossRef] [Green Version]
  12. Downs, J. Drilling and Completing Difficult HP/HT Wells With the Aid of Cesium Formate Brines-A Performance Review. In Proceedings of the IADC/SPE Drilling Conference, Miami, FL, USA, 21–23 February 2006. [Google Scholar] [CrossRef]
  13. Jiayong, C. Handbook of Hydrometallurgy; Metallurgical Industry Press Co., Ltd: Beijing, China, 2005. [Google Scholar]
  14. Paschalis, C.; Jenner, F.; Lee, C. Effects of Rubidium Chloride on the Course of Manic-Depressive Illness. J. R. Soc. Med. 1978, 71, 343–352. [Google Scholar] [CrossRef] [PubMed]
  15. Malek-Ahmadi, P.; Williams, J. Rubidium in psychiatry: Research implications. Pharmacol. Biochem. Behav. 1984, 21, 49–50. [Google Scholar] [CrossRef]
  16. Canavese, C.; DeCostanzi, E.; Branciforte, L.; Caropreso, A.; Nonnato, A.; Sabbioni, E. Depression in dialysis patients: Rubidium supplementation before other drugs and encouragement? Kidney Int. 2001, 60, 1201. [Google Scholar] [CrossRef] [PubMed] [Green Version]
  17. Lake, J. Textbook of Integrative Mental Health Care; Thieme New York: New York, NY, USA, 2007. [Google Scholar]
  18. O’Neil, M.J. The Merck Index: An Encyclopedia of Chemicals, Drugs, and Biologicals; Whitehouse Station, N.J.: Merck: Readington, NJ, USA, 2001. [Google Scholar]
  19. Li, Z.; Pranolo, Y.; Zhu, Z.; Cheng, C. Solvent extraction of cesium and rubidium from brine solutions using 4-tert-butyl-2-(α-methylbenzyl)-phenol. Hydrometallurgy 2017, 171, 1–7. [Google Scholar] [CrossRef]
  20. Liu, S.; Liu, H.; Huang, Y.; Yang, W. Solvent extraction of rubidium and cesium from salt lake brine with t-BAMBP–kerosene solution. Trans. Nonferrous Met. Soc. China 2015, 25, 329–334. [Google Scholar] [CrossRef]
  21. Wang, J.; Che, D.; Qin, W. Extraction of rubidium by t-BAMBP in cyclohexane. Chin. J. Chem. Eng. 2015, 23, 1110–1113. [Google Scholar] [CrossRef]
  22. Xing, P.; Wang, G.; Wang, C.; Ma, B.; Chen, Y. Separation of rubidium from potassium in rubidium ore liquor by solvent extraction with t-BAMBP. Miner. Eng. 2018, 121, 158–163. [Google Scholar] [CrossRef]
Figure 1. Flow diagram of chemical precipitation.
Metals 10 00607 g001
Figure 2. Flow diagram of whole solvent extraction process.
Metals 10 00607 g002
Figure 3. Precipitation percentage of KClO4 in different pH value at 10 min.
Metals 10 00607 g003
Figure 4. Extraction percentage of metals at different pH values in the first stage.
Metals 10 00607 g004
Figure 5. Extraction percentage of concentration of t-BAMBP in the first stage.
Metals 10 00607 g005
Figure 6. Extraction percentage of O/A ratio in the first stage.
Metals 10 00607 g006
Figure 7. Extraction percentage of reaction time in the first stage.
Metals 10 00607 g007
Figure 8. Extraction percentage of reaction temperature in the first stage.
Metals 10 00607 g008
Figure 9. Stripping efficiency of concentration of NH4OH in the first stage.
Metals 10 00607 g009
Figure 10. Stripping efficiency of O/A ratio in the first stage.
Metals 10 00607 g010
Figure 11. Stripping efficiency of reaction temperature in the first stage.
Metals 10 00607 g011
Figure 12. Extraction percentage of metals at different pH value in the second stage.
Metals 10 00607 g012
Figure 13. Extraction percentage of concentration of t-BAMBP in the second stage.
Metals 10 00607 g013
Figure 14. Extraction percentage of O/A ratio in the second stage.
Metals 10 00607 g014
Figure 15. Extraction percentage of reaction time in the second stage.
Metals 10 00607 g015
Figure 16. Extraction percentage of reaction temperature in the second stage.
Metals 10 00607 g016
Figure 17. Stripping efficiency of concentration of NH4OH in the second stage.
Metals 10 00607 g017
Figure 18. Stripping efficiency of O/A ratio in the second stage.
Metals 10 00607 g018
Figure 19. Stripping efficiency of reaction temperature in the second stage.
Metals 10 00607 g019
Figure 20. Recommended recovery process of this experiment.
Metals 10 00607 g020
Table 1. Metal compositions of simulated brine
ElementLiNaKCaMgRbCs
Concentration (mg/L)18250,130591470213,9807.143.6
Table 2. Final composition of simulated brine
ElementsLiNaKCaMgRbCs
Concentration (mg/L)167491,8091622135,706.9442.14
Table 3. Optimal parameters of solvent extraction of cesium
Extractant and Stripping AgentpH Value of Aqueous PhaseConcentration (M)O/A RatioReaction Time (min)Reaction Temperature (°C)
t-BAMBP8.00.10.1335
Ammonia-12-25
Table 4. Optimal parameters of solvent extraction of rubidium
Extractant and Stripping AgentpH Value of Aqueous PhaseConcentration (M)O/A RatioReaction Time (min)Reaction Temperature (°C)
t-BAMBP12.00.50.1155
Ammonia-0.52-35
Table 5. Metal compositions of the first stage of stripping (cesium hydroxide solutions)
ElementLiNaKCaMgRbCs
Concentration (mg/L)N.D.8.1310.33N.D.N.D.1.391635
Table 6. Metal compositions of the second stage of stripping (rubidium hydroxide solutions)
ElementLiNaKCaMgRbCs
Concentration (mg/L)N.D.0.026.02N.D.N.D.293.68N.D.
Table 7. ICP-OES analyses of rubidium carbonate and cesium carbonate
CompoundsLiNaKCaMgRbCs
Rb2CO3N.D.0.1%1.9%N.D.N.D.98.0%N.D.
Cs2CO3N.D.0.4%0.5%N.D.N.D.0.2%98.9%
N.D.: Not-detected.

