Article

Advanced Process Simulation of Low Pressure Die Cast A356 Aluminum Automotive Wheels—Part I, Process Characterization

1
The Department of Materials Engineering, The University of British Columbia, 6350 Stores Road, Vancouver, BC V6T 1Z4, Canada
2
CITIC Dicastal Co., Ltd, No 185, Long Hai Road, Economic and Technological Development Zone, Qinhuangdao 066011, Hebei, China
*
Author to whom correspondence should be addressed.
Metals 2020, 10(5), 563; https://doi.org/10.3390/met10050563
Submission received: 24 March 2020 / Revised: 19 April 2020 / Accepted: 22 April 2020 / Published: 26 April 2020

Abstract

:
In this work, a plant trial was conducted on an industrial low pressure die casting (LPDC) manufacturing process for the production of aluminum alloy wheels. Various types of data have been acquired, including extensive measurements of temperature at different locations (die, wheel and cooling channels), pressure in cooling channels and size/location of shrinkage porosity in the produced wheels. Moreover, two process conditions were tested in the trial—one was the standard production process condition and the other was designed to generate shrinkage porosity in wheels by altering the die temperature. The large amount of quantitative data acquired in this study helped us to understand the key transport phenomena occurring in the process, which include: (1) a thorough picture of the evolution in temperature at a large number of discrete locations in the die and the casting; (2) the dynamic and complicated heat transfer in the cooling channels both water-on and water-off stages, associated with boiling water heat transfer. This paper (Part I) presents the results and findings obtained from the process characterization. The follow-on paper (Part II) will introduce the developed modeling methodology based on the data produced from this work.

1. Introduction

The market for automotive wheels is projected to reach $50.54 Billion by 2025, which translates to a compound average growth rate of 5.52% through 2025 [1]. Aluminum alloy wheels offer a number of advantages over stamped and welded steel wheels, including design flexibility; cosmetic appeal; heat dissipation; and in some cases, weight advantages. These advantages have led to aluminum alloy wheels representing ∼54% of the global automotive wheel market [2]. Increased adoption of aluminum wheels will hinge on innovation in processing technologies and the ability to increase product performance while reducing cost.
From the standpoint of quality, aluminum alloy wheels are assessed in terms of their mechanical performance (e.g., fatigue life and impact load tolerance), air tightness and finish [3]. Failure to achieve the required standards in any one of the categories identified above will lead to the wheel either requiring costly repair, or being rejected. Additionally, there has been a significant push from the original equipment manufacturers (OEMs) to reduce wheel weight, which has been fully embraced by the wheel manufacturers, as the material costs represent a significant fraction of the production cost. For cast aluminum wheels, the reduction in weight hinges on improving the cast microstructure for a given alloy system—e.g., reducing the secondary dendrite arm spacing (SDAS) and pore size distribution, thereby allowing for reduced section thicknesses in fatigue sensitive areas.
In terms of the low pressure die casting (LPDC) process, which is one of the dominant technologies used to produce aluminum wheels, significant effort has gone into optimizing the process technology from the standpoint of reducing casting related defects. Given its history and extensive use, the LPDC process technology has reached a level of maturity such that further gains will only be realized through the application of advanced simulation tools. This statement stems from the fact that the transport of heat (and mass) in the LPDC process is sufficiently complex [4,5] so as to make trial and error based optimization unlikely to yield further improvements in process technology. It is clear that highly accurate process simulation tools are required that can be applied to achieve improved die designs and optimized process operation, and to develop process control strategies. Moreover, as part of an industry push to achieve lightness, the OEMs are now requiring CITIC Dicastal to demonstrate their ability to accurately simulate in-process wheel solidification as part of the documentation they must supply to support the in-plant audit processes for qualification as a supplier. Note that this is in addition to the normal quality data required for the cast wheels—e.g., SDAS, X-ray radiographs and mechanical test data.
This paper (Part I) presents an overview of an extensive characterization effort undertaken on a commercial LPDC process for the production of A356 automotive wheels. The aim of this program was to produce a comprehensive and accurate database suitable for the development and validation of an advanced thermal-fluid flow-solidification computational model of automotive wheel manufacturing. In the follow-on paper (Part II), a modeling methodology developed based on the data acquired from this work is introduced. Additionally, the results of “off-the-shelf” applications of two of the leading commercial software packages to LPDC wheel production under the conditions examined in the study are presented. The accuracy of the predictions is assessed against the industrially derived process data, and areas of focus for improvement are identified.

2. Background

2.1. The Industrial LPDC Process

The industrial LPDC process is often employed to produce wheels with diameters between 406 and 559 mm (16–22 in). Figure 1 schematically shows the basic structure of a LPDC machine [6]. It is a cyclic process and begins with pressurizing the holding furnace, which drives the liquid metal upward into the die cavity through the transition pipe. Note: the applied pressure during the filling stage is carefully determined depending on the dimensions and geometry of the die; the height between the sprue (inlet of the die cavity) and liquid metal in the holding furnace; and the rate of filling to minimize free surface turbulence and the formation of cold-shuts. The liquid metal in the cavity is then solidified to form a wheel. When the solidification is completed, the side-dies are opened and the top die is raised. The wheel, which is stuck to the top die, is then ejected on to a tray and then typically cooled in water before moving on for further downstream processing. The dies are then closed and the cycle repeated. Both forced air and water are used to extract heat from the die structure, although the industry trend is toward use of more water owing to the improvements that can be realized in machine productivity and wheel fatigue performance. There is considerable variation in the basic die structure used throughout the industry, reinforcing the notion that some of the more universal elements of die design have not yet been optimized.

2.2. Previous Numerical Modeling Work

Comparatively little work appearing in the literature is directly focused on modeling of the LPDC process for wheels as it is practiced industrially. Some examples include the work done by Merlin et al. [7] for the development of a computational model to study the filling and solidification behavior of the LPDC process for A356 wheel production, and Wang et al. [8] for the simulation of Magnesium wheel casting. However, these models were not validated using measured temperature data. Another good example of an industrial-based study was completed by Zhang et al. [5], who developed a numerical model based on an industrial LPDC process of aluminum wheel production using the commercial software package ABAQUS, and measured temperature data so that the model was validated. Fan et al. investigated the macro-segregation and porosity formation with the aid of numerical models developed in the commercial CFD package, Fluent [9,10]. In contrast, there has been a relatively large number of models or simulation-based studies on various aspects related to the transfer of heat in aluminum die casting processes. Examples include the studies conducted by Ilkhchy et al. [11] to investigate the effect of pressure on heat transfer at the metal/mold interface of A356 aluminum alloy, and by Assar [12] to investigate the effect of surface roughness on the heat transfer at the metal/mold interface.

3. In-Plant Process Measurements

To provide the data necessary for both model development and validation, a significant amount of process data was extracted from a commercial LPDC wheel casting machine. This work was completed at CITIC Dicastal’s plant located in Qinhuangdao, Hebei, China. The data included the following:
(1)
In-die thermocouple (TC) measurements at a number of locations in the top, bottom and side dies.
(2)
In-wheel thermocouple measurements in several wheels.
(3)
Signals from the programmable logic controller (PLC).
(4)
Three TCs and three pressure sensors placed in water cooling channels: one in each of the three die components—top die, bottom die and side die.
In total, two different sets of process conditions were examined to provide a database suitable for both model validation and a preliminary assessment of model robustness (model robustness may be defined to be a measure of the ability of the model to predict the temperature field for a set of process conditions other than those for which the model was first validated). In addition to the in-process data, the wheels were examined to assess the extent to which any internal porosity could be detected using an X-ray tomography scanner. Details of the industrial measurements, data acquisition methodology and scanning methodology are presented below in the following sections.

3.1. Die and Wheel Structure

The die structure was for a conventional 17 × 7.5 in, 6 spoke wheel. A 90° portion of the basic structure of the die and wheel is shown in Figure 2. The die and wheel were made from H13 tool steel and A356 aluminum alloy, respectively. Table 1 gives the measured batch chemical composition of the holding furnace metal. Note: the specific composition of each of the wheels associated with the data presented in the following sections was not measured. The die cooling configuration contains a combination of below-surface water cooling channels and air-jet finger-cooling elements. This particular cooling configuration is generic and some or all of the cooling channels/elements may be utilized, depending on the configuration of the wheel.

3.2. Process Parameters

In addition to the holding furnace metal temperature (690–710 °C), the main process parameters measured include the pressure fill-curve, and, the on and off-timing and flow rates of the various cooling channels/elements. The pressure fill-curve defines when and at what rate the metal enters the die and may also include an excess, or over-pressure, intended to reduce pore formation (the over-pressure is defined as the pressure above which is necessary to fill the die). The cooling channel timing defines when and where within the die structure heat is removed (the other mechanism of heat removal is to the environment surrounding the die).

3.2.1. Pressure Curve

Figure 3 presents a typical pressure fill-curve. Note: the pressure parameters have been normalized. It can be seen that the curve consists of five stages, as indicated in the figure. In stage 1, the furnace is pressurized and liquid metal rises up the transition pipe. In this stage, the pressure is increased at a relatively fast rate. When the liquid metal reaches the die cavity, stage 2 is entered and the rate of pressure increase is reduced to avoid excess free-surface turbulence, thereby limiting air and oxide film entrainment. Once the die cavity is full, stage 3 is entered and the pressure is quickly increased to an over-pressure. In stage 4, the over pressure is held for a period of time until the wheel is solidified. The effect of the over-pressure is argued to result in a combination of reduced pore formation and improved die/casting interfacial heat transport, although a detailed study has not been completed. Finally, in stage 5, the pressure to the holding furnace is vented to atmosphere and the die is opened for wheel ejection.

3.2.2. Cooling Parameters

As previously indicated, process data were obtained for two sets of process conditions: (1) production process conditions (referred to subsequently as production indicated by a “P” proceeding the location identifier); and (2) an altered set of conditions (referred to subsequently as non-production indicated by a “NP” proceeding the location identifier). Operation under the production conditions was expected to result in no obvious shrinkage porosity, whereas in the non-production conditions, the process cooling timings were adjusted with the intent of increasing the likelihood of “shrinkage-based” pore formation. Table 2 and Table 3 present the cooling parameters for the two sets of process conditions. Note that data is given for both water and air for the water-cooling channels. This is because air is used to purge the water from the channels for 10 s to remove any residual water from the channel. The air-purge is programmed to begin 5 s after water is turned off.

3.3. Data Acquisition

3.3.1. Temperature

In total, 74 TCs were placed at various locations in the LPDC dies (22 in the top die, 12 in the side dies, 12 in the bottom die, 3 in the environment surrounding the die and 22 in the cooling channels, and 3 were cast into wheels). Note: in each of the two process conditions, 3 TCs were cast into wheels at selected cycles. For each die component, one water cooling channel was selected for instrumentation. One TC was placed close to the inlet and the other close to the outlet. Referring to Figure 2, for example, two TCs were placed in T3, B1 and S2. This information was sought to understand the extent to which boiling water heat transfer was occurring in the cooling channels when the water was initially switched on and again when it was switched off.

3.3.2. Pressure Sensors

In each of the water-cooling channels where TCs were placed—e.g., T3, B1 and S2—a pressure sensor was also introduced. Note: the pressure sensor for each channel was placed in the middle of the region between the two TCs close to the inlet and outlet, respectively. This allowed for further extraction of information to aid in the analysis of heat transfer by water.

3.3.3. PLC

The PLC signals from the casting machine’s operation were obtained and logged electronically— die open/close, pressure fill-curve, etc. This information was used to establish the proper timing for the various modeling steps and to also link process timing with the TC and pressure data.

3.4. Additional Measurements

3.4.1. Sight Glasses

Two sight glasses (see Figure 4) were installed at the outlets of T3 and B1. Please note that they were installed close to the water collection box, relatively remote from the die (the length of piping connecting the die and water collection box is roughly 4 m). The rationale for the use of the sight glasses was to visualize the water exiting cooling channels, thereby aiding in understanding the transients associated with introduction of water into the hot-die and the purging of water from the channels with air—i.e., when water, air or a combination of water/air/vapor was exiting the die.

3.4.2. Shrinkage Porosity

In this trial, for each process condition, a wheel produced from a cycle in which the casting process was deemed to be at steady state was selected to be examined by X-ray CT-scanning. Those data have been used for assessing the model’s capability to predict shrinkage porosity.

4. Results and Discussion

4.1. Trial Results

4.1.1. Temperature Measurements

The LPDC process for wheel manufacturing is a cyclic process. In practice, prior to starting the process, the die is normally heated up to between 300 and 400 °C with gas-fired burners. After casting is initiated and the casting machine is operated normally for a number of cycles, the die reaches a cyclic steady state condition (in practice, 4–6 cycles are usually used). At cyclic steady state, the die temperature at a given point in the cycle (usually taken to be die open) is approximately invariant from cycle-to-cycle. The start and the duration of water flow in the channels close to these TCs has been added to the figures for reference.
In this section, examples of the data measured at cyclic steady state are presented as they are representative of the process in a “stable condition” and are used initially for process model validation. Note: typically wheels produced before reaching cyclic steady state during process start-up are rejected in production. Wheels produced during process upsets in which there is a deviation from cyclic steady state may or may not be rejected, depending on the extent of the process upsets.
A selection of the in-die and in-wheel TC data is presented below as an example of the data obtained from the process characterization program.

4.1.2. In-Die TC Data

Temperatures measured from 9 TCs—three from the top die, three from the side die and three from the bottom die—obtained from five sequential cycles at cyclic steady state are presented in Figure 5 and Figure 6 for the production (cycles 11–15) and non-production (cycles 12–16) process conditions, respectively. The approximate locations of the TCs are shown in Figure 7. Three of the TCs were located in proximity to water cooling channel—TD11, TD17 and BD61.
There are a number of factors that contribute to the evolution in temperature at a given location in the die—e.g., time taken for the liquid metal to reach the location in the die cavity adjacent to the TC during filling; liquid metal superheat; the evolution in interfacial heat transfer at the wheel/die interface (formation of gap or the development of pressure); solidification rate (rate of latent heat release); and on and off-timing of cooling channels/elements adjacent to the location of the TC. Given this, the following general observations have been made for the example TC data presented:
(1)
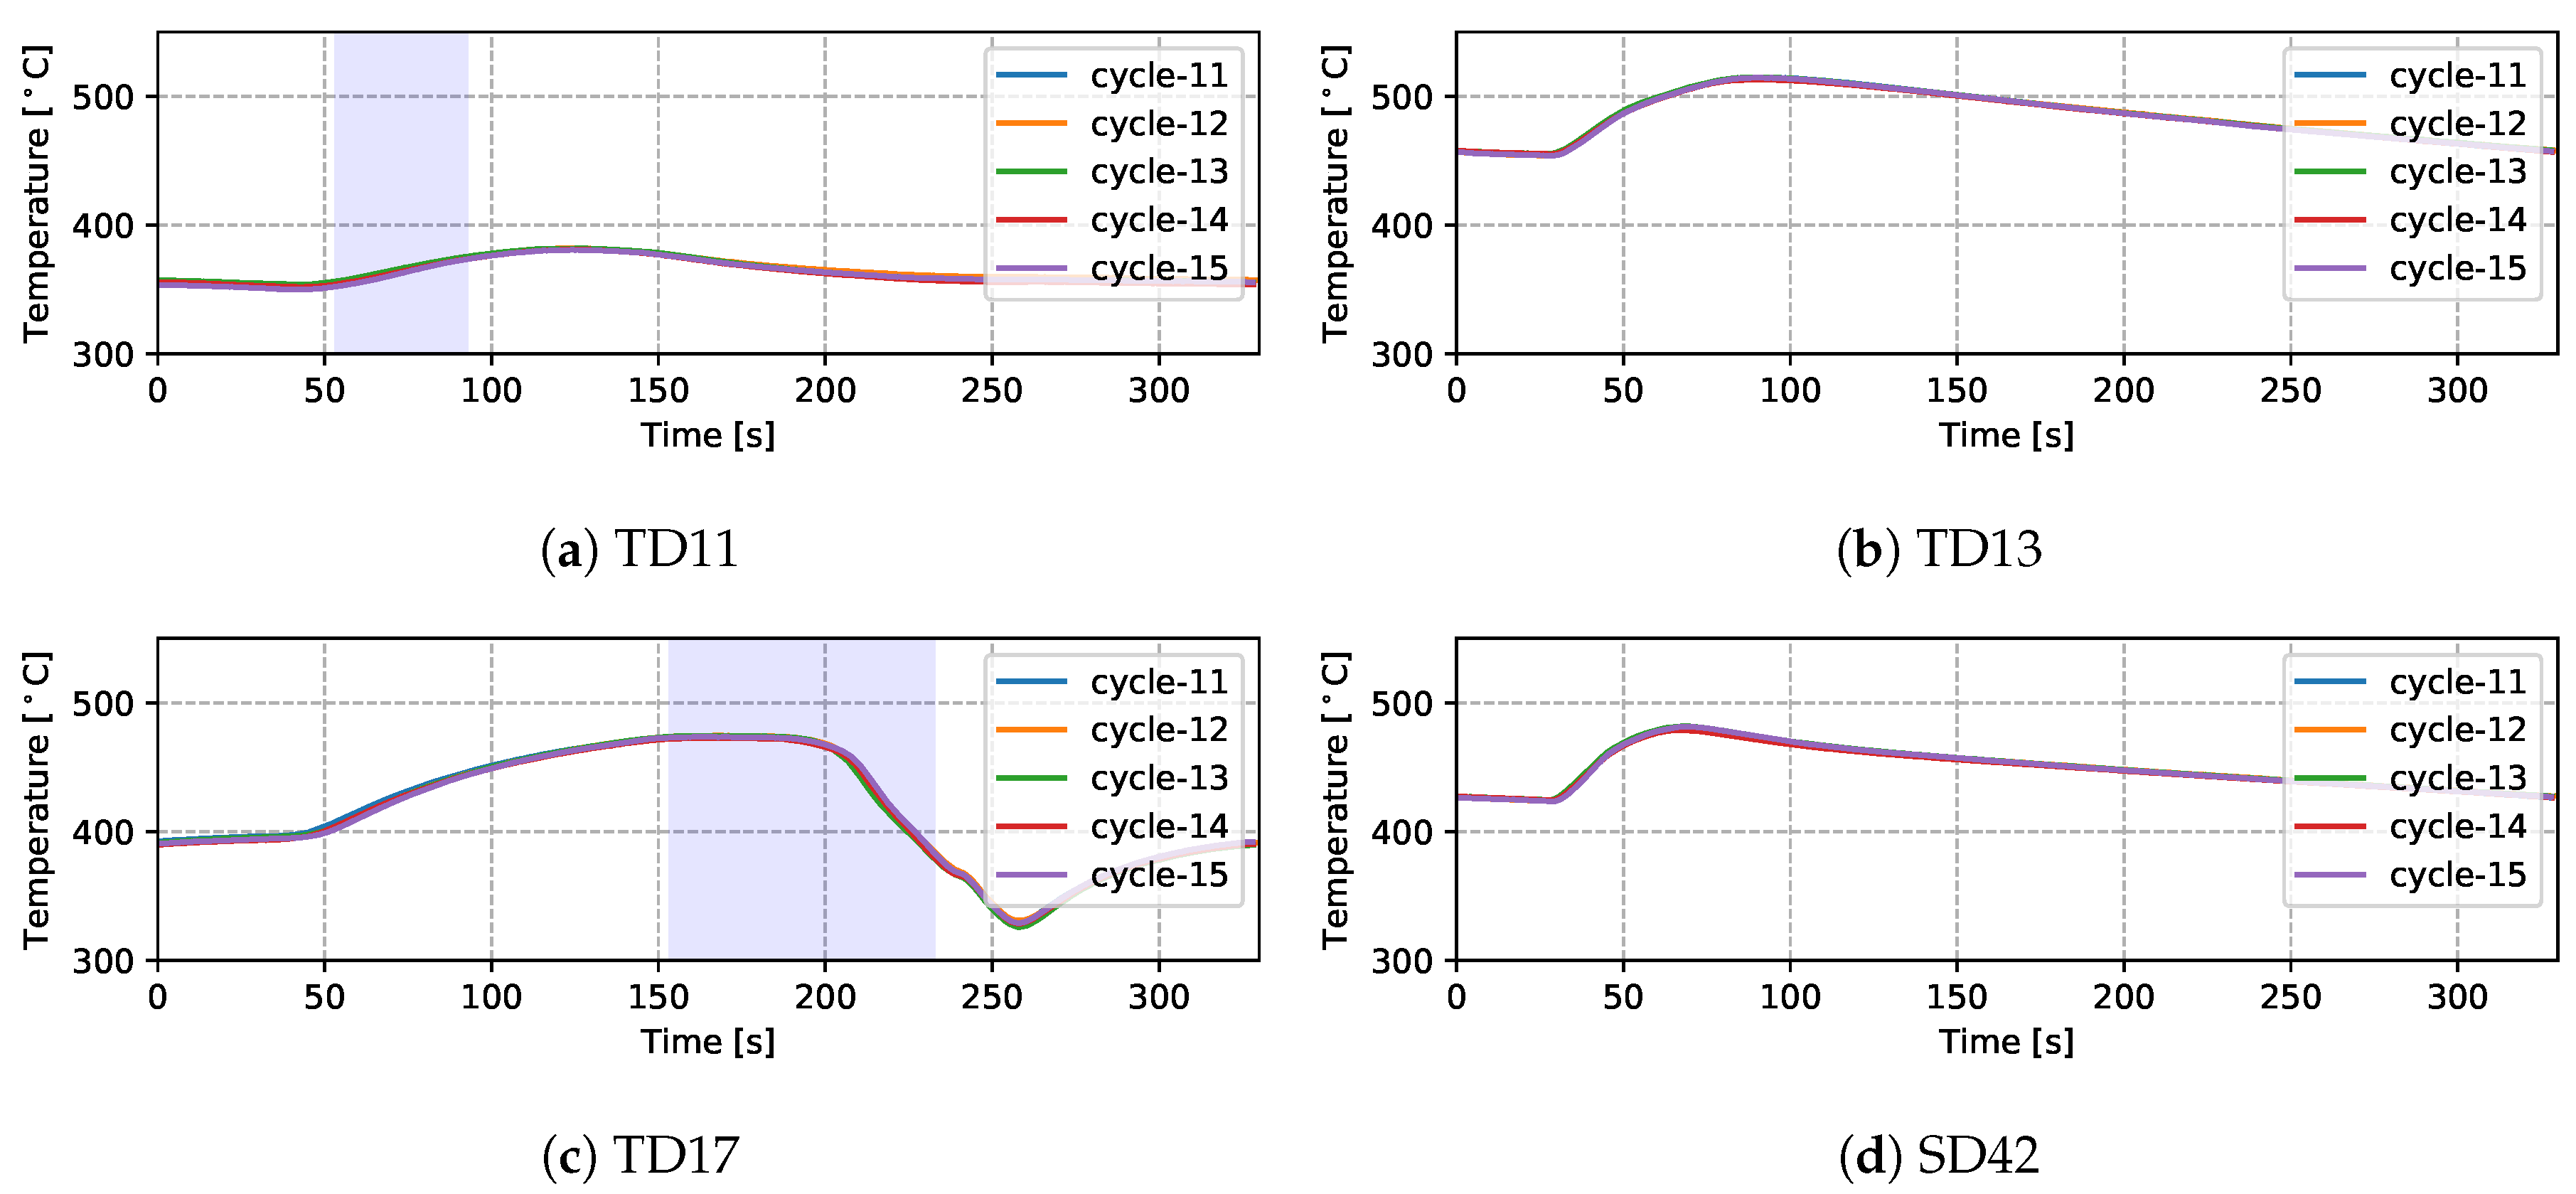
Focusing first on the initial temperature at the beginning of the cycle, there is a trend toward lower temperatures with increasing vertical distance above the inlet (sprue). For example, TD11 varies between 350 and 390 °C, SD43 between 450 and 500 °C and BD62 between 480 and 540 °C in the production process conditions. This characteristic distribution likely develops due to a combination of the loss of superheat in the liquid metal as it fills the die cavity, the timings of the various cooling channels/elements, the varying thermal mass within the die structure (larger toward the bottom of the die assembly) and the closer proximity of the bottom die and bottom of the side die to the holding furnace (which is relatively hot in comparison to the ambient temperature surrounding the rest of the die). This temperature distribution is desired in the case of this particular die design, as it facilitates directional solidification of the wheels from the inboard rim flange to the sprue, thereby reducing the occurrence of shrinkage porosity.
(2)
Generally the temperature evolution for each location can be seen to have three stages: First, following die-closing, there is a small drop in temperature until such time as the pulse of heat associated with the presence of liquid metal in the die cavity is able to diffuse through the die to the TC location. Note: the duration of time over which this drop occurs varies with vertical distance from the sprue, increasing in length with increasing height above the sprue. This observation clearly points to the need to incorporate die cavity filling and the pressure fill-curve into the process model formulation. In the second stage, there is a rise in temperature associated with the transfer of heat from the aluminum into the die. The rate of temperature rise is initially high and then tappers off as the peak temperature is reached. The rise in temperature and evolution with time are dependent on a combination of factors, including the liquid metal’s superheating; the proximity of the TC to the wheel/die interface; and the proximity of the TC to a cooling channel/element, along with its activation timing. Finally, there is a period of slow decline in die temperature associated with the balance between removal of heat from the die and the supply of heat from the solidifying wheel.
(3)
For the three TCs located close to water-cooling channels—TD11, TD17 and BD61—the effect of the cooling is evident in the measured temperatures ∼30–60 s after the water is switched on. To aid in interpretation of the data, the appropriate cooling channel timings (on and off) have been added to the graphs, as denoted by the light purple shaded region in the corresponding figures. Two causes are considered for this delay: (1) there is a distance between the cooling channel and the measurement location, and thus it takes time for the water-cooling effect to propagate to the TC location; and (2) water needs to fill the cooling channel piping between the control valve and die, which also takes some time—to be analyzed in detail in Section 4.1.4.
(4)
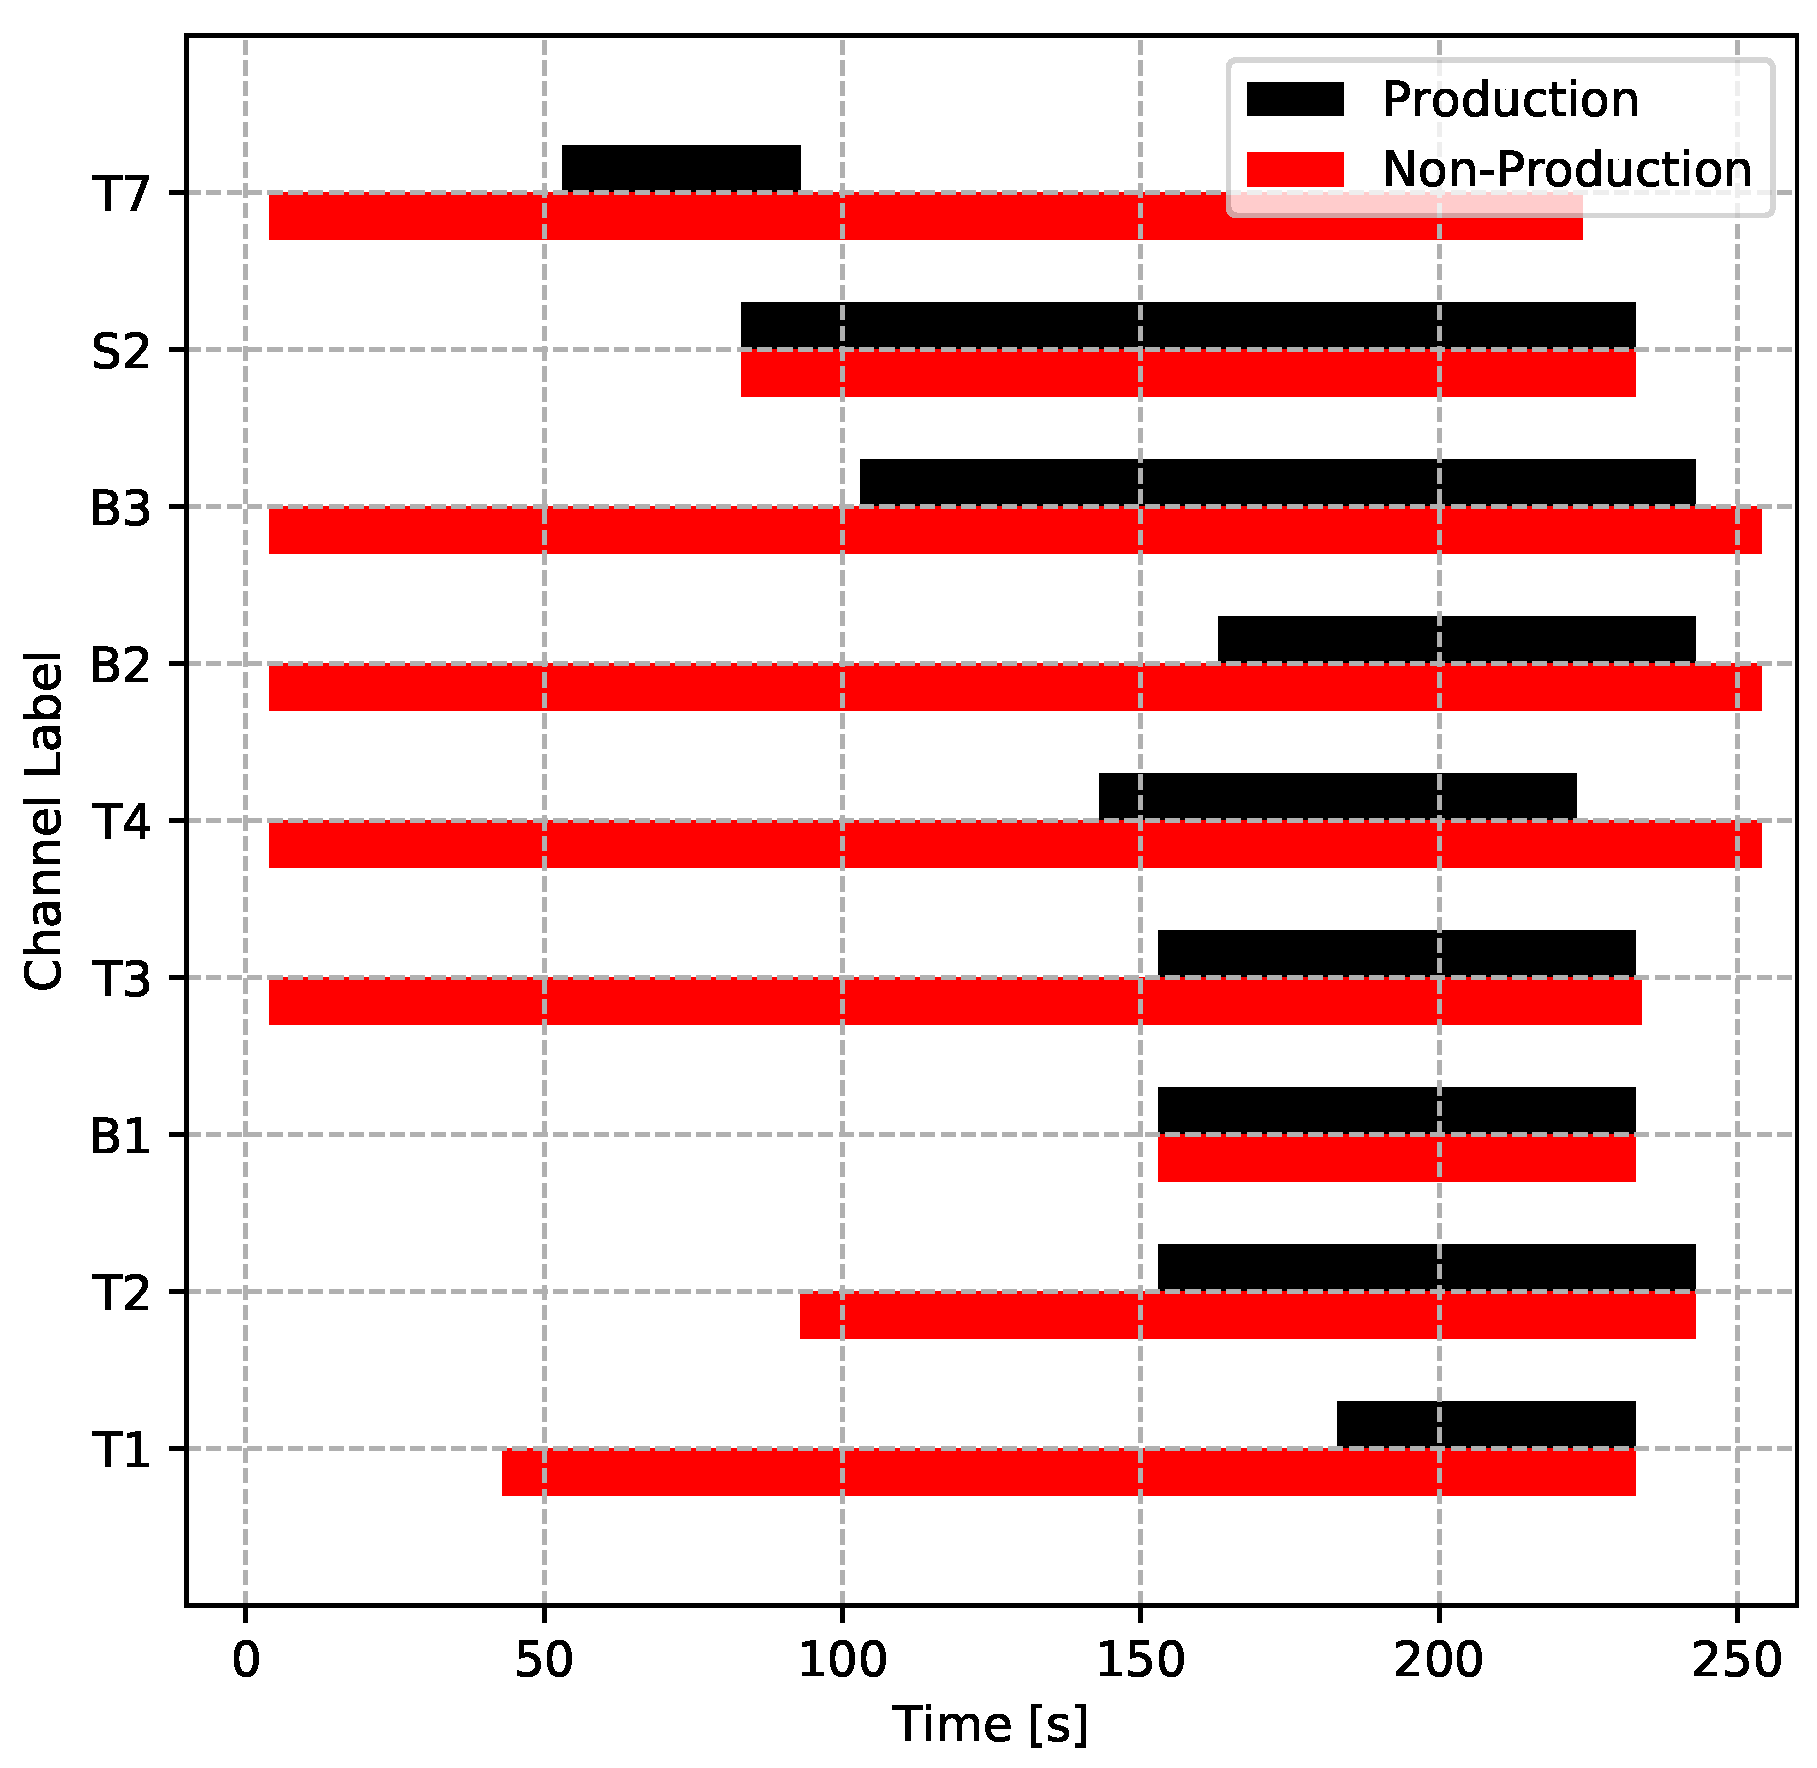
To further analyze the effect of water cooling on the die temperature, the temperatures measured from the production and non-production process conditions are compared at TD17 (close to cooling channel T3)—see Figure 8. Note: the water-on times are also marked in the figure. It can be seen that the non-production process condition is about three times longer for the duration of cooling, resulting in a lower average temperature at TD17 (∼200 °C) than observed in the production process condition. Additionally, the effect of cooling was observed at a very early stage (∼35 s), since cooling was started at the beginning of the cycle in the non-production process condition, much earlier than for the production process condition. Overall, the change to the process conditions results in a significant difference in the temperature evolution with time.
(5)
Finally, it can be seen that the thermal histories recorded for the five back-to-back cycles, indicate that the wheel casting process was stable for the five cycles, presenting with only a minor variation cycle-to-cycle.

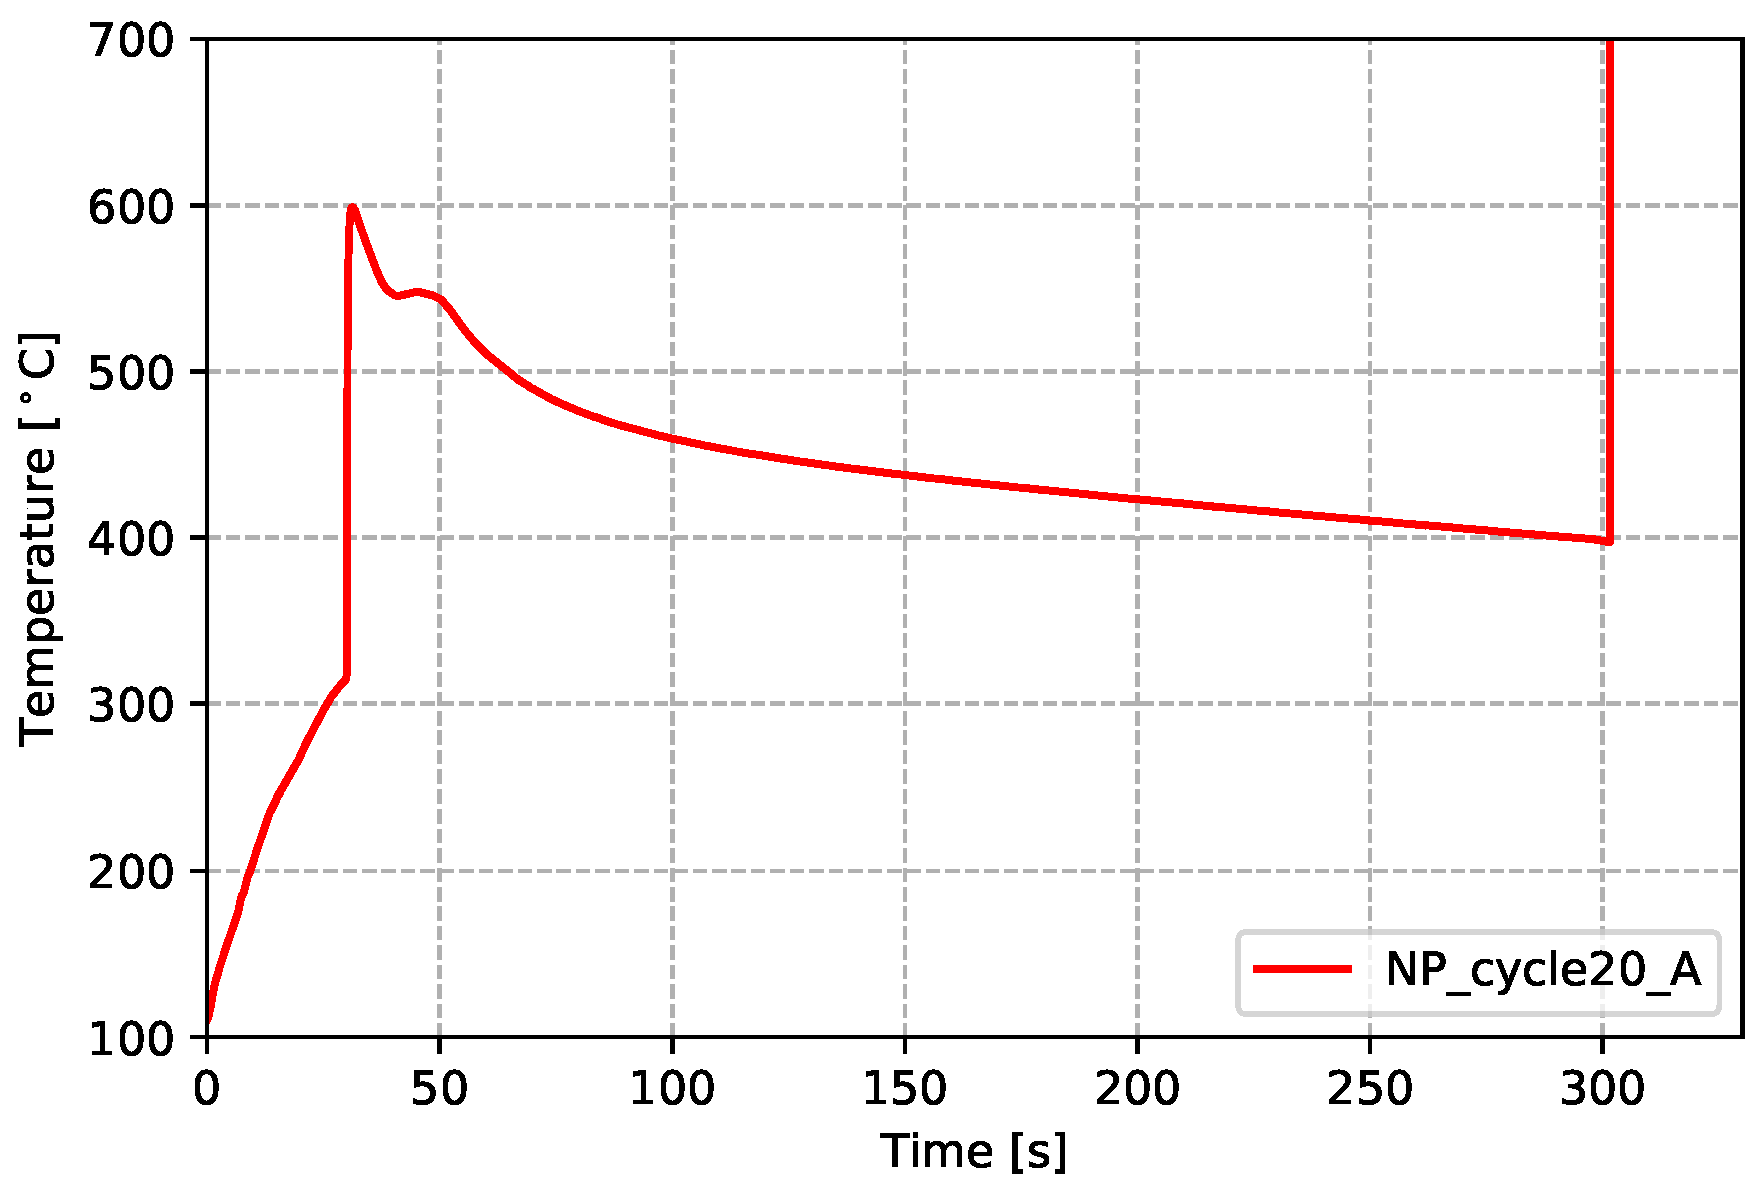
4.1.3. In-Wheel Temperature Data

As previously described, for each of the two sets of process conditions, an attempt was made to cast TCs into wheels to obtain in-wheel temperature data from two steady state cycles (three TCs in each). Data from five TCs were successfully acquired (four TCs for the production process conditions and one TC for the non-production process conditions). These are challenging measurements to make, and problems can arise with: (1) failure/damage of the TC when the die closes; (2) difficultly in identifying the location of the TC from the X-ray images; and (3) formation of a pore surrounding the TC tip, leading to questionable data. The locations of the successfully placed TCs for both sets of process conditions are presented in Figure 9. Note: P_cycle#_X refers to the locations measured for the production process condition from cycle number # at location X (A indicates the location is in the rim, B in the spoke and C in hub-spoke conjunction), and NP_cycle20_A refers to the single location measured for the non-production process condition in the rim at cycle 20.
The results for the production process condition are presented in Figure 10 ((a) for data measured from cycle 19 and (b) for cycle 21), and the non-production process condition in Figure 11. The thermal responses at the locations examined are similar. Focusing on one location (P_cycle21_B), for a more detailed description:
(1)
Initially, the temperature recorded by the TC is low and rises relatively slowly within the die cavity as it is heated via a combination of convection and radiation from the hot, inner walls of the die.
(2)
As liquid metal enters the die and contacts the TC (∼20–25 s at location P_cycle21_B), there is a rapid rise in temperature. Note: (1) the peak temperatures obtained vary with height (distance from the sprue) and range from ∼600 °C (P_cycle21_A selected) to ∼680 °C (P_cycle19_C selected); and (2) the time of the temperature rise also varies with height and ranges from ∼20 s (P_cycle19_C) to ∼30 s (P_cycle21_A)
(3)
Following the peak, there is a relatively rapid drop in temperature until ∼600 °C, at which point the cooling rate decreases. This is consistent with the onset of primary α-aluminum solidification and the associated release of latent heat (∼25–75 s).
(4)
At ∼560 °C, there is a further decrease in the cooling rate between ∼75 and 130 s. This is consistent with the formation of the primary eutectic and so-called “secondary eutectics” and the associated latent heat release. Note: the secondary eutectic is comprised of a number of other phases that form in the A356 alloy system—see the reference [13].
(5)
Solidification is completed at this location at ∼130 s and there is a discernable increase in the cooling rate. Note: given a comparison of all temperature responses, the time for the completion of solidification varies with height: ∼70 s for P_cycle21_A, ∼140 s for P_cycle21_B, ∼150 s for P_cycle19_B and ∼180 s for P_cycle19_C. It indicates a sequential solidification from the rim to the sprue.
(6)
Finally, at ∼295 s, the TC was cut prior to opening of the die and ejection of the wheel—the measured temperatures abruptly rise to an unrealistically high value and become invalid.

4.1.4. Boiling the Water in Cooling Channels

It is well recognized that surface temperatures in excess of the saturation temperature of water can lead to the boiling of water and significant variations in the rate of heat extraction over a relatively small temperature range [14,15]. This is due to a combination of the high latent heat of evaporation of water and the enhanced advection of fluid by the formation and detachment of vapor bubbles at the boundary layer between the fluid and hot surface. Consequently, the effective heat transfer coefficient (HTC) in the water-cooling channels can be 1–2 magnitudes higher when boiling occurs. As previously described, three approaches were employed to assess the extent to which boiling was occurring within the cooling channel. The approaches included in-channel TCs, in-channel pressure sensors and sight glasses.
As mentioned previously, two TCs and one pressure sensor were installed within each of the channels T3, B1 and S2. This provided quantitative data related to heat transport in the channels. Figure 12 and Figure 13 show the temperatures (from TCs) and pressures measured in the channels, respectively. In the figures, the time periods of turning on the water cooling and air purging are labeled by the light purple and green bars, respectively. Please note that these times have been extracted from the recorded PLC signals of the solenoid valves for controlling the water cooling and air purging. Again, both the temperature data and pressure data emphasize the dynamic and complicated phenomena occurring in the cooling channels.
First focusing on the temperature data, the temperature profiles generally show seven distinct stages. Data at TD21 are used to explain the details and the seven stages have been added to the figure for reference:
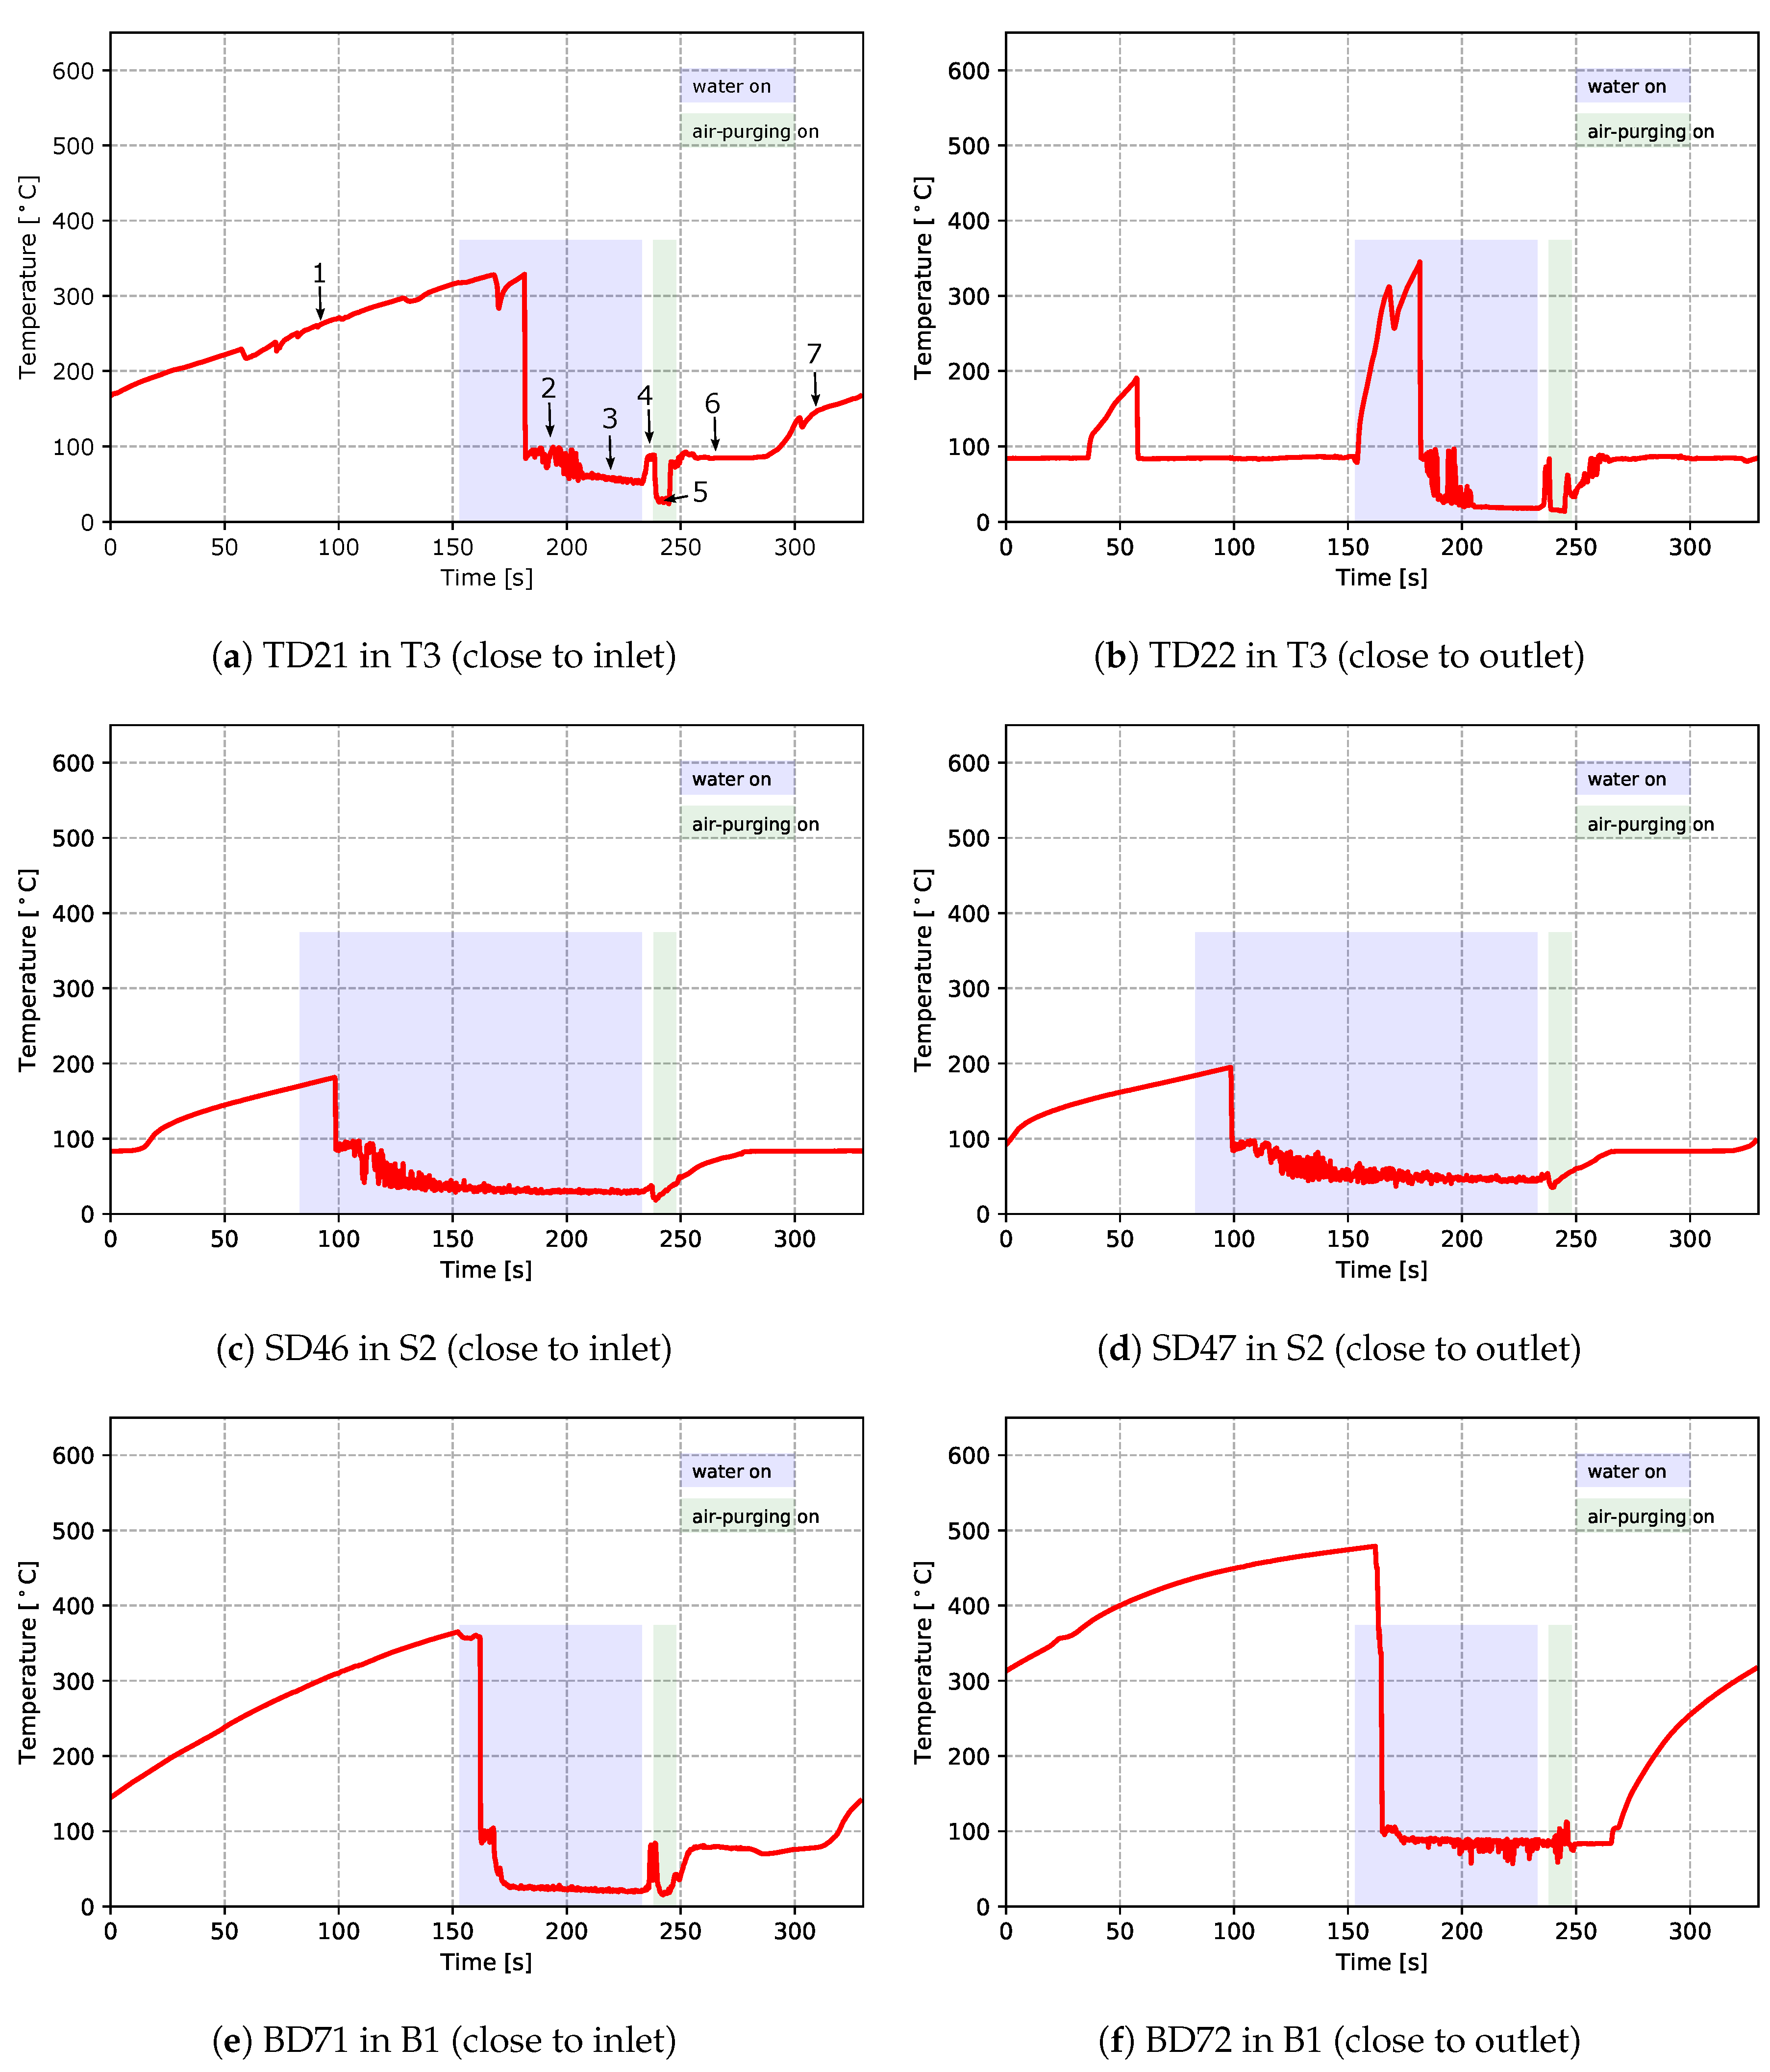
  • Stage 1: The cooling channel is initially dry and air in the channel gradually heats to ∼330 °C, indicating stagnant air cooling.
  • Stage 2: When cooling water reaches the location of the TC in the channel, the temperature rapidly drops to slightly below 100 °C, where it remains, on average, roughly constant for ∼20 s but exhibits significant fluctuations, indicating that boiling is occurring within the die. This also indicates that the cooling channel interface temperature is in excess of 100 °C for the same period. Note: the temperature did not show an immediate drop once the water was turned on at the controller. This decoupling of the PLC controller activation of a cooling channel valve solenoid from the actual cooling is because the water valves are located remotely from the die, and thus, depending on the arrangement of the piping between the control valves and the die, it takes a certain period of time for water to fill the water circuit before reaching the location of the TC after the valve is opened.
  • Stage 3: The temperature of the water in the channel drops below ∼100 to ∼75 °C and then gradually decreases to ∼50 °C as the water continues to flow. During this period, boiling stops and the cooling channel interface temperature is likely below 100 °C.
  • Stage 4: After water cooling is turned off and before the air purging, the residual water in the channels quickly heats up and appears to boil. This is indicated by the fact that the temperature increases to ∼100 °C during this time.
  • Stage 5: Once air purging is turned on, the temperature drops to between 30 and 40 °C, consistent with forced air-cooling.
  • Stage 6: After air purging, the measured temperature rises again to ∼100 °C and remains there for a period of time, which indicates that there is likely a small amount of residual water remaining in the channel.
  • Stage 7: Finally, at approximately ∼280 s, the residual water is fully vaporized and the existing air in the channels heats up, resulting in a gradual increase in the temperature to ∼175 °C.
Clearly, the cooling occurring within the TD21 channel is complex and ranges from stagnant air cooling to boiling water cooling.
Turning to interpretation of the measured pressure data, data measured from the pressure sensor within channel T3 are used to explain the details. Please note that the identified seven stages from the temperature data are also marked correspondingly in the plot of the T3 pressure data.
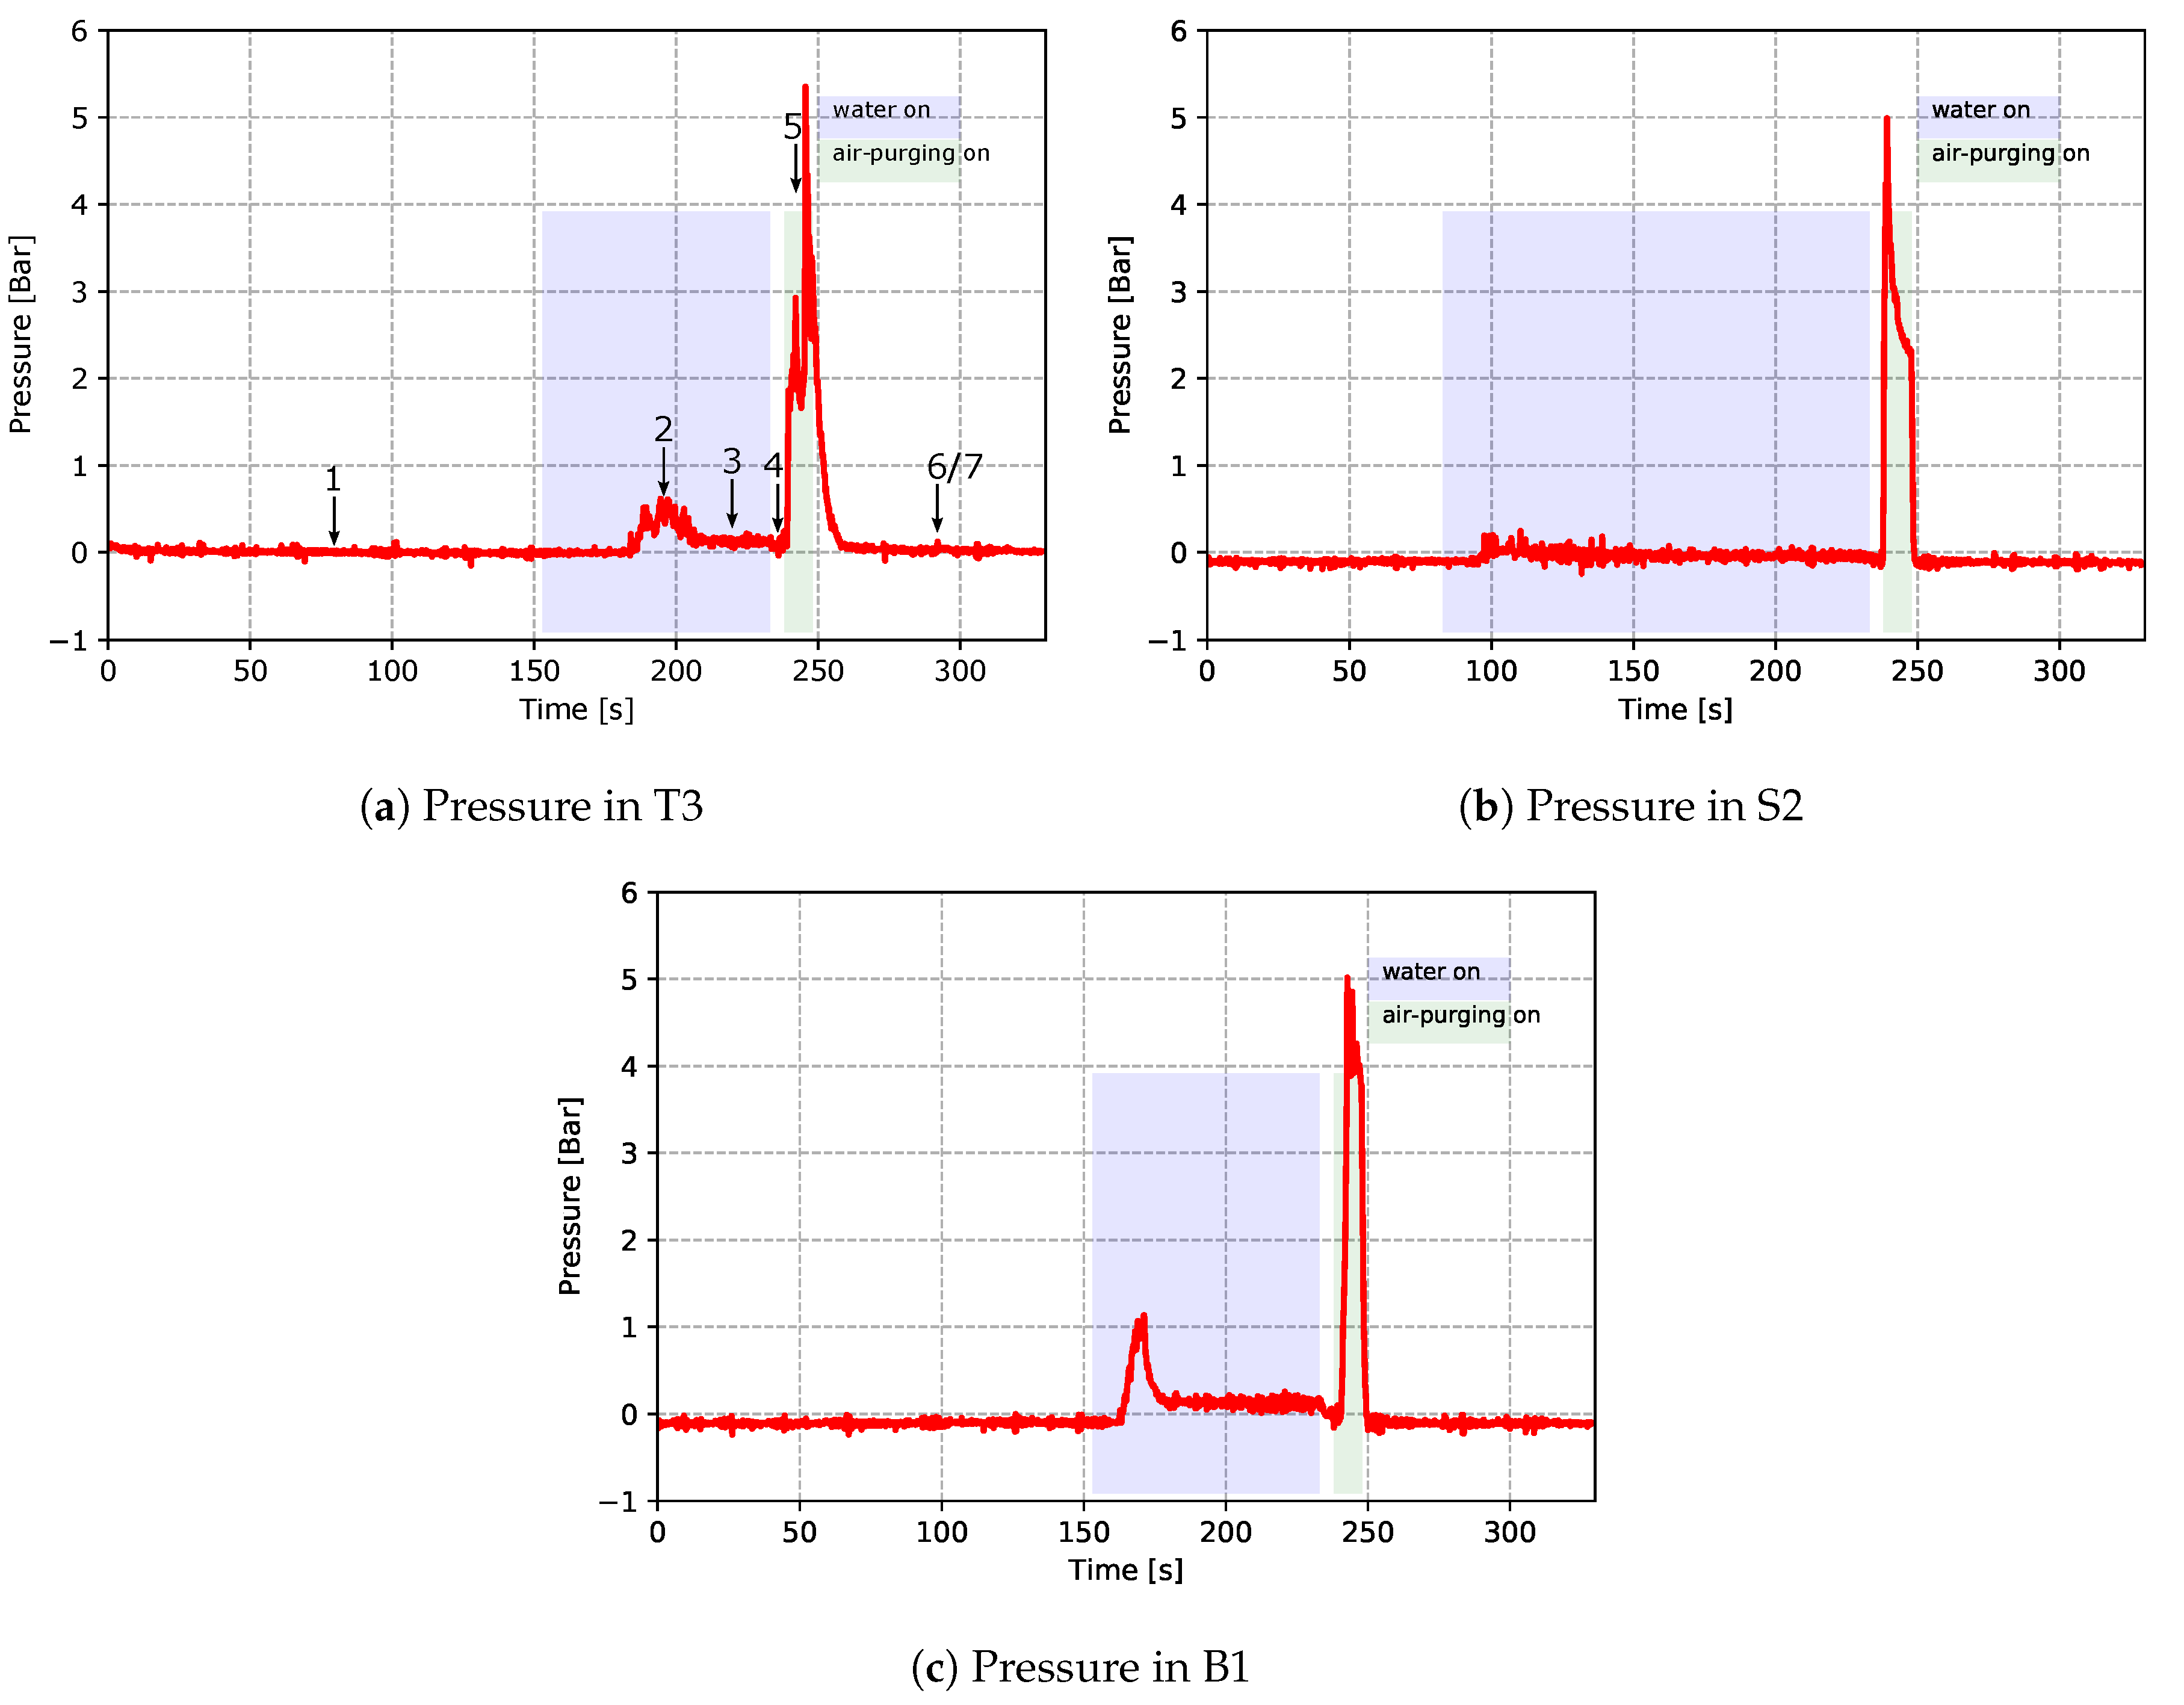
  • When water was off, the gauge pressure remained at 0 bar, as the channels were open to the atmosphere and there was no water flow in the channel (stage 1).
  • After water was turned on, it can be seen that there was a significant pressure increase (stage 2). This is because the occurrence of boiling resulted in a quick vaporization of water, which led to the pressure increase.
  • The pressure then dropped when in-channel boiling ended (stage 3). The measured pressure at this stage was the water pressure in the channel.
  • When water was turned off, the gauge pressure decreased to 0 bar (stage 4).
  • Gauge pressure jumped to 4–6 bar when air purging was turned on (stage 5). The measured pressure was the air pressure in the channel.
  • The gauge pressure dropped to 0 bar when air purging was turned off (stage 6 and 7). Note: compared to the temperature data, the pressure data do not show visible differences in stage 6 and 7.
In general, the measured data for the different cooling channels show similar behavior; however, there are some differences in both the temperature and pressure profiles at some locations. For example, for the temperature at location TD22 there is evidence of complex behavior at the beginning of the cycle prior to the water being switched on. At the start of the cycle, the temperature recorded by the TC was close to 100 °C, suggesting that boiling was occurring. The temperature then briefly increased to close to 200 °C at ∼35 s, before rapidly falling back to ∼100 °C. Additionally, when the water was first switched on, the temperature measured in the channel first rapidly rose to in excess of ∼300 °C before falling back down again. This behavior would appear to indicate the retention of residual water post air purging; followed by a boiling-out and drying of the channel, followed by a back flow of water into the cooling channel; followed by a pushing-out of the residual water and drying when the water is first switched on. This re-emphasizes the decoupling of the actual in-die cooling channel behavior from the PLC control, which arises due to the configuration of the casting machine piping. This decoupling needs to be considered in process model development and machine design.
Based on an examination of the recorded video of the sight glasses, four scenes of the flow behavior in the water-cooling channels generally can be observed—corresponding to stages 1, 2, 3 and 5 in the seven stages of temperature data. Again, this visually confirms the occurrence of boiling in the cooling channels. Referring to Figure 14, they are:
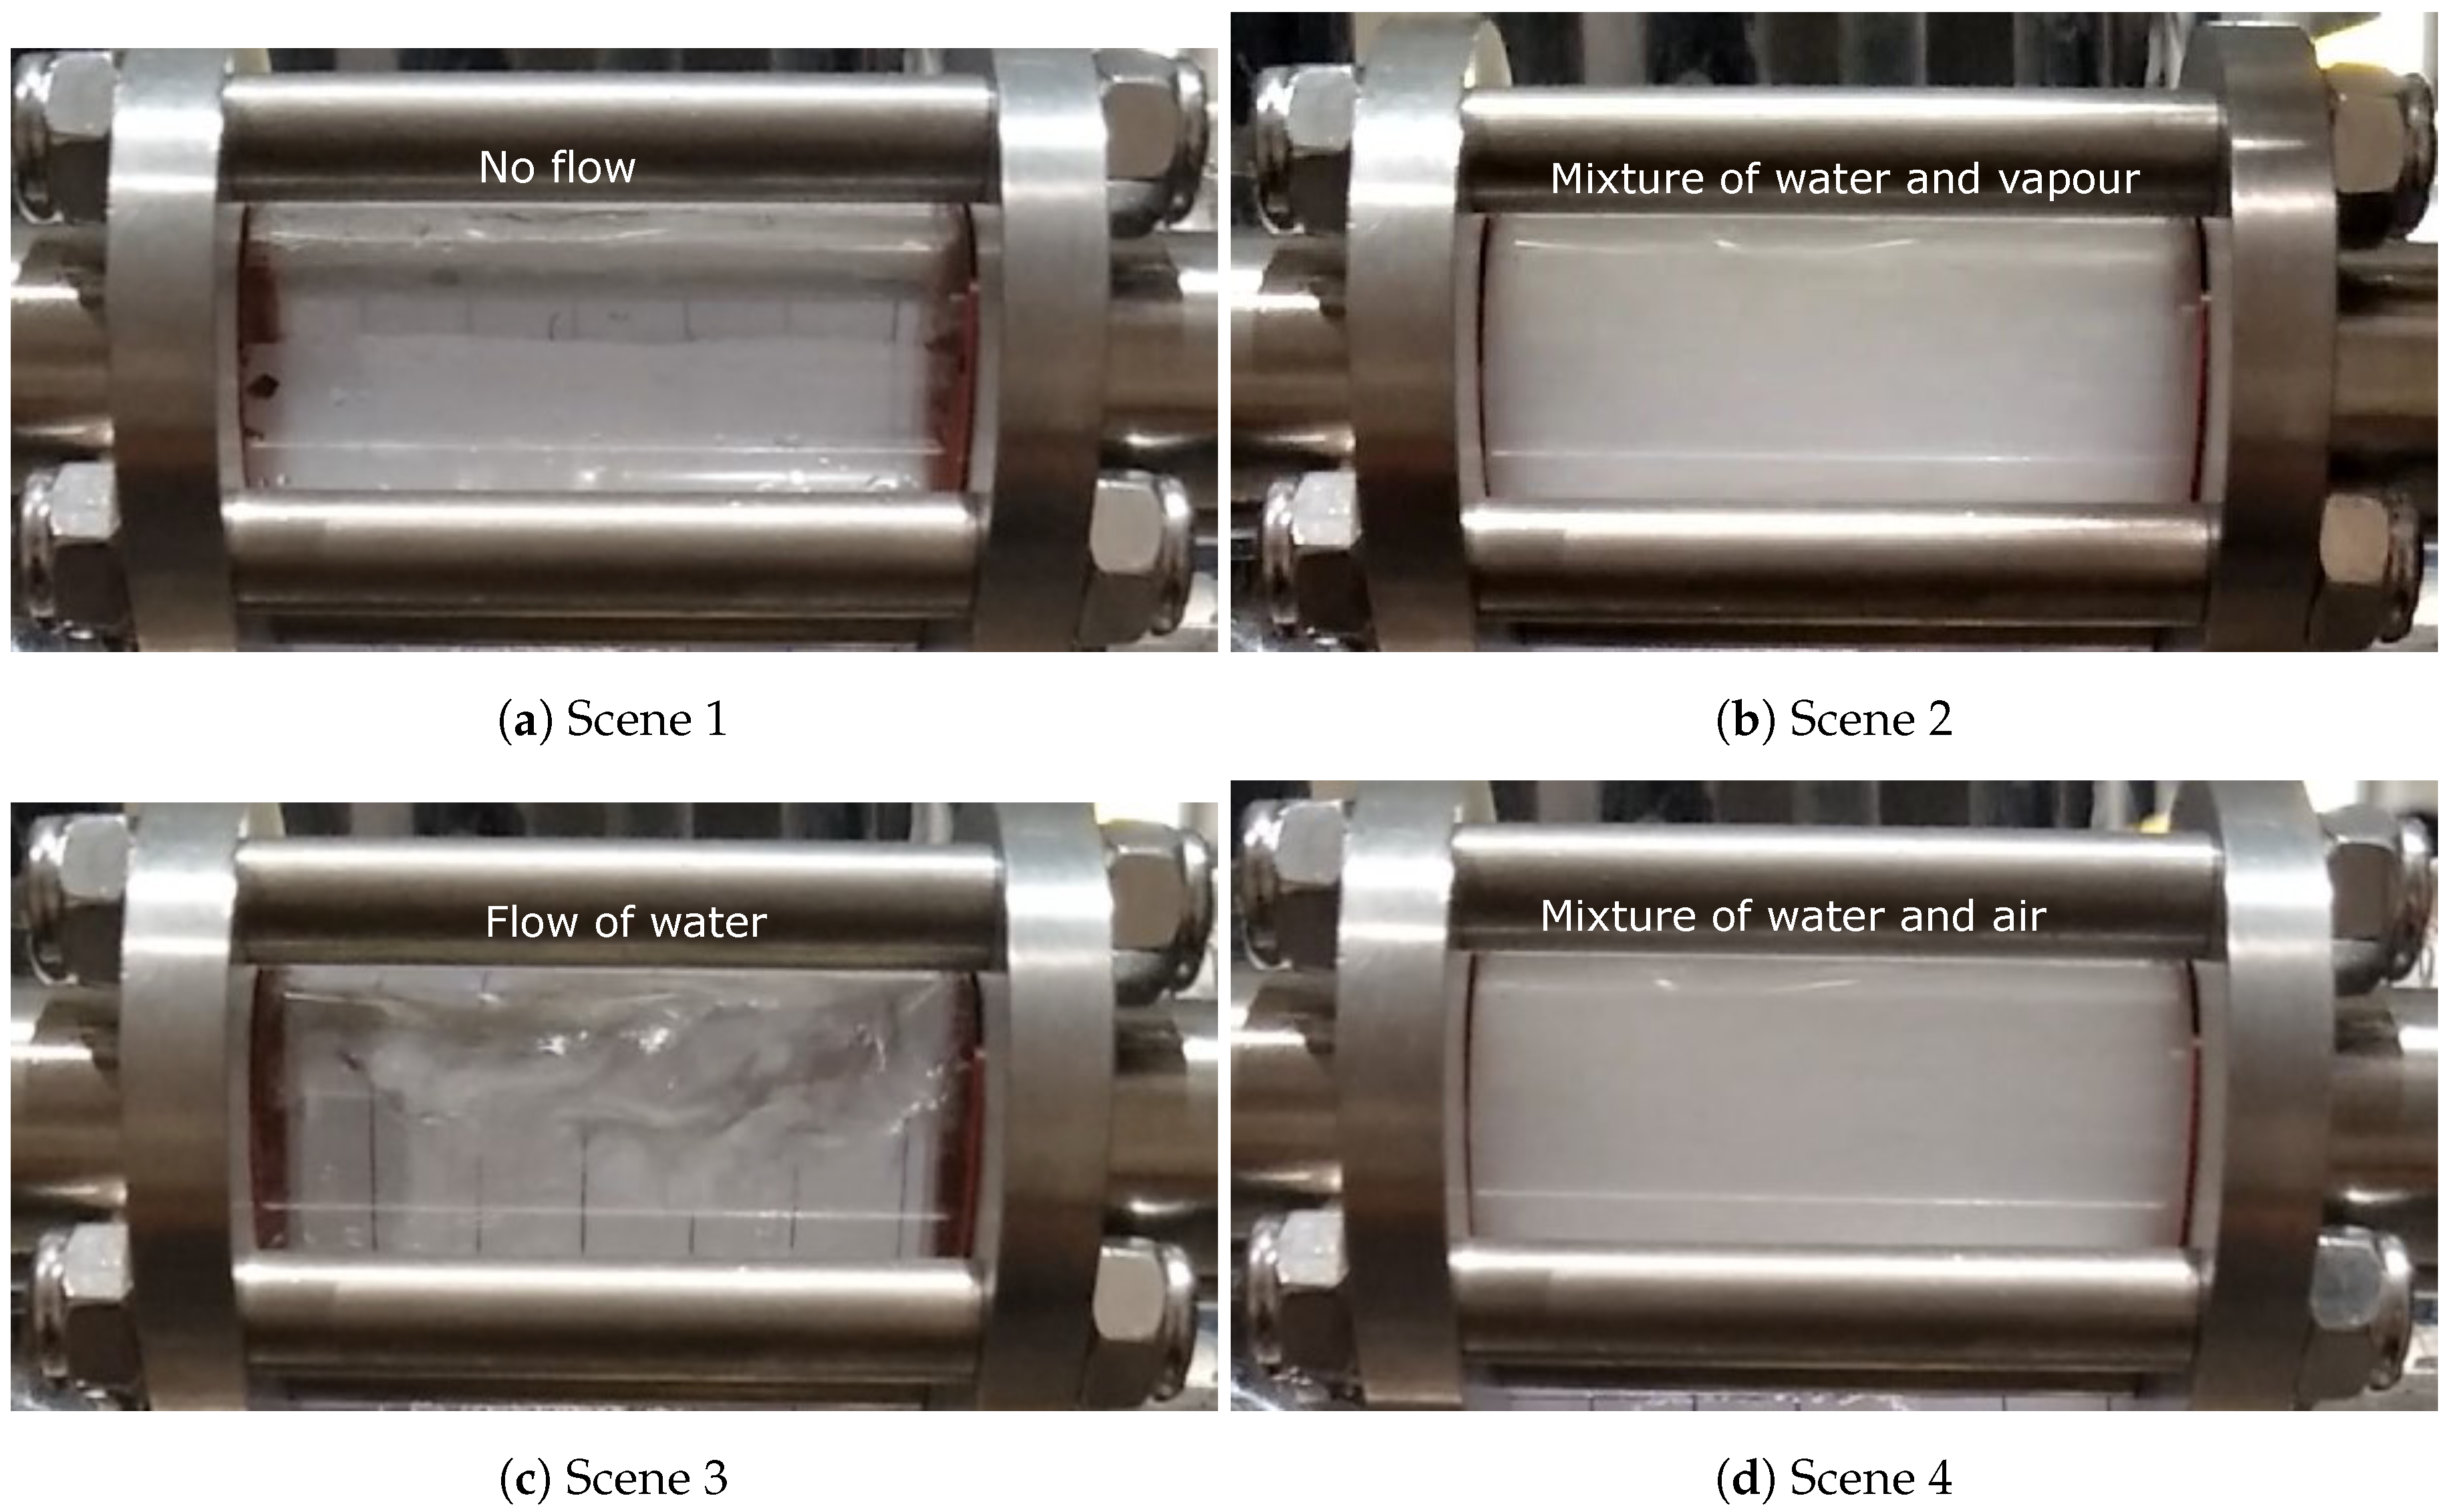
  • Scene 1 (water-off): Before water was turned on, no water or vapor was observed (stage 1).
  • Scene 2 (boiling): Shortly after water to the die was turned on, vapor or a mixture of vapor and water appeared in the sight glass at the exit from the die. This is consistent with water initially contacting the hot die surface—e.g., Tdie surface > Tsaturation, causing the water to boil (stage 2).
  • Scene 3 (steady water flow): Water only flowed continuously through the channel with little or no water vapor. This is consistent with channel wall temperatures below the boiling temperature of water (stage 3).
  • Scene 4 (air purging): A mixture of water and air was observed, with the amount of water appearing to decrease with time (stage 5).

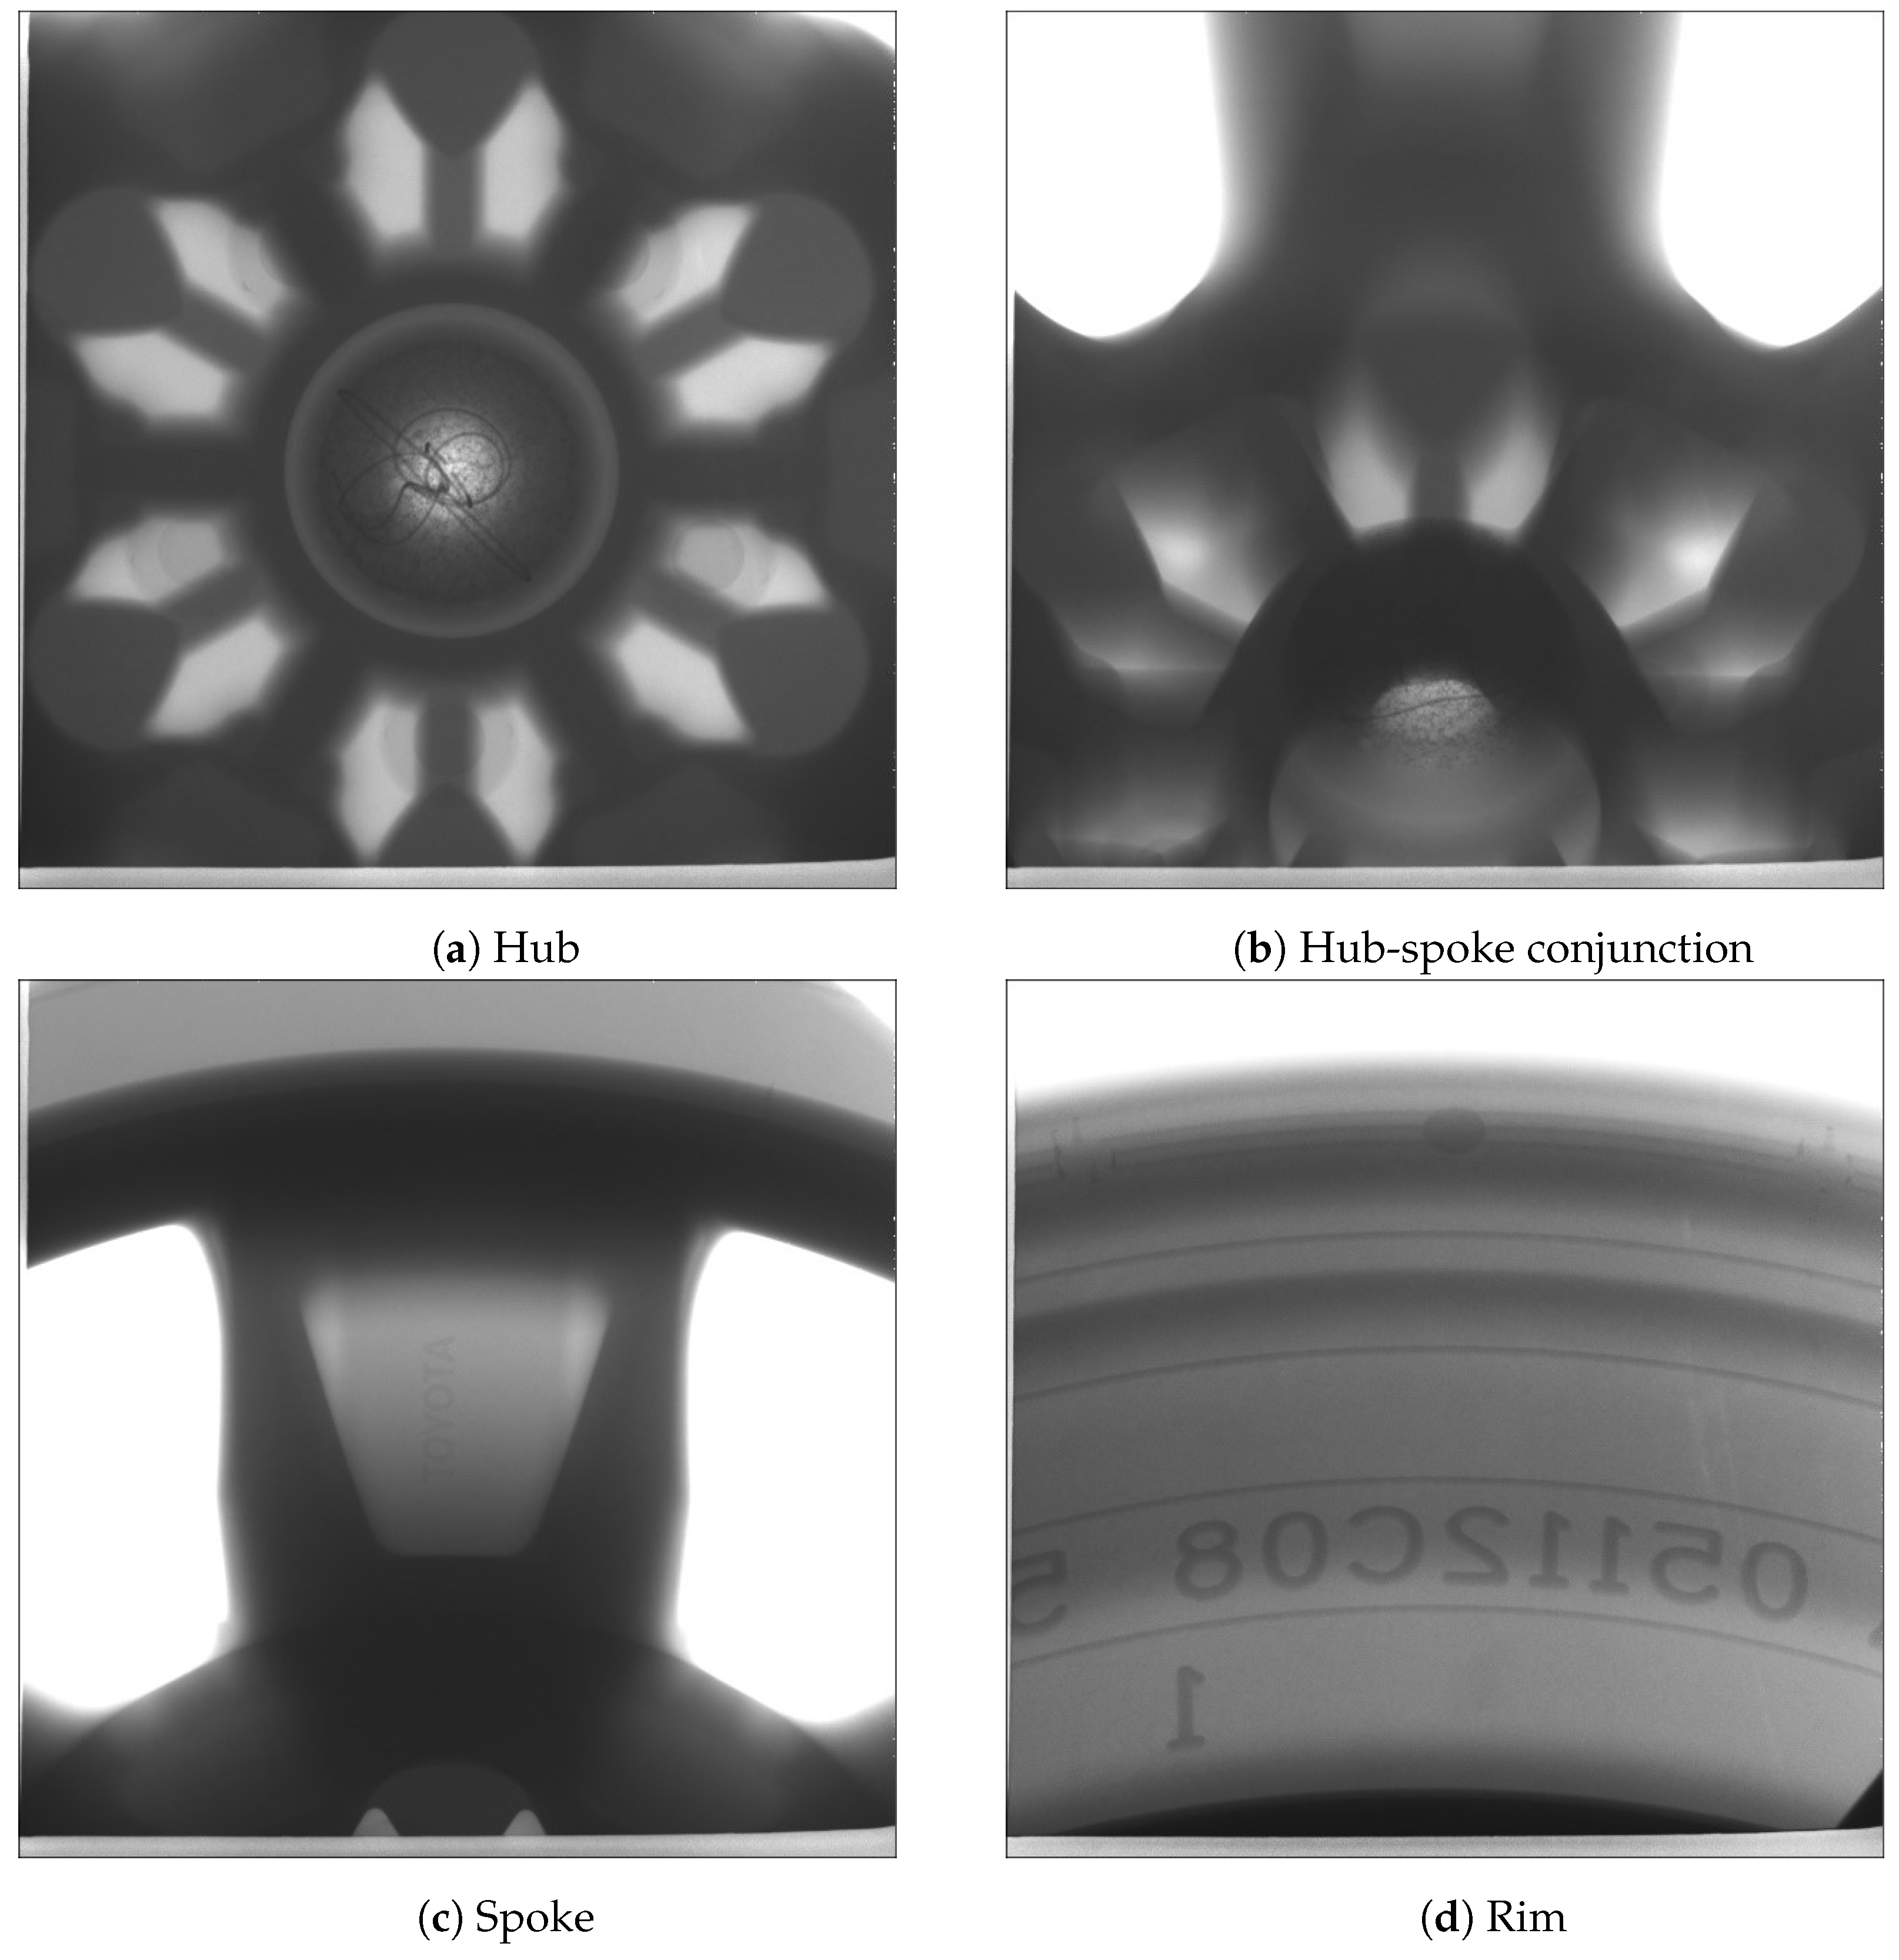
4.1.5. X-ray Imaging

In this trial, one wheel was selected from each of the two process conditions at cyclic steady state for X-ray examination. Figure 15 and Figure 16 present the X-ray images obtained at different locations (hub, hub-spoke conjunction, spoke and rim) associated with the production and non-production process conditions, respectively. The results show that no shrinkage porosity can be identified in the wheel produced by the production process condition. In contrast, several shrinkage-related pores are found at the location of the spoke-rim junction in the non-production condition—highlighted by the red circle in Figure 16. It should be noted that there is a possibility that some of the pores present may not be identifiable from the images, depending on their size and location. If the porosity is small (below the X-ray’s resolution) or it is located in a thicker section it might go undetected.
For a given die structure, tuning the water and/or air cooling parameters is the most common approach to controlling the die temperature evolution and therefore solidification in industry. In the two process conditions, the cooling parameters were set to be different (other parameters were identical). The production conditions were carefully tuned to achieve directional solidification within the wheel, to avoid producing areas of liquid encapsulation, whereas the non-production conditions were aimed at forming an area of liquid encapsulation in the vicinity of the rim/spoke junction. The cooling parameters for both process conditions are plotted in Figure 17 for easy comparison. This was done to produce a comprehensive set of process data suitable for testing the LPDC process model’s ability to predict the evolution of temperature in the die and wheel for a set of process conditions different from those used to “tune” the model boundary conditions and to also assess the ability of the model to predict areas of liquid encapsulation and associated porosity. The model development and comparison to the process data are presented in Part II of this work.

5. Summary and Conclusions

A plant trial was performed on an industrial LPDC machine for automotive wheel manufacturing for the purpose of collecting and recording a comprehensive set of data for the development of a numerical process model. Two sets of cooling parameters were tested: (1) normal production conditions; and (2) cooling timings anticipated to produce some shrinkage porosity in the wheel. The data acquired from the process included in-die and in-wheel temperatures and in-channel temperatures and pressures. In total, 74 TCs were placed at various locations in the LPDC die, and six TCs were cast into wheels; two TCs where placed in each of three water cooling channels; and one pressure sensor was placed in each of the channels instrumented with TCs. In addition, in-line X-ray images were collected from two wheels: one from the normal process condition, cast at cyclic steady state, and one from the non-production process condition, also cast at cyclic steady state.
The temperature data revealed a thorough picture of the evolution in temperature at various locations in the major sections of the die under the two sets of process cooling timings. The TC data collected from the in-wheel TCs, albeit less comprehensive, provided data on the rates of heat extraction from the locations examined in the wheel for the two process conditions. The in-die and in-wheel TC data clearly points to the need to include die-filling in process simulation, as there is a clear drop in both peek die temperature and peek wheel temperature with increasing distance from the metal inlet to the die cavity.
The data selected from the cooling channels revealed that dynamic and complicated phenomena occurred in the cooling channels. Some of the key findings included that the time at which water arrived in a given cooling channel was delayed relative to the PLC timings and the amount varied depending on the arrangement of the piping between the control valves and the die. The largest delay observed was ∼30 s, which is significant. There is strong evidence to suggest that when the water first contacts the die, boiling occurs for a short period of time, until the die surface temperature drops to below 100 °C. This will result in a large, short-duration, transient in-channel heat extractions rates. There is also evidence to support the re-occurrence of boiling in cases in which the air-purging operation does not fully remove the residual water remaining in the channel at the end of the cooling cycle. This would indicate that there is the potential to continue to have relatively high heat extraction rates beyond when the water cooling has been “switched-off”. This finding also points to the need to fully purge the water from all of the cooling channels at the end of the cooling cycle.
The data collected from this comprehensive study have been used to develop and validate a comprehensive model of the LPDC process, which will be the subject of Part II of this publication.

Author Contributions

Methodology, J.O., D.M. and S.C.; investigation, J.O., C.W., D.M. and S.C.; industrial process data acquisition, J.O., C.W. and L.Z.; plant resources, Z.Z., L.A and C.L.; writing—original draft preparation, J.O.; writing—review and editing, C.W., S.C., D.M., L.Z., L.A, C.L. and Z.Z.; supervision, S.C., D.M., L.A, C.L. and Z.Z. All authors have read and agreed to the published version of the manuscript.

Funding

This research was funded by CITIC Dicastal Co., Ltd.

Acknowledgments

The authors would like to thank CITIC Dicastal Co., Ltd. for the support of funding, facilities and personnel.

Conflicts of Interest

The authors declare no conflict of interest. The sponsor had no role in the design, execution, interpretation or writing of the study. The sponsor reviewed the manuscript to ensure confidential information was not released.

Abbreviations

The following abbreviations are used in this manuscript:
LPDClow pressure die casting
OEMoriginal equipment manufacturer
PLCprogrammable logic controller
SDASsecondary dendrite arm spacing
TCthermocouple

References

  1. Markets and Markets. Automotive Wheel Market by Rim Size, Material, Off-highway Vehicle Type, Vehicle Class, End-Use And Region—Global Forecast to 2025; Technical Report; MarketsandMarkets Research Private Ltd.: Magarpatta SEZ, India, 2018. [Google Scholar]
  2. Pulidindi, K.; Pandey, H. Automotive Wheel Market Size by Material (Aluminum, Steel, Magnesium, Carbon Fiber); Technical Report; Global Market Insights Inc.: Selbyville, DE, USA, 2019. [Google Scholar]
  3. Zhang, B.; Cockcroft, S.L.; Maijer, D.M.; Zhu, J.D.; Phillion, A.B. Casting defects in low-pressure die-cast aluminum alloy wheels. JOM 2005, 57, 36–43. [Google Scholar] [CrossRef]
  4. Duan, J.; Maijer, D.; Cockcroft, S.; Reilly, C. Development of a 3D Filling Model of Low-Pressure Die-Cast Aluminum Alloy Wheels. Metall. Mater. Trans. A 2013, 44, 5304–5315. [Google Scholar] [CrossRef]
  5. Zhang, B.; Maijer, D.; Cockcroft, S. Development of a 3-D thermal model of the low-pressure die-cast (LPDC) process of A356 aluminum alloy wheels. Mater. Sci. Eng. A 2007, 464, 295–305. [Google Scholar] [CrossRef]
  6. Duan, J. Development of a Numerical Optimization Methodology for the Aluminum Alloy Wheel Casting Process. Ph.D. Thesis, The University of British Columbia, Vancouver, BC, Canada, April 2016. [Google Scholar]
  7. Merlin, M.; Timelli, G.; Bonollo, F.; Garagnani, G.L. Impact behaviour of A356 alloy for low-pressure die casting automotive wheels. J. Mater. Process. Technol. 2009, 209, 1060–1073. [Google Scholar] [CrossRef]
  8. Wang, Y.C.; Li, D.Y.; Peng, Y.H.; Zeng, X.Q. Numerical simulation of low pressure die casting of magnesium wheel. Int. J. Adv. Manuf. Technol. 2007, 32, 257–264. [Google Scholar] [CrossRef]
  9. Fan, P.; Cockcroft, S.; Maijer, D.; Yao, L.; Reilly, C.; Phillion, A. Examination and Simulation of Silicon Macrosegregation in A356 Wheel Casting. Metals 2018, 8, 503. [Google Scholar] [CrossRef] [Green Version]
  10. Fan, P.; Cockcroft, S.L.; Maijer, D.M.; Yao, L.; Reilly, C.; Phillion, A.B. Porosity Prediction in A356 Wheel Casting. Metall. Mater. Trans. B 2019, 50, 2421–2435. [Google Scholar] [CrossRef]
  11. Ilkhchy, A.F.; Jabbari, M.; Davami, P. Effect of pressure on heat transfer coefficient at the metal/mold interface of A356 aluminum alloy. Int. Commun. Heat Mass Transf. 2012, 39, 705–712. [Google Scholar] [CrossRef] [Green Version]
  12. Assar, A.M. Mould surface roughness and interfacial heat transfer using heat flow model. Mater. Sci. Technol. 1997, 13, 702–704. [Google Scholar] [CrossRef]
  13. Thompson, S.; Cockcroft, S.L.; Wells, M.A. Effect of cooling rate on solidification characteristics of aluminium alloy AA 5182. Mater. Sci. Technol. 2004, 20, 497–504. [Google Scholar] [CrossRef]
  14. Kandlikar, S.G. Heat Transfer Characteristics in Partial Boiling, Fully Developed Boiling, and Significant Void Flow Regions of Subcooled Flow Boiling. J. Heat Transf. 1998, 120, 395–401. [Google Scholar] [CrossRef]
  15. Cengel, A.Y. Heat Transfer: A Practical Approach; McGraw-Hill: New York, NY, USA, 2003. [Google Scholar]
Figure 1. Schematic showing the basic structure of the LPDC process [6].
Metals 10 00563 g001
Figure 2. Die structure and cooling channel locations. Note: (1) the cooling channel labels are not sequential and have been reported following the conventions used by the industrial partner; and (2) not all channels were used (T5 and B5 were unused).
Metals 10 00563 g002
Figure 3. Pressure fill-curve.
Metals 10 00563 g003
Figure 4. Photo of the sight glasses used in the trial.
Metals 10 00563 g004
Figure 5. Measured temperatures from different locations (five cycles)—production process condition.
Metals 10 00563 g005aMetals 10 00563 g005b
Figure 6. Measured temperatures from different locations (five cycles)—non-production process condition.
Metals 10 00563 g006aMetals 10 00563 g006b
Figure 7. Thermocouple (TC) locations.
Metals 10 00563 g007
Figure 8. Temperature comparison of the two process conditions at TD17.
Metals 10 00563 g008
Figure 9. Cast-in TC locations.
Metals 10 00563 g009
Figure 10. Temperatures measured from cast-in TCs (in wheel)—production process condition.
Metals 10 00563 g010
Figure 11. Temperatures measured from cast-in TCs (in wheel)—non-production process condition.
Metals 10 00563 g011
Figure 12. Temperatures measured within cooling channels—data from cycle 12 for the production process conditions
Metals 10 00563 g012
Figure 13. Pressure measured within cooling channels—data from cycle 12 for the production process conditions.
Metals 10 00563 g013
Figure 14. Different scenes observed from the recorded video of the sight glasses in the production process condition.
Metals 10 00563 g014
Figure 15. X-ray images of the wheel selected from the production process condition.
Metals 10 00563 g015
Figure 16. X-ray images of the wheel selected from the non-production (porosity) process condition.
Metals 10 00563 g016
Figure 17. Cooling timing of the two process conditions.
Metals 10 00563 g017
Table 1. Chemical composition of A356 aluminum alloy.
ElementSiMgTiFeMnCuZnOther (Each)Other (Total)Al
wt %6.9020.2930.10430.0980.0021<0.00170.009<0.01<0.03remainder
Table 2. Cooling parameters of the production process conditions.
B1B2B3T1T2T3T4T7S2
WaterAirAirAirWaterAirAirWaterAirAirWaterAirWaterAir
Start [s]150235160100180235150150235140509580235
During [s]801080140501090801080401015010
Flow rate *300608080200608030060701006020060
* Unit for water flow rate: L/h; unit for air flow rate: m3/h.
Table 3. Cooling parameters of the non-production process conditions.
B1B2B3T1T2T3T4T7S2
WaterAirAirAirWaterAirAirWaterAirAirWaterAirWaterAir
Start [s]15023511402359012351122580235
During [s]801025025019010150230102502201015010
Flow rate *300608080200608030060701006020060
* Unit for water flow rate: L/h; unit for air flow rate: m3/h.

