1. Introduction
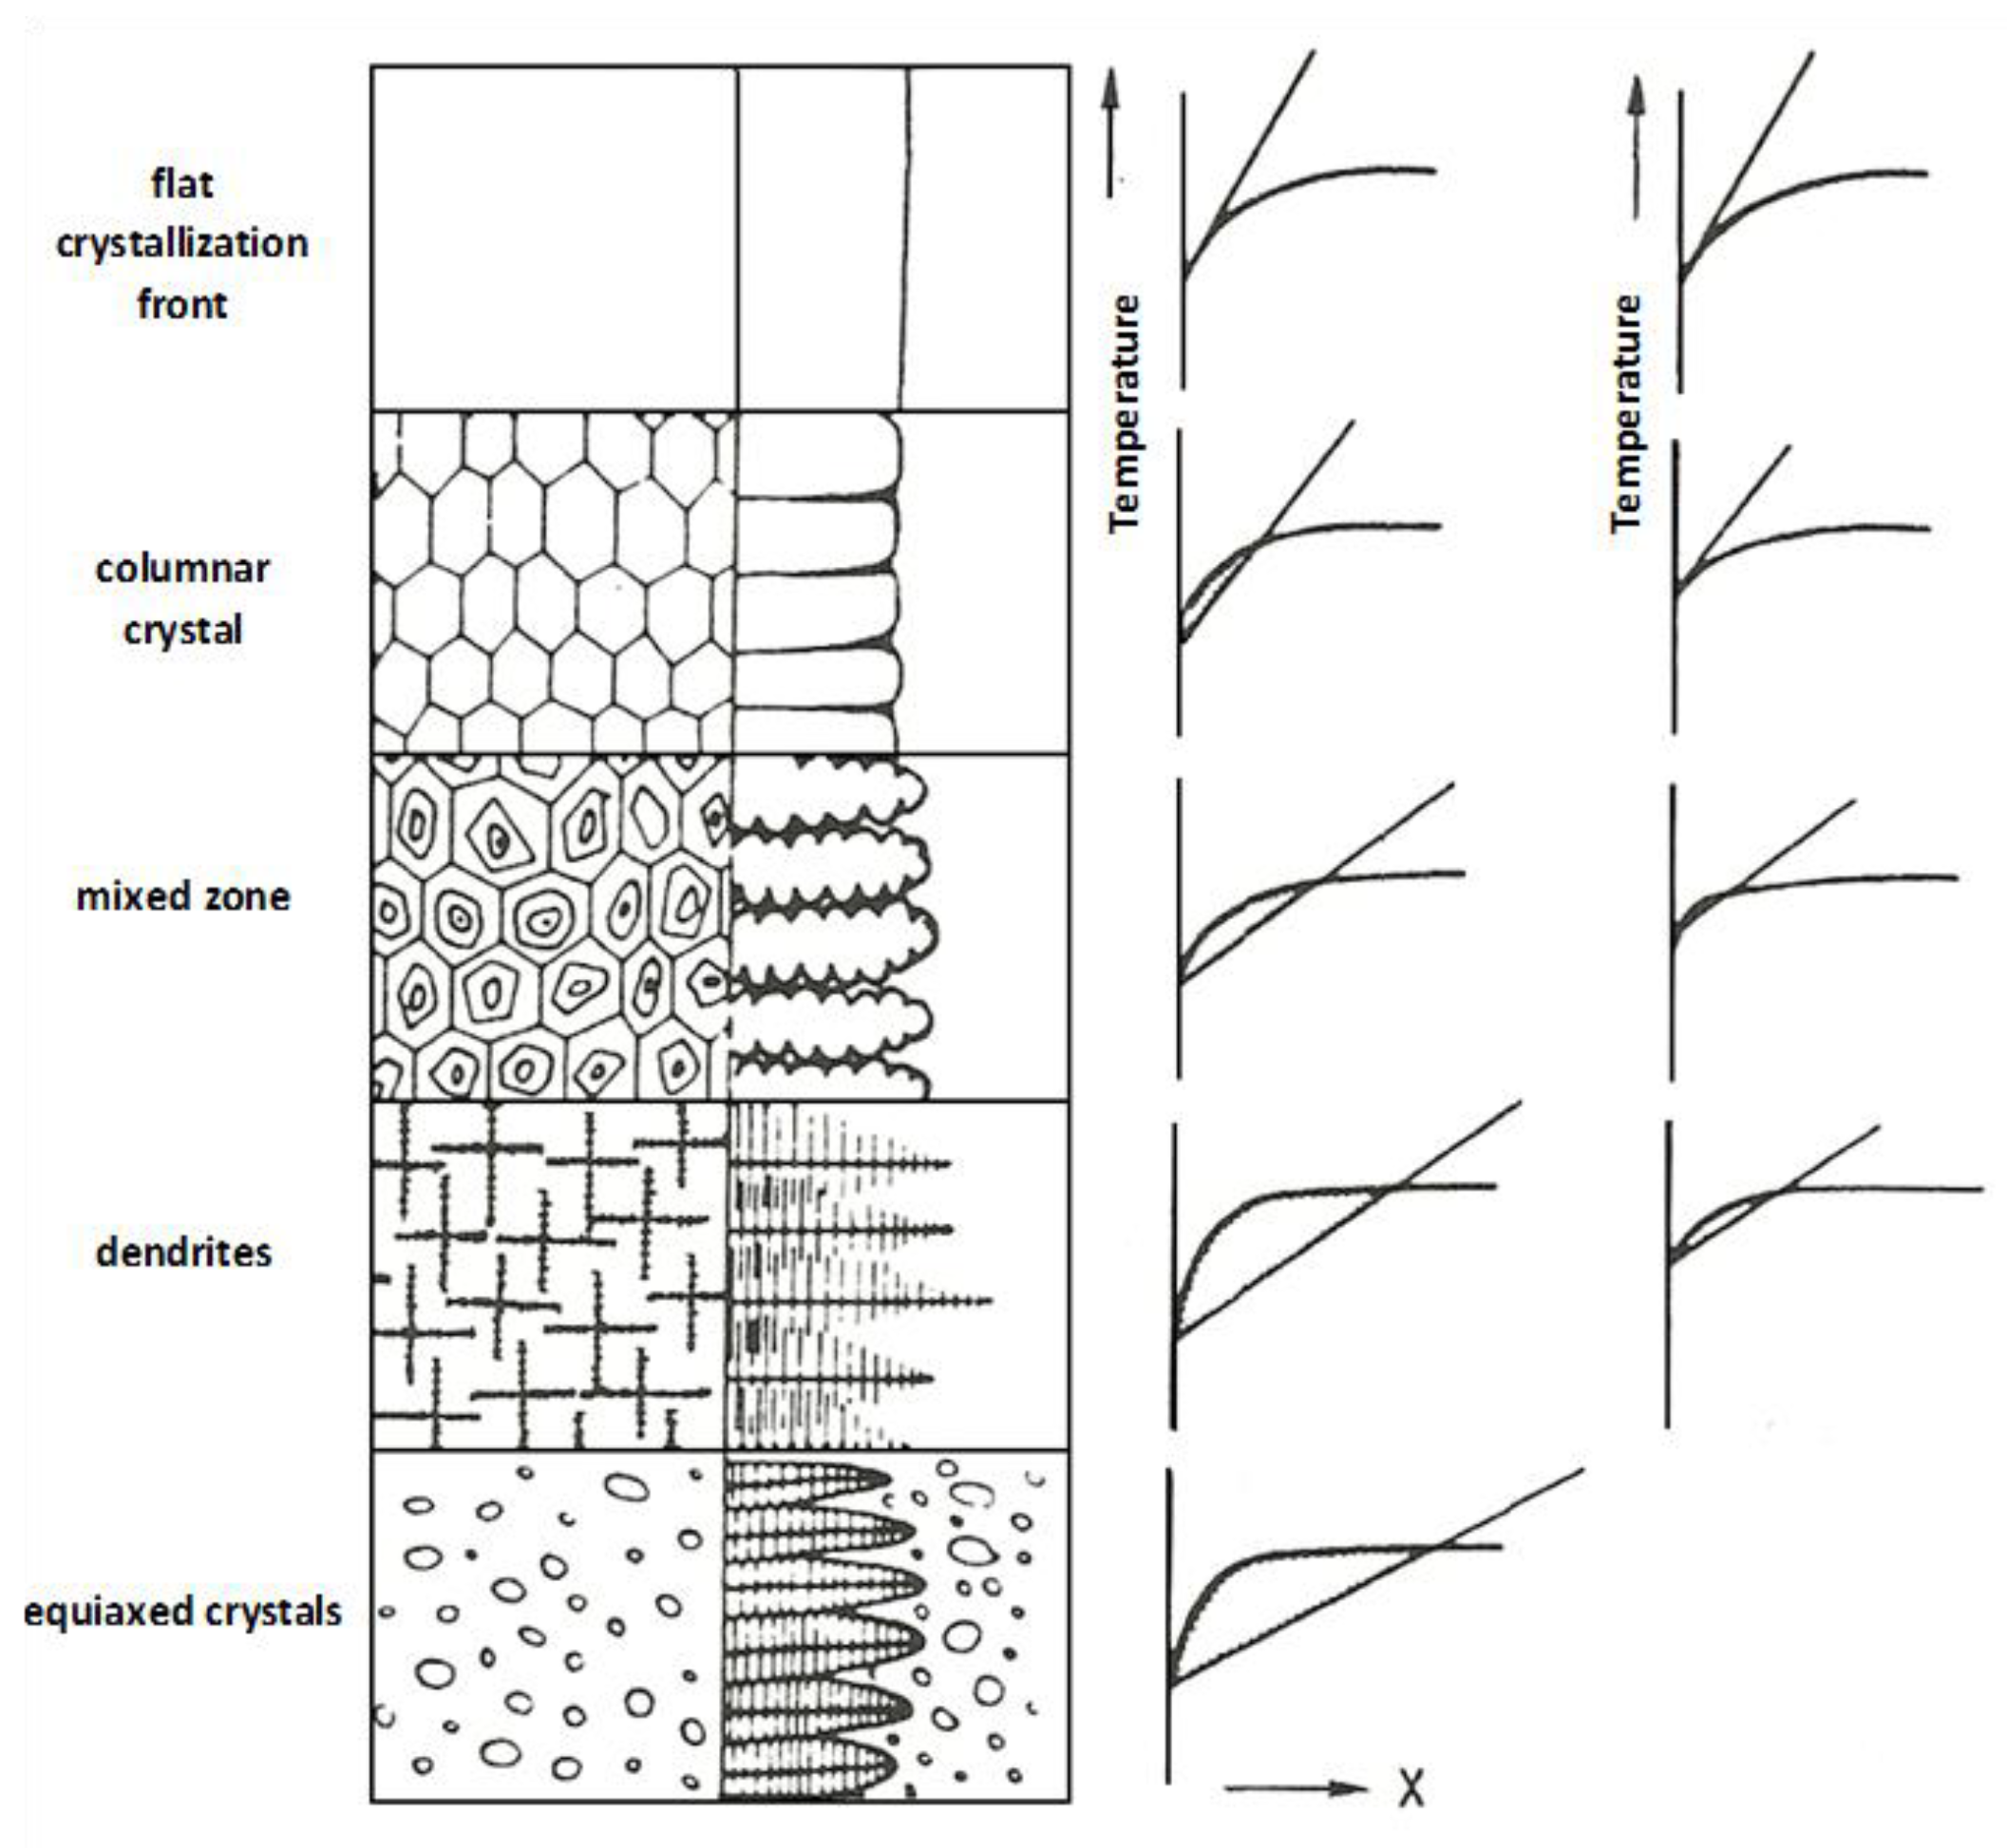
The first descriptions of the macrosegregation effect concentrated on the analysis of effects occurring during the metal solidification process at the interface. Assuming that the solubility of the segregating element was known, both in the liquid phase and the solid phase, the metal bath liquidus temperature variability profile was determined by the intensity of the liquid phase stirring near the interface. The determination of the variability of the actual melt temperature and the corresponding liquidus temperature at a specific point allowed us to determine the undercooling caused by the segregating element’s concentration gradient. The intensity of the constitutional undercooling occurrence was associated directly with the structure of the forming cast strand [
1], presented in
Figure 1. Every single case of the liquidus temperature profile and the actual bath temperature, near the crystallization front, was correlated with the observed structure. The temperature profiles were introduced for both the beginning and the end of a given crystallization step. It can be seen that the type of crystalline structure strongly depends on the initial value of the constitutional undercooling.
Applying the presented concept to a quantitative description of the macrosegregation effect would not allow for the many complex effects occurring within the solidification zone. Fleming [
2,
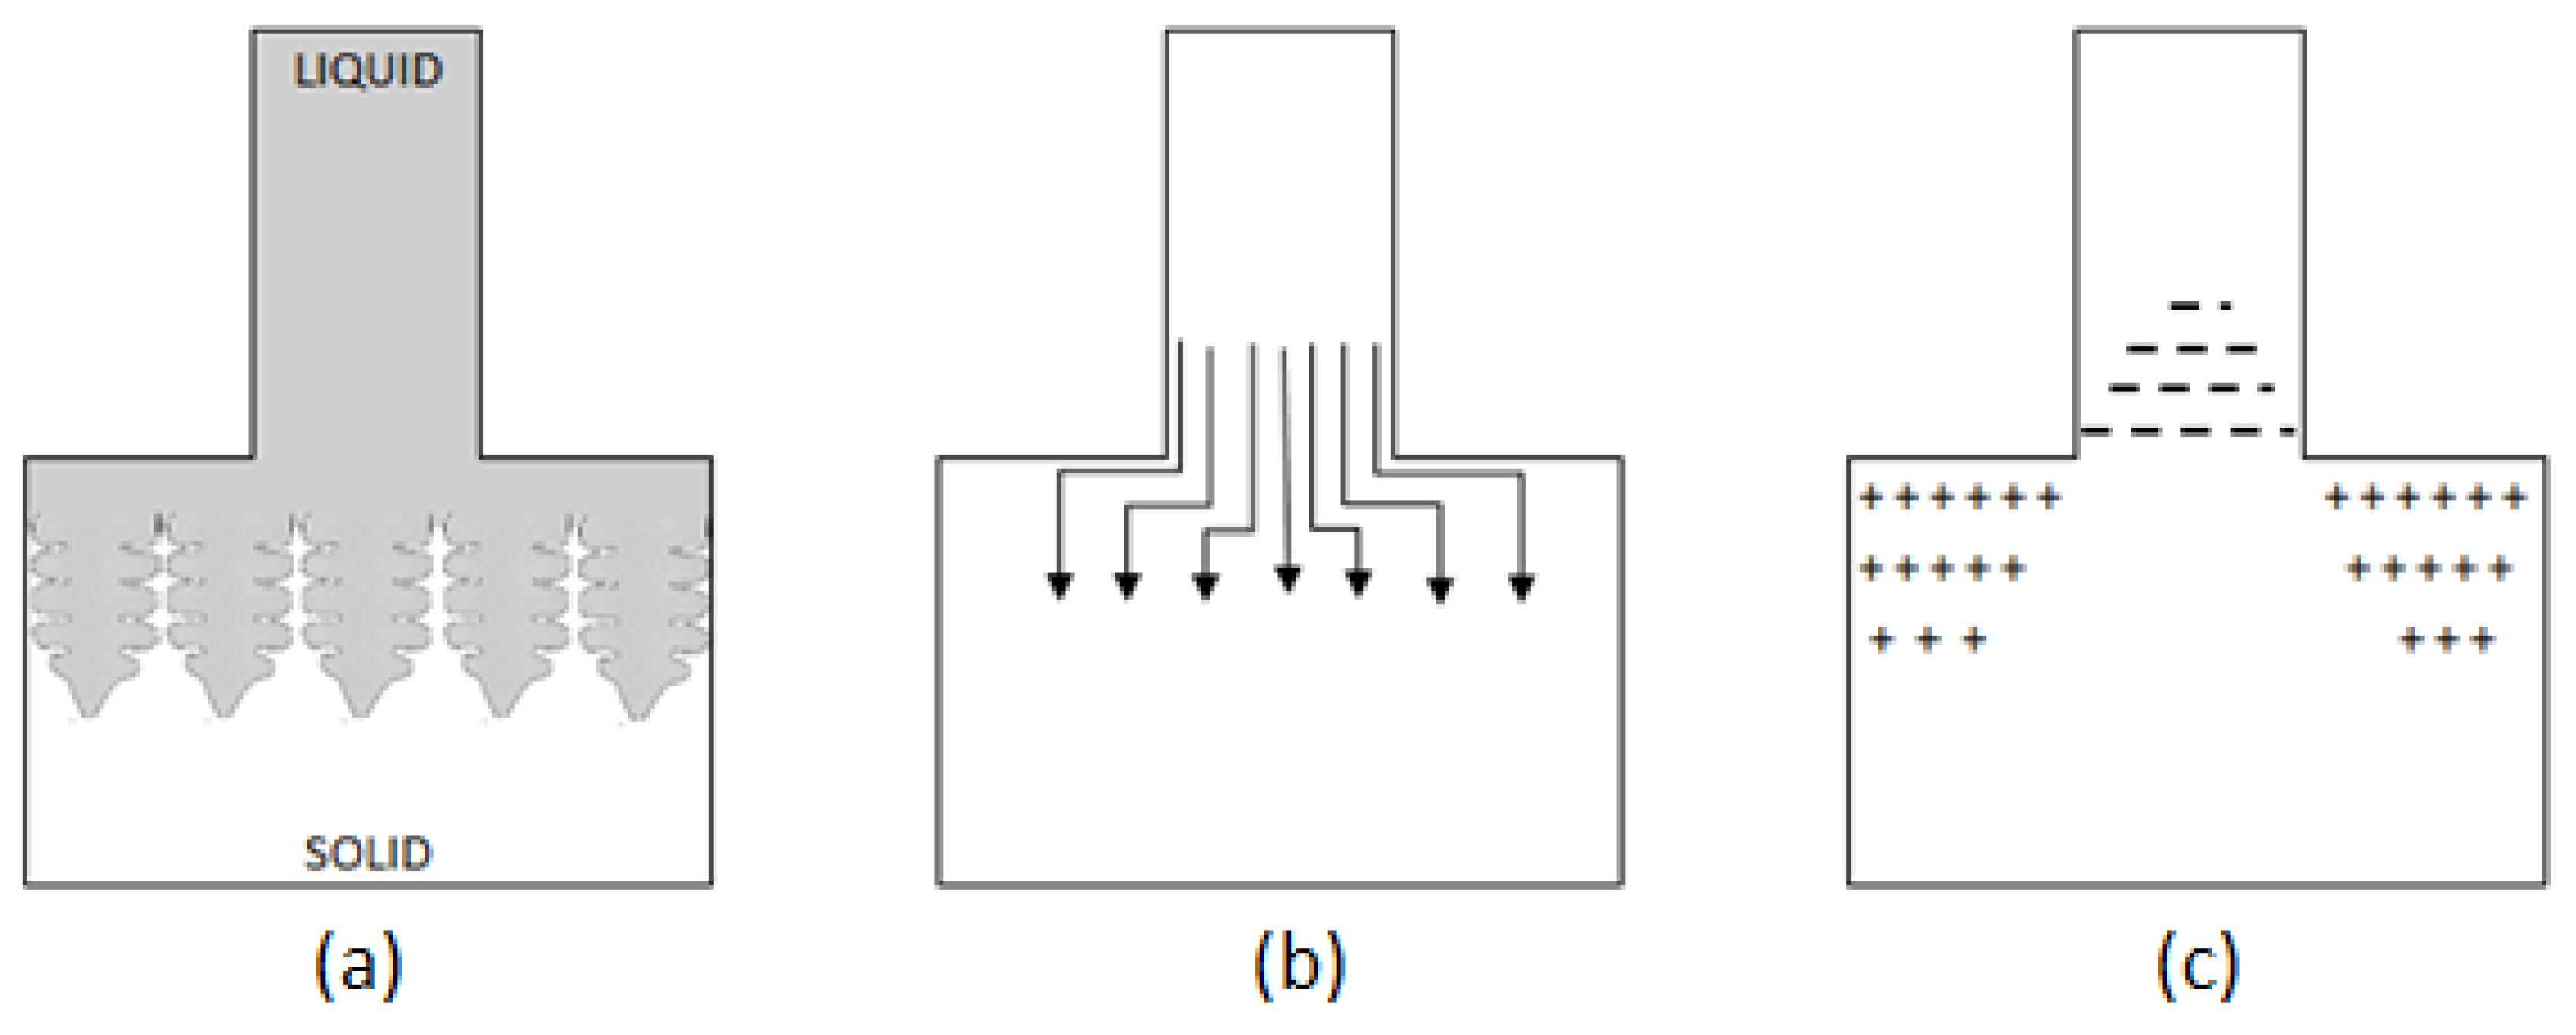
3] presented one of the more interesting analyses of the problem. He aimed to challenge the possibility of macrosegregation occurrence as the result of simply pushing the segregated addition out into the liquid phase, with high concentration gradients of the addition being pushed out before the crystallisation front. Fleming recognised the interdendritic flow varying in time as the basic mechanism of macrosegregation occurrence. Referring to a conducted experiment [
3], he presented the macrosegregation as a result of the solidification process with a decreasing cross-section area of the flow (
Figure 2). The mathematical model developed on the basis of this theory, taking into account the shrinkage effect and the deformation of the liquid phase space is based on the following relationship [
3]:
where
gL is the liquid fraction volume,
CL is the interdendritic liquid composition,
β is the solidification shrinkage,
vx is the component of flow in the x direction, R is the velocity of the planar isotherm perpendicular to, and moving in, the x direction),
k is the partition ratio.
It is worth noting that the simplification of Equation (1), by assuming no shrinkage and zero velocity in the
x direction, leads to a relationship (known from the first studies) based on the following assumptions: full diffusion in the interdendritic liquid, no diffusion in the solid phase, no macroscopic liquid movement, and no undercooling before nucleation [
3]:
An analysis of very complex mathematical models of the macrosegregation effect leads to the conclusion that credible verification of these models is difficult, given that we cannot be certain of the validity of any assumptions. This analysis attempts to ascertain whether convection in a liquid significantly affects the segregation in the semi-solid zone. Today, it is difficult to expect an answer on the basis of a theoretical model only, and, therefore, experimental tests are still very relevant, both on a laboratory scale and an industrial scale. The published information [
4,
5,
6,
7,
8,
9] concerning the positive influence of electromagnetic stirrers on the reduction of carbon segregation in the continuous steel casting process shows that the mentioned direction of actions is very promising.
Difficulties relating to the verification of the mathematical model of the segregation effect do not exhaust the list of occurring problems. Moreover, the issue of the segregation effect recording is extremely important. It may seem trivial, but, after practical examination of the existing hazards, one should propose a formal criterion for the assessment of the experimental tests conducted. This issue becomes even more important if the segregation is recorded in industrial conditions as one of the essential components of the quality inspection system.
The problem of measuring the carbon content at the selected points of the continuous cast strand is considered negligible and is erroneously ignored in the discussion concerning macrosegregation. The authors analyzed a large number of samples, which helped them to introduce a new balance model. The authors’ model allows defective samples to be rejected. Furthermore, precise calculation of the carbon segregation ratio, along with the ingots proper quality control, facilitates the best casting parameters selection, such as casting speed versus a water cooling intensity in each spray zone.
3. The Balance Model Based on the Values of Local Segregation Ratios
The method of the segregation ratio calculation is usually based on the relationship given by the formula:
where [
C] is the carbon percentage at point “
i” of the sample and [
C]
ladle is the carbon percentage in a ladle sample. Both the numerator and the denominator of this fraction influence the accuracy of the estimation of the value of the segregation ratio. It is observable that the accuracy of the ladle sample analysis is particularly relevant as its potential error is transferred onto all values of the
k-ratio. In addition, a principal approach to the segregation effect requires that the stability of the melt chemical composition be considered. In the continuous steel casting process, at each replacement of the main ladle, there is a transition period, during which the chemical composition changes. Additionally, small composition gradients within the heat cannot be excluded, because of the imperfect homogenization of the melt, in particular at the beginning of casting the subsequent heat in a sequence. Determining the denominator in Equation (4) can be another method used to solve the problem.
where [
C]
0 is the carbon percentage in the tested fragment of the strand, at the ideal lack of concentration gradient, and n is the number of measurement points from the edge to the centre of the strand. However, this method is incorrect as it leads to overstating the [
C]
0 value. Therefore, the authors propose to apply the weighted average method, in the form:
where
wi denotes weights to calculate the weighted average.
The table of results for tests—
Table 3—shown in
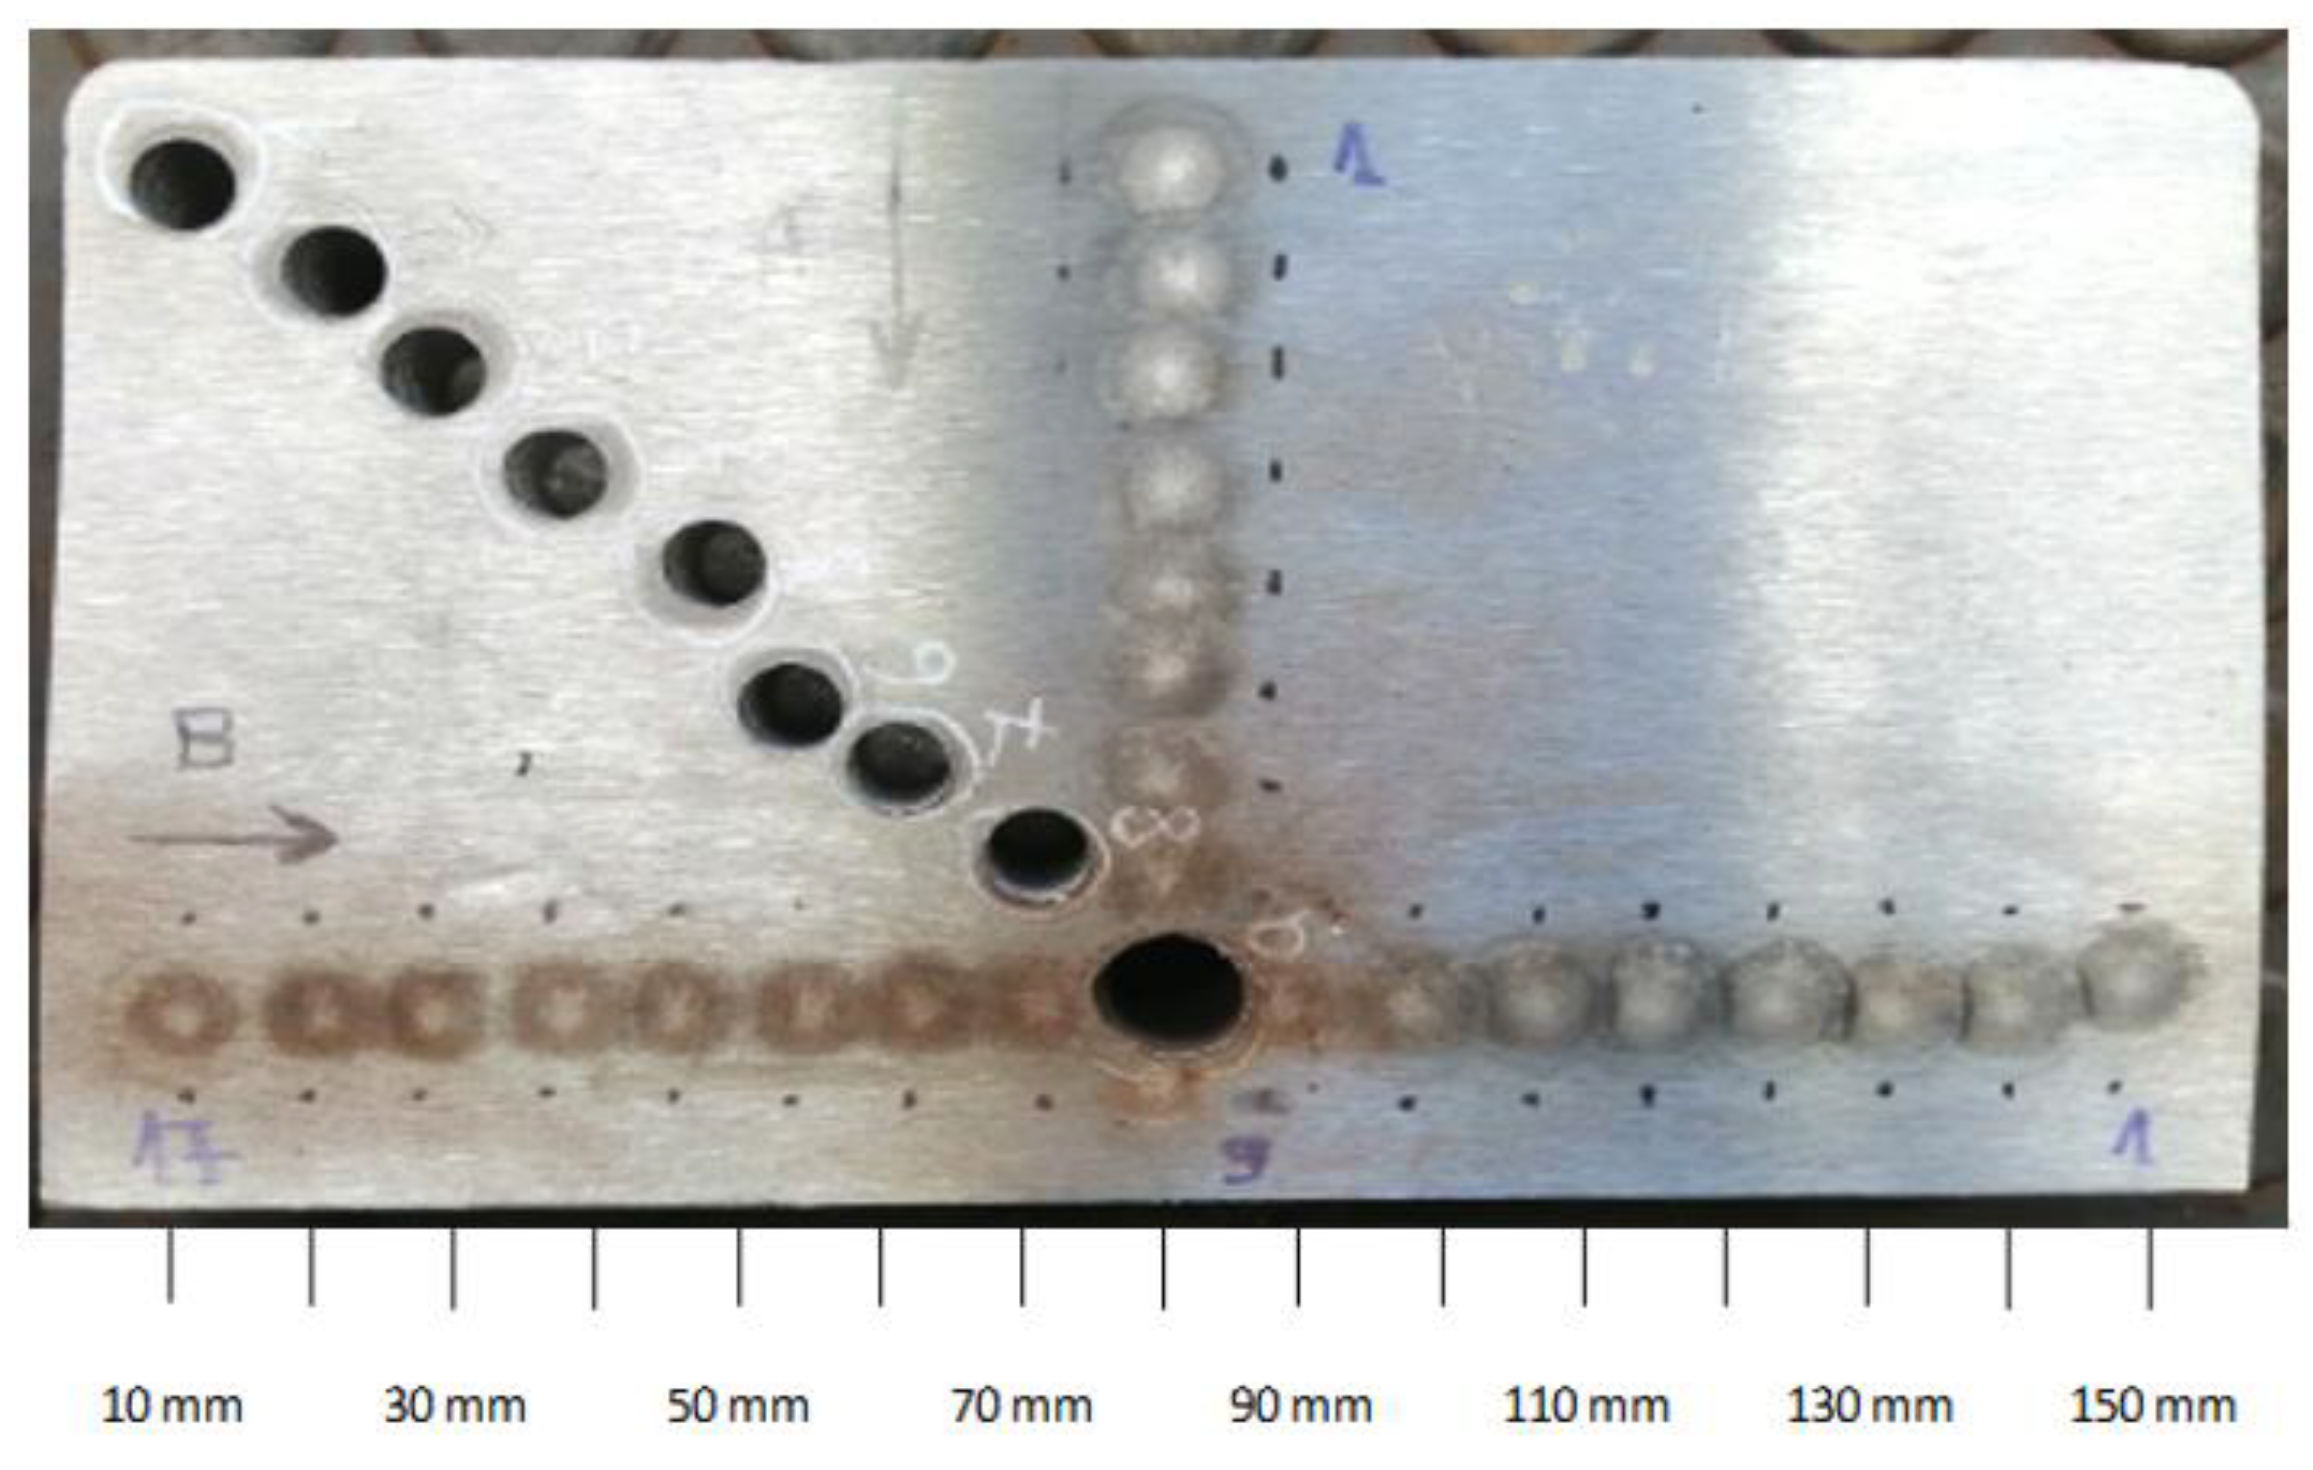
Figure 5, using weights for a 160 mm × 160 mm square billet, is as follows:
Derived weight values and the justification of the selection will be presented in the next step with the definition of Equation (7). The starting point for the balance analysis conducted is the assumption that the balance of any segregating element does not change. It means that its content in the sample after segregation is exactly the same as in the hypothetical condition without any segregation. Let us consider, for instance, a test sample, which is a rectangular prism with dimensions 160 mm × 160 mm ×
h mm, where h is its height. Assuming that no concentration gradient occurs, the mass of carbon
m[C] contained in this sample should be determined from the equation:
where
F0 is the billet cross-section area,
h is the sample height,
ρ is the steel density, [
C]
0 is the carbon percentage in the sample if there were no segregation. In theory, the last value is the carbon content in the ladle sample, but due to the already described fluctuations in the melt composition, this value is a source of additional errors when determining the values of the segregation ratio.
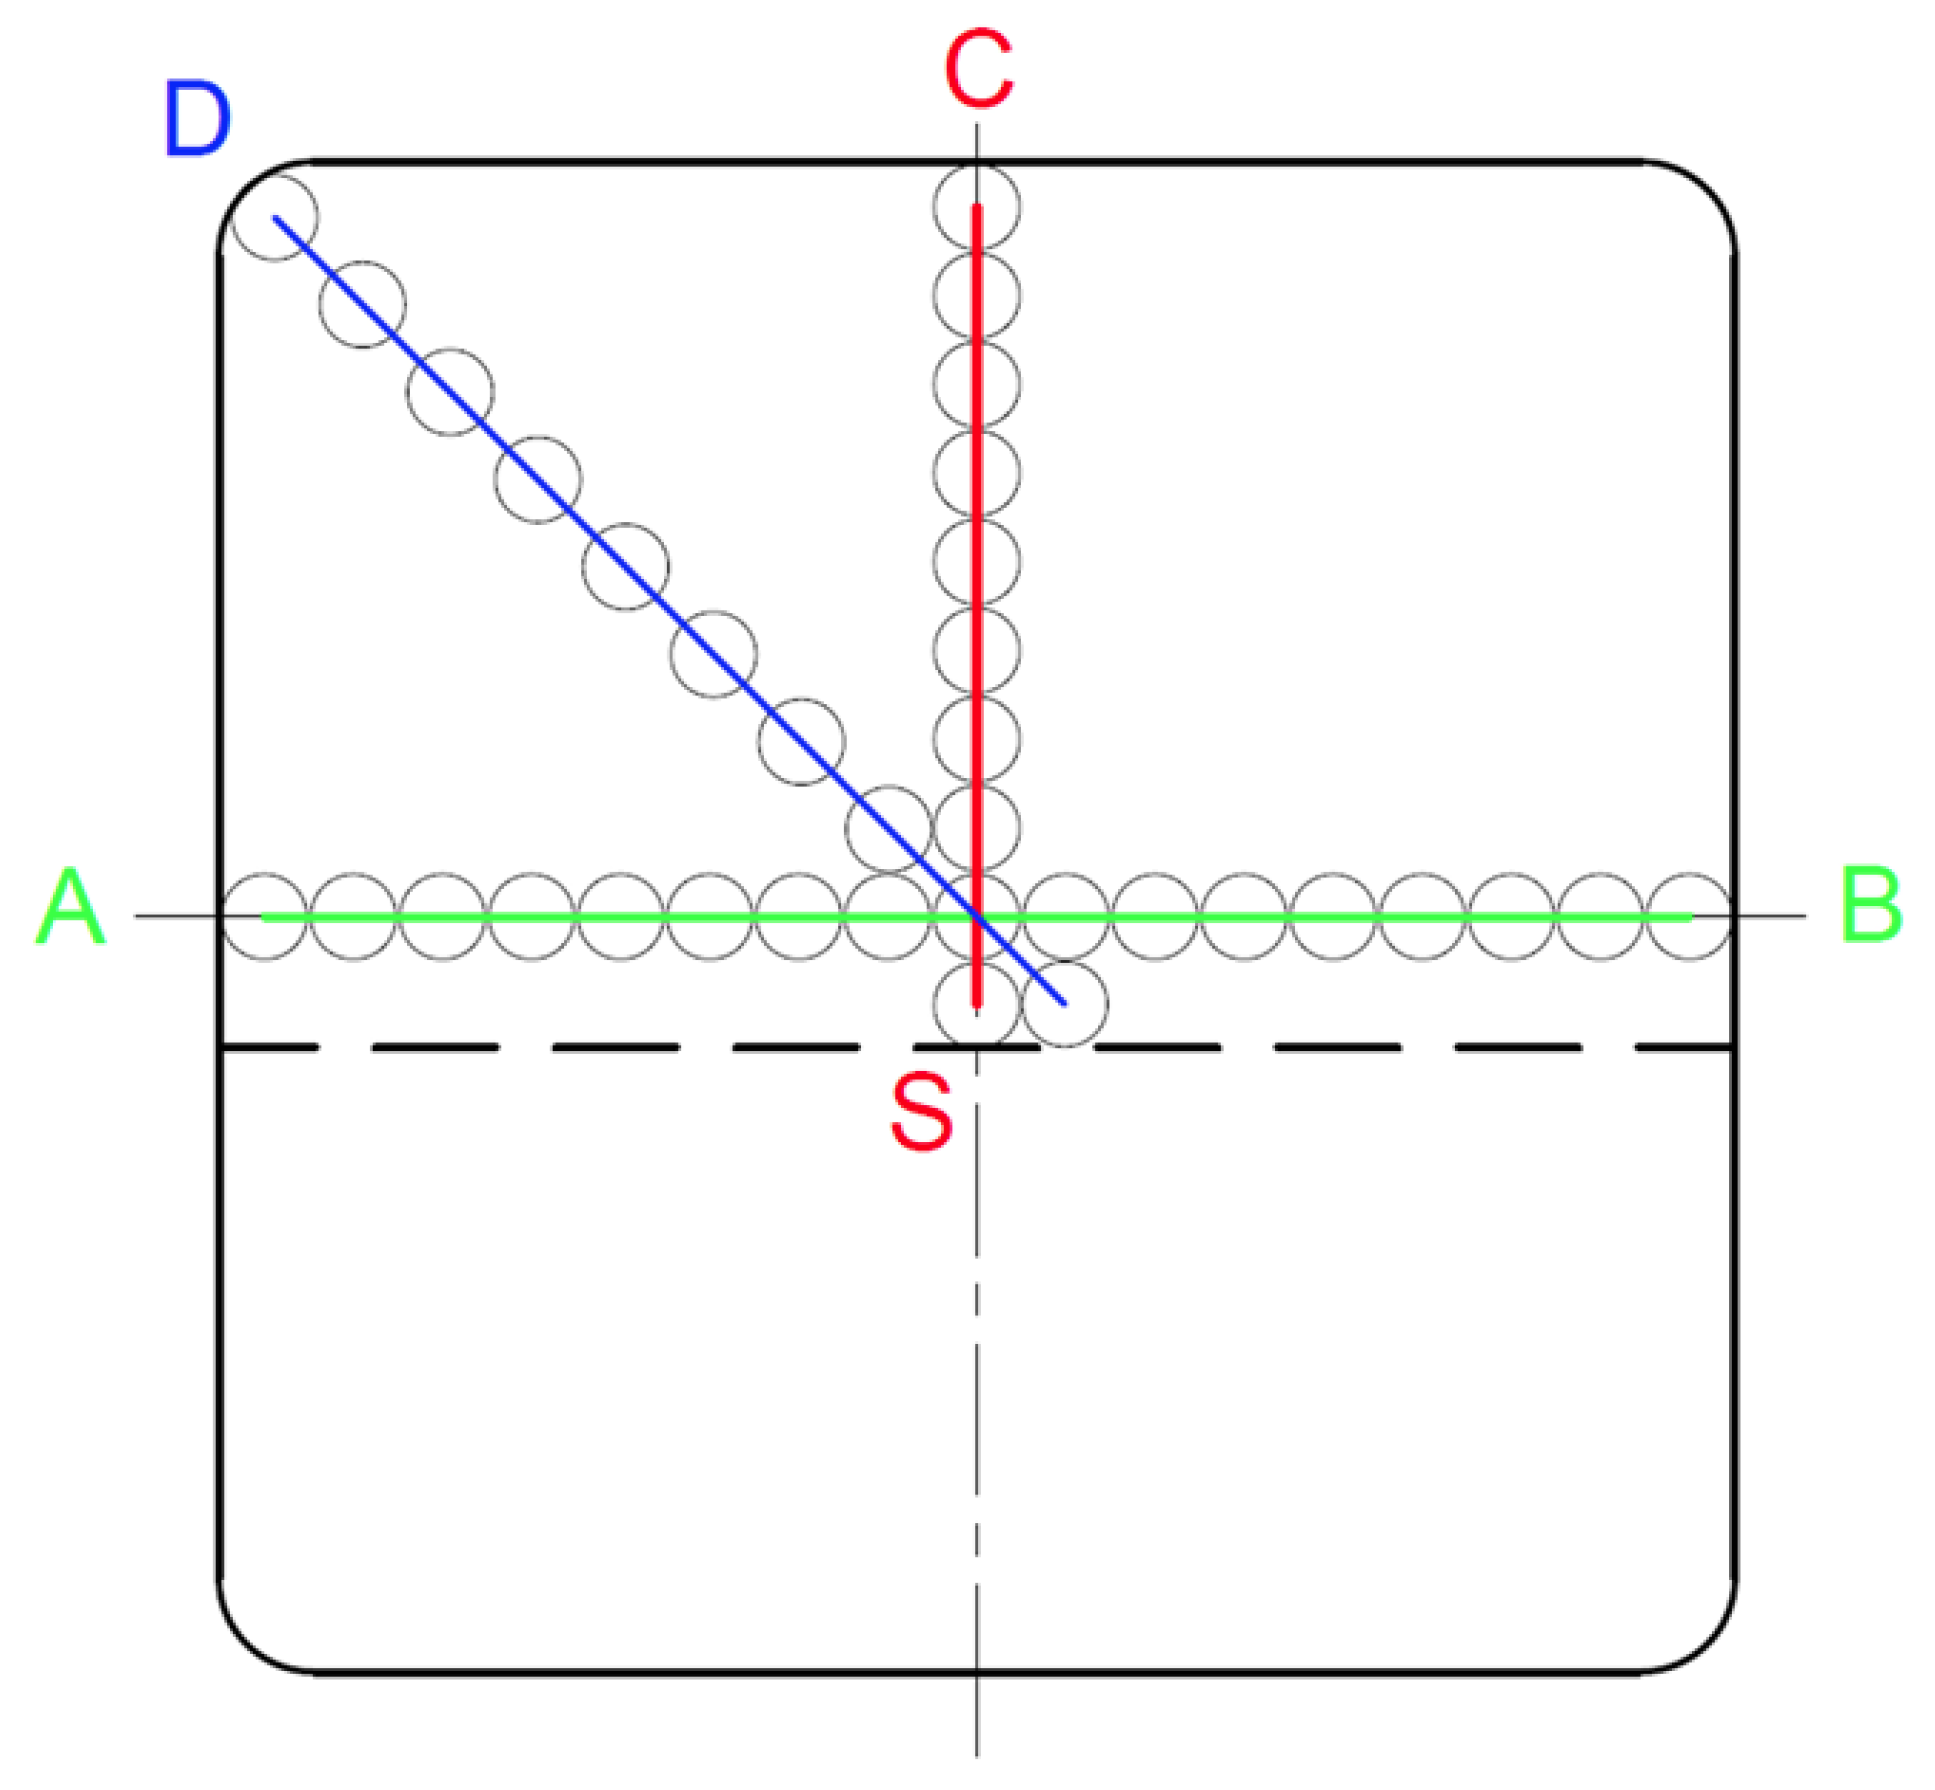
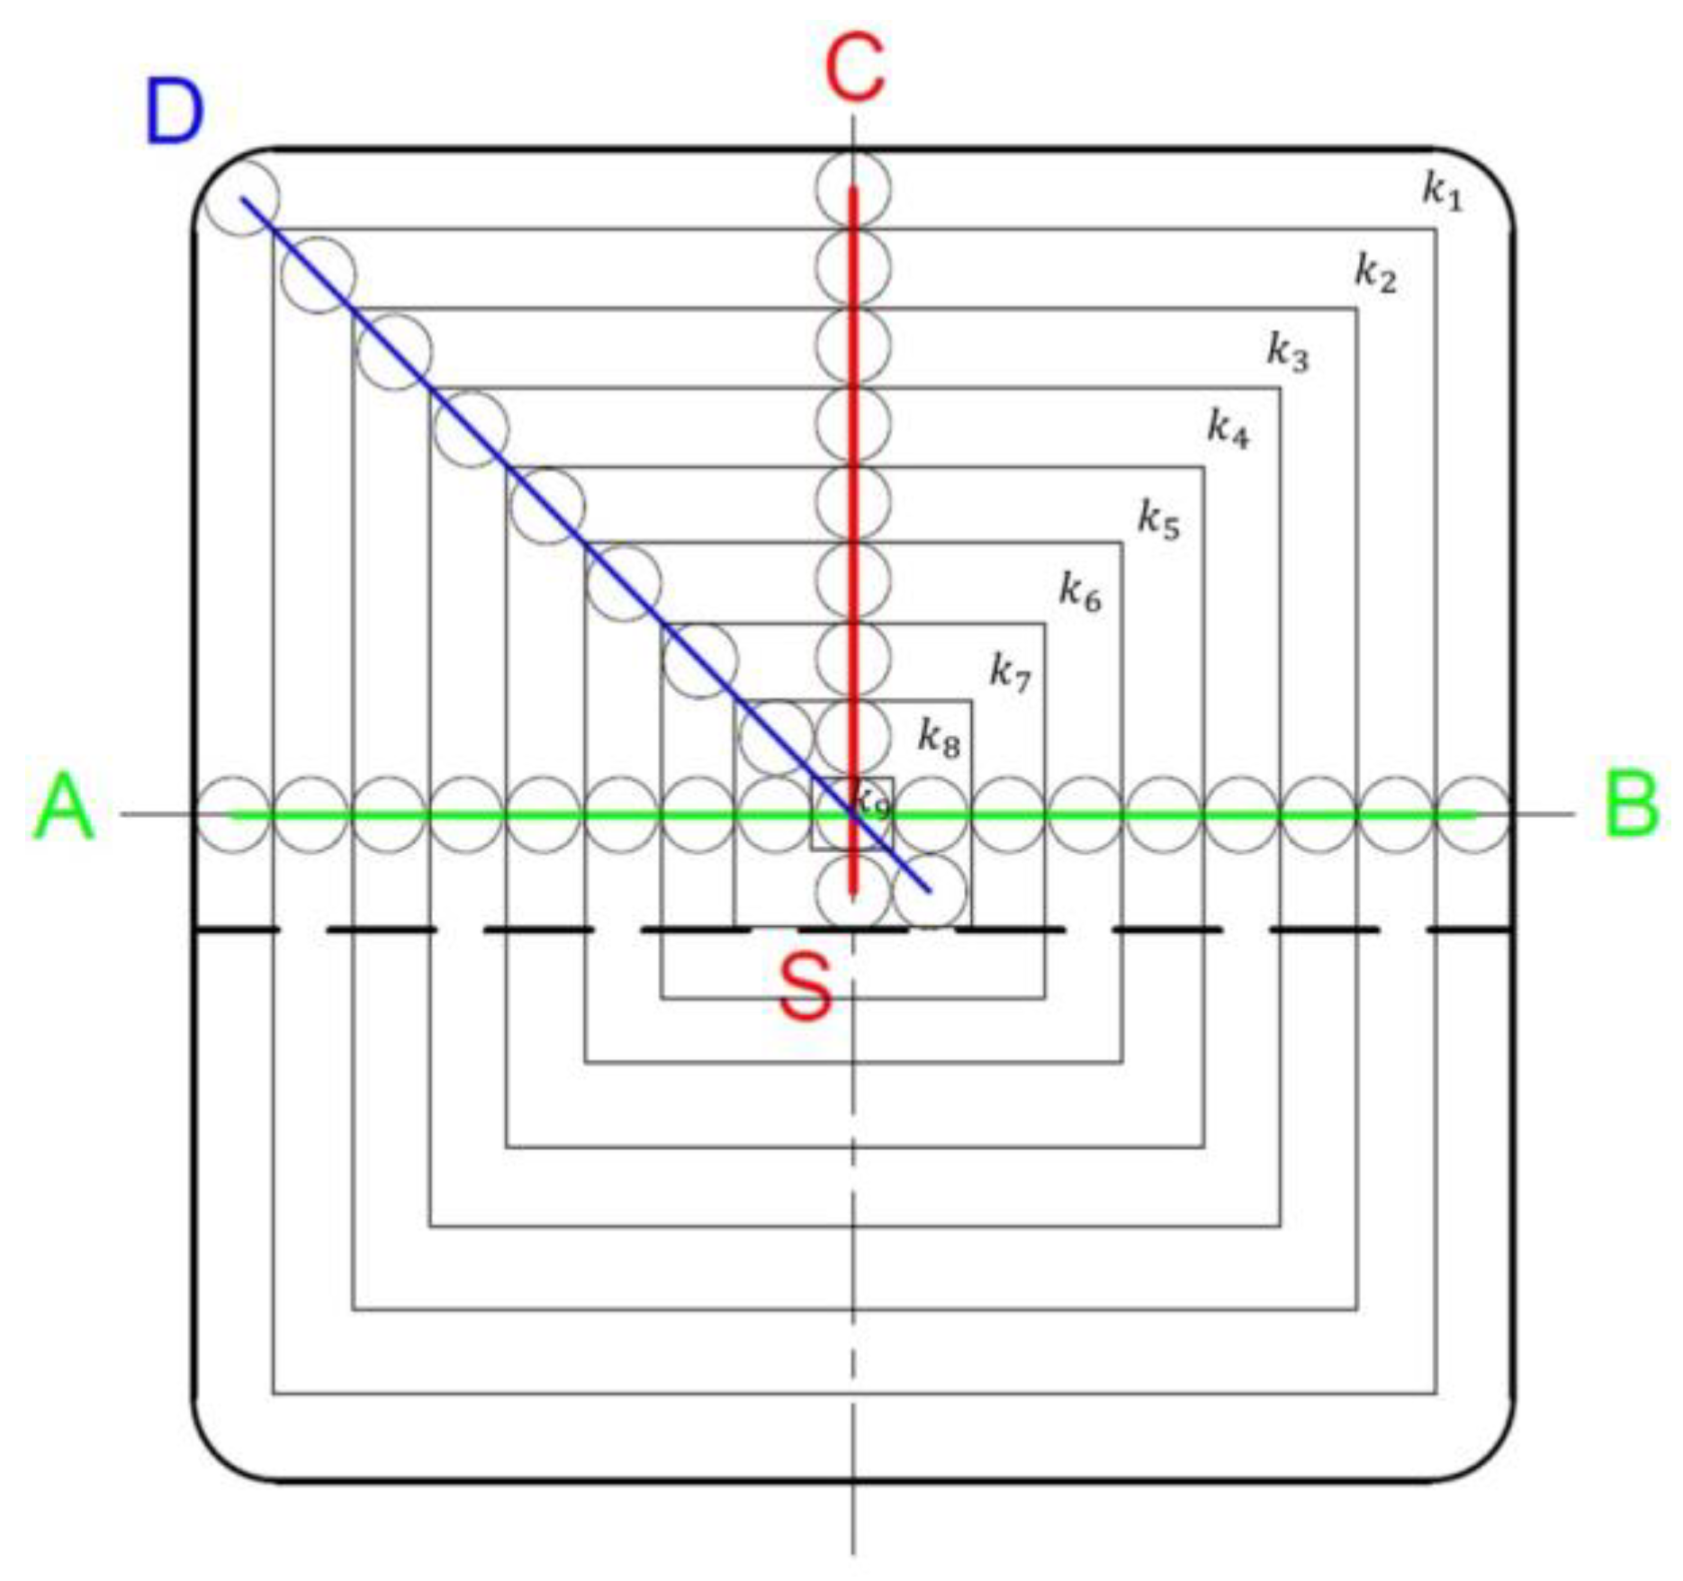
In fact, the distribution of carbon in the sample is non-uniform, and, therefore, a calculation of its total content must take into account this diversity. In the conducted experiment, we have nine analyses of chemical composition, starting from the edge to the centre of the strand (
Figure 6).
Assuming that in each of nine measurement zones the average carbon content is the same as its measured value, the carbon balance equation can be presented as follows:
where
Fi is the area of the “
i-th” zone, h is the sample height,
ρ is the steel density, [
C]
0 is the carbon percentage in the sample if there were no segregation,
ki is the carbon segregation ratio in the “
i-th” zone (equal to [
Ci]/[
C0], [−]), [
C]
i is the carbon percentage measured in the “
i-th” zone. As the calculated carbon contents in Equations (6) and (7) must be identical, it results in this relationship:
Equation (8) also allows us to determine the weights referred to in Equation (5). After substituting
ki in Equation (8) with the relationship defined by Equation (3), we obtain:
Equation (9) was used to determine the basic carbon content in each sample, which later was used for determining adjusted values of segregation ratios. These values take into account potential fluctuations of the melt chemical composition during casting. It follows directly from Equation (8) that fluctuations of segregation ratios do not have to yield an average near 1. For instance, Equation (8) is satisfied for the following set of segregation ratios, presented in
Table 4:
The arithmetic mean of these ratios is 1.2. This effect arises directly from the fact that the metal mass in zone 1 for the case concerned is more than 64 times higher than in zone 9. When attempting to determine the average value of segregation ratios with the arithmetic mean method, it is tacitly assumed that these zones have the same mass.
Criterion for Evaluation of the Segregation Measurement Quality
Comprehensive research of the element segregation effect in the continuous steel casting process is usually carried out with a big measurement database, created on the basis of many tests. In the tests described, the number of chemical spectral analyses exceeded 1300. With such big data sets, the balance method described above allows measurements burdened with too high an error to be quickly and credibly eliminated. Rearranging Equation (8), while estimating the number of measurement zones, we can write:
It is understood that Equation (11) assumes the idealisation of the problem by assuming that, in each
i-th zone, no concentration gradient occurs. This is obviously not true. Therefore, the criterion defined in Equation (11) should be considered satisfied when the obtained value fluctuates within a previously imposed and consciously selected range. In practice, it can be the range 0.9–1.1 (or even wider). Filtering the database results of the segregation assessment does not exhaust the problem of the assessment of measurement quality in the billet axis. Very often, as already mentioned, both the measurement carried out with the sample drilling method and the analysis with the LECO apparatus show a result lower than the spectral analysis. In such cases, when the spectral analysis result is doubtful, Equation (11) allows the theoretical carbon content in the axis to be checked. In this case, the estimation of carbon content in the axis can be calculated as follows:
Author Contributions
K.M.-P. and J.F. prepared materials, developed the method, and wrote the paper; P.K. and T.R. conducted experiments. All authors have read and agreed to the published version of the manuscript.
Funding
This research work was completed as part of a project: “Application of electromagnetic stirrers on the strands of a continuous billet casting machine in order to produce a new grade of steel designated for steel cord production” in collaboration with the National Centre for Research and Development and ArcelorMittal Poland, project no.: POIR.01.02.00-00-0219/17 and was financed with funds from AGH University of Science and Technology 5.72.110.629.
Conflicts of Interest
The authors declare no conflict of interest.
References
- Schwerdtfeger, K. Metallurgie des Stranggießens; Verlag Stahleisen: Düsseldorf, Germany, 1992; pp. 1–655. [Google Scholar]
- Flemings, M.C. Our Understanding of Macrosegregation: Past and Present. ISIJ Int. 2000, 40, 833–841. [Google Scholar] [CrossRef]
- Flemings, M.C.; Nereo, G.E. Macrosegregation, Part I. Trans. TMS-AIME 1968, 239, 1449–1461. [Google Scholar]
- Xiao, C.; Zhang, J.; Luo, Y.; Wei, X.; Wu, L.; Wang, S. Control of macrosegregation behavior by applying final electromagnetic stirring for continuously cast high carbon steel billet. J. Iron Steel Res. Int. 2013, 20, 13–20. [Google Scholar] [CrossRef]
- Oh, K.S.; Chang, Y.W. Macrosegregation behavior in continuously cast high carbon steel blooms and billets at the final stage of solidification in combination stirring. ISIJ Int. 1995, 35, 866–875. [Google Scholar] [CrossRef]
- Sahoo, P.P.; Kumar, A.; Halder, J.; Raj, M. Optimisation of electromagnetic stirring in steel billet caster by using image processing technique for improvement in billet quality. ISIJ Int. 2009, 49, 521–528. [Google Scholar] [CrossRef]
- Ludlow, V.; Thiele, M.; Ciriza, J.; Laraudogoitia, J.J.; van der Knoop, W. Optimal Strategy to Minimize Central Segregation during Billet Casting of High Carbon Steel Grades; Technical Report for Technical Steel Research, Final Report; European Commission: Brussels, Belgium, 2002; p. 264. [Google Scholar]
- Thome, R.; Harste, K. Principles of billet soft-reduction and consequences for continuous casting. ISIJ Int. 2006, 46, 1839–1844. [Google Scholar] [CrossRef]
- Ji, Y.; Tang, H.; Lan, P.; Shang, C.; Zhang, J. Effect of dendritic morphology and central segregation of billet castings on the microstructure and mechanical property of hot-rolled wire rods. Steel Res. Int. 2017, 88, 1–14. [Google Scholar] [CrossRef]
- Choudhary, S.K.; Ganguly, S. Morphology and segregation in continuously cast high carbon steel billets. ISIJ Int. 2007, 47, 1759–1766. [Google Scholar] [CrossRef]
- Hutny, A.M.; Warzecha, M.; Derda, W. Segregation of elements in continuous cast carbon steel billets designated for long products. Arch. Metall. Mater. 2016, 61, 2037–2042. [Google Scholar] [CrossRef]
- Merder, T.; Warzecha, M. Optimization of a six-strand continuous casting tundish: Industrial measurements and numerical investigation of the tundish modifications. Metall. Mater. Trans. B 2012, 43, 549–559. [Google Scholar] [CrossRef]
- Rueckert, A.; Warzecha, M.; Koitzsch, R.; Pawlik, M.; Pfeifer, H. Particle distribution and separation in continuous casting tundish. Steel Res. Int. 2009, 80, 568–574. [Google Scholar] [CrossRef]
Figure 1.
The type of crystals formed, based on the constitutional undercooling, versus distance from the crystallization front (coordinate axis X).
Figure 2.
Macrosegregation in a unidirectionally solidified casting of reduced cross section. Schematic diagrams of (a) solidification when location of the reduced cross section is just below the liquidus temperature, (b) flow lines for feeding solidification shrinkage at this time of solidification, (c) resulting macrosegregation.
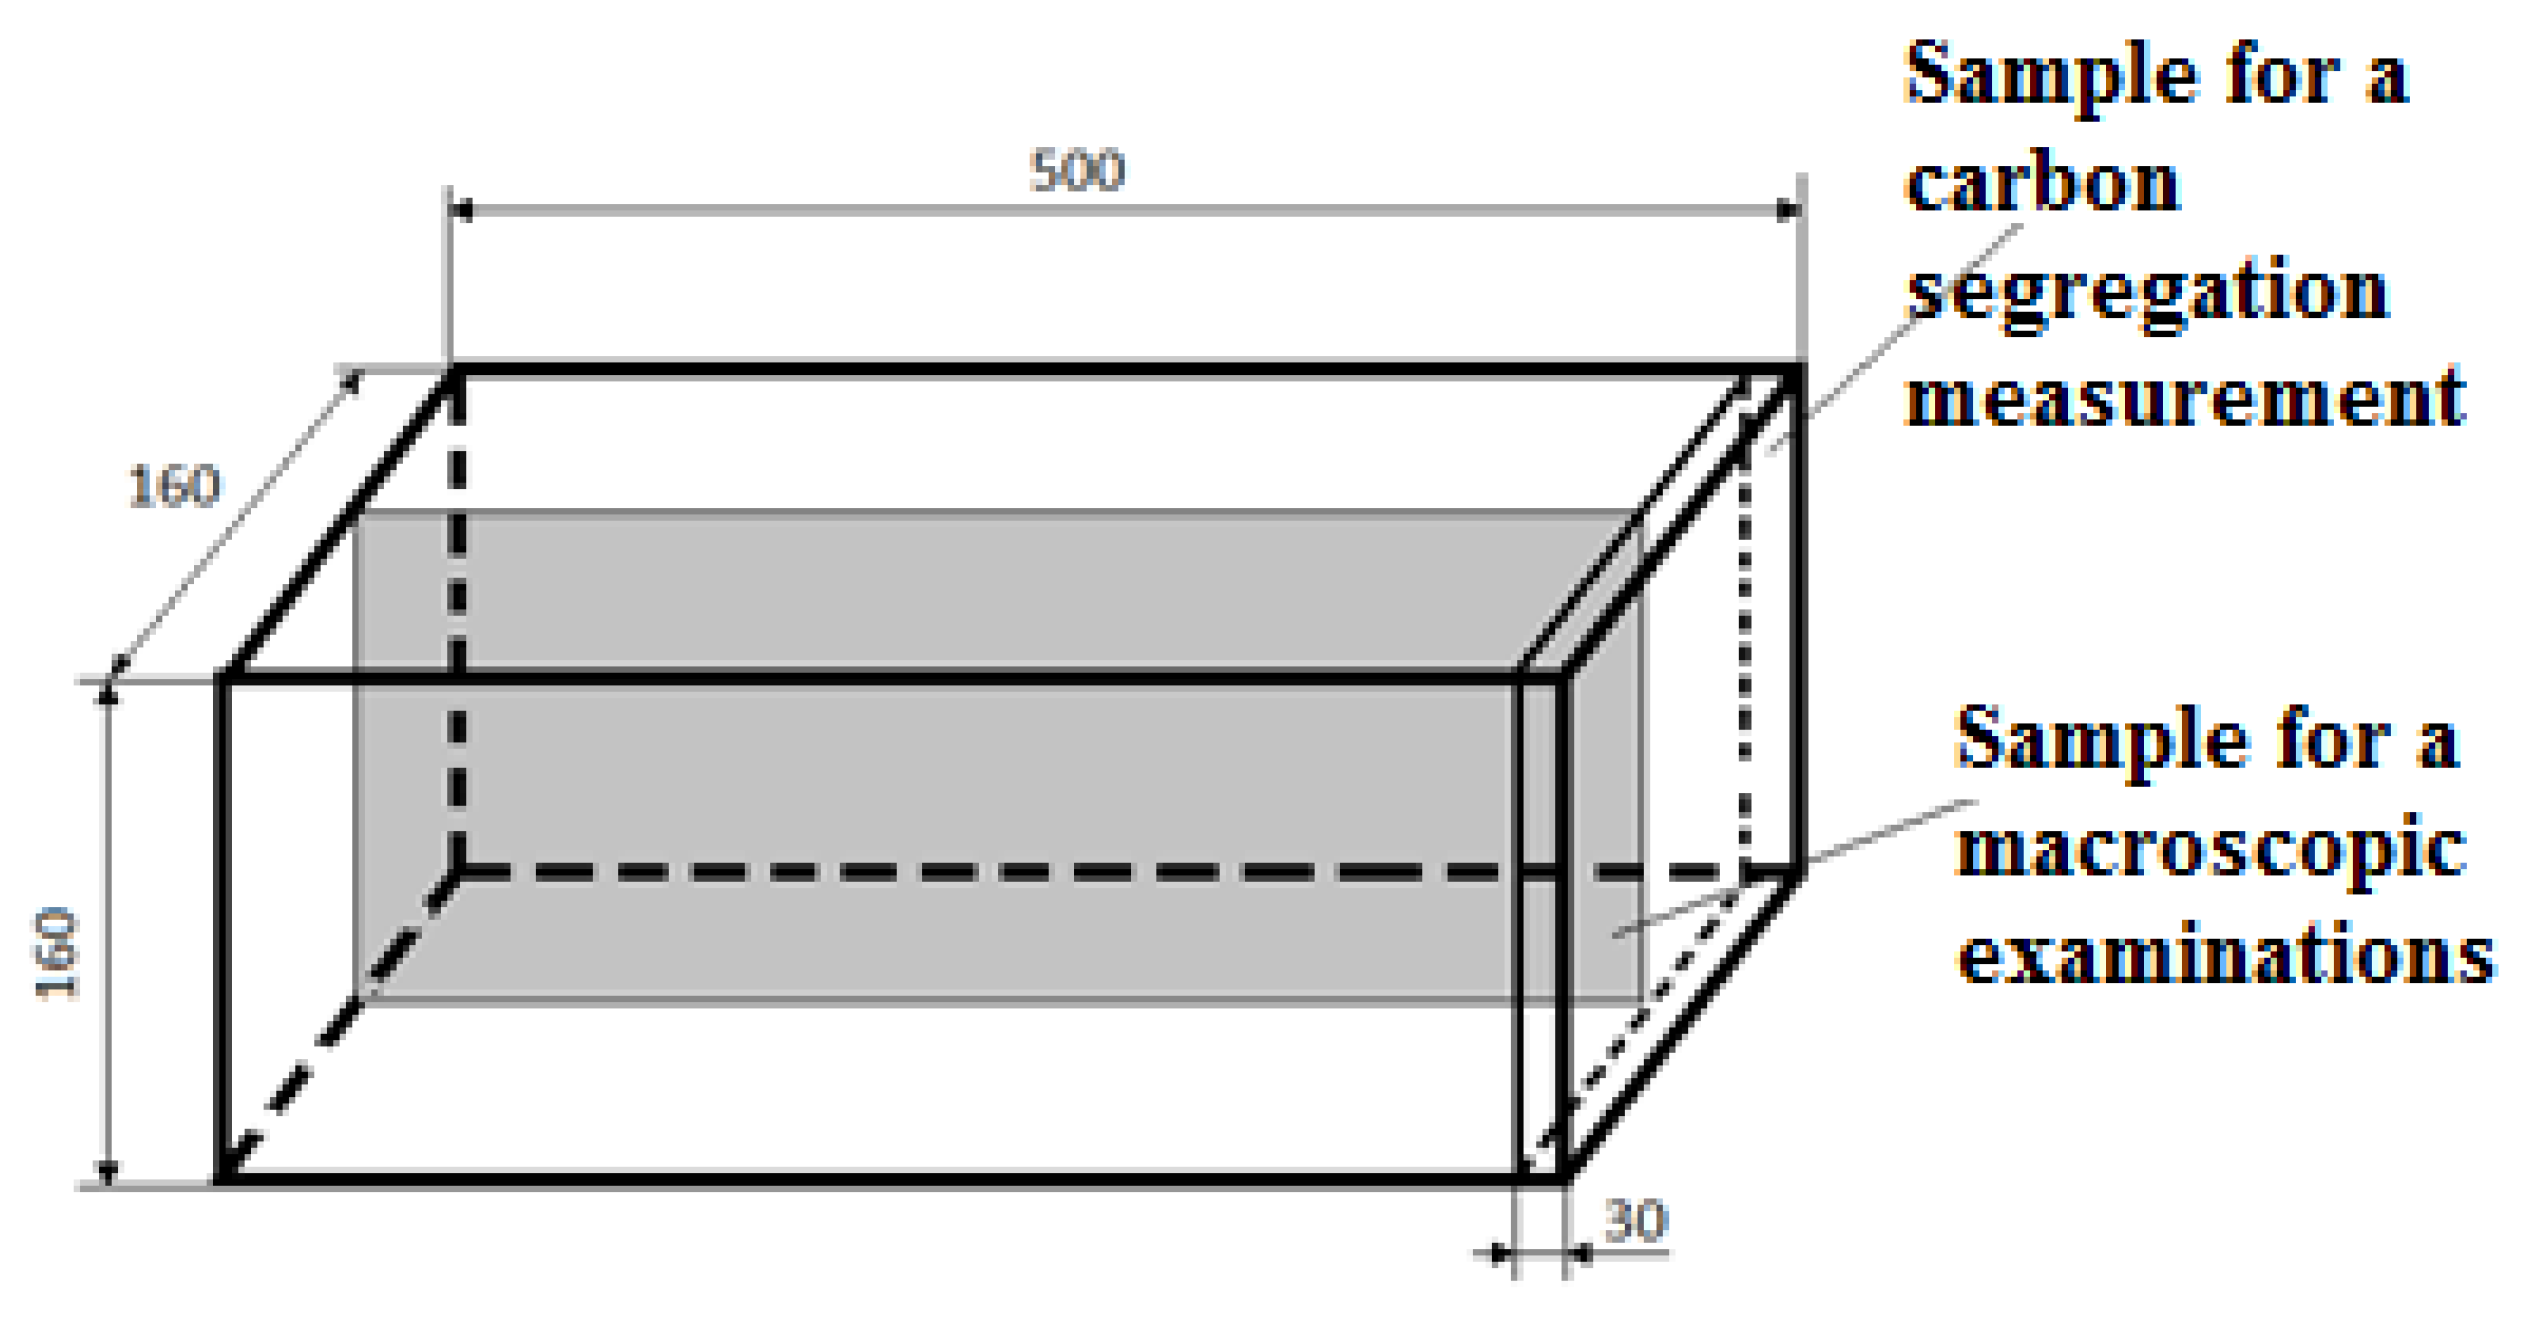
Figure 3.
The shape of samples and the sampling method for macroscopic examinations and the assessment of the carbon segregation intensity.
Figure 4.
Billet cross-section with marked points for carbon content measurement.
Figure 5.
Example of sample taken from a billet cross-section with marked points for carbon content measurement.
Figure 6.
Layout of measurement points on the billet cross-section and division of the cross-section area into 9 zones.
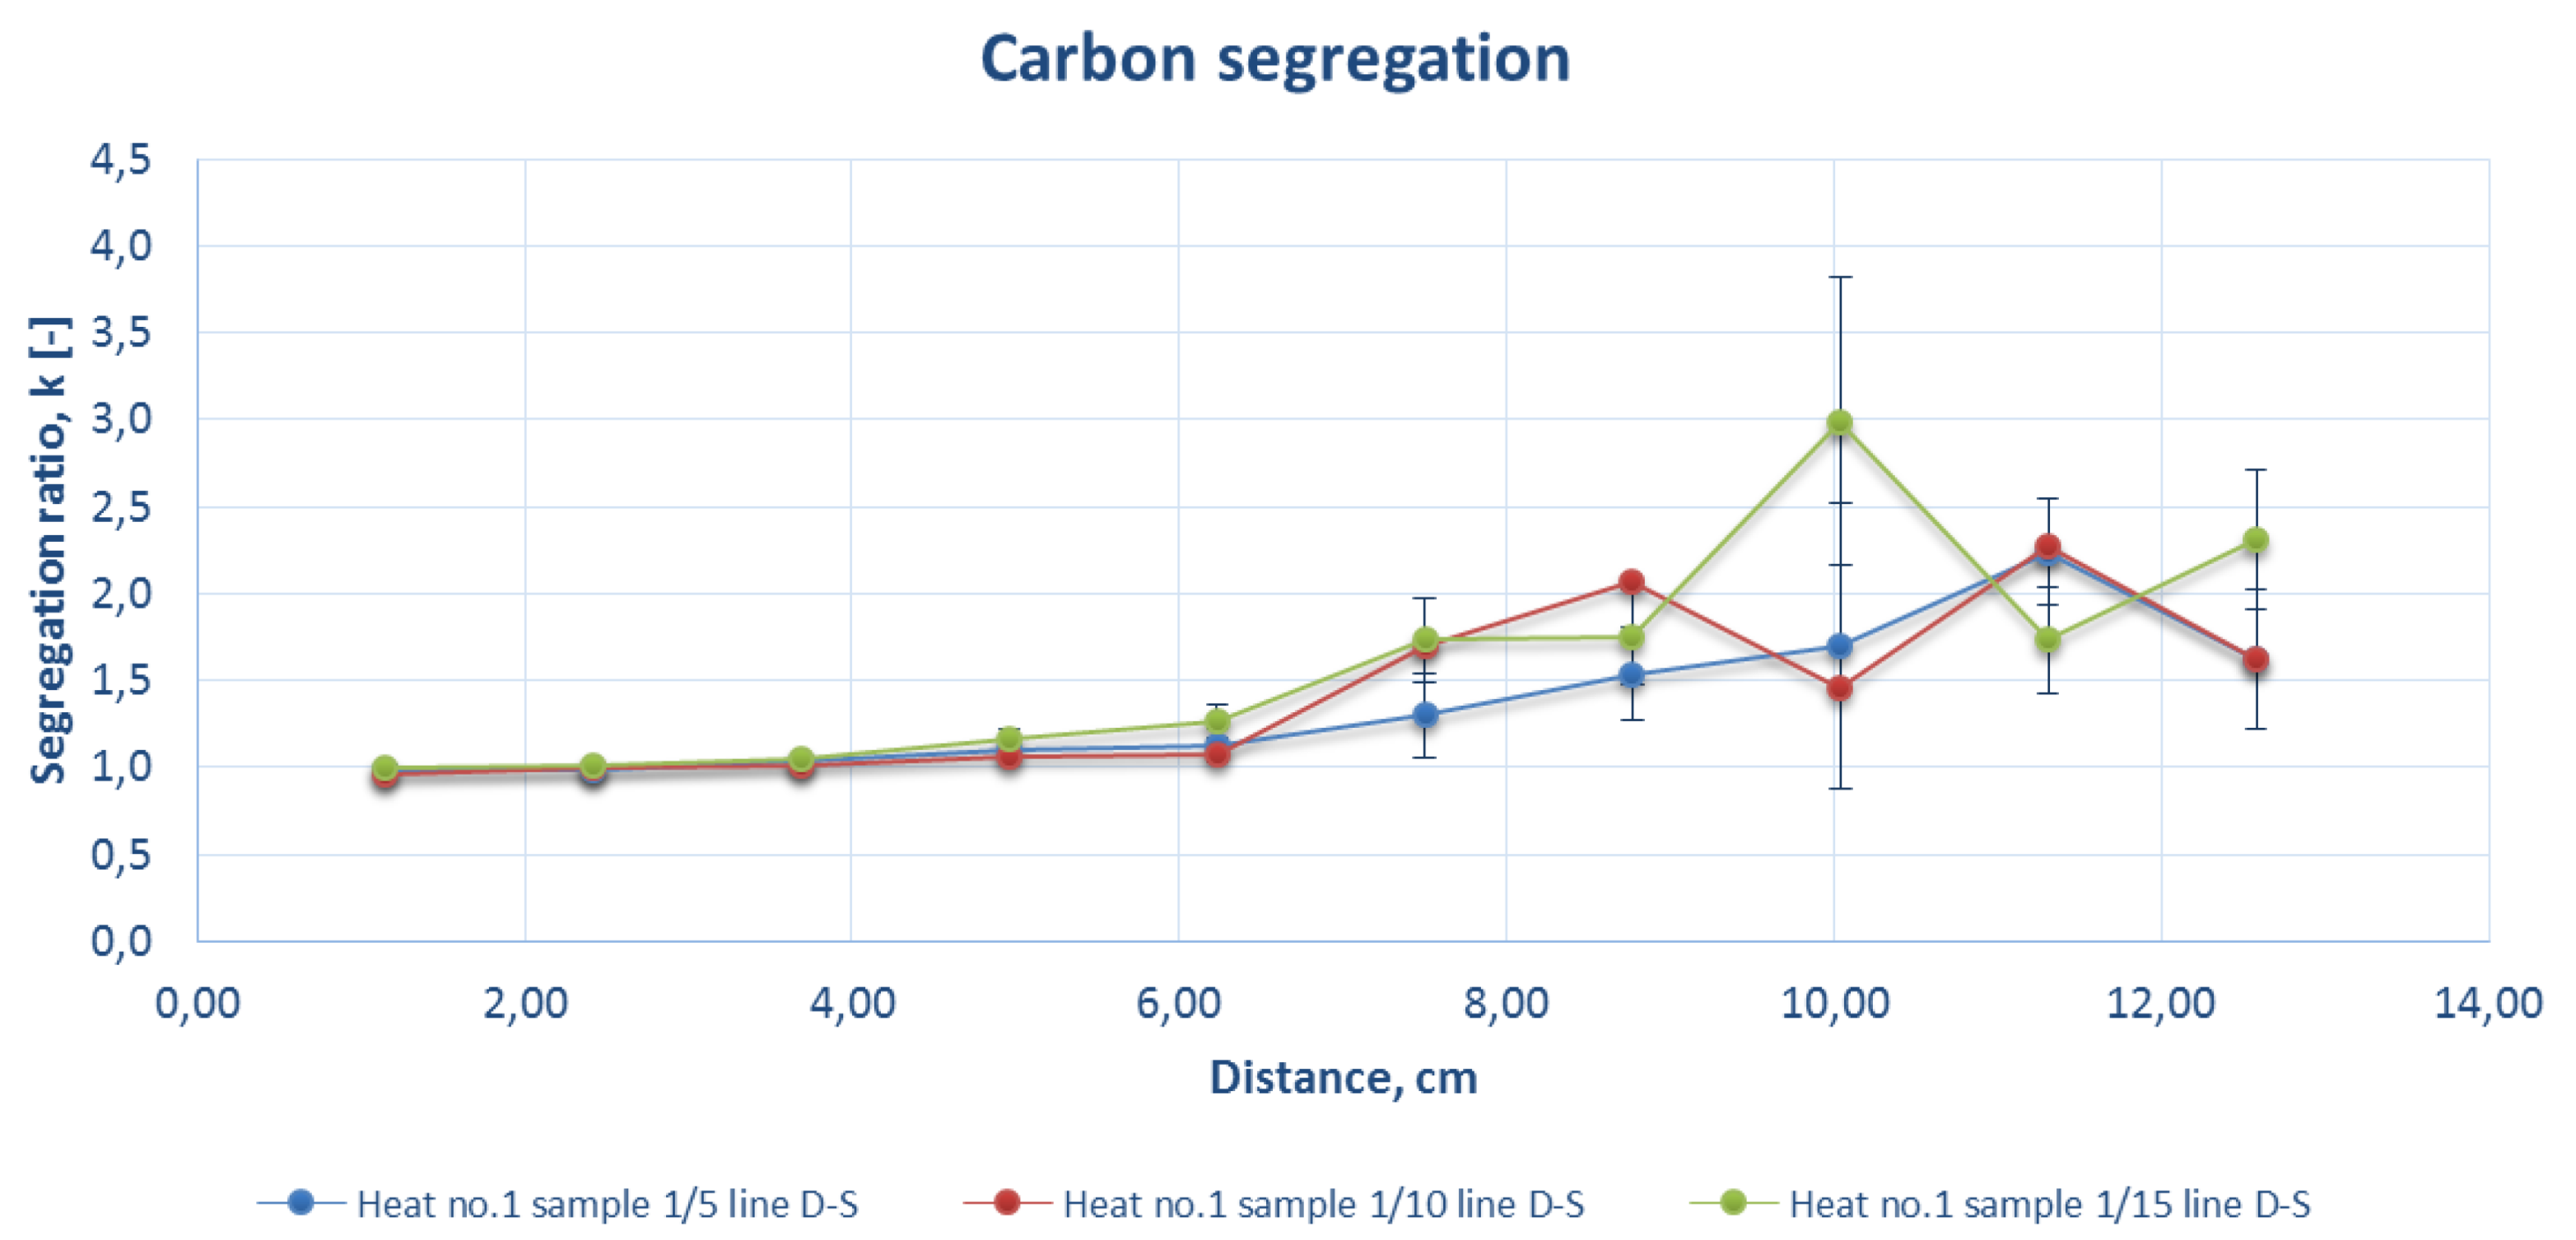
Figure 7.
Comparison of the carbon segregation ratio for the sample DS line of strand 1 at a casting speed of 1.8 m/min (heat number 1).
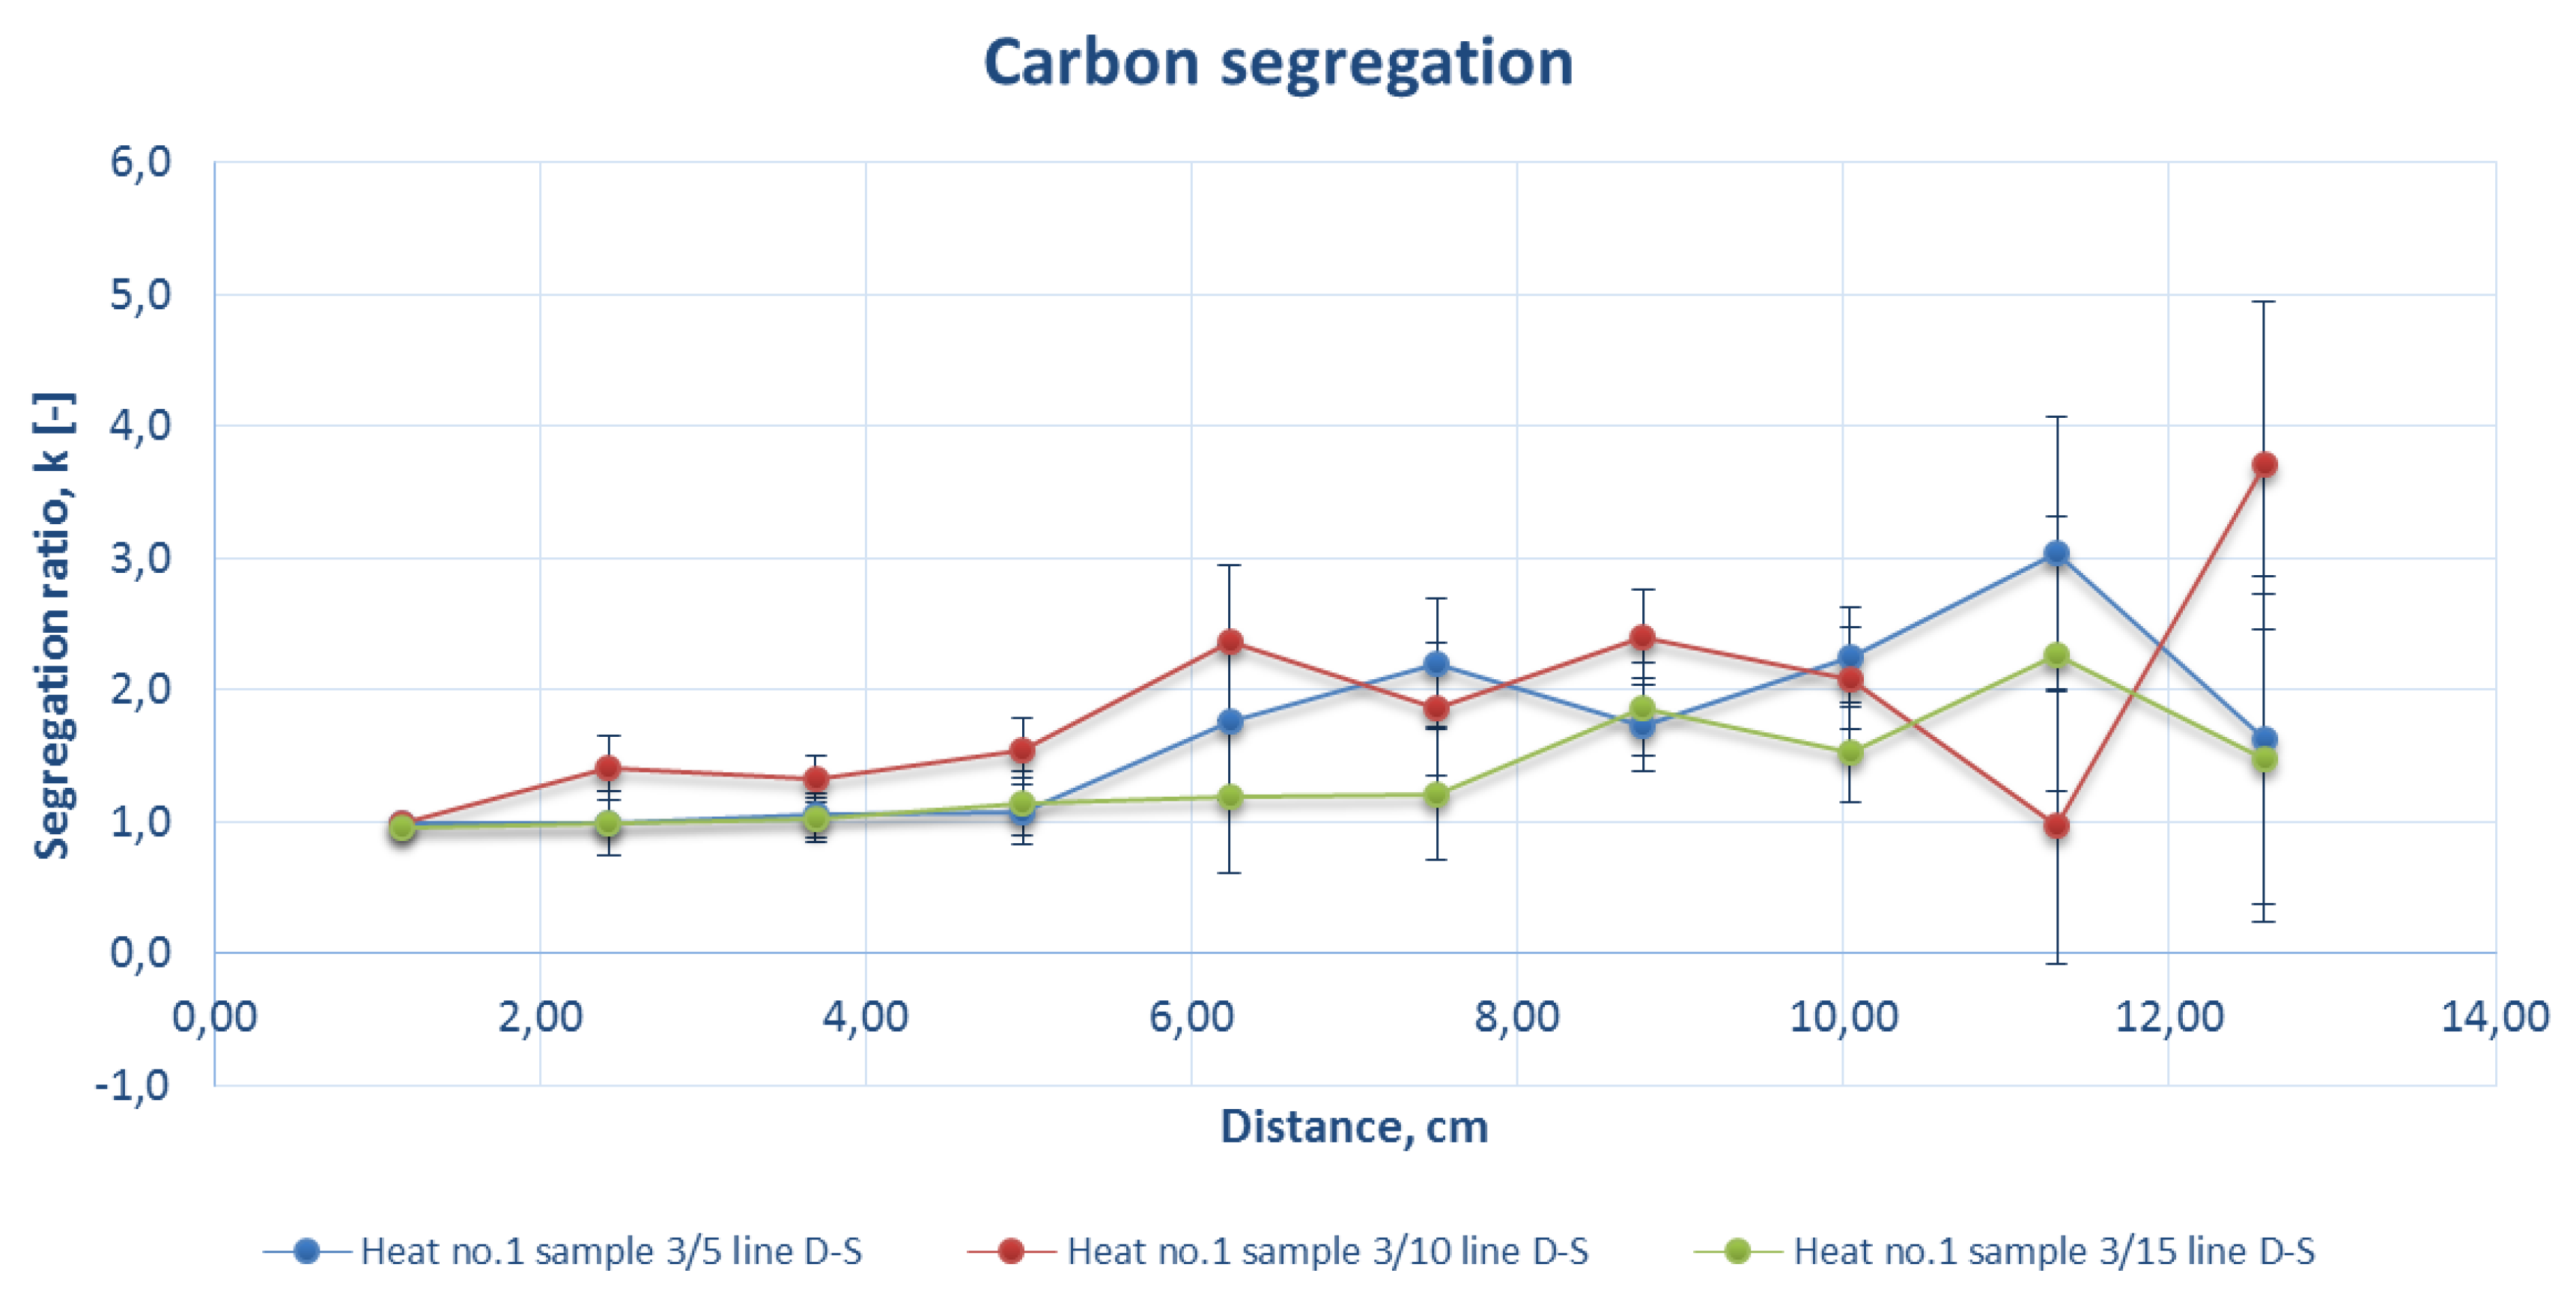
Figure 8.
Comparison of the carbon segregation ratio for the sample DS line of strand 3 at a casting speed of 1.8 m/min (heat number 1).
Figure 9.
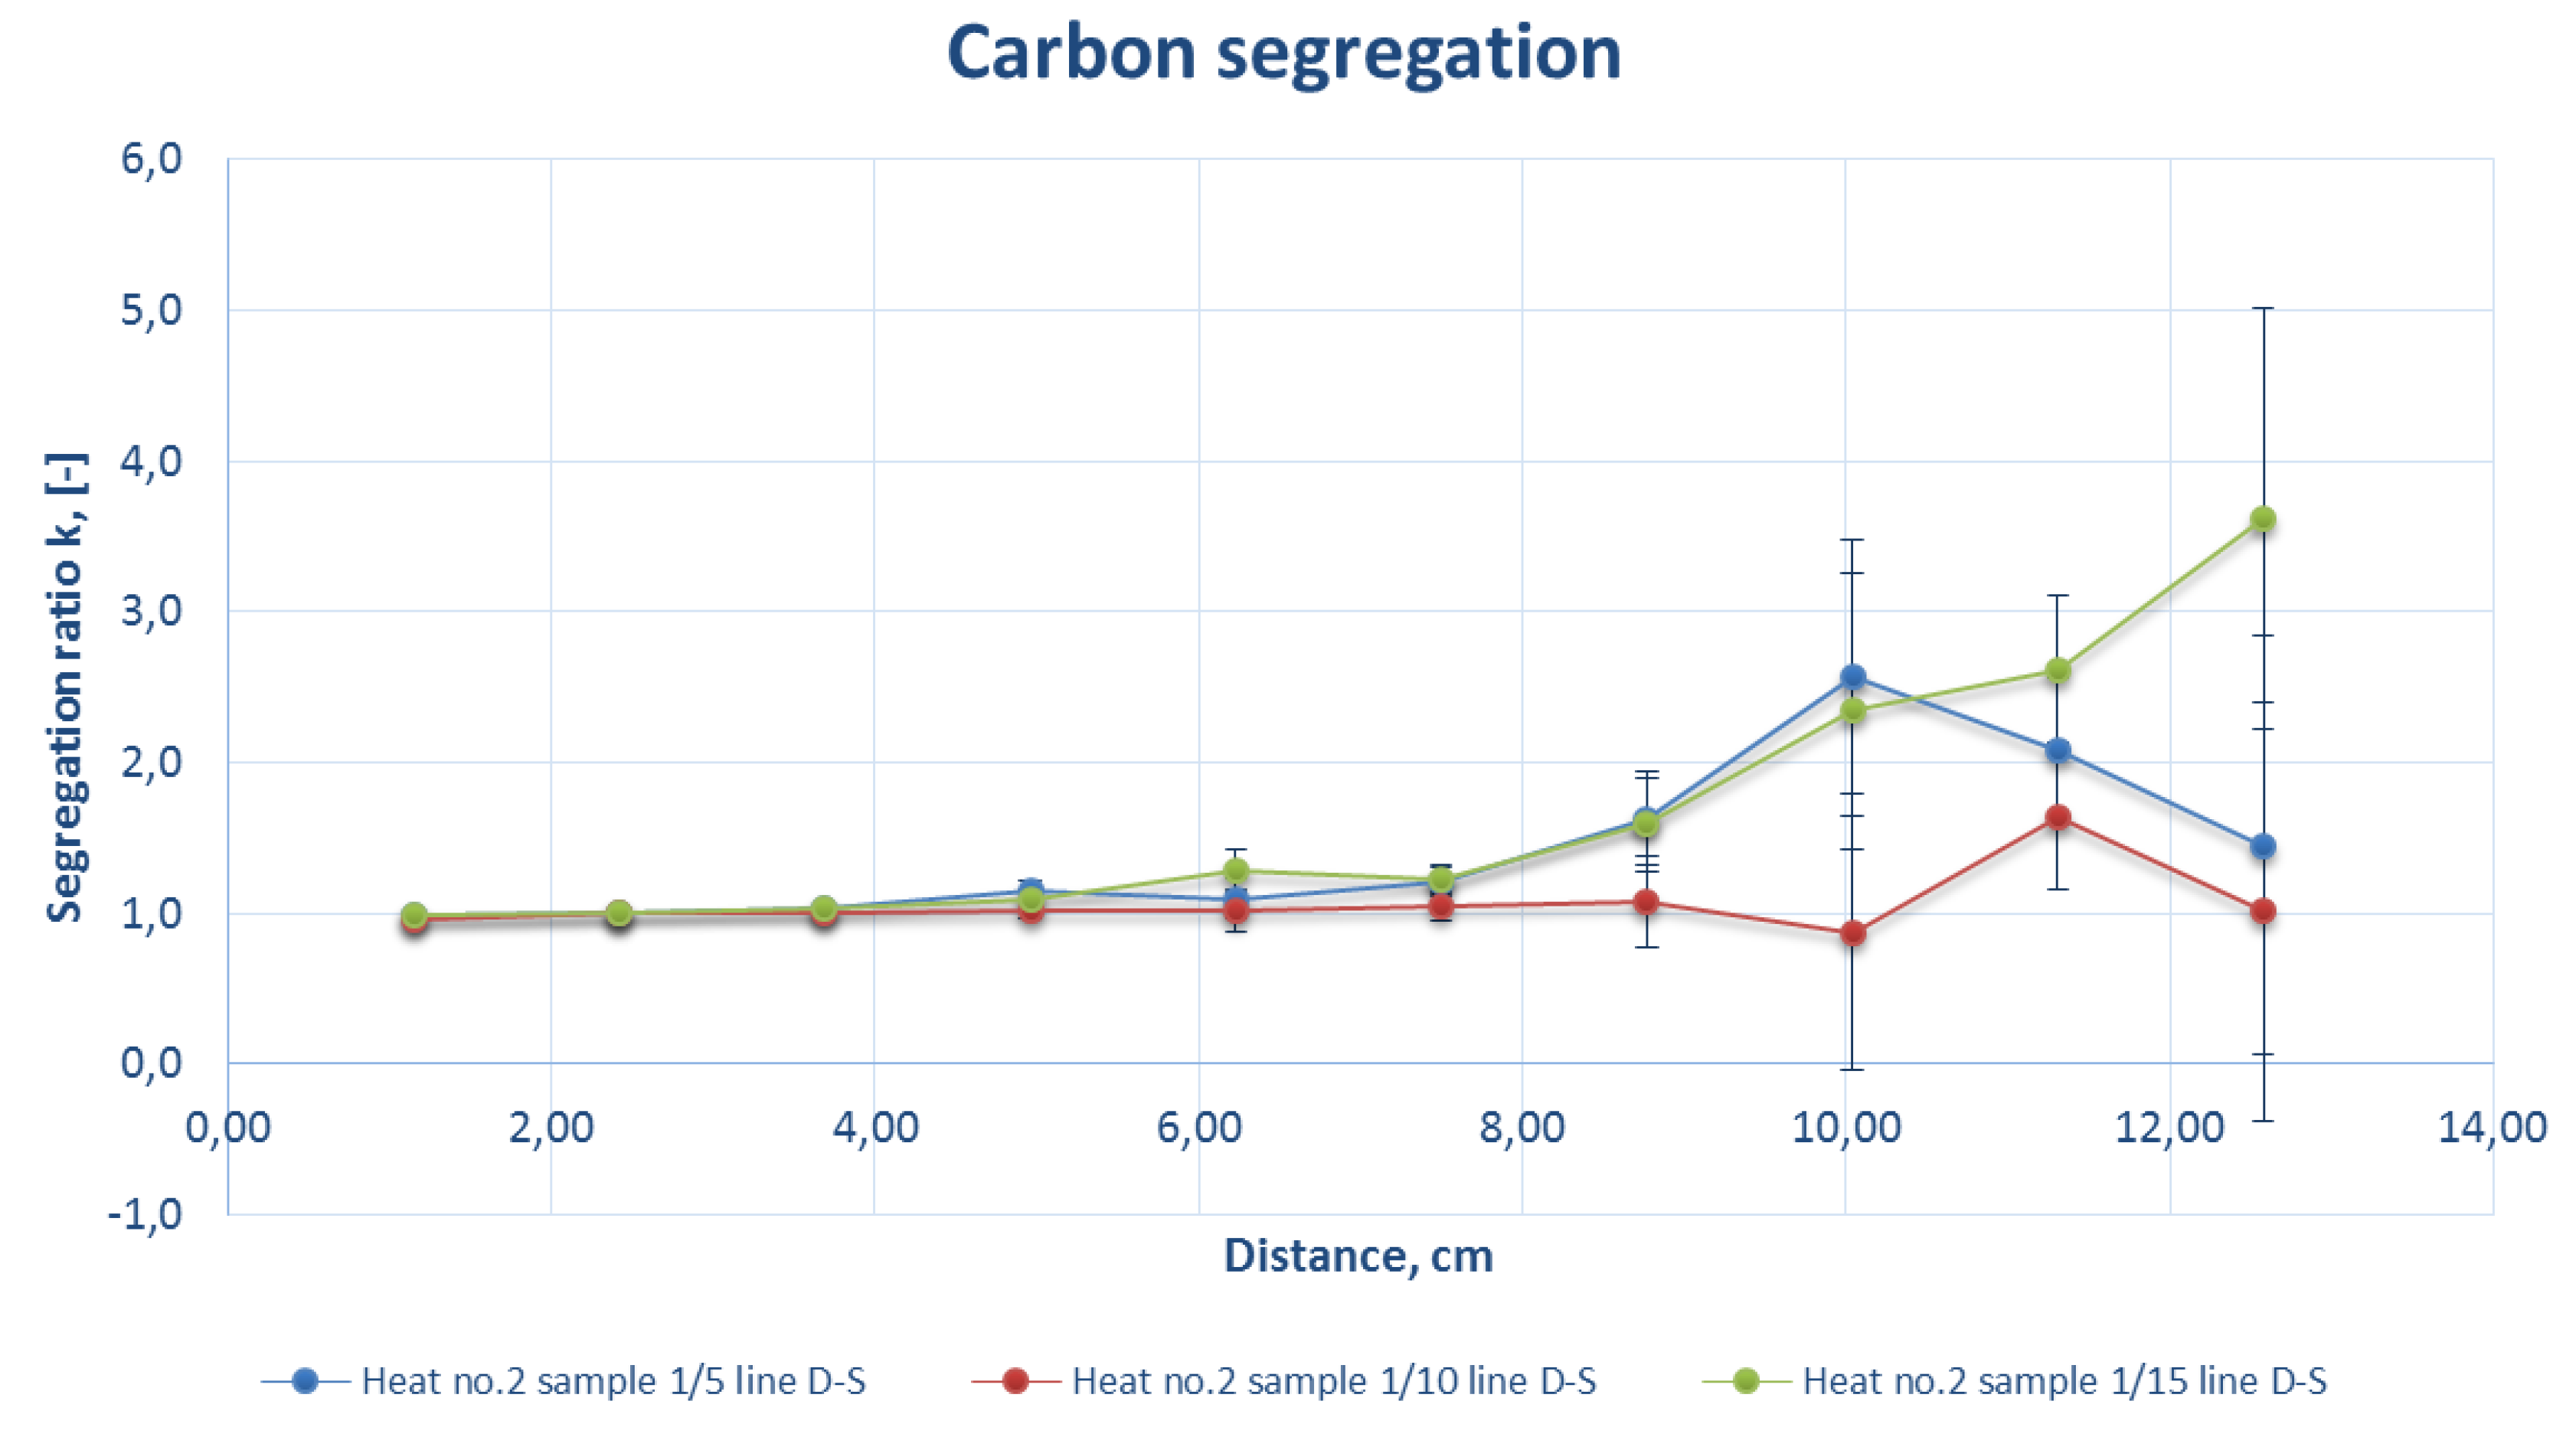
Comparison of the carbon segregation ratio for the sample DS line of strand 1 at a casting speed of 2.5 m/min (heat number 2).
Figure 10.
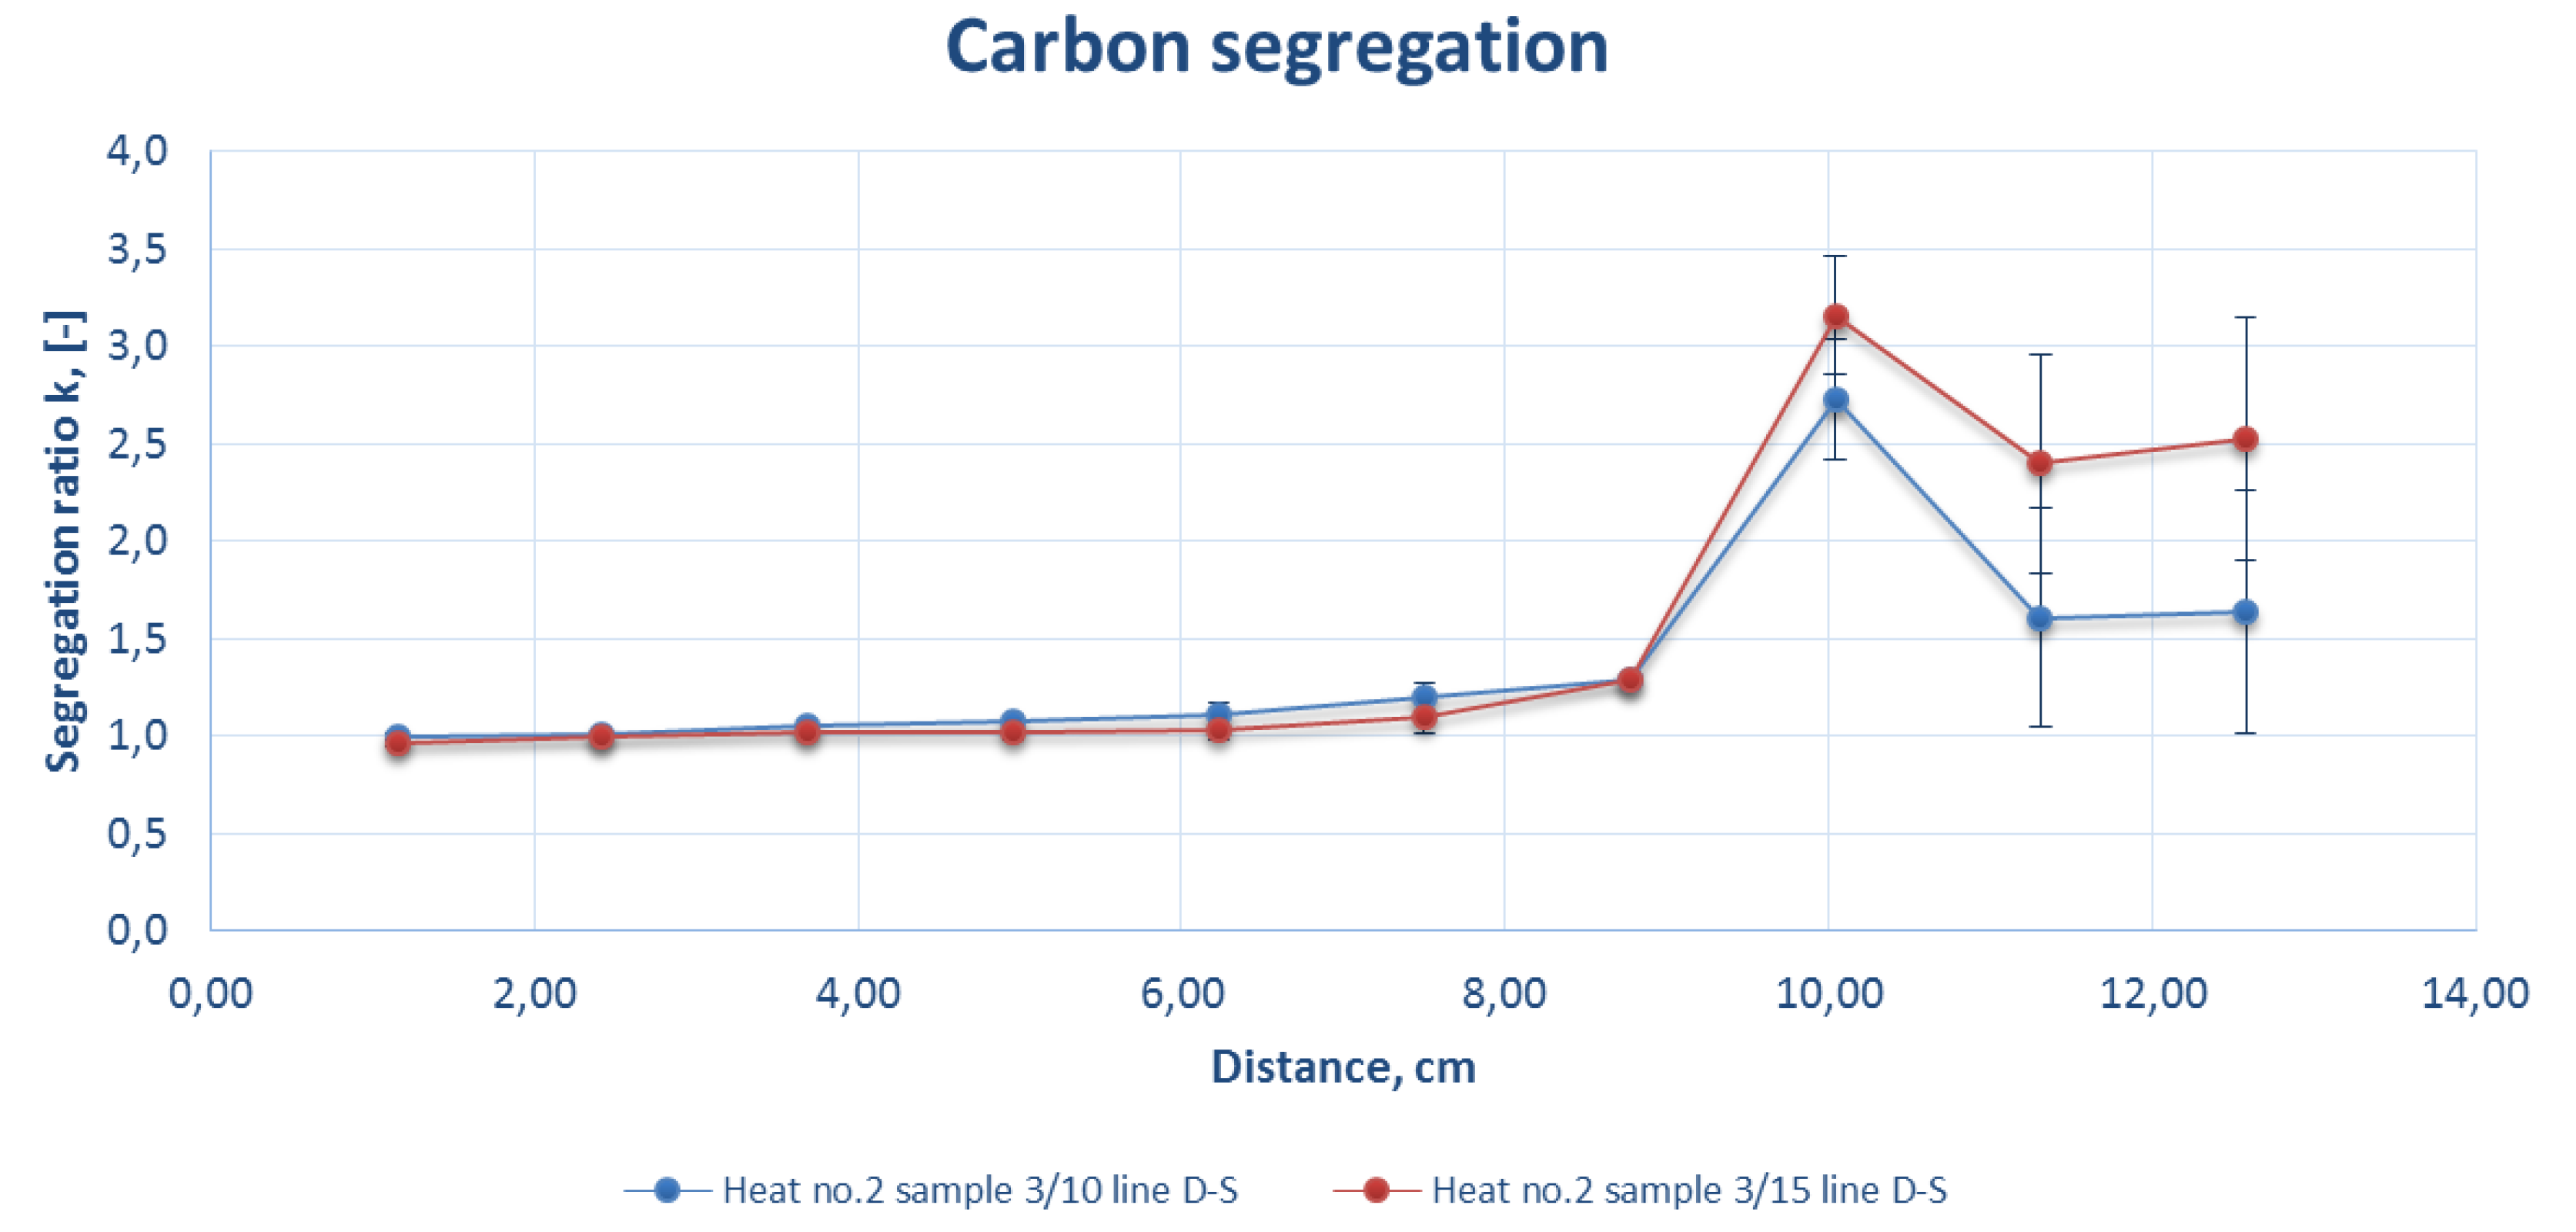
Comparison of the carbon segregation ratio for the sample DS line of strand 3 at a casting speed of 2.5 m/min (heat number 2).
Figure 11.
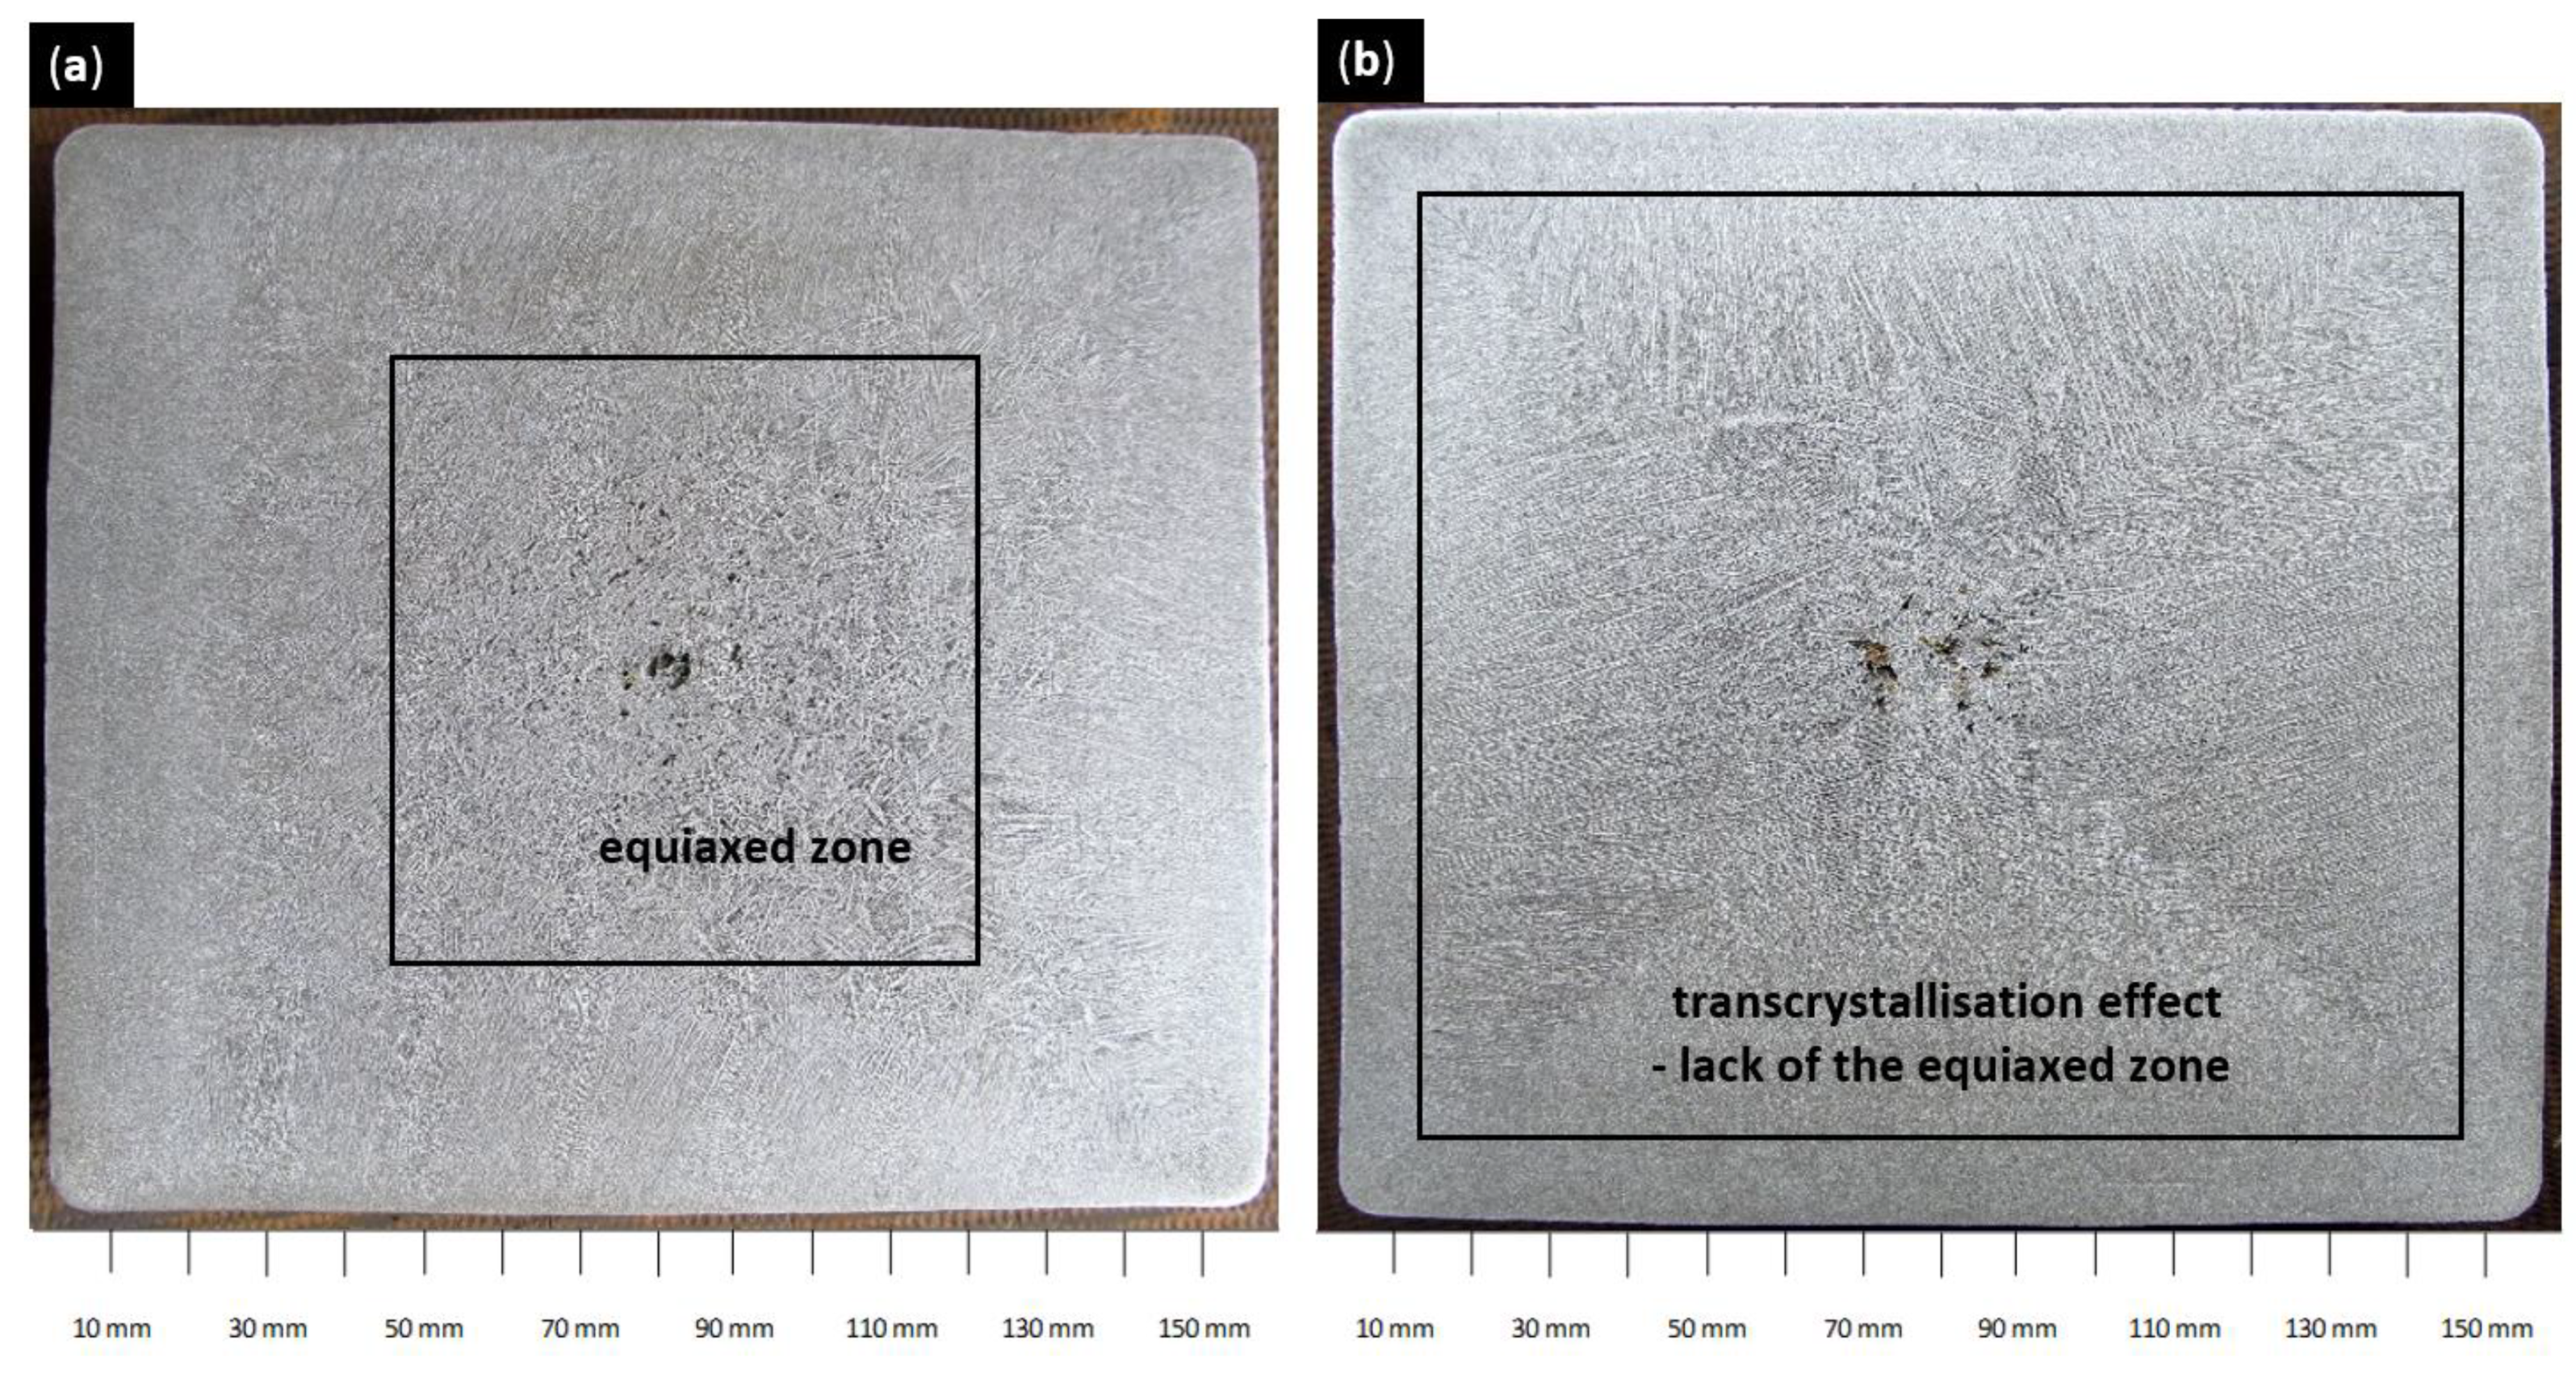
Cast strand structure (a) strand number 1, sample number 10, and casting speed 1.8 m/min; (b) strand number 1, sample number 10, and casting speed 2.5 m/min.
Table 1.
Summary of analyses of carbon content in random samples, performed with a LECO analyser and with a spark spectrometer (Spectrom.) for a casting speed of 1.8 m/min (Heat no.1).
| Sample Number | Type of the Measurement Method | Carbon Content [%]-DS Line-9 Measurement Points |
|---|
| | | 1 | 2 | 3 | 4 | 5 | 6 | 7 | 8 | 9 |
| 1/5 | LECO | 0.82 | 0.82 | 0.83 | 0.83 | 0.83 | 0.82 | 0.82 | 0.83 | 0.92 |
| Spectrom. | 0.77 | 0.78 | 0.81 | 0.86 | 0.88 | 1.02 | 1.20 | 1.33 | 1.75 |
| 1/10 | LECO | 0.83 | 0.83 | 0.85 | 0.84 | 0.87 | 0.86 | 0.84 | 0.84 | 0.95 |
| Spectrom. | 0.75 | 0.78 | 0.79 | 0.83 | 0.84 | 1.33 | 1.62 | 1.14 | 1.77 |
Table 2.
Summary of analyses of carbon content in random samples, performed with a LECO analyser and with a spark spectrometer (Spectrom.) for a casting speed of 2.5 m/min (Heat no.2).
| Sample Number | Type of the Measurement Method | Carbon Content [%]-DS Line-9 Measurement Points |
|---|
| | | 1 | 2 | 3 | 4 | 5 | 6 | 7 | 8 | 9 |
|---|
| 1/10 | LECO | 0.83 | 0.83 | 0.83 | 0.83 | 0.84 | 0.83 | 0.84 | 0.83 | 0.95 |
| Spectrom. | 0.75 | 0.78 | 0.79 | 0.80 | 0.79 | 0.82 | 0.85 | 0.68 | 1.28 |
| 1/15 | LECO | 0.82 | 0.82 | 0.81 | 0.82 | 0.82 | 0.82 | 0.82 | 0.73 | 1.16 |
| Spectrom. | 0.77 | 0.79 | 0.80 | 0.85 | 1.00 | 0.96 | 1.24 | 1.83 | 2.05 |
| 3/15 | LECO | 0.82 | 0.82 | 0.83 | 0.82 | 0.82 | 0.82 | 0.83 | 0.83 | 0.98 |
| Spectrom. | 0.76 | 0.78 | 0.80 | 0.80 | 0.81 | 0.85 | 1.01 | 2.47 | 1.88 |
Table 3.
Values of weights for calculation of the average carbon content in a sample for the strand 160 mm × 160 mm, at 9 measurement points.
| Weight Number | Values of Weights, [−] |
|---|
| w1 | 0.221453 |
| w2 | 0.193772 |
| w3 | 0.166090 |
| w4 | 0.138408 |
| w5 | 0.110727 |
| w6 | 0.083045 |
| w7 | 0.055363 |
| w8 | 0.027682 |
| w9 | 0.003460 |
Table 4.
Values of segregation ratios calculated for individual zones 1–9.
| Zone Number | ki, [−] |
|---|
| 1 | 0.8889 |
| 2 | 0.8955 |
| 3 | 0.9324 |
| 4 | 0.9975 |
| 5 | 1.0191 |
| 6 | 1.1742 |
| 7 | 1.3898 |
| 8 | 1.5322 |
| 9 | 2.0212 |
| Average | 1.205644 |
© 2020 by the authors. Licensee MDPI, Basel, Switzerland. This article is an open access article distributed under the terms and conditions of the Creative Commons Attribution (CC BY) license (http://creativecommons.org/licenses/by/4.0/).
