Article

In Vitro and In Vivo Study of Titanium Grade IV and Titanium Grade V Implants with Different Surface Treatments

by
Rosa-Maria Diaz-Sanchez
1,
Alvaro de-Paz-Carrion
1,
Maria-Angeles Serrera-Figallo
1,
Daniel Torres-Lagares
1,*,
Angel Barranco
2,
Juan-Rey León-Ramos
2 and
Jose-Luis Gutierrez-Perez
1
1
Dental School, University of Seville, 41009 Seville, Spain
2
Instituto de Ciencia de Materiales de Sevilla, Consejo Superior de Investigaciones Científicas (CSIC-US), 41092 Seville, Spain
*
Author to whom correspondence should be addressed.
Metals 2020, 10(4), 449; https://doi.org/10.3390/met10040449
Submission received: 2 March 2020 / Revised: 25 March 2020 / Accepted: 26 March 2020 / Published: 28 March 2020

Abstract

:
The aim of our study is to evaluate different implant surface treatments using TiIV and TiV in in vitro and in vivo studies. An in vitro study was established comprising four study groups with treated and untreated TiIV titanium discs (TiIVT and TiIVNT) and treated and untreated TiV titanium discs (TiVT and TiVNT). The surface treatment consisted in a grit blasting treatment with alumina and double acid passivation to modify surface roughness. The surface chemical composition and the surface microstructure of the samples were analyzed. The titanium discs were subjected to cell cultures to determine cell adhesion and proliferation of osteoblasts on them. The in vivo study was carried out on the tibia of three New Zealand rabbits in which 18 implants divided into three experimental groups were placed (TiIVT, TiIVNT, and TiVT). Micro-computed tomography (micro-CT) was performed to determine bone density around the implants. The results showed that cell culture had minor adhesion and cell proliferation in TiIVT and TiVT within the first 6 and 24 h. However, no differences were found after 48 h. No statistically significant differences were found in the in vivo micro-CT and histological study; however, there was a positive trend in bone formation in the groups with a treated surface. Conclusions: All groups showed a similar response to in vitro cell proliferation cultures after 48 h. No statistically significant differences were found in the in vivo micro-CT and histological study.

1. Introduction

Dental implants are a widely recognised treatment for replacing missing teeth with implant-supported restorations for partially and totally edentulous patients. Implants have exceeded 95–98% in long-term success rates according to clinical studies [1,2,3,4,5,6,7].
Compatibility between bone and titanium was first mooted in 1940 after the research of Bothe et al [6,7,8]. They observed that titanium was not only well tolerated but allowing bone growth in contact with it. Branemark et al. observed in 1969 [9] that titanium created a direct interface between bone and metal, which was called osseointegration. They also suggested that osseointegration depended on the material, implant design, and processing, and the bone that received the implant or the loading [10].
Nowadays, there are 39 different titanium alloys that can be used in contact with human bone according to the American Society for Testing and Materials [11]. These 39 different titanium alloys present different mechanical and physical properties in terms of yield strength, ultimate tensile strength, and fatigue strength [12], which can modify the probability of dental implant survival [13].
Titanium grade IV (TiIV) and titanium grade V (TiV) have mainly been used in dental applications; however, no consensus in the literature has been found regarding their biological properties. The osseointegration of titanium grade IV and V are largely supported by the literature [7,8]. One of the principal alloys of titanium is Ti6Al4V, which improves the tensile strength and elastic modulus with regard to metallic titanium, being used in cases where the material is subjected to high occlusal loads [14]. However, several studies have pointed to problems of corrosion [15], toxicity, and biocompatibility related to aluminum and vanadium [16]. Therefore, the best alternatives for dental implants are titanium metal implants with titanium oxide coatings, which turn the material into a biomineral, as well as promoting osseointegration and biocompatibility.
In 1998, Johansson et al. published an in vitro and an in vivo study comparing commercially pure (c.p.) titanium with titanium V (Ti-6Al-4V) with no significant differences; however, the tendency showed that the mechanical properties of c. p. titanium after one year were better. In recent times, c.p. titanium grade IV and grade V have gained popularity versus other alloys [17,18].
To obtain biocompatible surfaces, it is necessary to study the parameters of the surface that influence host tissue response, amongst which are wettability, roughness, or chemical composition [19].
The aim of our study was to evaluate two different implant surfaces using TiIV and TiV in an in vitro and an in vivo study. Characterization of the materials using X-ray photoelectron spectroscopy and cell cultures has been carried out to conduct the in vitro surface evaluation study. The in vivo study employed a comparison of bone density using micro-computed tomography and a histological study on animal experimentation specimens.

2. Materials and Methods

2.1. In Vitro Study

2.1.1. Preparation of the Titanium Disc

Oxtein Iberia implants were used to make the titanium discs. For the in vitro study, four groups were established to study titanium discs made of treated and untreated TiIV (TiIVT and TiIVNT) and treated and untreated TiV (TiVT and TiVNT). In previous studies published by our group, a greater description of the surface used and the control material used can be found [20].
The grade IV titanium discs were 1 cm in diameter and 0.2 cm thick, and the grade V titanium discs were 1.5 cm in diameter and 0.2 cm thick. For each kind of disc, we differentiate two groups; the first group did not have any surface modification, the samples came directly from the cutting of the implant Oxtein L6 in TiIV and from Oxtein L35 in TiV. The second surfaces were treated using grit blasting with alumina and double acid passivation to modify the surface roughness and decontamination with Argon plasma.
All the discs were sterilized with gamma rays, and they were packed individually.

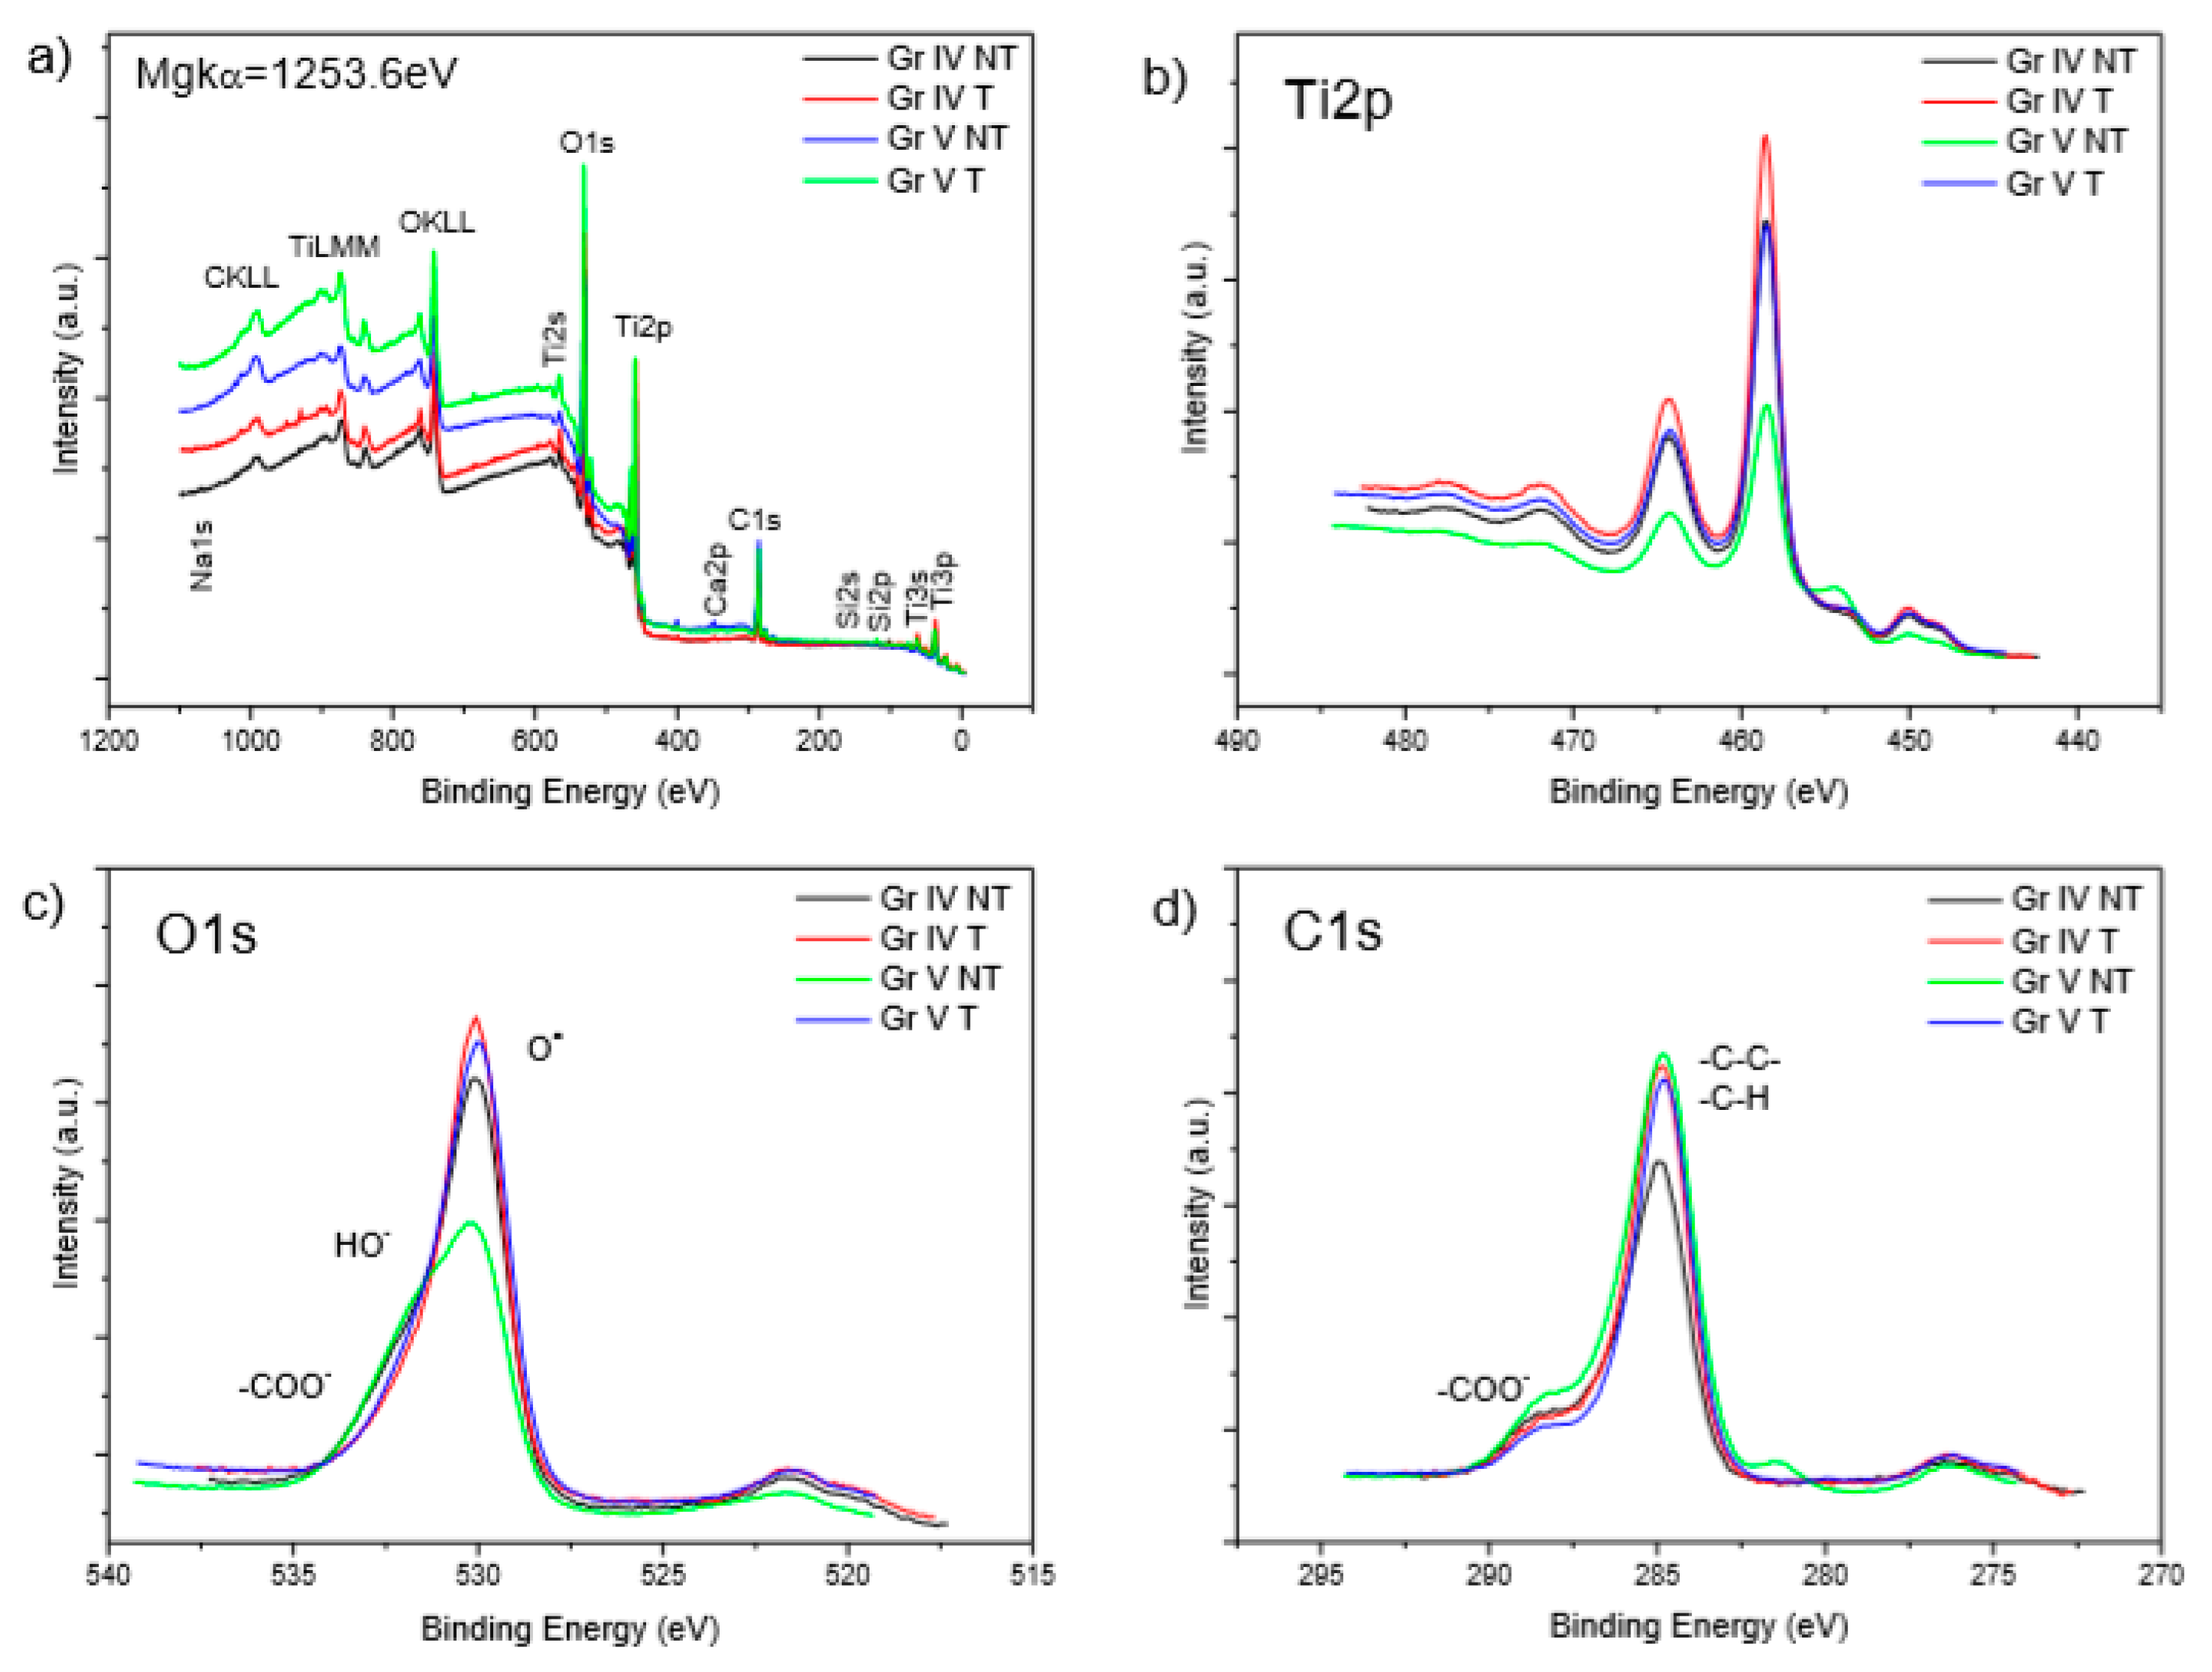
2.1.2. Material Characterizations

The surface chemical composition of the discs was analyzed by X-ray photoelectron spectroscopy (XPS) using an ESCALAB 210 spectrometer (Thermo Fisher Scientific, Waltham, MA, USA), operating with an acceleration voltage of 11 Kv and a current of 20 mA at a constant pass energy of 20 eV. Non-monochromatized Mg Kα radiation was used as the excitation source. The surface concentrations in atomic percentages were determined quantitatively from the area of the main photoemission peaks (Ti2p, C1s, O1s, Ca2p, N1s, Na1s, Al2p, Si2p, F1s, P2p, and S2p). The peak areas were corrected using electron escape depth, spectrometer transmission, and photoelectron cross-section.
The microstructure of the films was determined using scanning electron microscopy. The equipment employed to obtain high-resolution SEM images was Hitachi S4800 SEM-FEG (Hitachi, Tokyo, Japan), which was equipped with secondary and back-scattered electron detectors, using different acceleration voltages (1–5 kV). Analysis of the profile by was performed with the AFM Technique (Pico Plus Molecular Imaging; Molecular Imaging, Tempe, AZ, USA) from the samples that provided the surface roughness data.

2.1.3. In Vitro Cell Culture

The assays were conducted using an MG-63 human osteoblast line acquired from the University of Granada Centre for Scientific Instrumentation (CIC).
Prior to carrying out the tests, the cell seeding protocol on the discs and the quantification and staining procedure were perfected. It was decided to carry out the sowing on the discs with a small volume for 4 h and then fill the wells up to the usual volume. It was resolved to plant 20,000 cells in the different titanium discs [21].
To determine osteoblast adhesion and proliferation on titanium discs, osteoblast cultures were performed on the four titanium discs with different modifications, in triplicate, to determine the adhesion and the proliferation at 6 h and at 24 and 48 h. Cell viability was analyzed by the WST-1 metabolic test (Hoffmann-La Roche, Basel, Switzerland). To observe them, it is necessary to fix the cells with 70% ethanol for 5 min.
The mitochondrial energy balance of the osteoblasts adhering to the discs was determined by osteoblast cultures in the four small discs with different modifications (in triplicate) using a MitoProbeMT JC-1 Assay Kit (Thermo Fisher Scientific, Waltham, MA, USA). At 24 h, micrographs were made of the cultures marked with JC-1 for red/green fluorescence, which were taken with an Axio Imager Z1 fluorescence microscope (Zeiss, Oberkochen, Germany). After labeling the cultures with JC-1, it was quantified by flow cytometry with the green and red filters in an FC500MPL cytometer (Beckman Coulter Inc., Brea, CA, USA). The measurement of the red/green ratio was established as a measure of mitochondrial potential [22].
For the determination of osteogenesis and the morphology of the osteoblastic cells adhering to the discs, we carried out a label crop with phalloidin-TRITC (Sigma-Aldrich, San Luis, MI, USA), which is a fluorescent phallotoxin that identifies F-actin filaments. DAPI (4′,6-diamidino-2-phenylindole) is used to stain the nuclear and chromosome counterstain emitting blue fluorescence. The cultures were analyzed at 24 h. Photomicrographs of red and blue fluorescence were taken with an Axio Imager Z1 (Zeiss, Oberkochen, Germany) fluorescence microscope. Cell size was measured using ImageJ software [23,24].

2.2. In Vivo Study

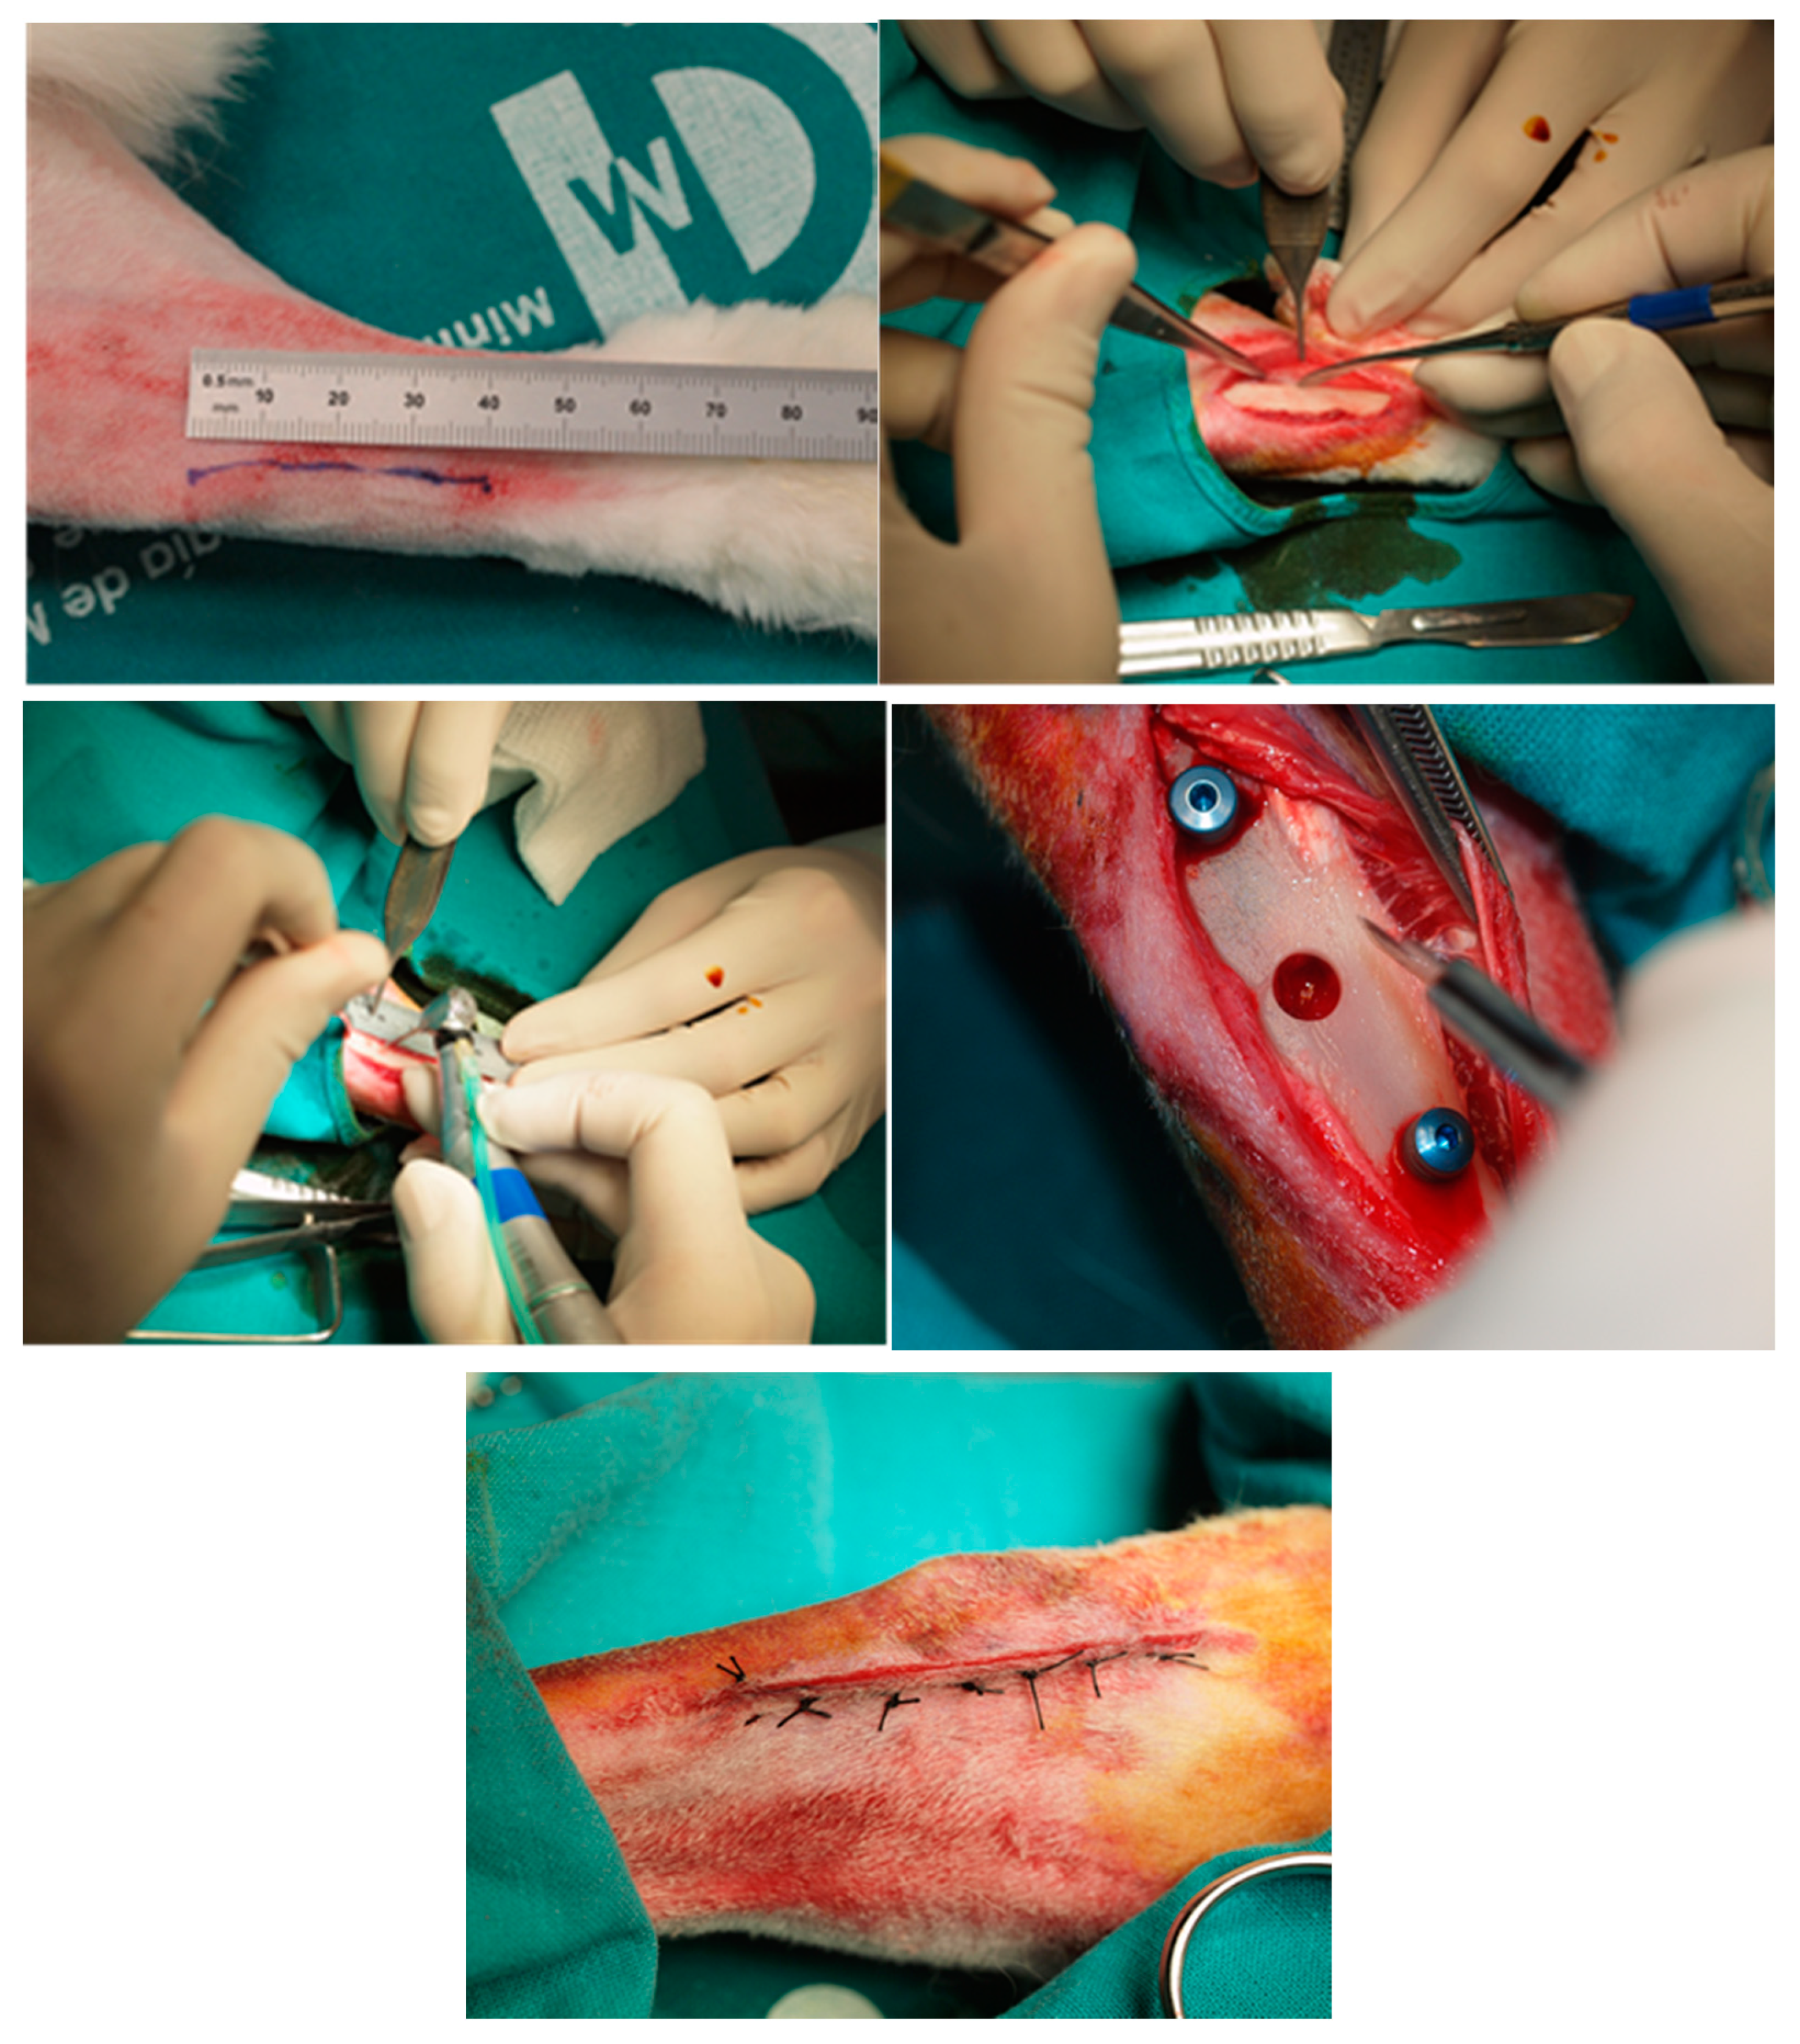
2.2.1. Animal Experimentation Specimens and Surgical Procedure

The in vivo study was carried out on the tibia of three white New Zealand rabbits with identical characteristics (age: 6 months; weight: 3.5–4 kg; sex: male). These were chosen for the study and fed daily with rabbit-maintenance Harlan-Tecklad Lab Animal Diets (2030).
The surgery was carried out at the Jesús Usón Minimally Invasive Surgery Centre (JUMISC, Cáceres, Spain). The experiment was designed following the guidelines issued by the US National Institute of Health (NIH) and European Directive 86/609/EEC regarding the care and use of animals for experimentation. Strict compliance was also maintained in this study with European Directive 2010/63/EU on the protection of animals used for scientific purposes and with all local legislation and regulations. Approval was given for this research by the Ethics Committee (Ref. 007/17, approved 03/23/2017) of the Jesús Usón Minimally Invasive Surgery Centre (JUMISC, Cáceres, Spain). For ethical reasons, the minimum number of animals was used as required by law [25]. Comparable models have been published in respect of histological and animal experimentation methods [26].
After immobilization, the animals’ vital signs were monitored. Intravenous midazolam (0.25 mg/kg) and propofol (5 mg/kg) were employed for the induction of anaesthesia. Maintenance was achieved by the animals inhaling 2.8% sevoflurane gas. Ketorolac (1.5 mg/kg) and tramadol (3 mg/kg) were administered as analgesia.
Having sedated and prepared the rabbits, an incision of 30 mm in length was made with a No. 15 scalpel blade into the inner surface of the tibia. A Pritchard periosteotome was employed to displace the epithelial, connective, and muscular tissues. A lavage of the tibia surface was performed using a sterile saline solution, and aspiration was maintained.
Eighteen [18] implants were placed in the six tibiae of three New Zealand rabbits. All implants were similar; the diameter was 3.75 mm, and the length 8.5 mm. Implants were placed 1.5 mm supracrestally with 8 mm of separation between them. The size of the implants was selected among the available implants, always ensuring that their diameter allowed placement within the tibia of the experimental animal (4 mm). The length (8 mm) was selected because it was one millimeter greater than the diameter of the tibia of the experimental animal, which ensured good primary stability.
Oxtein L6 was the implant of choice to constitute the TiIVT group; it is a cylindrical, self-tapping, external connection with a treated surface. To establish the TiIVNT group, the company manufactured these implants without the final surface treatment to make an accurate comparison of the effectiveness of this treatment. Oxtein L35 was used to constitute the TiVT group; it is the same implant with internal connection but made in TiV and employing the same surface treatment.
The three implant systems were placed adopting the same surgical protocol, which follows the standard protocol for implant placement established by Oxtein Iberia. The final drill in all the implant placements was 3.6 mm in diameter (for a 3.75 diameter implant). The maximum implant stability was 20 N in all implants. The location of implant placement of the different study groups in relation to the bone metaphysis was alternated so that variations in blood supply and other anatomical characteristics were similarly distributed in all study groups.
Absorbable sutures were applied on the following planes: periosteal (4/0), sub-epidermal (4/0), and skin (2/0). Keeping as near as possible to the edge, simple stitches were inserted. By applying a sterile saline solution, it was possible to maintain the wound in a clean condition.
Anti-inflammatory analgesia in the form of buprenorphine 0.05 mg/kg and carprofen 1 mL/12.5 kg was administered. Two months after surgery, the animals were sacrificed using an intravenous dose of potassium chloride solution. The complete surgery is shown in Figure 1.

2.2.2. Bone Density (BoneJ) Comparison

Micro-computed tomography (micro-CT) was performed to determine bone density around the implants [27]. Micro-computed tomography (μ-CT) is a CT of small objects having very high-quality spatial resolution, and it has become the gold standard in bone microstructural measurement and bone morphometry.
Bone density (BoneJ) comparison was carried out using the mean of the bone density in the area in contact with the implants, and it was assessed by micro-computed tomography. Using the same CT data, higher quality 1 cm3 sub-region reconstructions can be generated focusing on each screw region with 201 × 201 × 201 pixel resolution, and three high-resolution reconstructions are generated for each original acquisition. The strong artefacts along the screw axis make it impossible to analyze the bone structure in these positions; however, it is possible to separate high-density titanium and bone by selecting a threshold value in ImageJ/FIJI, enabling changes in bone density in regions adjacent to implant structures to be measured where bone growth is often visible. Therefore, ImageJ bone image analysis can be employed for the evaluation of different bone properties by means of a series of BoneJ plugins. The BoneJ plugin offers free, open-source tools for assessing trabecular geometry and undertaking whole bone shape analysis [28].
The comparison between different implants is made in respect to different parameters:
Bone Surface Area (BS), which involves measuring the surface of a structure to characterize 3D objects such as trabecular bone and can be calculated by the construction of a triangular surface mesh using the marching cubes algorithm, thus computing the sum of the triangular areas making up the mesh to obtain the total bone surface area [29,30].
Trabecular Thickness (TBTH) and Max. Trabecular thickness. Trabecular bone microarchitecture is calculated by a plugin based on Bob Dougherty’s Local Thickness Plugin, which assesses the mean and the standard deviation directly from the pixel values in the resulting thickness map. These parameters are used as predictors for the resistance to fracture and the healing process [31,32].
Bone Volume, Total Volume, and the Bone Volume Fraction (BV/TV). These parameters are obtained from a simple voxel-counting method or from volumetric marching cubes (VOMACs). This analysis may enhance our capacity to predict resistance to fracture due to the correlation with bone mechanical properties and quantity [33,34].
Connectivity (Conn). It is an index derived from the Euler number as the assessment method for determining the number of (i) objects, (ii) marrow cavities completely surrounded by bone, and (iii) connections that can be broken before the object fractures into two parts [35,36].
Number of branches (branches), the number of (i) junctions (junctions), (ii) end-point voxels (voxels), (iii) junction voxels (voxels), average branch length (pixels), as well as the number of triple points (points), quadruple points and the maximum branch length (pixels).
There are three stages involved in obtaining the information from the micro-CT analysis process. The first one is based on the projection of images from different angles, which is known as “the physical scan”. Then, using an algorithm, multiple cross-sectional images that make up the 3D image called the “dataset” are reconstructed, and the last stage consists of obtaining quantitative information from a specific part of that image dataset. The latest generation of micro-CT systems are able to produce images whose voxel size is 0.5 µm with a spatial resolution of less than 2 µm [37]. Voxels are the units of scan volume obtained from a tomographic reconstruction, and if they belong to micro-CT images, they are deemed to be isotropic voxels. In a skeleton image, all pixels/voxels are tagged to count all the junctions, triple and quadruple points, and branches, measuring their average and maximum length. Skeleton images can be produced by means of micro-CT scanners at a maximum nominal resolution (minimum image pixel size of less than 10 microns). Voxels are classified into three different categories depending on 26 neighbors: end-point voxels when there are less than 2 neighbors, junction voxels when there are more than 2 neighbors, and slab voxels if they have exactly 2 neighbors [38].

2.2.3. Histological Sample Processing

Tibia blocks from the samples were stored in a 5% formaldehyde solution (pH 7). The processing of samples followed the protocol previously described [39]. The thickness of the histological sections was 100 microns. Histological staining was carried out using a Merck Toluidine Blue-Merck (Darmstadt, Germany). The percentage of new bone formation was assessed using a metachromatic dye. A 1% toluidine blue (TB) solution with a pH of 3.6 was selected and adjusted with HCl 1 N. The samples, after being exposed to the dye for 10 min at RT, were rinsed with distilled water and air-dried. To visualize the mineralized bone, the von Kossa (VK) silver nitrate technique (Sigma-Aldrich Chemical Co., Poole, UK) was applied.

2.3. Statistical Analysis

Means and standard deviations (SD) were calculated. Intra-examiner reliability was evaluated using the Kappa test. Given that the Kolmogorov–Smirnov test demonstrated that data distribution was not normal, in order to make post hoc comparisons, the Kruskal–Wallis test was run. The significance level was set in advance at p ˂ 0.05 Statview F 4.5 Macintosh software (Abacus Concepts, Berkeley, CA, USA) was employed for analytical purposes. All the statistical probes applied in this study met the requirements for oral and dental research [40,41].

3. Results

3.1. Material Characterisations

Surface composition analysis employing XPS spectroscopy showed that grade IV and V samples have a layer of titanium oxide on the surface with carbon species bound to oxygen (-COO-) and hydroxides (OH-). A greater intensity is observed in the titanium and oxygen peaks of the TiIVNT sample, with a lower intensity in these peaks in the TiVNT sample and a higher intensity in the carbon peak, which indicates the presence of a greater quantity of carbon species in the latter sample. Moreover, the TiVNT sample demonstrates that the carbon species are attached to the titanium, being in the region corresponding to TiC according to the references.
Figure 2a shows the general spectrum of TiIVNT and TiIVT in which the presence of Na, C, Ti, O, Ca, and Si can be observed for their main and secondary peaks as well as their Auger peaks. In the cases of TiVNT and TiVT, the main peaks of the species of Na, C, Ti, O, N, Ca, Si, S, P, and Al can be seen. Figure 2b shows two titanium 2p peaks; of these, Ti2p3/2 is the more intense one, at a binding energy of 458.5 eV, indicating the presence of Ti + 4, which is coherent with the passive TiO2 layer. Then, there is also a secondary one with a lower intensity at 462.5 eV and a satellite between 445 and 452 eV. In addition, in TiVNT a peak between 452 and 456 eV (454.4 eV) is observed, which is attributable to the presence of Ti-C bonds. In Figure 2c, the region corresponding to the 1s oxygen peak is encountered whose highest energy peak is at 530 eV, corresponding to the titanium oxide bond (Ti-O) and in the Ti VNT sample (green line), a shoulder is observed at the main peak between 531 and 533 eV corresponding to the double and simple oxygen bonds with carbon, whose satellites presented between 517.5 and 523 eV. Figure 2d indicates the region where the peak corresponding to C1s may be found, with its main peak at 284.9 eV due to simple C-C and C-H links and its satellite between 278 and 275 eV. Together with the main peak, a shoulder appears at 288.6 eV corresponding to the species -COO-. Additionally, in the untreated grade V sample (Ti VNT) (green line), a signal is observed between 282.5 and 280 eV (281.4 eV), possibly corresponding to the TiC 28 species.
All the element concentrations can be found in Table 1.
In the topographic analysis performed, the values obtained from the roughness parameters evaluated on 12 points in samples are as follows: TiIVNT (Ra: 0.193 μm; Rq: 0.241 μm; Rz: 1.103 μm); TiIVT (Ra: 1.240 μm; Rq: 1.675 μm; Rz: 11.442 μm); TiVNT (Ra: 0.103 μm; Rq: 0.132 μm; Rz: 0822 μm); TiVT (Ra: 1.137 μm; Rq: 1.394 μm; Rz: 6.978 μm).

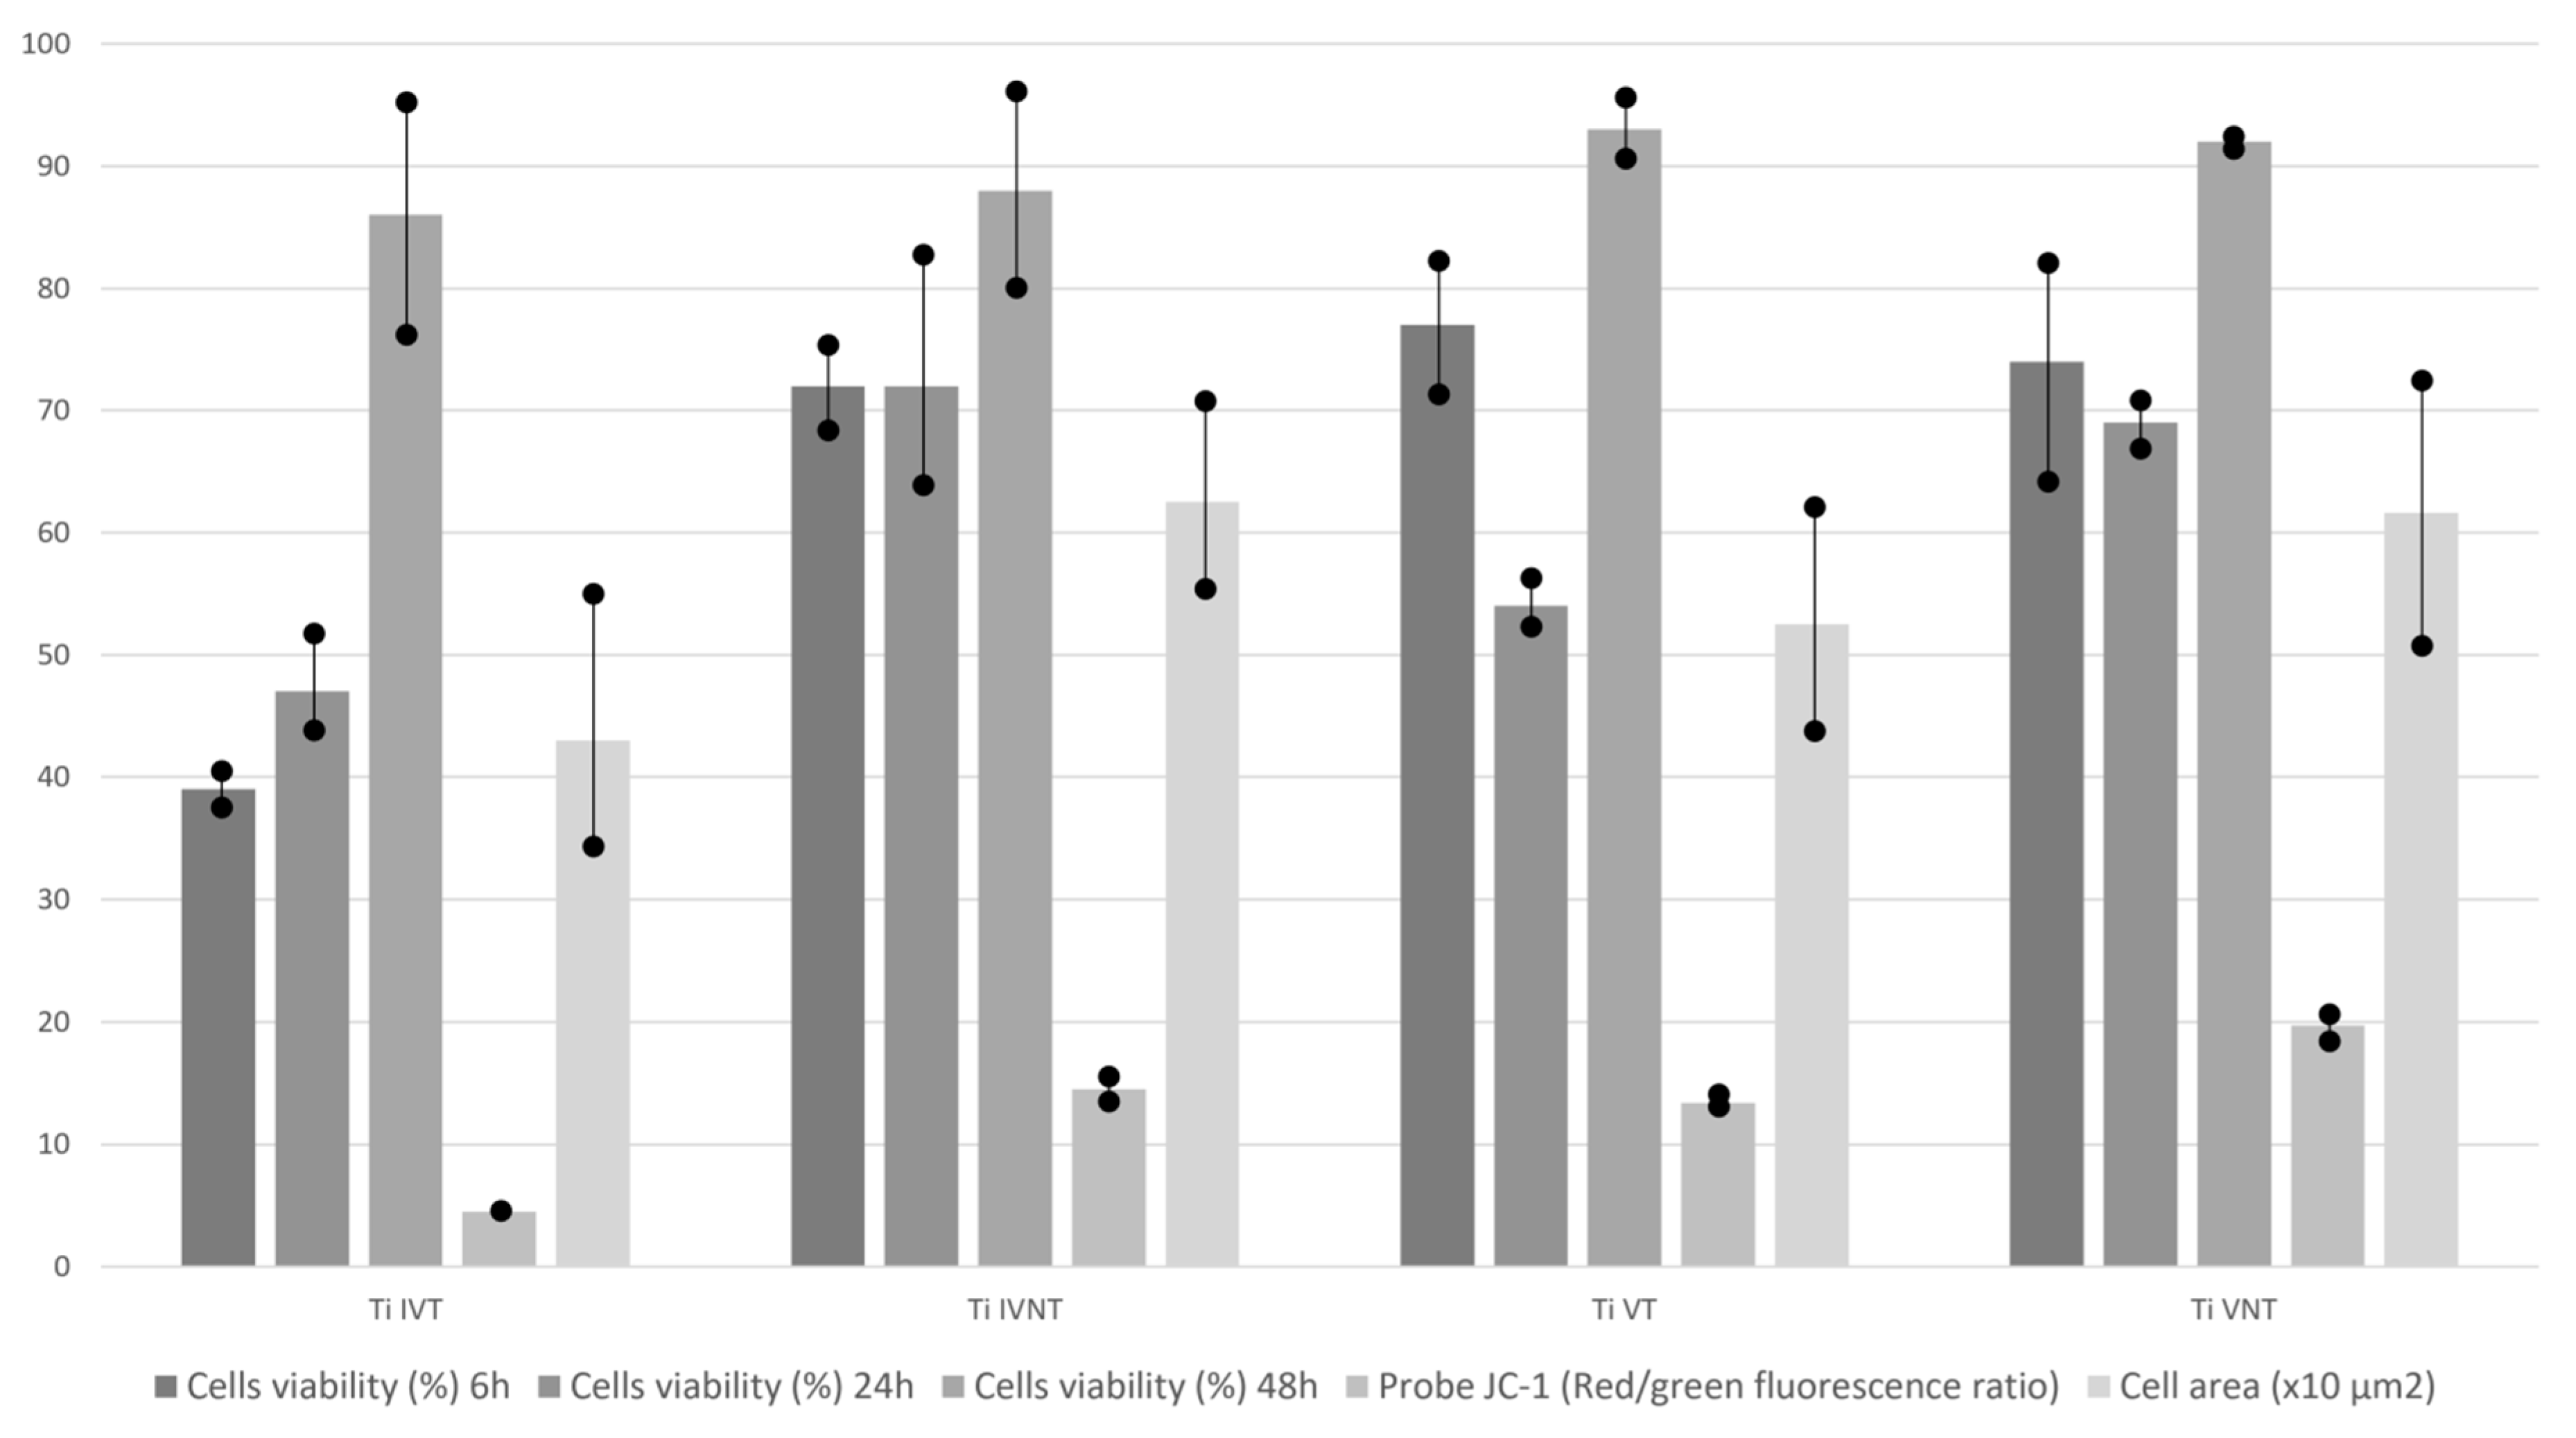
3.2. In Vitro Cell Culture

The chief study findings for cell cultures are shown in Table 2 and Figure 3. Cellular adhesion is lower at 6 h in TiIVT than in the rest of the discs under study. Proliferation at 24 h is lower in TiIVT and in TiVT than in NT. However, at 48 h, there are no differences between the groups.
In the flow cytometry with JC-1, the red/green ratio is greater for the osteoblasts adhered to the TiVNT and TiIVNT discs than for the corresponding TiVTR and TiIVTR, which indicates a better energy balance for the cells adhered to them.
The quantification of cell size measurement using ImageJ showed that the discs where the cells show a larger area is TiIVNT and TiVNT, although the differences are not significant with their modified partners.

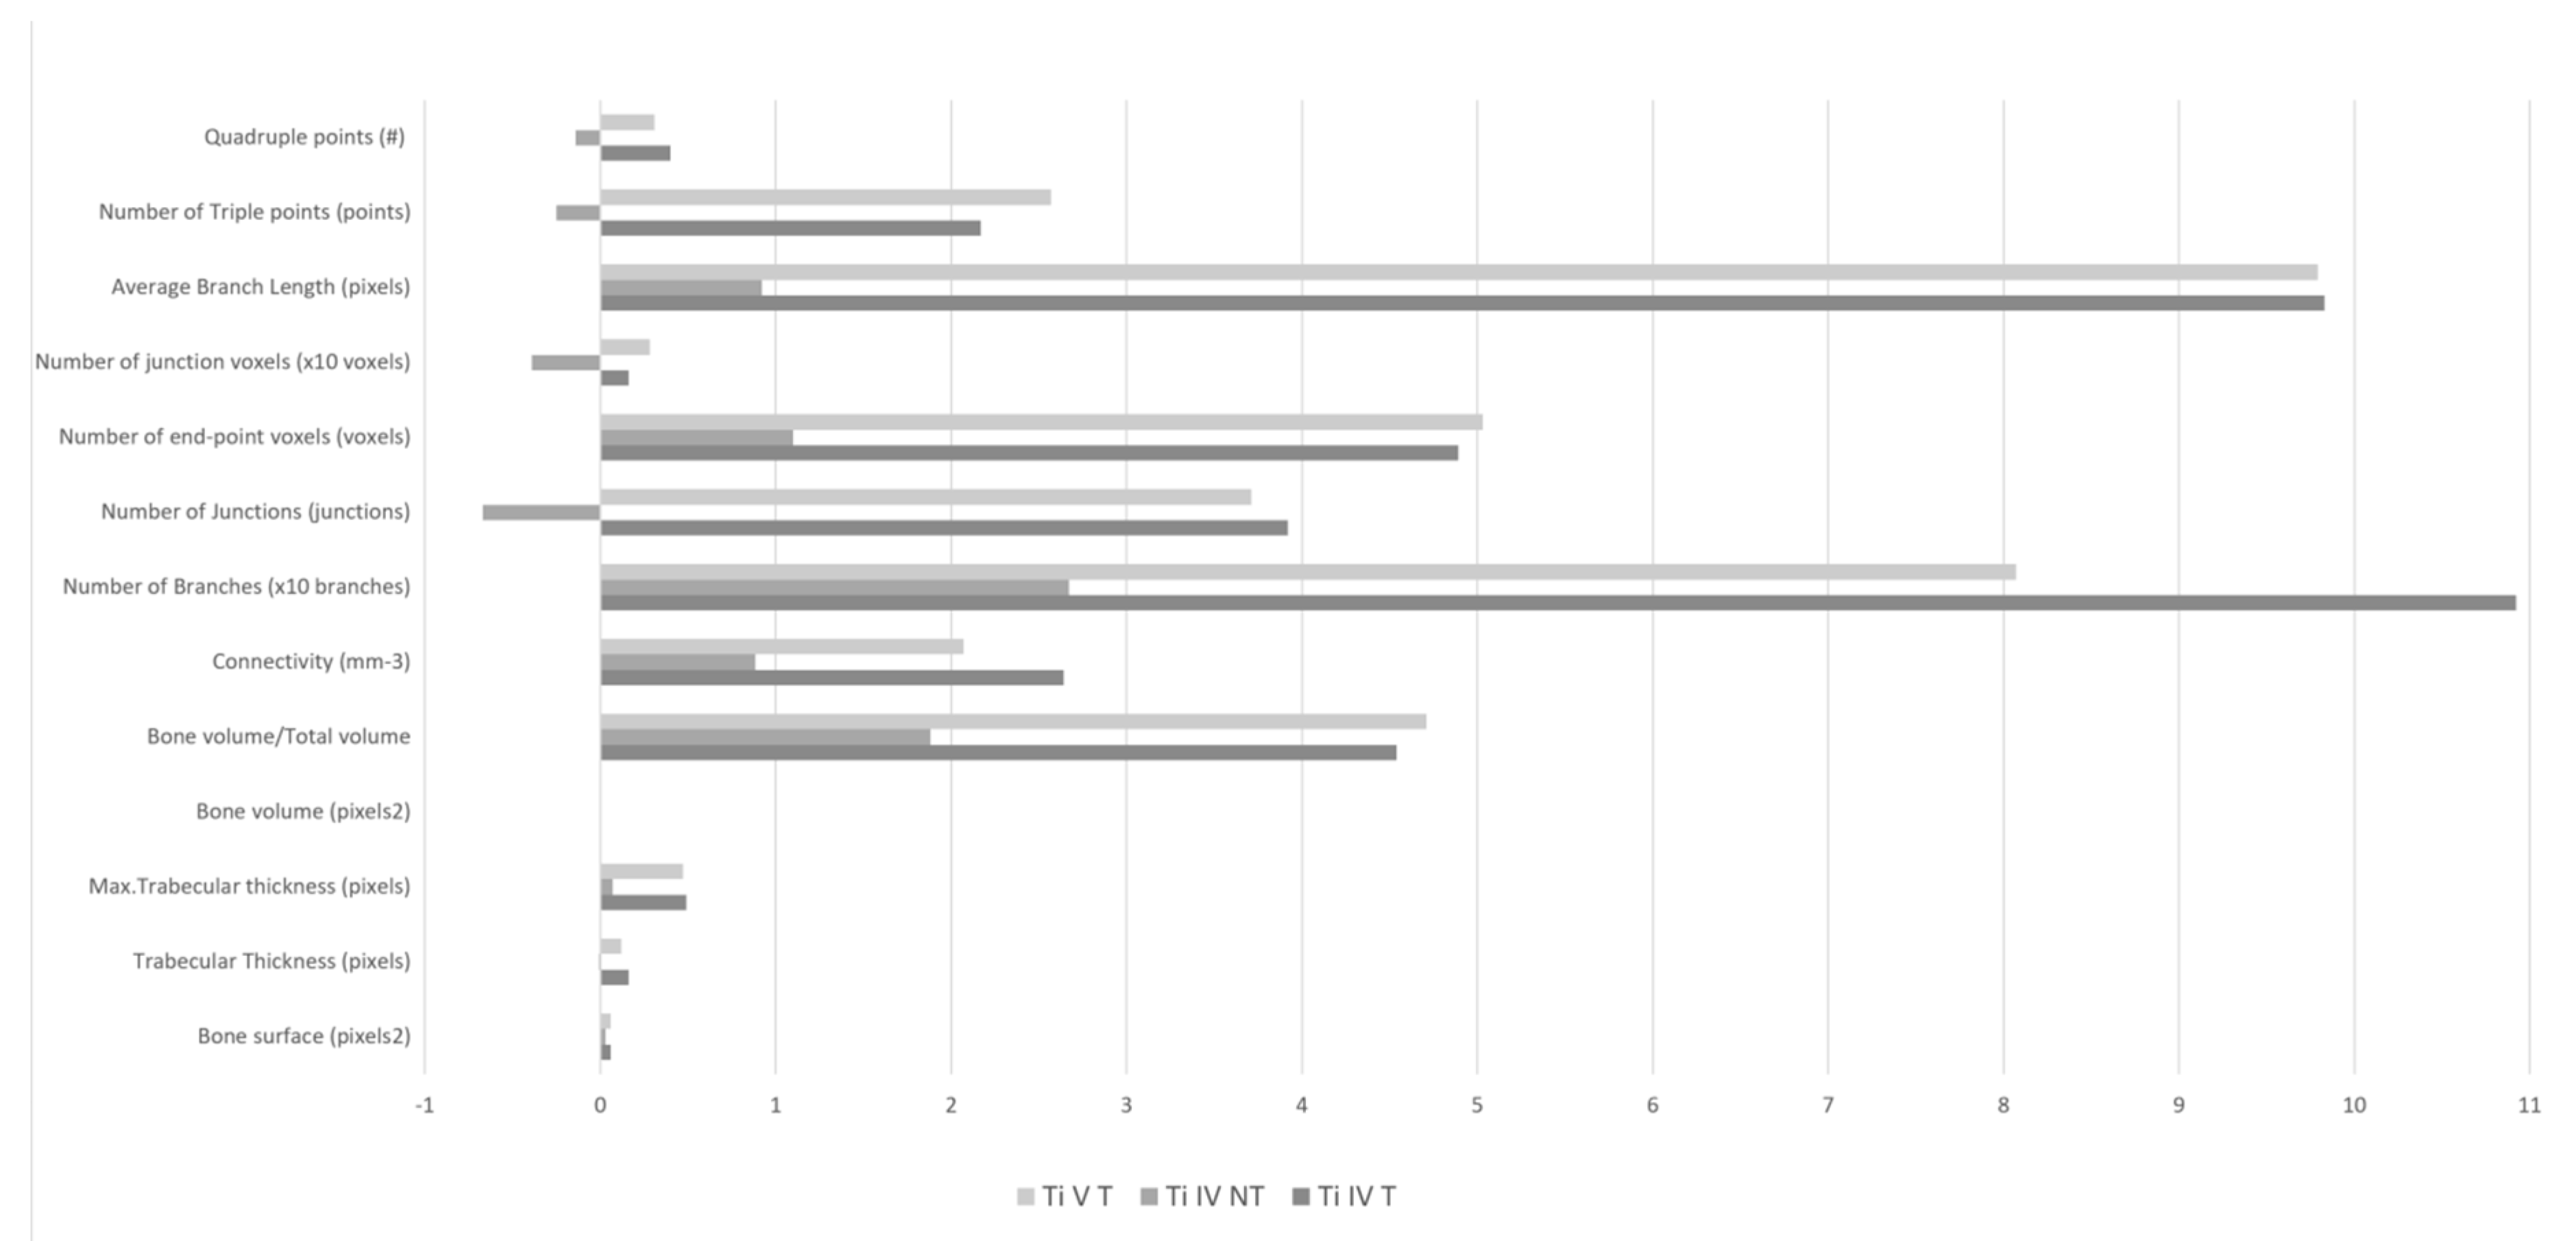
3.3. Comparison of Bone Density (BoneJ)

On comparing the data obtained from the BoneJ trabecular analysis plugins, no statistically significant differences were observed for numerous variables across the different implants, except for Average Branch Length (p < 0.05). However, groups with treated surfaces showed a better tendency in relation to bone behavior (Table 3 and Figure 4).

3.4. Histological Analysis

The histology analysis showed no statistically significant differences between groups (Table 4).

4. Discussion

As we have explained in the Introduction section, the American Society for Testing and Materials defines 39 different titanium alloys that can be used in bone [11]. These 39 different titanium alloys present different mechanical and physical properties in terms of yield strength, ultimate tensile strength, and fatigue strength [12], which can modify the probability of dental implant survival. In our study, we have carried out an in vitro and in vivo study to compare two different surfaces in titanium grade IV and titanium grade V. The surface studied had undergone grit blasting treatment with alumina and double acid passivation for the modification of roughness. The treatment and its characteristics can be consulted in other publications of our group [20].
Regarding the results of the in vitro study, an attempt was made to request material with the same characteristics among all the groups. However, we could not get discs of the same diameter. To minimize possible deviations in group comparisons, the cells were placed through a drop that never reached the edges of the disc in such a way that the number of cells applied and the area of growth was similar for all groups.
The in vitro study showed that cellular adhesion was lower at 6 h in TiIVT than in the rest of the discs being studied; however, proliferation at 24 h was lower in TiIVT but also in TiVT compared to NT. After 48 h, there were no differences between the groups, so we can affirm that after 48 h, osteoblast proliferation is the same in both titanium alloys and surfaces.
Assays were performed using the MG-63 human osteoblast line provided by the University of Granada Centre for Scientific Instrumentation (CIC). The MG-63 line shows faster growth than the primary bone-forming lines but retains many of their characteristics, which makes it a good in vitro model.
The JC-1 probe (Merck) is permeable to cell membranes, and it is accumulated in the mitochondria depending on membrane potential. When mitochondria function well, the probe accumulates in the mitochondria, forming aggregates that emit in red (approximately 590 nm). When mitochondrial membrane potential decreases in conditions of cell damage, fluorescence emission turns green (approximately 529 nm), decreasing the red/green ratio, as a consequence of the passage of the probe to the monomeric form.
In the flow cytometry with JC-1, the red/green ratio is greater for the osteoblasts adhering to the TiVNT and TiIVNT discs than for the corresponding TiVT and TiIVT, indicating a better energy balance of the cells adhered to them; in the case of TiIVTR, we observed a reduced ratio, which suggests greater oxidative damage.
Secondly, the discs where the cells show a larger area is in TiIVNT and TiVNT on quantifiying cell size measurement with ImageJ, although the differences are not significant with their modified partners. These results suggest that in the first 24 h, there are no differences between TiIVNT and TiVNT in contrast to TiIVT and TiVT, despite there being no significant differences.
For the in vivo study, we established as gold standard the TiIVT, because it is the more commercial form in implant manufacturing. We compared the TiIVT with the same implant with the untreated surface (TiIVNT) to make a real comparison to test the effectiveness of this surface treatment. We also compared this group with TiVT to contrast the effectiveness of titanium IV and V with the same surface, using a treated one because this is the more commercial product, trying to disseminate information with the greatest practical utility nowadays.
We can appreciate the concordance between the in vitro study and the in vivo study regarding the cell culture and histological and bone density results.
Regarding the bone density results, the implant made of titanium grade IV with the treated surface (TiIVT) showed similar results to titanium grade V with the treated surface (TiVT), which established an accurate comparison between different titanium alloys. We can see similar bone behavior across those implant groups. It suggests that both titanium alloys have good results regarding osseointegration. These results are in concordance with those concluded in the review published in 2016 by Bosshardt et al. [6].
However, despite the fact that there were no statistically significant differences between the in vivo groups, we can appreciate that surface treatment improved bone behavior because better results are obtained in the MicroCT parameters in TiIVT than in TiIVNT, which is a real comparison between the surfaces.
However, in the histological results, the surface-treated implants (TiIVT and TiVT) showed more similar and stronger bone response to the untreated surfaces (Ti IV NT), which is a fact that differs from the in vitro results. These differences can be explained by the time difference when performing the tests; the in vitro study took its measurements at 24 and 48 h compared to the in vivo study in which the samples were taken two months after placement of the implants. In this time, the surface treatment may have caused the change in trend. These differences between TiIVT and TiIVNT and the similarity between TiIVT and TiVT suggest that surface treatment improves cellular response in the osseointegration period.
All the suggestions outlined take into account the trends, since there were no statistically significant results between groups, neither in the in vitro nor the in vivo studies. Our study is not adequate to evaluate the suitability of these surfaces for the maintenance of long-term osseointegration. It is not performed under conditions similar to the use of dental implants (occlusal loads, saliva, presence of bacteria, etc.). For this reason, our study is not adequate to address a possible cause of the difference in behavior between TiV and TiIV implants, such as the possible leakage of aluminum and/or vanadium from this material.
Our results can be compared with the study published in 2016 by Ribeiro da Silva et al. [7]. They evaluate the bone response to grade IV and V titanium in an in vivo study in dogs. They placed 36 implants in the radius of 18 dogs to compare the bone implant contact and the bone area fraction occupancy. In addition, they designed different materials and methods to carry out their study but did not obtain statistically significant differences between groups, which is in accordance with our results. However, research published in 1998 by Johansson et al. showed that c.p. titanium compared to titanium alloy grade V responded better in bone regarding the strength and the histomorphometric results after 1 year in a study in rabbits [17,18].

5. Conclusions

Despite the fact that there are differences in the mechanical and physical properties between titanium grade IV and V, and between grit blasting treatment with alumina and double acid passivation to modify surface roughness, no statistically significant differences were found between our groups. All the in vitro study groups showed a similar response to cell proliferation cultures after 48 h.
Moreover, no statistically significant differences were found in the micro-CT bone density study and the in vivo histological study; however, there was a positive trend in bone formation in the groups with the treated surface.
Further research into titanium alloys in humans is required to provide more information on what material is best for dental implant survival.

Author Contributions

Conceptualisation: R.-M.D.-S., A.d.-P.-C., D.T.-L., and A.B.; Formal analysis: M.-A.S.-F.; Research: J.-R.L.-R.; Methodology: D.T.-L. and J.-R.L.-R.; Supervision: J.-L.G.-P.; Validation: D.T.-L. and J.-L.G.-P.; Composition: original draft: M.-A.S.-F., D.T.-L. and A.B.; Composition, review, and editing: R.-M.D.-S., A.d.-P.-C. and D.T.-L. All authors have read and agreed to the published version of the manuscript.

Funding

This research was funded by Oxtein Iberia Implants.

Conflicts of Interest

The authors declare no conflict of interest.

References

  1. Niu, W.; Wang, P.; Zhu, S.; Liu, Z.; Ji, P. Marginal bone loss around dental implants with and without microthreads in the neck: A systematic review and meta-analysis. J. Prosthet. Dent. 2016, 117, 34–40. [Google Scholar] [CrossRef]
  2. Moraschini, V.; Velloso, G.; Luz, D.; Barboza, E.P. Implant survival rates, marginal bone level changes, and complications in full-mouth rehabilitation with flapless computer-guided surgery: A systematic review and meta-analysis. Int. J. Oral Maxillofac. Surg. 2015, 44, 892–901. [Google Scholar] [CrossRef] [PubMed]
  3. Koodaryan, R.; Hafezeqoran, A. Evaluation of Implant Collar Surfaces for Marginal Bone Loss: A Systematic Review and Meta-Analysis. Biomed. Res. Int. 2016, 2016, 4987526. [Google Scholar] [CrossRef] [PubMed] [Green Version]
  4. Charyeva, O.; Altynbekov, K.; Zhartybaev, R.; Sabdanaliev, A. Long-term dental implant success and survival—A clinical study after an observation period up to 6 years. Swed. Dent. J. 2012, 36, 1–6. [Google Scholar] [PubMed]
  5. Van Velzen, F.J.J.; Ofec, R.; Schulten, E.A.J.M.; Bruggenkate, C.M. 10-year survival rate and the incidence of peri-implant disease of 374 titanium dental implants with a SLA surface: A prospective cohort study in 177 fully and partially edentulous patients. Clin. Oral Implant. Res. 2015, 26, 1121–1128. [Google Scholar] [CrossRef]
  6. Bosshardt, D.D.; Chappuis, V.; Buser, D. Osseointegration of titanium, titanium alloy and zirconia dental implants: Current knowledge and open questions. Periodontology 2000, 73, 22–40. [Google Scholar] [CrossRef]
  7. Ribeiro da Silva, J.; Castellano, A.; Malta Barbosa, J.P.; Gil, L.F.; Marin, C.; Granato, R.; Bonfante, E.A.; Tovar, N.; Janal, M.N.; Coelho, P.G. Histomorphological and Histomorphometric Analyses of Grade IV Commercially Pure Titanium and Grade V Ti-6Al-4V Titanium Alloy Implant Substrates: An In Vivo Study in Dogs. Implant. Dent. 2016, 25, 650–655. [Google Scholar] [CrossRef]
  8. Bothe, R.; Beaton, L.; Davenport, H. Reaction of bone to multiple metallic implants. Surg. Gynecol. Obstet. 1940, 71, 598–602. [Google Scholar]
  9. Brånemark, P.I.; Adell, R.; Breine, U.; Hansson, B.O.; Lindström, J.; Ohlsson, Å. Intra-osseous anchorage of dental prostheses. I. Experimental studies. Scand. J. Plast. Reconstr. Surg. 1969, 3, 81–100. [Google Scholar] [CrossRef]
  10. Albrektsson, T.; Brånemark, P.I.; Hansson, H.A.; Lindström, J. Osseointegrated titanium implants. Requirements for ensuring a long-lasting, direct bone-to-implant anchorage in man. Acta Orthop. Scand. 1981, 52, 155–170. [Google Scholar] [CrossRef] [Green Version]
  11. International a ASTM B265–13ae1, Standard Specification for Titanium and Titanium Alloy Strip, Sheet, and Plate; ASTM International: West Conshohocken, PA, USA, 2013.
  12. McCracken, M. Dental implant materials: Commercially pure titanium and titanium alloys. J. Prosthodont. 1999, 8, 40–43. [Google Scholar] [CrossRef] [PubMed]
  13. Hirata, R.; Bonfante, E.A.; Machado, L.S.; Tovar, N.; Coelho, P.G. Mechanical evaluation of two titanium alloy grades used in implant dentistry. Int. J. Oral Maxillofac. Implant. 2015, 30, 800–805. [Google Scholar] [CrossRef] [PubMed] [Green Version]
  14. Calvo-Guirado, J.L.; Gómez-Moreno, G.; Aguilar-Salvatierra, A.; Guardia, J.; Delgado-Ruiz, R.A.; Romanos, G.E. Marginal bone loss evaluation around immediate non-occlusal microthreaded implants placed in fresh extraction sockets in the maxilla: A 3-year study. Clin. Oral Implant. Res. 2015, 26, 761–767. [Google Scholar] [CrossRef]
  15. Khan, M.A.; Williams, R.L.; Williams, D.F. Conjoint corrosion and wear in titanium alloys. Biomaterials 1999, 20, 765–772. [Google Scholar] [CrossRef]
  16. Saulacic, N.; Bosshardt, D.D.; Bornstein, M.M.; Berner, S.; Buser, D. Bone apposition to a titanium-zirconium alloy implant, as compared to two other titanium-containing implants. Eur. Cells Mater. 2012, 23, 273–286. [Google Scholar] [CrossRef]
  17. Johansson, C.B.; Han, C.H.; Wennerberg, A.; Albrektsson, T. A quantitative comparison of machined commercially pure titanium and titanium-aluminum vanadium implants in rabbit bone. Int. J. Oral Maxillofac. Implant. 1998, 13, 315–321. [Google Scholar]
  18. Han, C.H.; Johansson, C.B.; Wennerberg, A.; Albrektsson, T. Quantitative and qualitative investigations of surface enlarged titanium and titanium alloy implants. Clin. Oral Implant. Res. 1998, 9, 1–10. [Google Scholar] [CrossRef]
  19. Heo, D.N.; Ko, W.K.; Lee, H.R.; Lee, S.J.; Lee, D.; Um, S.H.; Lee, J.H.; Woo, Y.H.; Zhang, L.G.; Lee, D.W.; et al. Titanium dental implants surface-immobilized with gold nanoparticles as osteoinductive agents for rapid osseointegration. J. Colloid Interface Sci. 2016, 469, 129–137. [Google Scholar] [CrossRef]
  20. Rizo-Gorrita, M.; Luna-Oliva, I.; Serrera-Figallo, M.-A.; Torres-Lagares, D. Superficial Characteristics of Titanium after Treatment of Chorreated Surface, Passive Acid, and Decontamination with Argon Plasma. J. Funct. Biomater. 2018, 9, 71. [Google Scholar] [CrossRef] [Green Version]
  21. Di Toro, R.; Betti, V.; Spampinato, S. Biocompatibility and integrin-mediated adhesion of human osteoblasts to poly (dl–lactide–co–glycolide) copolymers. Eur. J. Pharm. Sci. 2004, 21, 161–169. [Google Scholar] [CrossRef]
  22. Huang, L.; Zhang, Z.; Lv, W.; Zhang, M.; Yang, S.; Yin, L.; Hong, J.; Han, D.; Chen, C.; Swarts, S.; et al. Interleukin 11 protects bone marrow mitochondria from radiation damage. Adv. Exp. Med. Biol. 2013, 789, 257–264. [Google Scholar]
  23. Waggoner, A.; DeBiasio, R.; Conrad, P.; Bright, G.R.; Ernst, L.; Ryan, K.; Nederlof, M.; Taylor, D. Multiple spectral parameter imaging. Methods Cell Biol. 1989, 30, 449–478. [Google Scholar] [PubMed]
  24. Kubista, M.; Aakerman, B.; Norden, B. Characterization of interaction between DNA and 40,6-diamidino-2-phenylindolebyopticalspectroscopy. Biochemistry 1987, 26, 4545–4553. [Google Scholar] [CrossRef] [PubMed]
  25. Bornstein, M.M.; Reichart, P.A.; Buser, D.; Bosshardt, D.D. Tissue response and wound healing after placement of two types of bioengineered grafts containing vital cells in submucosal maxillary pouches: An experimental pilot study in rabbits. Int. J. Oral Maxillofac. Implant. 2011, 26, 768–775. [Google Scholar]
  26. Castillo-Dalí, G.; Castillo-Oyagüe, R.; Terriza, A.; Saffar, J.L.; Batista-Cruzado, A.; Lynch, C.D.; Sloan, A.J.; Gutiérrez-Pérez, J.L.; Torres-Lagares, D. Pre-prosthetic use of poly (lactic–co–glycolicacid) membranes treated with oxygen plasma and TiO2 nanocomposite particles for guided bone regeneration processes. J. Dent. 2016, 47, 71–79. [Google Scholar] [CrossRef] [PubMed]
  27. Landis, E.N.; Keane, D.T. X-ray microtomography. Mater. Charact. 2010, 61, 1305–1316. [Google Scholar] [CrossRef]
  28. Doube, M.; Kłosowski, M.M.; Arganda-Carreras, I.; Cordeliéres, F.; Dougherty, R.P.; Jackson, J.; Schmid, B.; Hutchinson, J.R.; Shefelbine, S.J. BoneJ: Free and extensible bone image analysis in ImageJ. Bone 2010, 47, 1076–1079. [Google Scholar] [CrossRef] [PubMed] [Green Version]
  29. Fan, Y.; Fan, Y.; Li, Z.; Lv, C.; Zhang, B. Bone surface mapping method. PLoS ONE 2012, 7, e32926. [Google Scholar] [CrossRef] [Green Version]
  30. Morgan, E.F.; Mason, Z.D.; Chien, K.B.; Pfeiffer, A.J.; Barnes, G.L.; Einhorn, T.A.; Gerstenfeld, L.C. Micro-computed tomography assessment of fracture healing: Relationships among callus structure, composition, and mechanical function. Bone 2009, 44, 335–344. [Google Scholar] [CrossRef] [Green Version]
  31. Bart, Z.R.; Wallace, J.M. Microcomputed tomography applications in bone and mineral research. Adv. Comput. Tomogr. 2013, 2, 121. [Google Scholar] [CrossRef] [Green Version]
  32. Casanova, M.; Schindeler, A.; Little, D.; Müller, R.; Schneider, P. Quantitative phenotyping of bone fracture repair: A review. BoneKEy Rep. 2014, 3, 550. [Google Scholar] [CrossRef] [PubMed] [Green Version]
  33. Bouxsein, M.L.; Boyd, S.K.; Christiansen, B.A.; Guldberg, R.E.; Jepsen, K.J.; Müller, R. Guidelines for assessment of bone microstructure in rodents using micro–computed tomography. J. Bone Min. Res. 2010, 25, 1468–1486. [Google Scholar] [CrossRef] [PubMed]
  34. Benjamin, M.; Jean-Pierre, J.; René, C. Accelerating volume rendering with quantized voxels. In Proceedings of the 2000 IEEE Symposium on Volume Visualization; ACM: New York, NY, USA, 2000; pp. 63–70. [Google Scholar]
  35. Ginzburg, V.L.; Gören, Y. Iterated index and the mean Euler characteristic. J. Topol. Anal. 2015, 7, 453–481. [Google Scholar] [CrossRef]
  36. Odgaard, A.; Gundersen, H.J. Quantification of connectivity in cancellous bone, with special emphasis on 3-D reconstructions. Bone 1993, 14, 173–182. [Google Scholar] [CrossRef]
  37. Tjong, W.; Kazakia, G.J.; Burghardt, A.J.; Majumdar, S. The effect of voxel size on high-resolution peripheral computed tomography measurements of trabecular and cortical bone microstructure. Med. Phys. 2012, 39, 1893–1903. [Google Scholar] [CrossRef] [Green Version]
  38. Ito, M. Recent progress in bone imaging for osteoporosis research. J. Bone Min. Metab. 2011, 29, 131–140. [Google Scholar] [CrossRef] [Green Version]
  39. Lopez-Píriz, R.; Fernández, A.; Goyos-Ball, L.; Rivera, S.; Díaz, L.A.; Fernández-Domínguez, M.; Prado, C.; Moya, J.S.; Torrecillas, R. Performance of a New Al2O3/Ce–TZP Ceramic Nanocomposite Dental Implant: A Pilot Study in Dogs. Materials 2017, 10, 614. [Google Scholar] [CrossRef] [Green Version]
  40. Hannigan, A.; Lynch, C.D. Statistical methodology in oral and dental research: Pitfalls and recommendations. J. Dent. 2013, 41, 385–392. [Google Scholar] [CrossRef]
  41. Hashimoto, S.; Tanaka, A.; Murata, A.; Sakurada, T. Formulation for XPS spectral change of oxides by ion bombardment as a function of sputtering time. Surf. Sci. 2004, 556, 22–32. [Google Scholar] [CrossRef]
Figure 1. Surgical procedure. Above, left: Identification of the operating area. Above, right: Incision and separation of the periosteum. Middle, left: Reaming of the alveoli for implants. Middle, right: Insertion of the implants in the tibiae of rabbits. Bottom: Suture of the incision.
Metals 10 00449 g001
Figure 2. (a) General spectrum; (b) regions of Ti2p; (c) O1s; (d) C1s; grade IV untreated (TiIVNT) black line; grade IV treated (TiIVT) red line; grade V untreated (TiVNT) green line; and grade V treated (TiVT) blue line.
Metals 10 00449 g002
Figure 3. Cell cultures in vitro results.
Metals 10 00449 g003
Figure 4. Comparison of bone density (BoneJ).
Metals 10 00449 g004
Table 1. Element concentrations. TiIVT and TiIVNT: treated and untreated titanium grade IV discs; TiVT and TiNVT: treated and untreated titanium grade V discs.
ElementTiIVNTTiIVTTiVNTTiVT
%Ti 2p16.921.511.417.8
%O 1s46.247.037.444.7
%C 1s31.631.443.533.5
%Ca 2p0.20.30.70.1
%Al 2p--2.43.4
%Si 2p5.0-1.0-
Table 2. In vitro cell culture results.
In Vitro Cell Culture ResultsTiIVTTiIVNTTiVTTiVNTp
Cell viability (%)6 h39 ± 372 ± 777 ± 1174 ± 18NS
24 h47 ± 872 ± 1954 ± 469 ± 4NS
48 h86 ± 1988 ± 1693 ± 592 ± 1NS
Probe JC-1 (Red/green fluorescence ratio)4.5 ± 0.614.5 ± 213.4 ± 119.7 ± 2.2NS
Cell area (μm2)430 ± 208625 ± 154525 ± 184616 ± 218NS
Table 3. Comparison of Bone Density (BoneJ).
Comparison of Bone Density (BoneJ)TiIVTTiIVNTTiVTN.S.
Bone surface (pixels 2)1.85 ± 5.550.19 ± 4.842.00 ± 5.59
Trabecular thickness (pixels)0.06 ± 0.190.03 ± 0.090.06 ± 0.19
Max. trabecular thickness (pixels)0.16 ± 0.28−0.01 ± 0.180.12 ± 0.28
Bone volume (pixels 2)0.49 ± 2.030.07 ± 1.440.47 ± 2.03
Bone volume/total volume0.00 ± 0.040.00 ± 0.030.00 ± 0.04
Connectivity (mm-3)4.54 ± 58.151.88 ± 19.934.71 ± 58.15
Number of branches (branches)26.42 ± 104.398.83 ± 47.8720.71 ± 104.39
Number of junctions (junctions)10.92 ± 52.502.67 ± 26.268.07 ± 52.50
Number of end-point voxels (voxels)3.92 ± 20.67−0.67 ± 7.453.71 ± 20.67
Number of junction voxels (voxels)48.92 ± 171.3111.00 ± 65.2950.29 ± 171.31
Average branch length (pixels)0.16 ± 0.13−0.39 ± 1.220.28 ± 0.13<0.05
Number of triple points (points)9.83 ± 33.380.92 ± 19.399.79 ± 33.38
Quadruple points 217 ± 10.42−0.25 ± 5.802.57 ± 10.42
Maximum branch length (pixels)0.40 ± 0.83−0.14 ± 1.540.31 ± 0.83
Table 4. Histological analysis.
Histological AnalysisTiIVTTiIVNTTiVTN.S.
Bone height (µm)4759.83 ± 1928.983724.68 ± 1900.634825.76 ± 1928.98
Bone height (%)39.66 ± 16.0731.04 ± 15.8440.21 ± 16.07
Mature bone height (µm)3082.37 ± 1355.532522.13 ± 1332.883178.36 ± 1355.53
Mature bone height (%)25.69 ± 11.3021.02 ± 11.1126.49 ± 11.30
Osteoid (µm)1677.46 ± 1326.661202.55 ± 862.961647.40 ± 1326.66
Osteoid (%)13.98 ± 11.0610.02 ± 7.1913.73 ± 11.06
Mean height of bone (µm)246.30 ± 139.33157.00 ± 100.72248.10 ± 139.33

