Abstract
The crystallization process, both at the initial and subsequent stages, of amorphous Al88-RE4-Ni8 alloys (RE = Y, Sm and Ce) has been studied. Additionally, the consequences of adding 1 at.% Cu replacing Ni or Al were studied. The stability of the amorphous structure in melt spun ribbons was thermally studied by differential scanning calorimetry, with Ce alloys being the most stable. The effect of Cu to reduce the nanocrystal size during primary crystallization was analyzed by transmission electron microscopy. This latter technique and x-ray diffraction showed the formation of intermetallic phases at higher temperatures. A clear difference was observed for the Ce alloy, with a simpler sequence involving the presence of Al3Ni and Al11Ce3. However, for the Y and Sm alloys, a more complex evolution involving metastable ternary phases before Al19RE5Ni3 appears, takes place. The shape of the intermetallics changes from equiaxial in the Ce alloys to elongate for Y and Sm, with longer particles for Sm and, in general, when Cu is added to the alloy.
1. Introduction
The disordered or amorphous structure typical of the liquid state can be maintained in solid metals by heating above their melting temperature and very quick cooling to room temperature [1,2]. Only particular compositions are appropriate to form metallic glasses, and depending on the composition, the necessary cooling rate varies. The importance of this process resides in the outstanding attained properties of different character such as mechanical, electrical, magnetic, or chemical, all of them of great engineering importance [3,4].
Regarding compositions, aluminum mixtures with at least other two chemical elements (although it is also possible with only one, i.e., [5,6]) can reach the amorphous state by quick cooling, attaining high strengths with respect to conventional aluminum alloys [7]. Properties such as elastic strain [8], or the possibility of superplastic forming in a supercooled liquid region [9] are remarkable.
Initially, Al amorphous alloys with a composition Al-Fe-Si [10,11] showed brittleness problems that were subsequently solved by changing for instance to Al-Ni-Zr compositions [12]. Later, the development of compositions Al-RE (rare earth: La, Y, Ce)-TM (transition metal: Fe, Co, Ni) [6,13,14,15,16] allowed very high strengths (up to 1100 MPa) to be reached. This strength can be increased for some alloys by allowing the formation of up to a 50 vol.% of α-Al nanocrystals [17,18] at the expense of the amorphous phase. For nanocrystallized Al-RE-Ni alloys, ultimate tensile strengths can increase up to 1560 MPa [19,20], three times the value of crystalline alloys, even showing improved ductility and toughness [21]. The nanocrystal size, number, and spatial distribution are key parameters in the obtained properties. These parameters are better controlled by annealing from an amorphous structure obtained after quenching [17].
Intermetallics appearing after heating are unfavorable for the properties of the alloys [22]. Understanding this process, which should be initially avoided to preserve the best properties, is of great importance. One of the important aims of working with amorphous alloys is to obtain thick parts [2], and the formation of intermetallics is a concern in this process. Many bulk metallic glasses (BMG) have been prepared, with lots of them still to be discovered [23]. The formation of BMG can be theoretically predicted according to the physical properties of the amorphous and crystalline phases, or on known rules such as the confusion principle. However, for Al-based alloys, the glass forming ability (GFA) does not adequately follow the expected criteria, and the production of Al-based BMG is relatively difficult and limited to low Al contents [24]. Under these circumstances, Al-based alloys are bad candidates for BMG processing; and the amorphous ribbons require further processing by powder metallurgy methods. For instance, spark plasma sintering, one of the multiple electric field assisted sintering techniques, has been used to consolidate Al-Y-Ni amorphous powders [25,26].
Al-RE-Ni alloys were studied in this work. The study of the crystallization kinetics and competition of the crystalline phases [27,28,29,30], the expected GFA [31,32,33], and the theoretical modeling of the adequate solute range for amorphous forming [34,35,36] shows that ternary alloys with a solute content around 10–15 at.% are good candidates to attain amorphous structures. Thus, the compositions Al88-RE4-Ni8 were selected (with RE = Y, Sm, and Ce, three well-known candidates to reach the amorphous state). The influence of small amounts of alloying elements in the primary crystallization of Al-RE-Ni systems has been previously studied [37,38,39,40,41,42,43,44]. In this work, it will be extended to include the subsequent appearance of intermetallic phases, which are of great importance during the consolidation process of amorphous ribbons.
2. Materials and Methods
The alloys Al88-RE4-Ni8 (RE = Y, Sm, and Ce) were selected in this work. Moreover, Al or Ni was replaced by just 1 at.% Cu, resulting in the alloys Al87-RE4-Ni8-Cu1 or Al88-RE4-Ni7-Cu1. Pure metals (Al 99.9%, Ni 99.95%, Y 95%, Sm 99.9%, Ce 99.9%, and Cu 99.9%) were arc melted in vacuum to prepare the master alloys Al90-Cu10 and Al25-RE75. Pure metals and master alloys in the adequate proportion were repeatedly remelted to obtain the final alloys with an adequate homogeneity. The final materials were obtained in the form of ribbons after heating the alloy at 1000 °C in a melt spinning chamber filled at a 200 mbar He atmosphere. The liquid was ejected through a round nozzle 0.85 mm in diameter on a Cu wheel rotating to reach 40 m/s on its surface. A distance nozzle-wheel of 1.5 mm resulted in ribbons with a thickness of 25–30 µm and width of 1–2 mm.
The amorphous character of the melt-spun ribbons was examined by x-ray diffraction (XRD, model PW 1729, Philips, Amsterdam, Netherlands, with Cu-Kα radiation for 2θ = 20–80°). Transmission electron microscopy (TEM, model CM20, Philips, Amsterdam, Netherlands, working at 200 KV) was used to characterize heat treated ribbons, after electropolishing at −30 °C in 10% perchloric acid, 90% ethanol solution. In general, the Al nanocrystals were especially attacked with this technique, being necessary to ion mill the heat treated ribbons after cooling at −30 °C.
The thermal stability of the ribbons was studied by differential scanning calorimetry (DSC, model 2010, TA Instruments, New Castle, DE, USA) heating at 20 °C/min, on times combined with final isothermal treatments, under an Ar atmosphere. Cooling was always carried out by switching off the equipment, without particular control of the cooling rate.
3. Results and Discussion
3.1. Melt-Spun Ribbons
XRD patterns of as-spun materials are shown in Figure 1. A broad peak at 2θ ~38° can be observed, being representative of having reached an amorphous structure in Al alloys. Regarding the Y alloy, a small shoulder appeared for 2θ ~44°, because of the presence of some local order [41,45,46], corresponding to the initial stages of disappearance of the amorphous structure, while still being maintained. According to the confusion principle [47], the low atomic radius difference between Al and Y when compared to Al-Sm or Al-Ce [48] reduces the GFA. Al-RE-Ni alloys showed a strong linear dependence for the GFA on the size of RE elements, with bigger atoms facilitating the glass formation [49]. Nevertheless, the obtained structures can be considered amorphous from the XRD analysis.
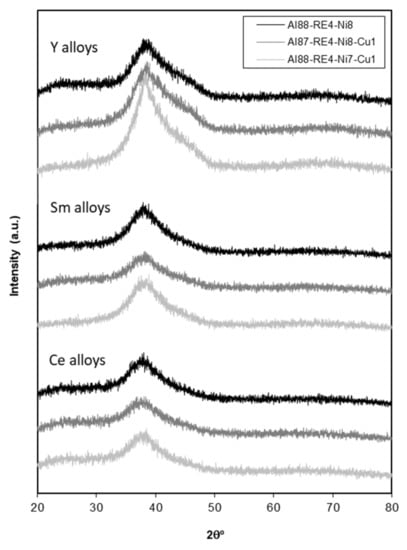
Figure 1.
X-ray diffraction (XRD) patterns of Al-RE-Ni-(Cu) melt-spun ribbons.
XRD also showed that, in general terms, patterns corresponding to Al87-RE4-Ni8-Cu1 seemed to be flatter, and those of Al88-RE4-Ni7-Cu1 tended to contain sharper peaks. On the other hand, the diffuse peak position shifted to lower angles for the Ce alloys. According to the Ehrenfest relation [50], this position was lower for a higher value of near-neighbor distance, occurring on the Ce-containing alloy, with a higher atomic radius than Y and Sm.
3.2. Crystallization Process
DSC results for the as-spun ribbons are shown in Figure 2. The general behavior is a crystallization process occurring in three stages, although a small fourth stage can also appear at temperatures higher than 400 °C, as shown for the Cu-free Sm-containing alloy. Crystallization can therefore be quite dependent on composition. Even the composition [51] and DSC heating rate [5,42,45,52,53,54] can determine the transformation temperatures, and limit the capacity to detect them when taking place very close. Thus, Y-containing alloys with a similar range of compositions as those studied in this work are usually found to crystallize from the amorphous structure in three stages [34,41,45,55,56,57,58,59], but four stages have also been reported [27,48,58,60]. Likewise, synchrotron XRD revealed the presence of two stages in Al87-Y4-Ni9 and Al86-Y4-Ni10, but three stages for Al83-Y4-Ni13 [29]. For Sm-containing alloys, the first three DSC reactions have been reported [51,54,61,62,63,64], but a fourth reaction has also been found for similar alloys [53,61,65,66,67,68], and up to five reactions have been identified [69]. Regarding Ce-containing alloys, the general behavior depends on the composition, but three reactions have generally been reported for similar compositions to the one now studied [49].
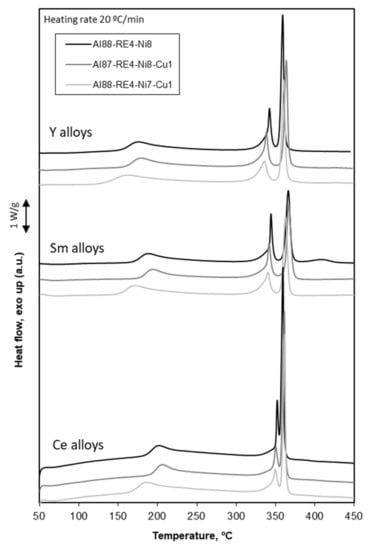
Figure 2.
Differential scanning calorimetry (DSC) traces at a heating rate of 20 °C/min of Al-RE-Ni-(Cu) melt-spun ribbons.
Comparing the three RE elements, the first reaction was quite similar for the three RE-containing alloys, only at some higher temperatures for Ce, and some starting earlier for the Y-containing alloys. Regarding the second and third reactions, the Y and Sm-containing alloys showed a very similar behavior, although the third reaction seemed to be of greater importance in Y alloys. Ce-containing alloys, however, showed a second reaction much smaller with regard to the third one, and even nearer to each other when compared with the two other cases. These different crystallization stages will be analyzed next.
3.3. Primary Crystallization
The crystallization process starts for all of the alloys with a broad exothermic reaction. The onset temperatures were 150 °C, 165 °C, and 180 °C for the Cu-free Y, Sm, and Ce-containing alloys, respectively. According to Figure 1, the Y alloys seemed to reach a less amorphous state, and Ce patterns appeared flatter and therefore more amorphous, which is now reflected in the ease in which to start crystallization. DSC showed that increasing the total amount of solute when 1 at.% Cu replaces Al resulted in slightly more stable alloys. In contrast, when Ni was replaced, therefore maintaining the total amount of solute, and with the atomic radius of Cu being more similar to the Al than to the Ni one, a reduction of the amorphous structure stability was found.
XRD and TEM results from ribbons heated to the end of the first reaction at 250 °C showed the formation of α-Al nanocrystals. Figure 3 shows the results for the Sm-containing alloys, with similar results for the Y and Ce alloys.
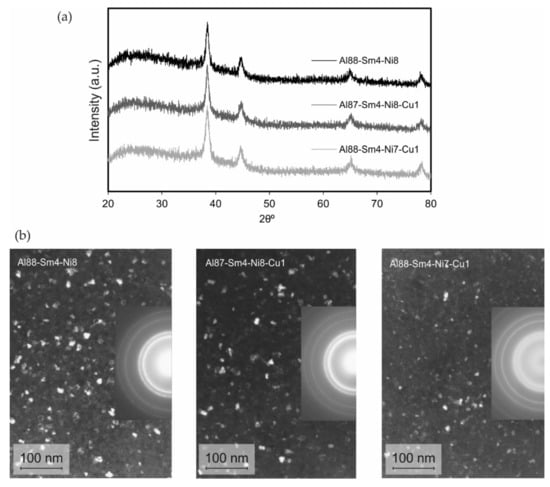
Figure 3.
Study of the first DSC reaction of Sm alloys after heating at 20 °C/min to 250 °C and immediate cooling: (a) XRD patterns of ribbons, with peaks corresponding to α-Al nanocrystals, and (b) transmission electron microscopy (TEM) dark field images and diffraction patterns (DP).
Nanocrystal size measurements of the ribbons heated beyond the first DSC reaction (i.e., at 250 °C) were carried out on TEM micrographs. The similar area under DSC curves ensured a similar amount of nanocrystals formed. Results obtained by line intercept showed that the presence of Cu acts to diminish the nanocrystal size. The crystals’ size mean value was thus reduced to about 9 nm when Cu was present in Sm-containing alloys, with 10.7 nm for the Cu-free alloy, and in a similar way for the Y and Ce alloys. One of the possible reasons for this is the reduction of the nucleation barrier, as reported for Al-Y-Ni-Cu [38] and Al-Ce-Ni-Cu alloys [70]. Nevertheless, for these alloys, Cu has also been found to be uniformly distributed [61,71], besides causing composition variations [70,72]. In Al-Sm-Ni alloys, heterogeneities that can act as nucleation sites have been reported after the addition of Cu [73,74]. In summary, there is not a clear consensus for the actual reasons for this reduction.
3.4. High Temperature Crystallization Stages
The second DSC crystallization reaction for the Y and Sm-containing alloys appeared with an onset at approximately 315 °C and at 335 °C for the Ce alloy (see Figure 2). This reaction ends only about 35 °C later for the Y and Sm alloys, and 20 °C for the Ce-containing alloy, and before it has totally finished, the third reaction starts (this being more pronounced for the Ce alloy).
A higher separation between the second and third reactions, allowing a better study of the processes taking place, can be attained by heating the ribbons up to 5 °C before the onset of the second DSC reaction, then maintaining the temperature in an isothermal heat treatment. Figure 4 shows the DSC traces thus obtained.
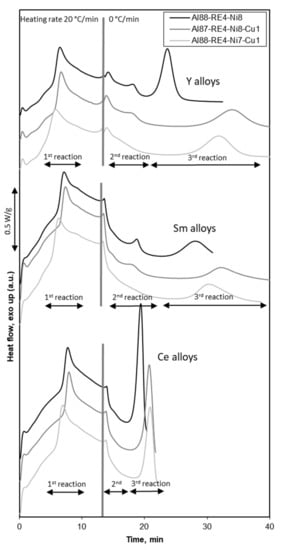
Figure 4.
DSC traces (heating rate of 20 °C/min up to 5 °C before the onset of the second reaction and then maintaining the temperature) of the Al-RE-Ni-(Cu) alloys (vertical lines mark the heating regime change.).
DSC traces at 20 °C/min in Figure 2 showed an asymmetry at the beginning of the second reaction for the Y and Sm alloys, not being so clear for the Ce-containing alloy. This peculiarity of the second reaction is separated in different reactions (we will call them subreactions 1 and 2) when holding the temperature in Figure 4, always more clearly for the Cu-free alloys. This different behavior for the Ce-containing alloys could be caused by a different crystallization process, which is discussed next. The third reaction remains during isothermal heating as only one, starting up to 10 min after the end of the second one. The start of this third reaction is quicker for a lower separation with respect to the second one in continuous heating, something taking place very clearly for the Ce alloys, and in general for the Cu-free alloys.
The second reaction is usually a source of discrepancies in previous studies, mainly for the Y and Sm alloys. The reason is that even after heating the ribbons to make this reaction take place, identifying the phases present in the alloys is challenging. XRD patterns of ribbons isothermally treated to the end of the two subreactions of the second crystallization stage (Figure 5 shows the results for the Y alloys, being similar for Sm and Ce alloys) seem to show that in both cases, only α-Al nanocrystals were found. Likewise, TEM diffraction showed no spots from new phases once the second DSC reaction finished.
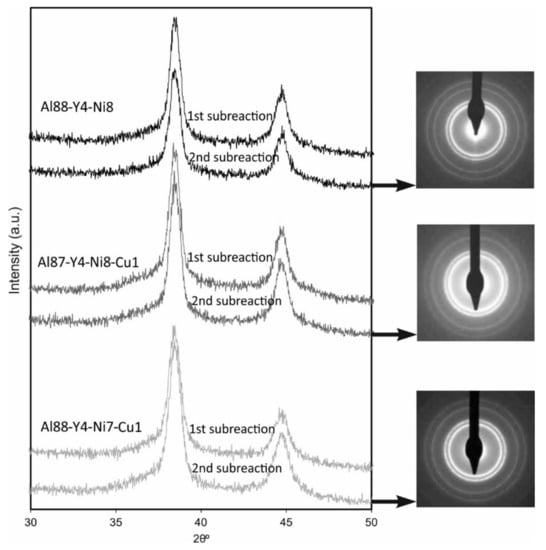
Figure 5.
XRD patterns of heat treated ribbons up to the end of the two subreactions of the second DSC reaction, and the TEM DP of the Y-containing alloys at the end of the second DSC reaction.
Undoubtedly, something is happening in the second crystallization stage. The only difference with previous XRD patterns (i.e., after the primary crystallization) was an asymmetry at the left of the main Al peak, which could be related to the formation of new phases probably just nucleating, but their identification is not possible. A rough estimation can be done after (i) taking into account that the intermetallic formation requires an activation energy 25% higher than α-Al nanocrystals [48], (ii) that the amount of intermetallics and primary nanocrystals are similar, and (iii) considering the areas of the reactions under the DSC curves. Thinking of an α-Al nuclei about 10 nm in diameter, the equivalent nucleation and growth for the intermetallics would lead during the first and second subreactions of this second stage to particles of about 6 nm and 5 nm respectively, in the case of an homogeneous process. However, this same volume of new particles led to layers of 0.4 nm and 0.25 nm forming around the existing α-Al nanocrystals (values in the same order of magnitude result by computing the areas in the DSC curves of the Sm alloys). These very thin and not easily detectable layers could be the explanation for the almost similar results, therefore a heterogeneous nucleation surrounding previous α-Al nanocrystals can be proposed.
As mentioned before, no clear results have been reported regarding the second and subsequent crystallization stages of these alloys. For Y alloys, Al3Ni, Al16YNi3, and unidentified phases have been indicated to appear [43,45,55,56,57,75,76]. The Al16YNi3 phase is, in more recent years, not referred, and Al19Y3Ni5 and Al23Y4Ni6 have been proposed [27,29,77,78,79], the former on times considered a metastable phase, and both of them with a very similar structure to the well-known Al4YNi phase [80,81]. This metastable character is not discarded according to the Al-Y-Ni intermetallic enthalpies of formation [31,78,82], lower for Al19Y3Ni5 than for Al23Y4Ni6. However, Al19Y3Ni5 [29] and also the Al9YNi3 [27,29] have been proposed as stable phases of this system.
Regarding Sm alloys, the second stage is related to the crystallization of Al3Sm (cubic + hexagonal) [51,53], Al11Sm3 [65], or Al3Ni and Al3Sm [69]. Unknown metastable intermetallics have also been suggested [51,53,54,64,68]. After the third reaction, unknown and Al11Sm3 phases [51,53], only binary phases such as Al3Sm and Al3Ni [67] (together to Al4Sm and Al11Sm3 [69]), or binary and ternary phases together such as Al11Sm3 and Al7SmNi2 [54,62,64] are reported. Additionally, the continuity of orthorhombic Al11Sm3 and the appearance of tetragonal Al11Sm3 and Al23Sm4Ni6, which then transform from orthorhombic Al11Sm3 to orthorhombic Al4Sm, has been proposed [65].
Ce alloys have been reported to lead to unknown metastable phases and (AlNi)11La3-like phases [48], or Al3Ni, Al4Ce, and unidentified phases [83] as well as to Al3Ni, Al3Ce, Al11Ce3, AlCeNi, and unidentified phases [84].
According to these studies, it can be concluded that both Al3Ni and a certain ternary phase are causing the two subreactions in the second DSC reaction of the Y and Sm-containing alloys. On the other hand, for Ce-containing alloys, Al3Ni and probably a binary Al-Ce phase should appear.
Back to the present study, further heating the second DSC reaction, intermetallics clearly appeared for all the alloys. Figure 6 shows the XRD patterns after heating at 20 °C/min to the peak of the third DSC reaction (at about 355–365 °C), to 375 °C (end of the reaction) held for 30 min, to 450 °C and to 600 °C.
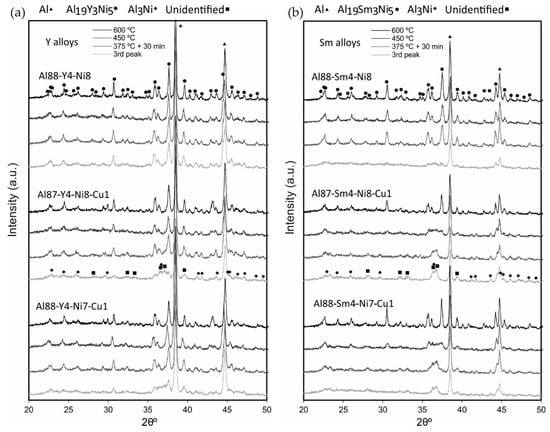
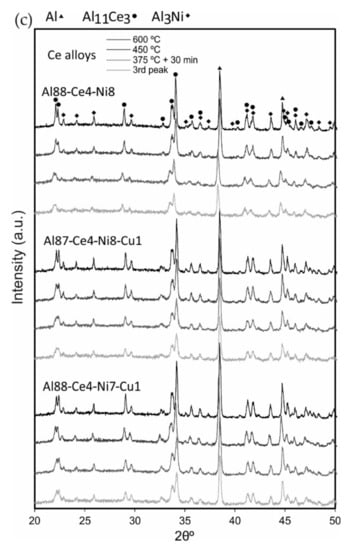
Figure 6.
XRD patterns of (a) Y, (b) Sm, and (c) Ce-containing alloys after heat treating to the peak of the third DSC reaction (355–365 °C) to 375 °C (end of the reaction) held for 30 min, to 450 °C and to 600 °C.
Although some differences were previously observed in the DSC traces for the Ce alloys, the first big difference between the different RE elements studied was now found. The final microstructure, according to the XRD results, was quite similar for the Y and Sm-containing alloys, but different for the Ce alloys.
Focusing first on the Y and Sm alloys, the Cu-free Y alloy showed the same pattern for the different heat treatments, with peaks identified as Al, Al3Ni, and Al19Y3Ni5. Nevertheless, the quite small amount of Al3Ni, and the coincidence of the XRD peaks with those of the other phases, makes its identification difficult. When Cu is added to the Y alloy, the high-temperature microstructure is the same, but it seems to be attained through the evolution of a metastable phase, which tends to transform to the Al19Y3Ni5 phase. It is only possible to detect the metastable phase when the third DSC reaction is not completed (i.e., for the treatment to the peak temperature of the third reaction). According to this, the metastable phase tends to grow, and then transforms to the stable phase during the third DSC reaction, probably after appearing during the second DSC reaction. Whether the metastable phase also appears in the Cu-free alloy cannot confirmed from the XRD results because the proximity of the second and third DSC reactions does not make it possible to detect it before the Al19Y3Ni5 phase has been totally formed, even when heating to the peak temperature of the third reaction.
A similar evolution was found for the Sm-containing alloys. The existence of the Al19Sm3Ni5 phase has not been established in previous studies, but according to the peaks’ positions, and through a comparison with the Y alloys, this can be proposed as the stable phase appearing in the Sm alloys. Based on the similarity of the Al23Sm4Ni6 and Al23Y4Ni6 lattice parameters (1.5939 nm, 0.40967 nm, 1.8320 nm, and 113.09° for the former [85], and 1.5836 nm, 0.4068 nm, 1.8311 nm, and 112.97° for the latter [77]), this could be an acceptable assumption. Conversely, the metastable phase prevails in the Sm alloys for tougher treatments (with a similar evolution in the Cu-free alloy to that of the Cu-containing Y alloy), with the presence of the metastable phase being detected, even when heat treating beyond the third DSC reaction. The metastable phase partially transforms to Al19Sm3Ni5 after heating to 450 °C, and totally for 600 °C. Therefore, in Sm-containing alloys, the transformation from the metastable to the Al19Sm3Ni5 phase must take place after the third peak, which now appears as a separate reaction. This reaction was found in Figure 2 at about 400 °C for the Cu-free alloy, and must be taking place at higher temperatures for the Cu-containing alloys, although it is not clearly detected in DSC traces.
Figure 7 shows the XRD patterns simulations (with PowderCell software [86]) and the experimental traces for Y and Sm-containing Al87-RE4-Ni8-Cu1 alloys after heating to 600 °C. For the Y alloy, Al, Al19Y3Ni5, and Al3Ni in proportions 63/35/2 were simulated (these are just rough qualitative values to replicate the experimental pattern). The crystalline data for Al19Sm3Ni5 have been taken in accordance with the Al19Y3Ni5 phase (space group Cmcm, Pearson symbol oC108 and lattice parameters 0.403 nm, 1.598 nm, and 2.689 nm [81]), although small variations of the lattice parameters to 0.410 nm, 1.598 nm, and 2.689 nm have been considered for a better reproduction of the experimental pattern (with Al, Al19Sm3Ni5, and Al3Ni in proportions 58/40/2).
Figure 7.
XRD patterns of the Al87-Y4-Ni8-Cu1 and Al87-Sm4-Ni8-Cu1 alloys, heat treated to 600 °C. The considered phases summed to give the simulated patterns were Al, Al19RE3Ni5, and Al3Ni in proportions 63/35/2 and 58/40/2 for the Y and Sm-containing alloys, respectively.
According to the results in Figure 7, the similarities between the Al19Y3Ni5 and Al19Sm3Ni5 phases are possible. On the other hand, it must be noted that the simulated pattern could reproduce the experimental one, even without considering the presence of Al3Ni. It can be concluded that the presence of Al3Ni, which seems quite certain according to the literature, decreases with heating, therefore probably contributing to the formation of the Al19RE3Ni5 phases.
Taking into account the results of the Y and Sm alloys, a plausible description of the process starts with the nucleation of both Al3Ni and the metastable phase during the second DSC reaction (the direct appearance of the stable phase for the Y-containing alloys cannot be discarded, at least partially, as indicated in [27,29]). The third reaction should correspond to the growth of the nucleated phases, with the ternary phase then transforming to the stable Al19Y3Ni5 or Al19Sm3Ni5 phases. This later transformation must take place during this same third reaction in the Y alloys (which according to Figure 2 showed a bigger reaction), or during the small fourth DSC reaction in Sm-containing alloys, which however was not clearly found in the DSC traces when Cu is present.
Regarding Ce alloys, the behavior was significantly different, with Al3Ni and Al11Ce3 being the only phases identified for any of the heat treatments. These phases must probably appear again during the second DSC reaction, and grow during the third reaction.
Regarding the Y and Sm alloys, it is worth further investigating the peculiarity previously indicated. The fourth DSC reaction is a very small reaction, at times undetectable (coincident with the third one), causing the metastable to the stable phase transformation. According to this, a very easy process must be taking place, and the metastable phase should be very similar in composition and structure to the stable one, not even making a new nucleation and growth process necessary, but an easier transformation that just adapts to the new lattice parameters, probably with a very similar composition. In order to check this hypothesis, the Al87-Sm4-Ni8-Cu1 diffraction pattern was simulated for 375 °C + 30 min (considering a metastable phase with very similar crystalline structure to the Al19Sm3Ni5) and compared with the experimental one. The initial lattice parameters to consider were obtained from a metastable particle, studied by TEM microdiffraction in the Al87-Sm4-Ni8-Cu1 ribbon treated to 375 °C + 30 min (Figure 8), where the metastable phase is the only one present.
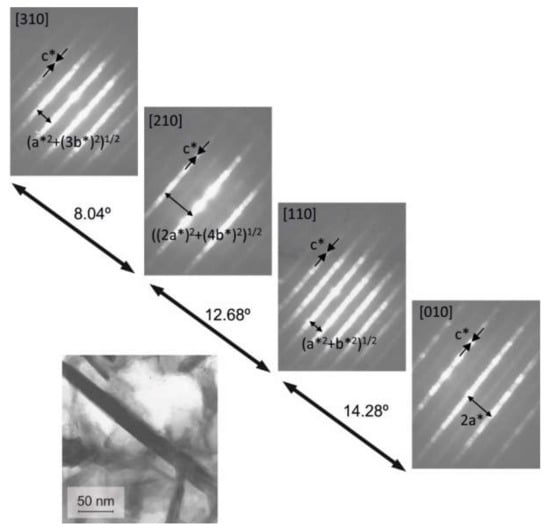
Figure 8.
TEM analysis of a metastable intermetallic particle in an Al87-Sm4-Ni8-Cu1 ribbon treated to 375 °C + 30 min. Angles between patterns and diffraction spot distances served to index DP.
The real lattice parameters obtained from spot distances of the reciprocal lattice in the DP of Figure 8 resulted in values for the metastable phase of about 0.41 nm, 1.86 nm, and 2.81 nm, certainly similar to those values considered for the Al19Sm3Ni5 phase (0.410 nm, 1.598 nm, and 2.689 nm). Although measurements were directly made on TEM DP images, the simulation after heat treating the ribbons to 375 °C + 30 min, as shown in Figure 9, was very similar to the experimental one, therefore corroborating the previous ideas.
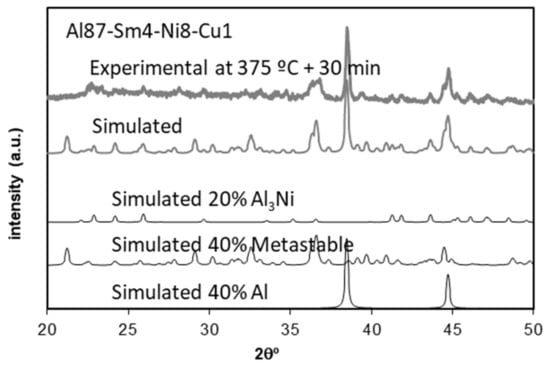
Figure 9.
XRD patterns of the Al87-Sm4-Ni8-Cu1 ribbon treated to 375 °C + 30 min. The simulated pattern considered proportions of 40/40/20 for Al, Al3Ni, and the metastable phase.
3.5. Microstructural Identification
Another aspect that was studied in this work was the shape of the intermetallics, depending on the RE used in the alloy. Al and Al3Ni particles always appeared with a relatively equiaxied morphology, however, some other differences can be found in the ternary phases.
Figure 10 shows the TEM micrographs of the different alloys after heating to 375 °C and held for 30 min. The Cu-free Y alloy showed relatively equiaxial shapes, with the Sm alloy with more elongated shapes. Adding Cu to these alloys makes them appear as elongated shapes or increases their length, reaching up to about 300 nm. On the other hand, Ce alloys always showed equiaxial shapes, independently of adding Cu or not.
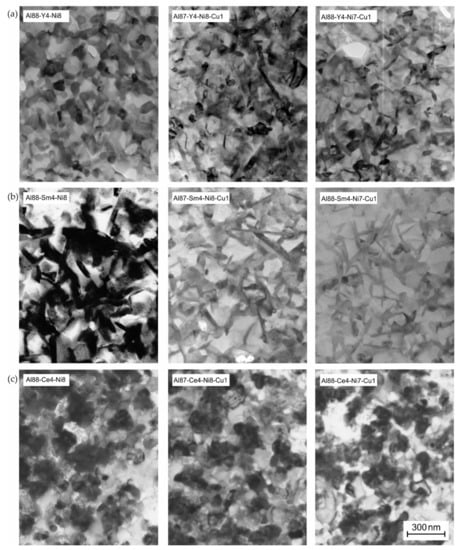
Figure 10.
TEM bright field images of heat treated ribbons to the 375 °C held for 30 min of (a) Y, (b) Sm, and (c) Ce-containing alloys.
According to Figure 10 and the XRD evolution shown in Figure 6, it could be established that for the Y and Sm-containing alloys, the longer the time the metastable phase is present in the alloy, the higher the trend to develop elongated shapes. As previously explained, the stable Al19RE3Ni5 phase of these alloys appeared without new nucleation and shape change from the metastable alloy, and therefore, the one growing with elongated shapes must be the metastable phase. The two extreme conditions were the Y-containing Cu-free alloy, where the metastable phase was not even detected by XRD and indeed, only equiaxial shapes were found, and the two Cu-containing Sm alloys, in which elongated shapes had more time to grow. For the Ce-containing alloys, in which no metastable phase was detected, the shape found was always equiaxial.
The TEM study after heating to higher temperatures corroborates this idea. Figure 11 shows the images after heating to 450 °C.
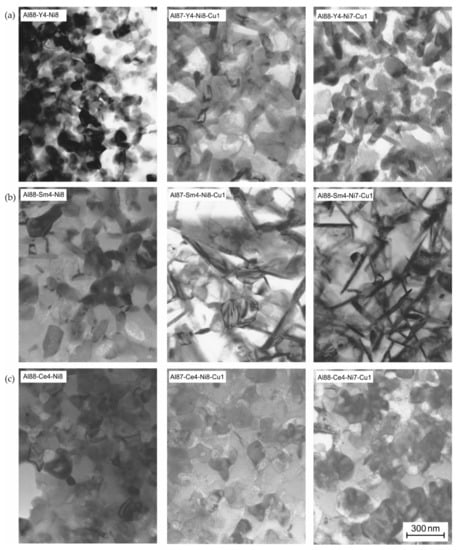
Figure 11.
TEM bright field images of heat treated ribbons up to 450 °C of (a) Y, (b) Sm, and (c) Ce-containing alloys.
As expected, after reviewing the XRD changes in Figure 6, the micrographs in Figure 11 of Y-containing alloys did not show evident changes, and neither did the Cu-free Sm alloy. This is because no changes were detected by XRD between both heat treatments. However, Cu-containing Sm alloys showed even longer shapes because at 450 °C, the stable phase was still present, and therefore the metastable phase had more time to grow. It has to be noted that the microstructures shown in Figure 11 correspond, in general, to the stable phases, and, as expected, the shapes were maintained during the change from the metastable to the stable phase. The similarities in structure make nucleation of the stable phase unnecessary, but just an easy adaptation to the new lattice parameters and composition.
Finally, previous ideas concerning the unidentified metastable phase to Al19RE3Ni5 transformation were confirmed by TEM microdiffraction on particular grains of heat treated ribbons to 450 °C (Figure 12). Indeed, the measurements on DP of the studied particles confirmed the expected lattice parameters.
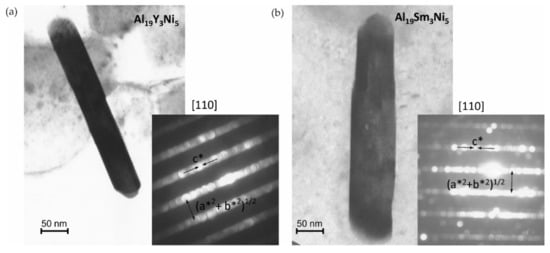
Figure 12.
TEM bright field images of Al19RE3Ni5 particles in ribbons treated to 450 °C, and microdiffraction patterns of (a) Al88-Y4-Ni7-Cu1, and (b) Al88-Sm4-Ni8 alloys. Reciprocal lattice parameters are used in DP.
4. Conclusions
Amorphous structure formation in Al88-RE4-Ni8 alloys was quite similar for the Y, Sm, and Ce-containing alloys, although the Sm and Ce alloys seemed to show a higher GFA. This was confirmed by the stability of the amorphous phase when heat treated. A 1 at.% Cu addition to the Al88-RE4-Ni8 amorphous alloys affected their GFA and very clearly their stability. Al substitution by Cu increased the amorphous structure stability, whereas Ni substitution by Cu decreased it.
Destruction of the amorphous structure started with a primary crystallization process leading to the formation of α-Al nanocrystals that were smaller when Cu was present in the alloy.
At higher temperatures the crystallization process continued in different ways for the Y and Sm-containing alloys on one side, and the Ce-containing alloys in the other. For the Y and Sm-containing alloys, Al3Ni and unidentified metastable Al-RE-Ni intermetallic particles nucleated in a second crystallization process, subsequently growing and transforming to the stable ternary phase Al19RE3Ni5 in the final stages of crystallization. The transformation to the stable phase was easier in the Y-containing alloys and also easier for the Cu-free alloys in both the Y and Sm alloys.
On the other hand, Ce-containing alloys seemed to evolve with the formation of Al3Ni and Al11Ce3 during the second reaction, and growth during the third reaction.
Regarding the shape of these intermetallic phases, for the Y and Sm-containing alloys, the metastable ternary phase appeared to have an elongated shape, with a higher stability in the Sm alloys allowing them to reach even longer shapes. Once transformed to the stable Al19RE3Ni5 phases, the shape reached in the metastable phase was maintained. This means that the transformation takes place without a nucleation process, but is only a structural transformation because of a similar structure in both the metastable and stable phases. According to the prevalence of the metastable phase, Cu-free Y alloys presented a clear equiaxial aspect, whereas phases in Cu-containing Sm alloys appeared with an elongated acicular morphology. On the other hand, Ce-containing alloys only showed phases with equiaxial shapes.
Author Contributions
Conceptualization, F.G.C. and S.L.-P.; Validation, F.G.C., S.L.-P., R.M.A., and R.A.; Writing—original draft, F.G.C.; Writing—review & editing, F.G.C. and S.L.-P. All authors have read and agreed to the published version of the manuscript.
Funding
This research was funded by the Ministerio de Economía y Competitividad (Spain) and Feder (EU), grant number DPI2015-69550-C2-2-P.
Acknowledgments
The authors also wish to thank Brian Cantor and Paul J. Warren for their helpful discussion and facilitating the initial experiments carried out at the Department of Materials, Oxford University.
Conflicts of Interest
The authors declare no conflicts of interest. The funders had no role in the design of the study; in the collection, analyses, or interpretation of data; in the writing of the manuscript, or in the decision to publish the results.
References
- Zanotto, E.D.; Mauro, J.C. The glassy state of matter: Its definition and ultimate fate. J. Non-Cryst. Solids 2017, 471, 490–495. [Google Scholar] [CrossRef]
- Kruzic, J.J. Bulk Metallic Glasses as Structural Materials: A Review. Adv. Eng. Mater. 2016, 18, 1308–1331. [Google Scholar] [CrossRef]
- Nair, N.B.; Priyadarshini, B.G. Process, structure, property and applications of metallic glasses. AIMS Mater. Sci. 2016, 3, 1022–1053. [Google Scholar] [CrossRef]
- Li, H.F.; Zheng, Y.F. Recent advances in bulk metallic glasses for biomedical applications. Acta Biomater. 2016, 36, 1–20. [Google Scholar] [CrossRef]
- Pershina, E.; Matveev, D.; Abrosimova, G.; Aroni, A. Formation of nanocrystals in an amorphous Al90Y10 alloy. Mater. Charact. 2017, 133, 87–93. [Google Scholar] [CrossRef]
- Inoue, A.; Ohtera, K.; Masumoto, T. New Amorphous Al-Y, Al-La and Al-Ce Alloys Prepared by Melt Spinning. Jpn. J. Appl. Phys. 1988, 27, L736. [Google Scholar] [CrossRef]
- Yin, J.; Cai, H.; Cheng, X.; Zhang, X. Al-based bulk metallic glass with large plasticity and ultrahigh strength. J. Alloy. Compd. 2015, 648, 276–279. [Google Scholar] [CrossRef]
- Eckert, J.; Das, J.; Pauly, S.; Duhamel, C. Mechanical properties of bulk metallic glasses and composites. J. Mater. Res. 2007, 22, 285–301. [Google Scholar] [CrossRef]
- Schroers, J. Processing of bulk metallic glass. Adv. Mater. 2010, 22, 1566–1597. [Google Scholar] [CrossRef]
- Suzuki, R.O.; Komatsu, Y.; Kobayashi, K.F.; Shingu, P.H. Formation and crystallization of Al-Fe-Si amorphous alloys. J. Mater. Sci. 1983, 18, 1195–1201. [Google Scholar] [CrossRef]
- Dini, K.; Dunlap, R.A. The relationship of the quasicrystalline icosahedral phase to the amorphous structure in rapidly quenched Al-Mn-Si and Al-Fe-Si alloys. J. Phys. F Met. Phys. 1986, 16, 1917–1925. [Google Scholar] [CrossRef]
- Tsai, A.P.; Inoue, A.; Masumoto, T. Ductile Al-Ni-Zr Amorphous Alloys with High Mechanical Strength. J. Mater. Sci. Lett. 1988, 7, 805–807. [Google Scholar] [CrossRef]
- He, Y.; Poon, S.J.; Shiflet, G.J. Synthesis and properties of metallic glasses that contain aluminium. Science 1988, 241, 1640–1642. [Google Scholar] [CrossRef] [PubMed]
- Inoue, A.; Ohtera, K.; Tsai, A.P.; Masumoto, T. New Amorphous Alloys with Good Ductility in Al-Y-M and Al-La-M (M=Fe, Co, Ni or Cu) Systems. Jpn. J. Appl. Phys. 1988, 27, L280. [Google Scholar] [CrossRef]
- Inoue, A.; Ohtera, K.; Kith, K.; Masumoto, T. New Amorphous Alloys with Good Ductility in Al-Ce-M (M=Nb, Fe, Co, Ni or Cu) Systems. Jpn. J. Appl. Phys. 1988, 27, L1796. [Google Scholar] [CrossRef]
- Inoue, A.; Ohtera, K.; Tsai, A.P.; Masumoto, T. Aluminum-Based Amorphous Alloys with Tensile Strength above 980 MPa (100 kg/mm2). Jpn. J. Appl. Phys. 1988, 27, L479. [Google Scholar] [CrossRef]
- Kim, Y.H.; Inoue, A.; Masumoto, T. Ultrahigh Mechanical Strengths of Al88Y2Ni10−xMx (M=Mn, Fe or Co) Amorphous Alloys Containing Nanoscale fcc-Al Particles. Mater. Trans. JIM 1991, 32, 599–608. [Google Scholar] [CrossRef]
- Inoue, A. Amorphous, nanoquasicrystalline and nanocrystalline alloys in Al-based systems. Prog. Mater. Sci. 1998, 43, 365–520. [Google Scholar] [CrossRef]
- Kim, Y.H.; Inoue, A.; Masumoto, T. Ultrahigh tensile strengths of Al88Y2Ni9Mi (M=Mn or Fe) amorphous alloys containing finely dispersed fcc-Al particles. Mater. Trans. JIM 1990, 31, 747–749. [Google Scholar] [CrossRef]
- Kim, Y.H.; Inoue, A.; Masumoto, T. Increase in Mechanical Strength of Al–Y–Ni Amorphous Alloys by Dispersion of Nanoscale fcc-Al Particles. Mater. Trans. JIM 1991, 32, 331–338. [Google Scholar] [CrossRef]
- Hofmann, D.C.; Suh, J.-Y.; Wiest, A.; Duan, G.; Lind, M.-L.; Demetriou, M.D.; Johnson, W.L. Designing metallic glass matrix composites with high toughness and tensile ductility. Nature 2008, 451, 1085–1089. [Google Scholar] [CrossRef] [PubMed]
- Abrosimova, G.E.; Aronin, A.S.; Zver’kova, I.I.; Kir’yanov, Y.V. Phase transformations upon crystallization of amorphous Al-Ni-RE alloys. Phys. Met. Metallogr. 2002, 94, 102–107. [Google Scholar]
- Li, Y.; Zhao, S.; Liu, Y.; Gong, P.; Schroers, J. How Many Bulk Metallic Glasses Are There? ACS Comb. Sci. 2017, 19, 687–693. [Google Scholar] [CrossRef] [PubMed]
- Chen, Z.P.; Gao, J.E.; Wu, Y.; Wang, H.; Liu, X.J.; Lu, Z.P. Designing novel bulk metallic glass composites with a high aluminum content. Sci. Rep. 2013, 3, 3353. [Google Scholar] [CrossRef]
- Maurya, R.S.; Sahu, A.; Laha, T. Quantitative phase analysis in Al86Ni8Y6 bulk glassy alloy synthesized by consolidating mechanically alloyed amorphous powder via spark plasma sintering. Mater. Des. 2016, 93, 96–103. [Google Scholar] [CrossRef]
- Maurya, R.S.; Sahu, A.; Laha, T. Effect of consolidation pressure on phase evolution during sintering of mechanically alloyed Al86Ni8Y6 amorphous powders via spark plasma sintering. Mater. Sci. Eng. A 2016, 649, 48–56. [Google Scholar] [CrossRef]
- Lay, M.D.H.; Hill, A.J.; Saksida, P.G.; Gibson, M.A.; Bastow, T.J. 27Al NMR measurement of fcc Al configurations in as-quenched Al85Ni11Y4 metallic glass and crystallization kinetics of Al nanocrystals. Acta Mater. 2012, 60, 79–88. [Google Scholar] [CrossRef]
- Kim, Y.K.; Soh, J.R.; Kim, D.K.; Lee, H.M. Glass formation in metallic Al-Ni-Y. J. Non-Cryst. Solids 1998, 242, 122–130. [Google Scholar] [CrossRef]
- Styles, M.J.; Sun, W.W.; East, D.R.; Kimpton, J.A.; Gibson, M.A.; Hutchinson, C.R. On the competition in phase formation during the crystallisation of Al-Ni-Y metallic glasses. Acta Mater. 2016, 117, 170–187. [Google Scholar] [CrossRef]
- Shen, Y.; Perepezko, J.H. Al-based amorphous alloys: Glass-forming ability, crystallization behavior and effects of minor alloying additions. J. Alloy. Compd. 2017, 707, 3–11. [Google Scholar] [CrossRef]
- Sun, S.P.; Yi, D.Q.; Liu, H.Q.; Zang, B.; Jiang, Y. Calculation of glass forming ranges in Al–Ni–RE (Ce, La, Y) ternary alloys and their sub-binaries based on Miedema’s model. J. Alloy. Compd. 2010, 506, 377–387. [Google Scholar] [CrossRef]
- De Oliveira, M.F.; Aliaga, L.C.R.; Bolfarini, C.; Botta, W.J.; Kiminami, C.S. Thermodynamic and topological instability approaches for forecasting glass-forming ability in the ternary Al-Ni-Y system. J. Alloy. Compd. 2008, 464, 118–121. [Google Scholar] [CrossRef]
- Triveño Rios, C.; Suriñach, S.; Baró, M.D.; Bolfarini, C.; Botta, W.J.; Kiminami, C.S. Glass forming ability of the Al–Ce–Ni system. J. Non-Cryst. Solids 2008, 354, 4874–4877. [Google Scholar]
- Zhang, Z.; Xiong, X.Z.; Zhou, W.; Lin, X.; Inoue, A.; Li, J.F. Glass forming ability and crystallization behavior of Al–Ni–RE metallic glasses. Intermetallics 2013, 42, 23–31. [Google Scholar] [CrossRef]
- Wang, Q.; Li, J.H.; Liu, J.B.; Liu, B.X. Atomistic Design of Favored Compositions for Synthesizing the Al-Ni-Y Metallic Glasses. Sci. Rep. 2015, 5, 16218. [Google Scholar] [CrossRef] [PubMed]
- Yang, B.J.; Yao, J.H.; Zhang, J.; Yang, H.W.; Wang, J.Q.; Ma, E. Al-rich bulk metallic glasses with plasticity and ultrahighspecific strength. Scr. Mater. 2009, 61, 423–426. [Google Scholar] [CrossRef]
- Yewondwossen, M.; Dunlap, R.A.; Lloyd, D.J. Thermal and electronic properties of amorphous Al87Y8Ni5-xTMx (TM=Mn, Fe, CO, Cu). J. Phys. Condens. Matter 1992, 4, 461–472. [Google Scholar] [CrossRef]
- Hong, S.J.; Warren, P.J.; Chun, B.S. Nanocrystallization behaviour of Al–Y–Ni with Cu additions. Mater. Sci. Eng. A 2001, 304–306, 362–366. [Google Scholar] [CrossRef]
- Squire, P.J.; Chang, I.T.H. Development of rapidly solidified Al–Y–Ni-based alloys. Mater. Sci. Eng. A 2007, 449–451, 1009–1012. [Google Scholar] [CrossRef]
- Chen, S.F.; Chen, C.Y.; Lin, C.H. Insight on the glass-forming ability of Al-Y-Ni-Ce bulk metallic glass. J. Alloy. Compd. 2015, 637, 418–425. [Google Scholar] [CrossRef]
- Gögebakan, M. The Effect of Si Addition on Crystallization Behavior of Amorphous Al-Y-Ni Alloy. J. Mater. Eng. Perform. 2004, 13, 504–508. [Google Scholar] [CrossRef]
- Chen, S.F.; Chen, J.K.; Lin, S.L.; Lin, Y.L. Effects of B upon glass forming ability of Al87Y8Ni5 amorphous alloy. J. Alloy. Compd. 2013, 565, 29–36. [Google Scholar] [CrossRef]
- Jun, J.H.; Kim, J.M.; Kim, K.T.; Jung, W.J. Glass formability and thermal stability of Al–Ni–Y–Be amorphous alloys. J. Alloy. Compd. 2007, 434–435, 190–193. [Google Scholar] [CrossRef]
- Latuch, J.; Kokoszkiewicz, A.; Matyja, H. The Effect of Cu Addition on the Formation of fcc-Al Phase in Rapidly Quenched Al-Y-Ni Alloys. Mater. Sci. Eng. A 1997, 226–228, 809–812. [Google Scholar] [CrossRef]
- Kim, W.T.; Gogebakan, M.; Cantor, B. Heat treatment of amorphous Al85Y5Ni10 and Al85Y10Ni5 alloys. Mater. Sci. Eng. A 1997, 226–228, 178–182. [Google Scholar] [CrossRef]
- Yang, H.W.; Wang, J.Q. Evidence of structure relaxation prior to nanocrystallization in an Al-based metallic glass. Scr. Mater. 2006, 55, 359–362. [Google Scholar] [CrossRef]
- Greer, A.L. Confusion by Design. Nature 1993, 366, 303–304. [Google Scholar] [CrossRef]
- Huang, Z.H.; Li, J.F.; Rao, Q.L.; Zhou, Y.H. Primary crystallization of Al–Ni–RE amorphous alloys with different type and content of RE. Mater. Sci. Eng. A 2008, 489, 380–388. [Google Scholar] [CrossRef]
- Zhang, Z.; Zhou, W.; Xiong, X.Z.; Kong, L.T.; Li, J.F. Glass forming ability and primary crystallization behavior of Al–Ni–Ce alloys. Intermetallics 2012, 24, 1–6. [Google Scholar] [CrossRef]
- Rachek, O.P. X-ray diffraction study of amorphous alloys Al–Ni–Ce–Sc with using Ehrenfest’s formula. J. Non-Cryst. Solids 2006, 352, 3781–3786. [Google Scholar] [CrossRef]
- Gich, M.; Gloriant, T.; Suriñach, S.; Greer, A.L.; Baró, M.D. Glass forming ability and crystallisation processes within the Al-Ni-Sm system. J. Non-Cryst. Solids 2001, 289, 214–220. [Google Scholar] [CrossRef]
- Gogebakan, M.; Warren, P.J.; Cantor, B. Crystallization behaviour of amorphous Al85Y11Ni4 alloy. Mater. Sci. Eng. A 1997, 226–228, 168–172. [Google Scholar] [CrossRef]
- Sun, F.; Gloriant, T. Primary crystallization process of amorphous Al88Ni6Sm6 alloy investigated by differential scanning calorimetry and by electrical resistivity. J. Alloy. Compd. 2009, 477, 133–138. [Google Scholar] [CrossRef]
- Battezzati, L.; Rizzi, P.; Rontó, V. The difference in devitrification paths in Al87Ni7Sm6 and Al87Ni7La6 amorphous alloys. Mater. Sci. Eng. A 2004, 375–377, 927–931. [Google Scholar] [CrossRef]
- Latuch, J.; Matyja, H.; Fadeeva, V.I. Crystallization of amorphous A185Y10Ni5 and A185Y5Ni10 alloys. Mater. Sci. Eng. A 1994, 179–180, 506–510. [Google Scholar] [CrossRef]
- Saini, S.; Zaluska, A.; Altounian, Z. Effect of glass short-range order on crystallization onset in Al-Y-Ni glasses. J. Non-Cryst. Solids 1999, 250–252, 714–718. [Google Scholar] [CrossRef]
- Ko, B.C.; Yoo, Y.C. High temperature deformation behavior of Al85Ni10Y5 alloy produced by hot extrusion using an amorphous ribbon. J. Mater. Sci. Lett. 1999, 18, 1765–1768. [Google Scholar] [CrossRef]
- Jindal, R.; Raja, V.S.; Gibson, M.A.; Styles, M.J.; Bastow, T.J.; Hutchinson, C.R. Effect of annealing below the crystallization temperature on the corrosion behavior of Al–Ni–Y metallic glasses. Corros. Sci. 2014, 84, 54–65. [Google Scholar] [CrossRef]
- Kuball, A.; Stolpe, M.; Busch, R. Crystallization behavior of the Al86Ni8Y6 metallic glass forming alloy upon rapid cooling. J. Alloy. Compd. 2018, 737, 398–404. [Google Scholar] [CrossRef]
- Cao, B.; Li, S.; Yi, D. Study on the crystallization of Al88.5Y6.5Ni5 (at.%) amorphous alloy. J. Less-Common Met. 1991, 171, 1–8. [Google Scholar] [CrossRef]
- Zhang, Y.; Warren, P.J.; Cerezo, A. Effect of Cu addition on nanocrystallization of Al-Ni-Sm amorphous alloy. Mater. Sci. Eng. A 2002, 327, 109–115. [Google Scholar] [CrossRef]
- Battezzati, L.; Kusy, M.; Rizzi, P.; Ronto, V. Devitrification of Al-Ni-Rare Earth amorphous alloys. J. Mater. Sci. 2004, 39, 3927–3934. [Google Scholar] [CrossRef]
- Gloriant, T.; Greer, A.L. Al-Based nanocrystalline composites by rapid solidification of Al-Ni-Sm alloys. Nanostrudured Mater. 1998, 10, 389–396. [Google Scholar] [CrossRef]
- Rontó, V.; Battezzati, L.; Yavari, A.R.; Tonegaru, M.; Lupu, N.; Heunen, G. Crystallization behaviour of Al87Ni7La6 and Al87Ni7Sm6 amorphous alloys. Scr. Mater. 2004, 50, 839–843. [Google Scholar] [CrossRef]
- Anghelus, A.; Avettand-Fènoël, M.N.; Cordier, C.; Taillard, R. Thermal crystallization of an Al88Ni6Sm6 metallic glass. J. Alloy. Compd. 2015, 651, 454–464. [Google Scholar] [CrossRef]
- Uporov, S.A.; Ryl’tsev, R.E.; Uporova, N.S.; Bykov, V.A.; Murzakaev, A.M.; Pryanichnikov, S.V. Structural and Magnetic Peculiarities of Al86Ni8Sm6 Alloy in Amorphous, Crystalline, and Liquid States. Phys. Met. Metallogr. 2015, 116, 128–135. [Google Scholar] [CrossRef]
- Révész, Á.; Varga, L.K.; Nagy, P.M.; Lendvai, J.; Bakonyi, I. Structure and thermal stability of melt-quenched Al92-xNi8(Ce,Sm)x alloys with x = 1, 2 and 4. Mater. Sci. Eng. A 2003, 351, 160–165. [Google Scholar] [CrossRef]
- Anghelus, A.; Avettand-Fènoël, M.N.; Cordier, C.; Taillard, R. Microstructural evolution of aluminium/Al–Ni–Sm glass forming alloy laminates obtained by Controlled Accumulative Roll Bonding. J. Alloy. Compd. 2015, 631, 209–218. [Google Scholar] [CrossRef]
- Illeková, E.; Duhaj, P.; Mrafko, P.; Svec, P. Influence of Pd on crystallization of Al–Ni–Sm-based ribbons. J. Alloy. Compd. 2009, 483, 20–23. [Google Scholar] [CrossRef]
- Hono, K.; Zhang, Y.; Inoue, A.; Sakurai, T. Atom Probe Studies of Nanocrystalline Microstructural Evolution in Some Amorphous Alloys. Mater. Trans. JIM 1995, 36, 909–917. [Google Scholar] [CrossRef]
- Cuevas, F.G.; Lozano-Perez, S.; Aranda, R.M.; Ternero, F. Crystallisation of amorphous Al-Y-Ni-(Cu) alloys. J. Non-Cryst. Solids 2019, 512, 15–24. [Google Scholar] [CrossRef]
- Matsuura, M.; Sakurai, M.; Suzuki, K.; Tsai, A.P.; Inoue, A. Local structure change of Ce and Cu in the course of nanocrystalline formation from amorphous Al87Ni8Ce3Cu2. Mater. Sci. Eng. A 1997, 226–228, 511–514. [Google Scholar] [CrossRef]
- Perepezko, J.H.; Imhoff, S.D.; Hebert, R.J. Nanostructure development during devitrification and deformation. J. Alloy. Compd. 2010, 495, 360–364. [Google Scholar] [CrossRef]
- Kim, D.H.; Kim, W.T.; Park, E.S.; Mattern, N.; Eckert, J. Phase separation in metallic glasses. Prog. Mater. Sci. 2013, 58, 1103–1172. [Google Scholar] [CrossRef]
- Louzguine, D.V.; Inoue, A. Influence of a supercooled liquid on crystallization behaviour of Al–Y–Ni–Co metallic glass. Mater. Lett. 2002, 54, 75–80. [Google Scholar] [CrossRef]
- Bassim, N.; Kiminami, C.S.; Kaufman, M.J.; Oliveira, M.F.; Perdigao, M.N.R.V.; Botta Filho, W.J. Crystallization behavior of amorphous Al84Y9Ni5Co2 alloy. Mater. Sci. Eng. A 2001, 304–306, 332–337. [Google Scholar] [CrossRef]
- Raggio, R.; Borzone, G.; Ferro, R. The Al-rich region in the Y-Ni-Al system: Microstructures and phase equilibria. Intermetallics 2000, 8, 247–257. [Google Scholar] [CrossRef]
- Vasiliev, A.L.; Aindow, M.; Blackburn, M.J.; Watson, T.J. Phase Stability and Microstructure in Devitrified Al-Rich Al-Y-Ni Alloys. Intermetallics 2004, 12, 349–362. [Google Scholar] [CrossRef]
- Mudry, S.; Kulyk, Y.; Mykhaylyuk, V.; Tsizh, B. Structure changes in Al80Ni15Y5 amorphous alloy. J. Non-Cryst. Solids 2008, 354, 4488–4490. [Google Scholar] [CrossRef]
- Golumbfskie, W.J.; Arroyave, R.; Shin, D.; Liu, Z.-K. Finite-temperature thermodynamic and vibrational properties of Al–Ni–Y compounds via first-principles calculations. Acta Mater. 2006, 54, 2291–2304. [Google Scholar] [CrossRef]
- Shin, D.; Golumbfskie, W.J.; Ryba, E.R.; Liu, Z.-K. First-principles study of Al–Ni–Y ternary compounds for crystal structure validation. J. Alloy. Comp. 2008, 462, 262–266. [Google Scholar] [CrossRef]
- Golumbfskie, W.J.; Prins, S.N.; Eden, T.J.; Liu, Z.-K. Predictions of the Al-rich region of the Al–Co–Ni–Y system based upon first-principles and experimental data. CALPHAD 2009, 33, 124–135. [Google Scholar] [CrossRef]
- Sha, P.F.; Qi, Z.; Zhang, Z.H. Effect of Ag or Pd additions on the microstructure, crystallization and thermal stability of Al–Ni–Ce amorphous alloys. Intermetallics 2010, 18, 1699–1706. [Google Scholar] [CrossRef]
- Triveño Rios, C.; Suriñach, S.; Baró, M.D.; Bolfarini, C.; Botta, W.J.; Kiminami, C.S. Crystallization behavior of amorphous alloys in the Al-Ce-Ni system. Rev. Adv. Mater. Sci. 2008, 18, 469–475. [Google Scholar]
- Delsante, S.; Raggio, R.; Borzone, G. Phase relations of the Sm–Ni–Al ternary system at 500 °C in the 40–100 at.% Al region. Intermetallics 2008, 16, 1250–1257. [Google Scholar] [CrossRef]
- Nolze, G.; Klaus, W. PowderCell 2.0 for Windows. Powder Diffr. 1998, 13, 256–259. [Google Scholar]


© 2020 by the authors. Licensee MDPI, Basel, Switzerland. This article is an open access article distributed under the terms and conditions of the Creative Commons Attribution (CC BY) license (http://creativecommons.org/licenses/by/4.0/).