Article

Evaluation of Non-Equibiaxial Residual Stresses in Metallic Materials via Instrumented Spherical Indentation

1
College of Mechanical Engineering, Zhejiang University of Technology, Hangzhou 310023, China
2
Key Laboratory of E&M (Zhejiang University of Technology), Ministry of Education & Zhejiang Province, Hangzhou 310023, China
3
College of Engineering, Zhejiang Normal University, Jinhua 321004, China
4
Institute of Solid Mechanics, Beihang University, Beijing 100191, China
*
Authors to whom correspondence should be addressed.
Metals 2020, 10(4), 440; https://doi.org/10.3390/met10040440
Submission received: 24 February 2020 / Revised: 24 March 2020 / Accepted: 25 March 2020 / Published: 27 March 2020

Abstract

:
Residual stresses, existed in engineering structures, could significantly influence the mechanical properties of structures. Accurate and non-destructive evaluation of the non-equibiaxial residual stresses in these structures is of great value for predicting their mechanical performance. In this work, investigating the mechanical behaviors of instrumented spherical indentation on stressed samples revealed that non-equibiaxial residual stresses could shift the load-depth curve upwards or downwards and cause the residual indentation imprint to be an elliptical one. Through theoretical, experimental, and finite element (FE) analyses, two characteristic indentation parameters, i.e., the relative change in loading curvature and the asymmetry factor of the residual indentation imprint, were found to have optimal sensitivity to residual stresses at a depth of 0.01R (R is the radius of spherical indenter). With the aid of dimensional analysis and FE simulations, non-equibiaxial residual stresses were quantitatively correlated with these two characteristic indentation parameters. The spherical indentation method was then proposed to evaluate non-equibiaxial residual stress based on these two correlations. Applications were illustrated on metallic samples (AA 7075-T6 and AA 2014-T6) with various introduced stresses. Both the numerical and experimental verifications demonstrated that the proposed method could evaluate non-equibiaxial surface residual stresses with reasonable accuracy.

1. Introduction

Residual stresses, which could significantly influence the mechanical properties, such as fracture, fatigue, wear, and corrosion, commonly exist in engineering structures, especially in coatings and films due to the mechanical or thermal mismatch between coatings/films and substrates. Accurate and non-destructive evaluation of residual stresses is of great value for predicting the mechanical performance and durability of such structures. In recent years, instrumented indentation testing has shown the advantages of simplicity, convenience, and accuracy to determine surface residual stresses, as well as mechanical properties in a non-destructive way [1,2,3]. Researchers have investigated the effects of residual stresses or pre-stresses on indentation behavior [4,5,6,7,8,9,10,11,12,13], and the number of methods have been proposed to estimate residual stresses using instrumented indentation with different indenters [14,15,16,17,18,19,20,21,22,23,24,25,26,27,28,29,30,31,32,33]. The development of indentation methods has mainly gone through two stages. The first stage is focusing on the measurement of equibiaxial residual stresses, which is relatively straightforward because it is not necessary to determine the directionality of principal residual stresses [14,15,16,17,18,19,20,21,22,23,24,25,26,27]. The second stage is to strive for evaluating non-equibiaxial residual stresses, which is more complicated because both the magnitude and directionality of principal residual stresses must be determined [28,29,30,31,32,33].
For equibiaxial residual stress evaluation, there is only a need to calculate the magnitude of residual stresses. The basic principle was first reported by Bolshakov et al. [4] and Tsui et al. [5] that the indentation load-depth (F-h) curve tends to be shifted upwards by compressive residual stress and downwards by tensile residual stress compared to the unstressed state, and the magnitude of residual stress can be related to the change in indentation parameters between stressed and unstressed samples. Suresh et al. [14] and Carlsson et al. [16] pointed out that equibiaxial residual stress could be correlated with the contact area ratio between stressed and unstressed samples in the instrumented sharp indentation. Lu et al. [19] established a bilinear relationship between equibiaxial residual stress and the relative change in loading curvature of instrumented sharp indentation. Recently, Peng et al. [25] used load difference between stressed and stress-free samples as the characteristic parameter to estimate equibiaxial residual stress via instrumented spherical indentation. Wang et al. [26] proposed a method to extract the equibiaxial residual stress and mechanical properties of metallic materials by continuous spherical indentation tests. Kim et al. [27] suggested a method to evaluate equibiaxial residual stress without using a reference sample (i.e., stress-free sample) by estimating a stress-free indentation curve using stress-independent indentation parameters. Although these methods for evaluating equibiaxial residual stress have been validated by experiments, the application faces limitations in actual situations because most of the residual stresses, existed in engineering structures, are non-equibiaxial residual stresses.
Developing non-equibiaxial residual stress evaluation method has more practical significance, and also faces more challenges. For non-equibiaxial residual stresses, both the magnitude and directionality of principal stresses must be determined. Thus, extra indentation parameter that is sensitive to the directionality of principal stresses should be found out to be correlated with the directionality. The sensitive parameters might be different when different shapes of indenters are used in instrumented indentation tests. Among the indentation methods for non-equibiaxial residual stresses evaluation, two categories of indenters, i.e., two-fold symmetric indenters (Knoop and wedge indenter) and spherical indenter, are often used. For indentation tests on the same stressed sample with two-fold symmetric indenter, Han et al. [34], Choi et al. [35], and Rickhey et al. [23] found that the load-depth curve changed with the rotation of the indenter, meaning the load-depth curve was sensitive to the orientation of the Knoop indenter with respect to the principal stress directions. Based on this phenomenon, Kim et al. [31,32] used the load differences between stressed and unstressed samples to evaluate the magnitude and direction of principal residual stresses by carrying out four Knoop indentations at 45° rotated angles. Similarly, Ahn et al. [33] developed an indentation method to determine the directionality of residual stresses through two orthogonal wedge indentations. An inconvenience of such methods is that it needs to conduct multiple indentation tests to evaluate non-equibiaxial residual stresses. This means the Knoop and wedge methods do not measure the residual stress at a point but estimate the average residual stress within the tested region. For instrumented spherical indentations on samples with non-equibiaxial stresses, Shen et al. [30] found that the pile-up height around a residual indentation imprint was non-uniform. The spherical indentation method was then presented to estimate non-equibiaxial residual stresses by relating the magnitude of stress to the pile-up height. Recently, in our previous work [12], it has been found that the existence of non-equibiaxial residual stresses can lead the residual indentation imprint to be an elliptical one after spherical indentation, and the ratio of the major axis to minor axis is dependent on the directionality of residual stresses.
In the present work, through numerical and experimental investigation of the spherical indentation behavior on elastic-power-law strain-hardening solids with non-equibiaxial residual stresses, it was revealed that the load-depth curve and the top-view morphology of the elliptical residual indentation imprint had good sensitivity to residual stresses at an optimal indentation depth of 0.01R (R is the radius of spherical indenter). With the aid of dimensional analysis and finite element (FE) analysis, two sensitive parameters, i.e., the loading curvature of the load-depth curve and the asymmetry factor of the elliptical residual indentation imprint, were correlated with the non-equibiaxial residual stresses. Based on these correlations, a spherical indentation method was established for the evaluation of non-equibiaxial residual stress. Since the plastic parameters (i.e., yield strain, ε y , and strain-hardening exponent, n ) of the tested materials are also involved in the established correlations, to calculate residual stresses, these plastic parameters must be known a priori. Fortunately, either uniaxial tensile/compressive tests or spherical indentation tests [36,37,38,39,40,41,42] could be utilized to determine the plastic parameters. Patel et al. [39] established a protocol to obtain the uniaxial stress-strain curve directly from the spherical indentation stress-strain curve by introducing a scaling factor. Very recently, based on Ludwik–Hollomon and Voce equations, Campbell et al. developed iterative FE approaches to automatically extract plastic parameters from the spherical indentation load-depth curves [40] and the residual indent profile [41]. They also suggested that the indent profile was more sensitive to the plastic parameter values than load-depth curves. To alleviate the issue of non-uniqueness in indentation-based material characterization, Meng et al. [42] proposed a multi-depth indentation strategy. It should be noted that to determine the plastic parameters via spherical indentation, the indentation tests on the unstressed sample must be deep enough (in the fully plastic state) to achieve good sensitivity [39,40,41,42].

2. Establishment of Method

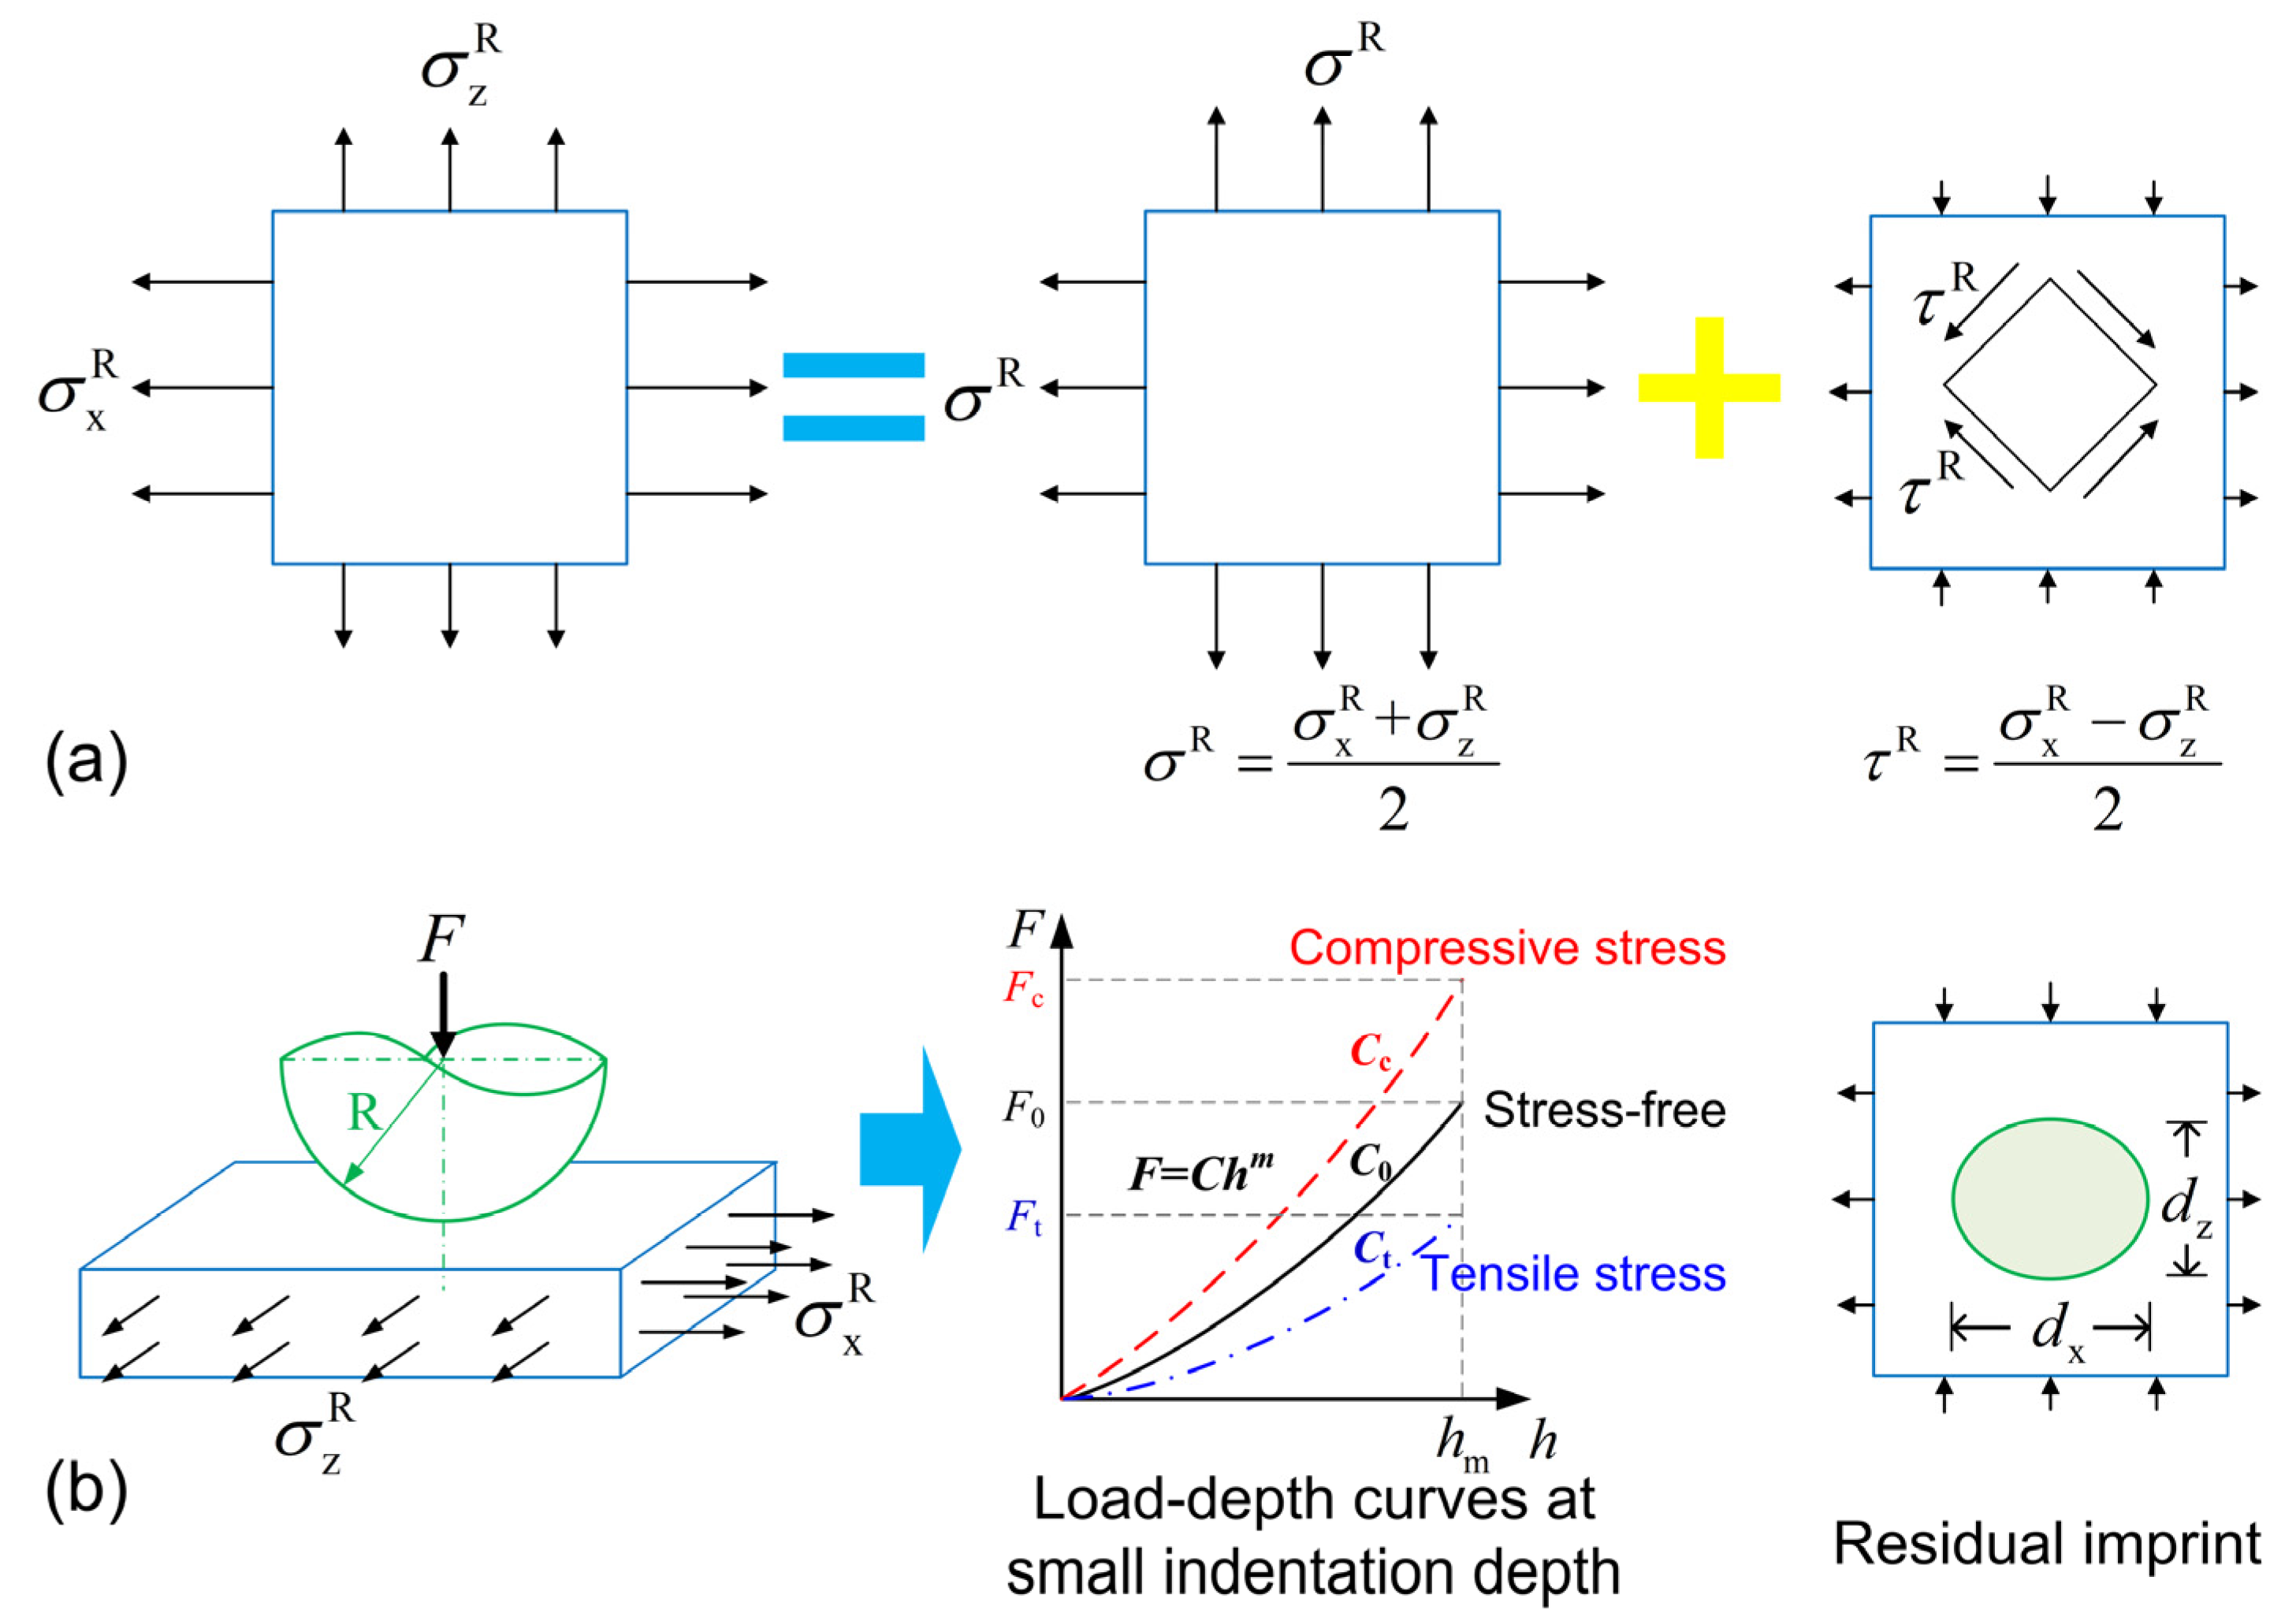
2.1. Basic Principle for Non-Equibiaxial Residual Stress Evaluation

As shown in Figure 1a, an arbitrary non-equibiaxial residual stress ( σ x R , σ z R ) could be decomposed into the equibiaxial stress part, σ R = ( σ x R + σ z R ) / 2 , and the shear stress part, τ R = ( σ x R σ z R ) / 2 . For spherical indentation, as illustrated in Figure 1b, both the equibiaxial and shear parts were found to have an influence on the shifting of load-depth curves in our previous work. Furthermore, the shear stress part was found to be the main reason for causing an elliptical residual indentation imprint, and the asymmetry of the elliptical indentation is affected by both the equibiaxial and shear stress parts [12]. Thus, the basic principle for the evaluation of residual stresses ( σ x R , σ z R ) is to quantitatively correlate the equibiaxial and shear stress parts with the shifting of load-depth curves, as well as the asymmetry of residual indentation imprint. The direction of the maximum principal stress could be straightforwardly determined from the direction of the major axis of elliptical indentation imprint.

2.2. Determination of the Optimal Indentation Depth

As discussed above, non-equibiaxial residual stresses could cause the residual indentation imprint of spherical indentation to become an elliptical one. To quantitively describe the asymmetry of the elliptical imprint, an asymmetry factor was defined as λ = ( d x d z ) / ( d x + d z ) , where d x is the major axis, and d z is the minor axis for the elliptical residual indentation imprint, as shown in Figure 1b. The major and minor axes could be accurately measured from the top-view morphology of the elliptical residual indentation imprint using an optical microscope.
To determine the optimal indentation depth for evaluating non-equibiaxial residual stress, FE simulations and experiments of spherical indentations on the same stressed sample at different maximum indentation depths were carried out. As shown in Figure 2, observation and measurement of the residual indentation imprint revealed that the asymmetry factor of the elliptical imprint decreased with the increase of the normalized indentation depth. This meant the sensitivity of the asymmetry factor to the non-equibiaxial residual stresses became weaker at a large indentation depth. Thus, the optimal indentation depth should locate at small indentation depth.
Taljat and Pharr [15] reported that the spherical indentation responses had optimal sensitivity to residual stresses when the indentation tests were implemented within the elastic-plastic transition regime. In our previous work [25], based on the Hertz theory of elastic contact and Johnson’s spherical cavity model [43], the corresponding indentation depth range for the elastic-plastic transition regime has been found to mainly depend on the sample’s yield strain, ε y , and the indentation depth range is determined by
5.41 ε y 2 h R 661.16 ε y 2
where h is the indentation depth, and R is the radius of the spherical indenter. Generally, the yield strain for metals ranges from 0.002 to 0.01. According to Equation (1), the corresponding indentation depth range is 0.00002 h / R 0.00264 for yield strain of 0.002, 0.00009 h / R 0.01058 for yield strain of 0.004, and 0.00054 h / R 0.06612 for yield strain of 0.01. Since there is no intersection between the above three depth ranges, it is not possible to obtain an optimal indentation depth for all metals. The present study turned to focus on evaluating the non-equibiaxial residual stresses in metallic alloys (such as AA 7075 and AA 2014), which possess large yield strain in the range of 0.004–0.010. In this situation, the optimal indentation depth should be in the elastic-plastic transition range of 0.00054 h / R 0.01058 . Under this premise, the indentation depth should be as large as possible to improve the measurement accuracy in practical indentation tests. Thus, the optimal indentation depth was fixed at h m / R = 0.01 .

2.3. Selection of Sensitive Characteristic Parameters

The existence of residual stresses could shift the indentation load-depth curve upwards or downwards compared with the curve for the stress-free state. The shifting amount of the load-depth curve could be characterized by the relative change in load, [ ( F F 0 ) / F 0 ] h / R = const , where F and F 0 are the indentation load for the stressed sample and stress-free sample at a given depth, respectively. However, the indentation load at a given depth is an instantaneous parameter, and the measurement accuracy of load might be influenced by noise and vibration at that moment in practical tests. Through FE simulations of spherical indentation on samples with various residual stresses (the details of FE simulations have been described in Section 2.5), it was found that the load-depth curve for the loading segment in the indentation depth range of 0 to 0.01R could be approximated by
F = C h m
where C is the loading curvature, h is the indentation depth, and m is the loading exponent. The load-depth curve of nine simulated materials with various residual stresses was fitted using Equation (2). Due to the limitation of space, the fitting curves and fitting parameters for a representative material (elastic modulus, E = 100   GPa , Poisson’s ratio, ν = 0.3 , yield strain, ε y = 0.007 , strain-hardening exponent, n = 0.15 ) are shown in Figure 3 and listed in Table 1, respectively. It could be found from Table 1 that the relative changes in loading exponent, m , between stressed and stress-free samples were commonly within ±1%. This meant the residual stresses mainly influenced the loading curvature and had a negligible effect on the loading exponent for the same material. A similar conclusion could be drawn from other simulated materials. Thus, the relative change in loading curvature between stressed and stress-free samples, ( C C 0 ) / C 0 , which is an integral parameter, was employed to characterize the shifting amount of the load-depth curve. Compared with the instantaneous parameter, the integral parameter was a more stable parameter that could minimize the influence of noise and vibration.
Based on the above discussion, the relative change in loading curvature, ( C C 0 ) / C 0 , and the asymmetry factor, λ = ( d x d z ) / ( d x + d z ) , were selected as the two characteristic parameters to be correlated with non-equibiaxial residual stresses in the following analyses.

2.4. Determination of Dimensionless Relationships through Dimensional Analysis

The spherical indentation of stressed metal samples could be approximately modeled as a spherical indenter penetrating into linear elastic-power-law strain-hardening solids with residual stresses. During the loading segment of indentation, the loading curvature, C , was a function of the sample’s mechanical parameters (i.e., elastic modulus, E , Poisson’s ratio, ν , yield strength, σ y , and strain-hardening exponent, n ), the spherical indenter’s parameters (i.e., elastic modulus, E i , Poisson’s ratio, ν i , and radius, R ), as well as the residual stress components (i.e., the equibiaxial stress part, σ R , and shear stress part, τ R ). It could be written as
C = f ( E , ν , σ y , n ; E i , ν i , R ; σ R , τ R )
For stress-free samples, the loading curvature, C 0 , was expressed as
C 0 = f 0 ( E , ν , σ y , n ; E i , ν i , R )
Generally, spherical indenters with a large diameter are made of tungsten carbide (WC), and the elastic modulus and Poisson’s ratio of WC indenters are 537 GPa and 0.23, respectively. In addition, Poisson’s ratio of tested metal samples can be regarded as a constant value of 0.3. When the parameters ( ν ;   E i ,   ν i ) are treated as constants, Equations (3) and (4) can be, respectively, simplified to
C = f ( E , σ y , n ; R ; σ R , τ R )
And
C 0 = f 0 ( E , σ y , n ; R )
Applying the Π theorem in dimensional analysis, Equations (5) and (6) can be rewritten as
C = E R 2 m Π ( σ y E , n ; σ R σ y , τ R σ y )
And
C 0 = E R 2 m Π 0 ( σ y E , n )
From Equations (7) and (8), the relative change in loading curvature, ( C C 0 ) / C 0 , between stressed and stress-free samples is given by
C C 0 C 0 = Π ( σ y E , n ; σ R σ y , τ R σ y ) Π 0 ( σ y E , n ) Π 0 ( σ y E , n ) = Π C ( ε y , n ; σ R σ y , τ R σ y )
where the sample’s yield strain, ε y = σ y / E .
In terms of elliptical residual indentation imprint, the asymmetry factor, λ , depends on the mechanical parameters of samples, the mechanical and geometrical parameters of spherical indenters, the residual stress components, as well as the maximum indentation depth, h m . It can be expressed as
λ = g ( E , ν , σ y , n ; E i , ν i , R ; σ R , τ R ; h m )
Similarly, assuming that WC indenters are used in the tests, and the tested metal samples have a Poisson’s ratio round 0.3, the application of the Π theorem leads to
λ = Π λ ( σ y E , n ; σ R σ y , τ R σ y ; h m R )
As discussed in Section 2.2, the optimal indentation depth was fixed at h m / R = 0.01 , and Equation (11) could be further simplified to
λ = Π λ ( ε y , n ; σ R σ y , τ R σ y )
The dimensionless Equations (9) and (12) clearly showed that the relative change in loading curvature and the asymmetry factor of residual indentation imprint were primarily dependent on the residual stresses, as well as the plastic properties of samples.

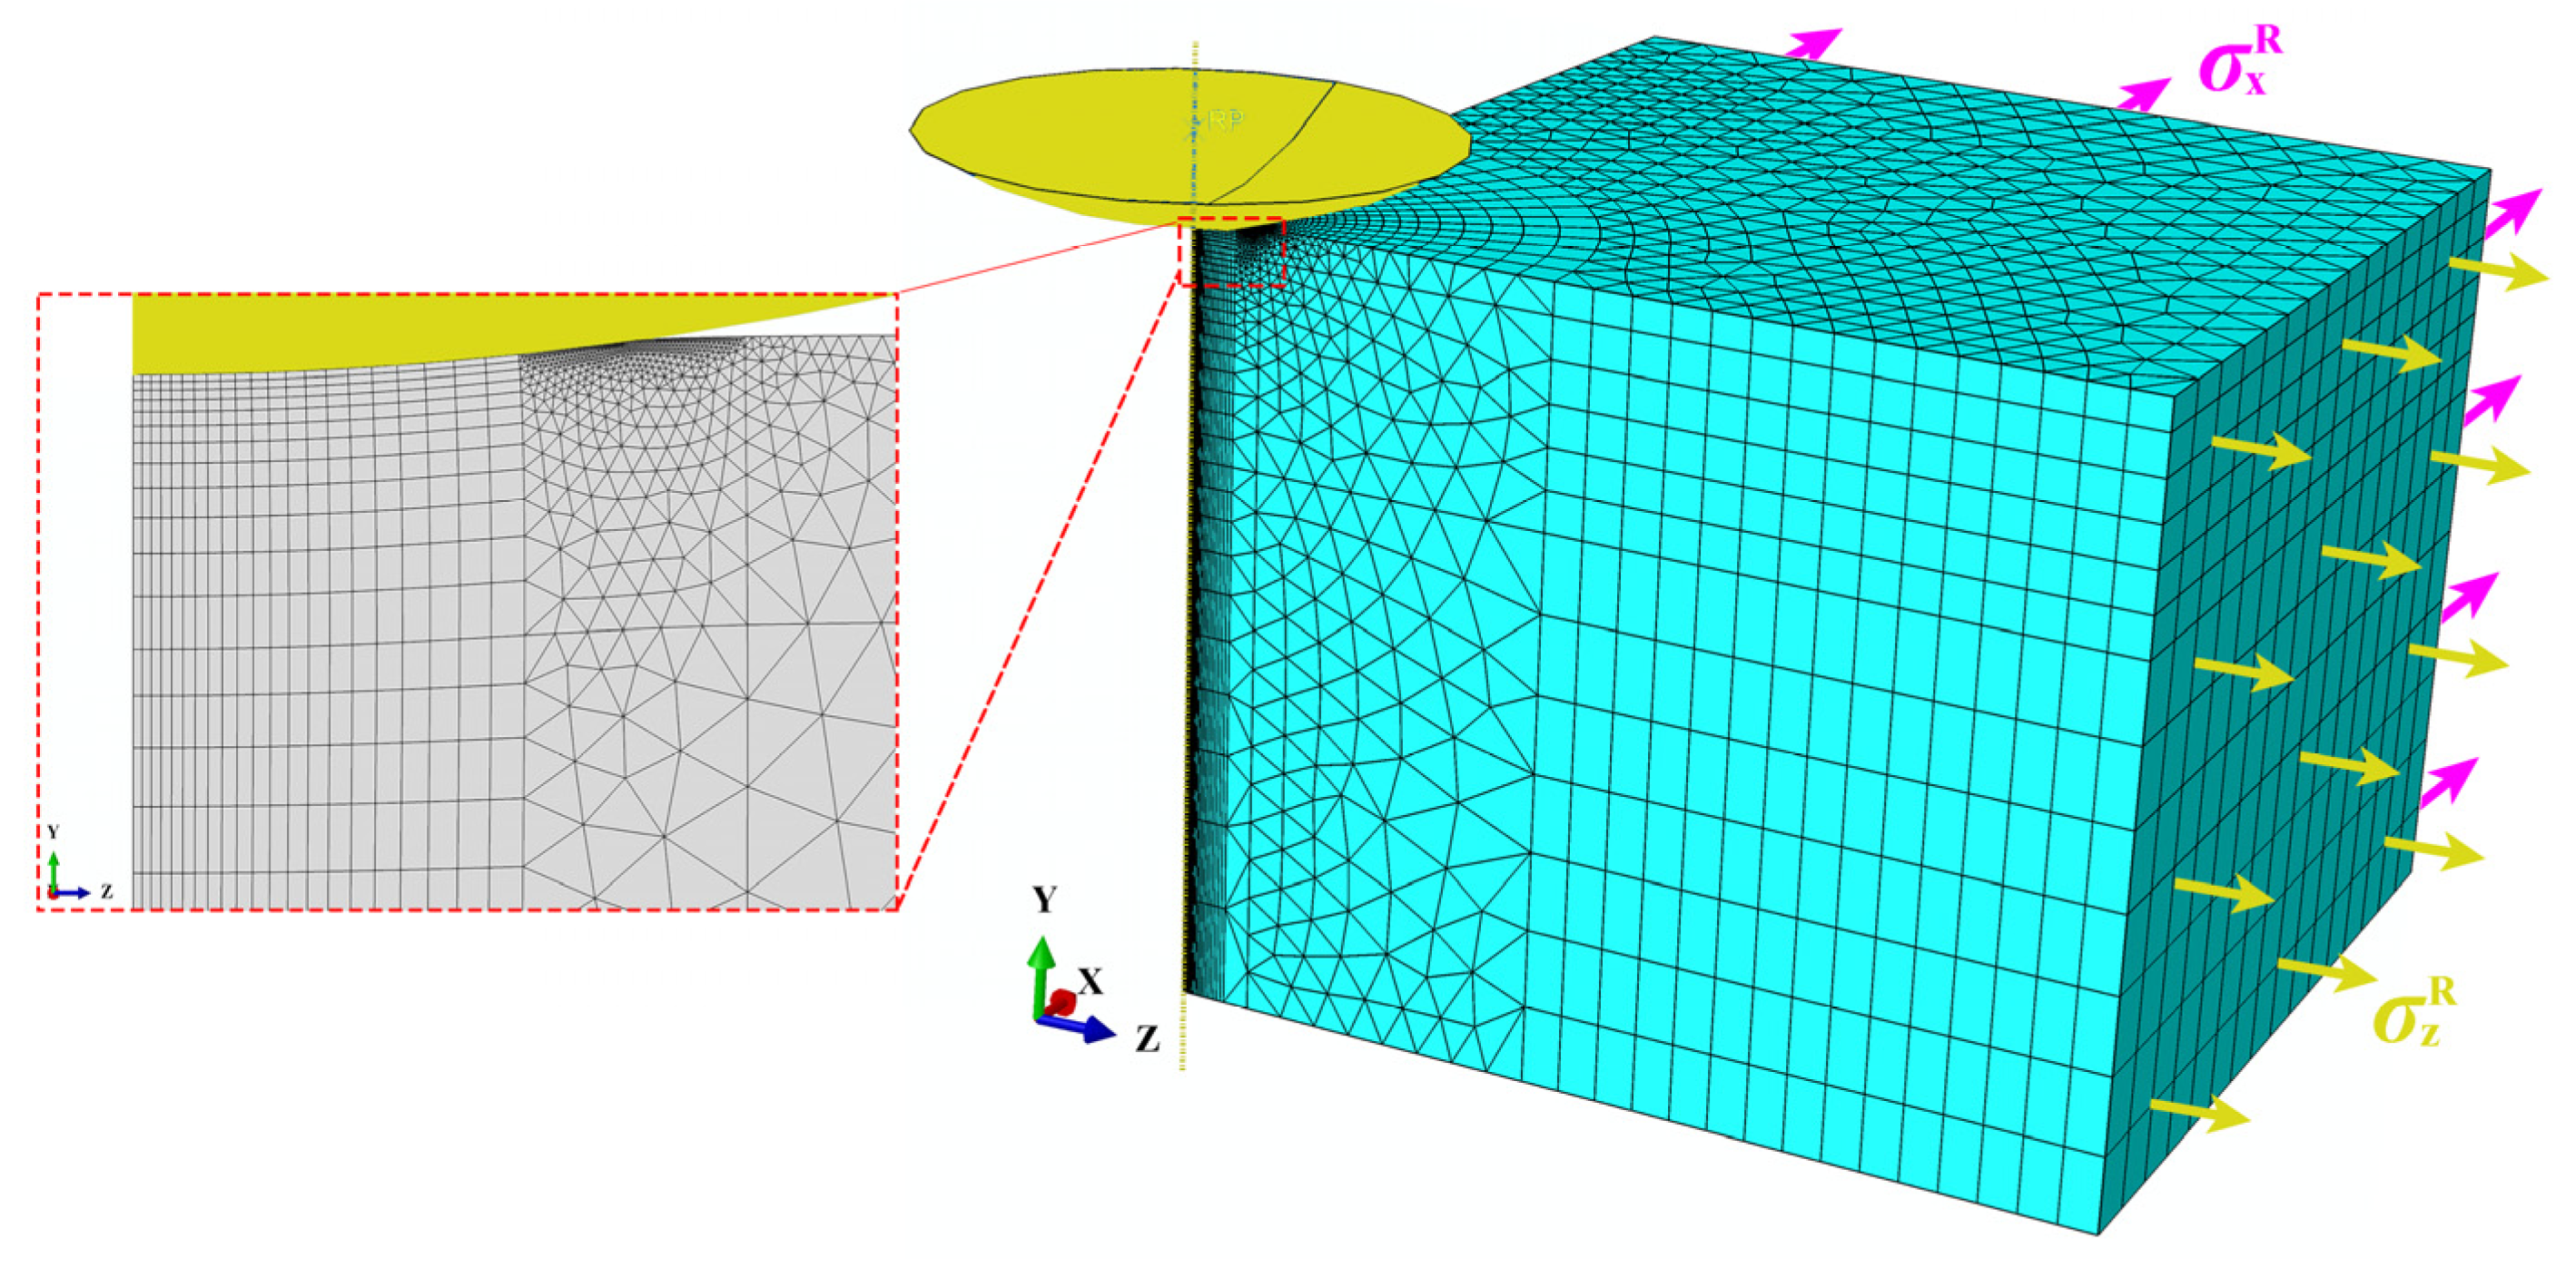
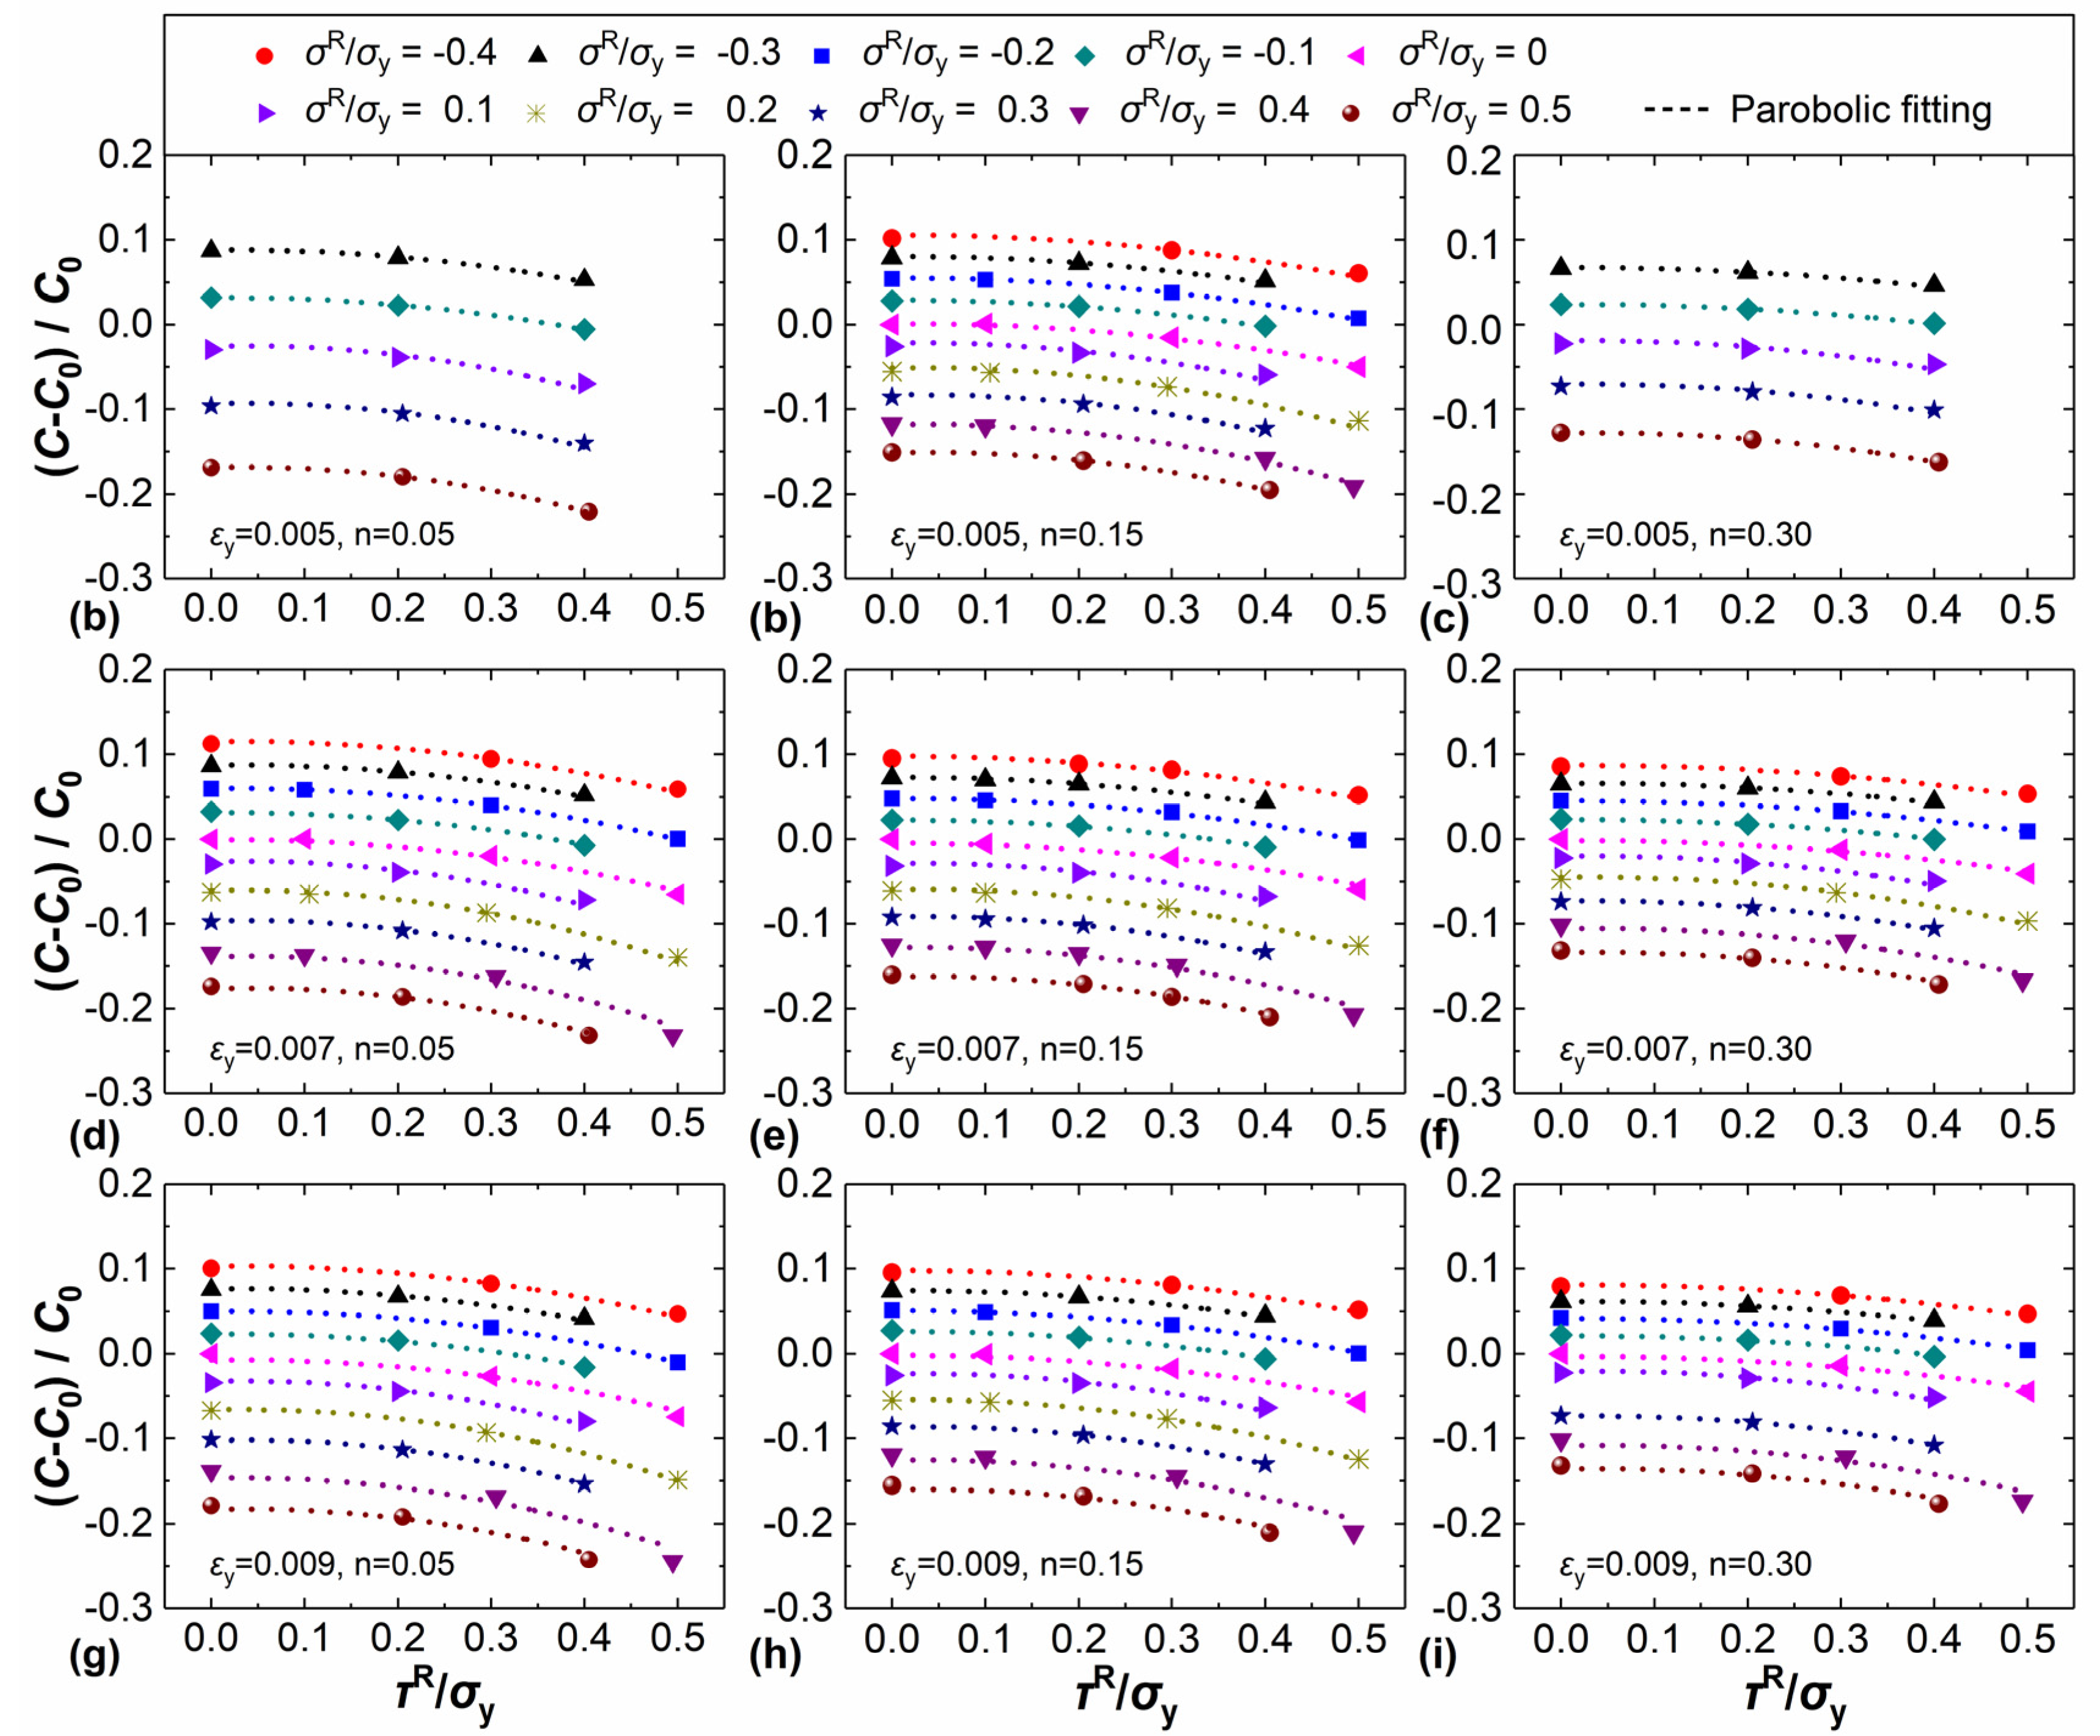
2.5. Determination of Quantitative Relationships through FE Analysis

To figure out the quantitative relationships among the indentation parameters, residual stresses, and the plastic properties of samples from Equations (9) and (12), a larger number of FE simulations of spherical indentation on possible metal samples with various residual stresses were implemented in Abaqus. Due to the symmetry, a rigid spherical indenter with a radius R = 1250 μm indentation on a 1/4 metallic sample with biaxial residual stresses was constructed, as shown in Figure 4. Uniform pressure σ x R and σ z R were applied on the outer surfaces of the sample to simulate the biaxial residual stresses. The sample size was 2.5 mm × 2.5 mm × 2.0 mm, which was about 100 times larger than the size of the contact region at the maximum indentation depth 0.01R. For mechanical contact problems, Lostado et al. [44,45,46] pointed out that the contact stress and outcomes could be affected by the mesh size in the contact area. To minimize the influence of mesh size, the fine elements in the contact area and the ultrafine elements near the contact boundary were meshed, as shown in Figure 4. During the indentation process, more than 50 elements were in contact with the spherical indenter. Furthermore, the constructed FE model was validated for purely elastic indentation by comparing the simulated load-depth curve to the calculated curve from Hertz’s theory. The whole sample was modeled with 52,094 C3D6 elements, which consisted of ultrafine elements near the contact boundary, fine elements near the contact region, and gradually coarser elements further from the contact region. The material properties of the metallic sample were defined by a linear elastic-power-law strain-hardening constitutive model. Several values were taken for each plastic parameter and residual stress part in Equations (9) and (12) to investigate the influence of these parameters on indentation responses. The yield strain of sample, ε y , took values of 0.005, 0.007, and 0.009; the strain-hardening exponent of the sample, n , took values of 0.05, 0.15, and 0.30. The normalized equibiaxial stress part, σ R / σ y , ranged from −0.5 to 0.7 with an interval of 0.1 (“−“ indicates compressive stresses), and the normalized shear stress part, τ R / σ y , took values of 0, 0.2, 0.3, 0.4, and 0.5. It could be found from Equations (9) and (12) that the elastic modulus, E , was not an important impact factor and had no effect on ( C C 0 ) / C 0 and λ . Thus, the elastic modulus took a fixed value of 100 GPa for convenience. The Poisson’s ratio also took a fixed value of 0.3 for metallic samples. Since the analytical rigid surface was involved in the FE model, the contact pair algorithm was used to define the contact between the indenter and sample. The outer surface of the spherical indenter (analytical rigid surface) was assigned as a master surface, and the top surface of the sample was assigned as a slave surface. Considering that the relative sliding between the indenter and sample often occurs, finite-sliding and surface-to-surface contact (standard) were used to describe the contact interactions. The classical isotropic Coulomb friction model was adopted to describe the friction behavior between the contact surfaces. A penalty method was used to enforce the tangential constraints. As Cao et al. [36] reported that the influence of the friction on the indentation load could be neglected when the normalized indentation depth h / R 0.08 , the friction between indenter and sample took a fixed friction coefficient of 0.15. Eliminating the impossible stress combinations (e.g., σ R / σ y = 0.7 and τ R / σ y = 0.5 , where the residual stress exceeded the yield strength), 309 combination cases were simulated.
By analyzing the FE results, the variation of ( C C 0 ) / C 0 with τ R / σ y is shown in Figure 5. It was found that ( C C 0 ) / C 0 decreased parabolically with the increase of τ R / σ y for all the materials. Dimensionless Equation (9) could then be rewritten in a parabolic form by
C C 0 C 0 = f 1 ( ε y , n ; σ R σ y ) ( τ R σ y ) 2 + f 2 ( ε y , n ; σ R σ y ) τ R σ y + f 3 ( ε y , n ; σ R σ y )
Since the sensitivity of loading curvature to the tensile residual stresses and that to the compressive stresses were not the same, the functions f 1 , f 2 , and f 3 for tensile and compressive residual stresses were different. Generally, the relative change in loading curvature can be used to identify the stress state: ( C C 0 ) / C 0 0 for compressive residual stresses, and ( C C 0 ) / C 0 < 0 for tensile residual stresses. When all the data points in Figure 5 were fitted by Equation (13), the fitting data for f 1 , f 2 , and f 3 were obtained. Further analyzing and fitting the three groups of data, respectively, the exact expressions for functions f 1 , f 2 , and f 3 were determined. Then, Equation (13) could be quantitatively expressed by
C C 0 C 0 = { ( 1.1067 n 2 + 0.8313 n 0.3048 ) ( τ R σ y ) 2 + ( 0.3867 n 2 0.1673 n + 0.02040 ) τ R σ y + [ ( 0.07200 n 2 + 1467 ε y 2 + 0.2928 n 18.11 ε y 0.5263 ε y n 0.2459 ) σ R σ y   for   C C 0 C 0 0 + 0.01289 n 2 + 254.2 ε y 2 0.03455 n 5.552 ε y + 4.711 ε y n + 0.02518 ] ( 0.9200 n 2 + 0.8740 n 0.4334 ) ( τ R σ y ) 2 + ( 0.2800 n 2 0.1460 n + 0.0356 ) τ R σ y + [ ( 0.1356 n 2 + 1271 ε y 2 + 0.3667 n 23.59 ε y + 5.342 ε y n 0.2928 ) σ R σ y   for   C C 0 C 0 < 0 0.007100 n 2 + 104.2 ε y 2 0.02720 n 2.269 ε y + 3.513 ε y n + 0.02178 ]
Similarly, the quantitative relationship among the asymmetry factor of residual indentation imprint, the residual stress components, and the sample’s plastic properties could be figured out from Figure 6. It was evident that the logarithm of the asymmetry factor increased linearly with the increase of the normalized equibiaxial stress part. For the same material with different shear stress parts, the relationships could be approximated by a group of parallel lines. The slope of these fitting lines was found to decrease with increasing strain-hardening exponent, while increased with the increase of yield strain. This meant the slope of fitting lines was irrelevant to the shear stress part and was a function of the sample’s plastic properties. Thus, the dimensionless Equation (12) was simplified to
In ( λ ) = g 1 ( ε y , n ) σ R σ y + g 2 ( ε y , n ; τ R σ y )
By further analyzing and fitting the slope data and intercept data of the fitting lines shown in Figure 6, the exact expressions of slope function, g 1 , and intercept function, g 2 , could be determined. Then, the quantitative form of Equation (15) was obtained as
In ( λ ) = ( 0.2222 n 2 2917 ε y 2 0.2424 n + 129.1 ε y 144.7 ε y n + 0.6468 ) σ R σ y + [ ( 45.34 n 2 25260 ε y 2 11.990 n + 1915.0 ε y 574.1 ε y n 16.87 ) ( τ R σ y ) 2 + ( 29.84 n 2 + 18990 ε y 2 + 7.116 n 1172 ε y + 242.8 ε y n + 14.02 ) τ R σ y + ( 4.314 n 2 2692 ε y 2 1.131 n + 175.3 ε y 73.76 ε y n 6.623 ) ]
Through Equations (14) and (16), the residual stress components ( σ R , τ R ) were quantitatively related to the sample’s plastic properties ( ε y , n ), the relative change in loading curvature ( ( C C 0 ) / C 0 ), and the asymmetry factor of residual indentation imprint, λ . Then, a spherical indentation method for the evaluation of non-equibiaxial residual stresses was established as (1) determining sample’s plastic properties; (2) measuring the relative change in loading curvature and the asymmetry factor of residual indentation imprint by carrying out spherical indentation tests on stressed and unstressed samples; (3) substituting the above-obtained parameters into Equations (14) and (16) to calculate the equibiaxial and shear stress part; (4) identifying the direction of the maximum principal residual stress from the direction of the major axis of residual indentation imprint and calculating the principal residual stresses according to the definition of the equibiaxial and shear stress parts. Generally, the sample’s plastic properties could be identified using spherical indentation methods [36,37,38,39,40,41,42] or uniaxial tensile tests. The relative change in loading curvature could be obtained by fitting the load-depth curves of stressed and unstressed samples with Equation (2). The asymmetry factor of residual indentation imprint could be determined by measuring the major and minor axes of the elliptical residual indentation imprint.

3. Materials and Experiments

3.1. Materials

The commonly used aluminum alloys (AA) 7075-T6 and 2014-T6, produced by Southwest Aluminum (Group) Co., Ltd, Chongqing, China, were used as experimental materials. For uniaxial tension, these aluminum alloy plates with a thickness of 3 mm were machined into dumbbell-shaped specimens. For instrumented spherical indentation, these plates were processed into cruciform specimens, as shown in Figure 7a,b. The arms of the cruciform specimens had a cross-section measuring 5 mm × 3 mm. Generally, when the aluminum alloy plates are processed into cruciform specimens with an arm width of 5 mm, most of the residual stresses could be released if there is any pre-existed in the plates. It should be noted that if residual stresses still remain in the cruciform specimen, the residual stresses cannot be homogeneous and equibiaxial when no external constraints are applied. In other words, if there are residual stresses existed in these cruciform specimens, they are non-eqiubiaxial residual stresses. As discussed in the introduction, non-eqiubiaxial residual stresses can cause the residual indent to be an elliptical one. To ensure these cruciform specimens are stress-free, spherical indentation pretests were carried out on the different areas of the cruciform specimens, and the top-view morphologies of the residual indents were observed with an optical microscope. If all of the residual indents are regular circles, it indicates the specimen is lack of residual stresses. On the contrary, if some of the residual indents are not regular circles, it means there are residual stresses existed in the specimen. For unannealed AA 7075 cruciform specimens, all the residual indents were found to be regular circles. This meant no residual stresses remained in the unannealed AA 7075 cruciform specimens. For unannealed AA 2014 cruciform specimens, however, most of the residual indents were found to be not regular circles. It indicated residual stresses still existed in the unannealed AA 2014 cruciform specimen. Then, all the AA 2014 specimens were annealed at 175 °C for 8 h to remove the pre-existed residual stresses. After annealing, the same spherical indentation pretests were carried out on the annealed AA 2014 cruciform specimen. By observing the top-view morphologies of the residual indents on the annealed specimen, all of the residual indents were found to exhibit circle morphologies. It thus demonstrated that the residual stresses remaining in the AA 2014 specimens were eliminated after annealing. Prior to indentation tests, the top surface of the cruciform specimens was polished to mirror-finished surface.

3.2. Uniaxial Tensile Tests

Uniaxial tensile tests were carried out on the dumbbell-shaped specimens using an ElectroPuls E10000 mechanical testing system (Instron Corp., Norwood, MA, USA) to determine the plastic properties of AA 7075 and AA 2014. During the testing process, the displacement-controlled manner was adopted, and the loading rate was set to 1.5 mm/min. For each material, 5 specimens were tested in order to obtain reliable and repeatable results.

3.3. Instrumented Spherical Indentation Tests

To introduce non-equibiaxial stresses in the cruciform specimens, a biaxial stress-generating jig, as shown in Figure 7a,b, was designed and manufactured. The jig could be used to apply tensile stress by screwing in a loading nut or generate compressive stress by screwing in a loading bolt. Besides, the values of applied stresses could be directly obtained from the load cells. A quadrilateral steel bar with a thickness of 2.5 mm was designed to press on the arms of the cruciform specimen to constrain the specimen’s out-of-plane displacement and eliminate the gap between the specimen and the jig. For each material, three different stress combinations were applied to specimens.
As shown in Figure 7c, when the stressed specimens were prepared, a universal hardness testing system (ZHU2.5, Zwich/Roell Corp., Ulm-Einsingen, Germany) was employed to implement indentation tests in the central area of the specimen. In the present tests, a WC spherical indenter was adopted. Figure 7d shows that the crown part of the indenter exhibited an ideal spherical shape and possessed a mean radius of 794.0 ± 1.8 μm. Since the optimal indentation depth determined in Section 2.2 was h m = 0.01 R , the maximum indentation depth was set to 7.94 μm. As shown in Figure 7b, for each specimen, 9 points with an interval of 800 μm in the central area of the specimen were tested to guarantee repeatability.

4. Results and Discussion

4.1. Numerical Verification

The process of correlating residual stresses with the characteristic indentation parameters through FE simulations belongs to forward analysis, while the determination of residual stresses based on the established equations is reverse analysis. Equations (14) and (16) were used to calculate the residual stresses from the same FE simulations those used for the forward analysis. The calculated residual stresses were compared with the input stresses to verify the validity and accuracy of the proposed method. It should be noted that solving Equations (14) and (16) yields two sets of solutions. Typically, in these two sets of solutions, one has a normalized shear stress part, τ R / σ y , less than 0.5, and the other has a normalized shear stress part greater than 0.5. When the normalized shear stress part is greater than 0.5, it means the shear stress part exceeds the yield strength according to the Tresca yield criterion. Since all the normalized shear stress part is set to no greater than 0.5 in the forward analysis, the solution that has a normalized shear stress part greater than 0.5 should be discarded. In other words, the solution with a smaller normalized shear stress part is adopted to characterize residual stresses in the reverse analysis.
Figure 8 shows a comparison of the calculated residual stresses and input stresses for different materials. It was obvious that the majority of the calculated residual stresses agreed well with the input stresses. Specifically, more than 98% of the calculated residual stresses had an error less than 0.1 σ y , where σ y is the yield strength for the corresponding material. This indicated the proposed method is valid for the evaluation of non-equibiaxial residual stresses.

4.2. Experimental Verification

The average load-depth curves for spherical indentations on AA 7075 and AA 2014 with different introduced stresses are shown in Figure 9. It was evident that the load-depth curves for stressed samples deviated from that for stress-free samples. By nonlinear fitting, the loading segment of load-depth curves with Equation (2), the relative change in loading curvature, as listed in Table 2, could be obtained. Figure 10a,b show the typical morphologies of the residual indentation imprints for AA 7075 with introduced stresses of ( σ x R = 210.5   MPa , σ z R = 108.4   MPa ) and AA 2014 with introduced stresses of ( σ x R = 140.1   MPa , σ z R = 29.8   MPa ). It could be found that the residual indentation imprints were asymmetric. However, due to the influence of grains in actual indentation tests, the contour of the residual indentation imprint was not smooth and was not an ideal ellipse. To minimize the measurement error, elliptical auxiliary lines were drawn to envelop the residual indentation imprints. By measuring the major and minor axes of the elliptical auxiliary line, the asymmetry factor of the residual of imprints for AA 7075 and AA 2014 with different residual stresses could be obtained (as listed in Table 2). Generally, only when the number of grains being deformed during indentation is at least a dozen and preferably more, the deformed volume can be regarded as large enough to reflect the representative response of the bulk [40]. Since the normalized indentation depth, h/R, was fixed at 0.01 (which is really small), a large spherical indenter with a radius of 0.794 mm was used to ensure the indent size could cover at least a dozen grains. From the top-view morphology of the residual indentation imprint shown in Figure 10a,b, the diameter of the residual imprint was ~230 μm. Typically, the average grain size of aluminum alloys is ~60 μm. This means at least a dozen (2302/602 = 14.7) grains were deformed during indentation tests. Specifically, Figure 10c shows the grain structures of AA 7075 and the contour line of the residual indentation imprint on the AA 7075 sample. It was clear that more than 20 grains were contained in the contact region. In this case, the deformed volume could be regarded as large enough to reflect the representative response of the bulk.
Figure 11 shows the average true stress-strain curves for unannealed AA 7075 and annealed AA 2014 obtained by uniaxial tension. From the stress-strain curves, it could be found that necking occurred during tensile tests. Since the standard conversion of nominal to true stresses and strains is only valid before necking, the true stress-strain curves shown in Figure 11 after the onset of necking were unreliable. By least square fitting the true stress-strain data before the onset of necking with Hollomon’s power law hardening equation, the plastic parameters (yield strain, ε y , and strain-hardening exponent, n ) of AA 7075 and AA 2014, as listed in Table 2, were obtained. Substituting the measured plastic parameters, the relative change in loading curvature, and the asymmetry factor of residual indentation imprint into Equations (14) and (16), the non-equibaixial residual stresses could be calculated. The comparison between the calculated stresses ( σ x _ cal R , σ z _ cal R ) and the applied stresses ( σ x _ app R , σ z _ app R ), as listed in Table 2, showed that most of the errors were less than 25 MPa. The testing errors were acceptable for metals. This indicated that the newly established method had a reasonable accuracy for the evaluation of non-equibiaxial residual stresses.

5. Conclusions

During instrumented spherical indentation, the existence of non-equibiaxial residual stresses in the sample could shift the load-depth curve upwards or downwards and cause the residual indentation imprint to be an elliptical one. The relative change in loading curvature of load-depth curves and the asymmetry factor of the elliptical residual indentation imprint were used as the characteristic indentation parameters to figure out the magnitude and directionality of non-equibiaxial residual stresses. Through theoretical, experimental, and FE analyses, these two characteristic indentation parameters were found to have optimal sensitivity to residual stresses at a depth of 0.01R for materials, which have a yield strain in the range of 0.004–0.010. By fixing the indentation depth at 0.01R, with the aid of dimensional analysis and FE simulations, two quantitative relationships between the two characteristic indentation parameters and non-equibiaxial residual stresses were obtained. Then, a new spherical indentation method was proposed to evaluate non-equibiaxial residual stress based on these two equations.
Both numerical simulations and experiments were carried out to verify the validity and accuracy of the newly proposed method. In the numerical verification, more than 98% of the calculated residual stresses had an error less than 0.1 σ y , where σ y is the yield strength for the corresponding material. In the experimental verification, a biaxial stress-generating jig was designed to apply stresses on the cruciform samples. The comparison between the calculated stresses and the applied stresses showed that most of the errors were less than 25 MPa, which was acceptable for metals. Both the numerical and experimental verifications indicated that the newly established method had a reasonable accuracy for the evaluation of non-equibiaxial residual stresses.

Author Contributions

Conceptualization, G.P. and T.Z.; methodology, G.P. and F.X.; software, F.X. and J.C.; validation, G.P., F.X., and J.C.; investigation, G.P., F.X., and J.C.; resources, H.W.; writing—original draft preparation, G.P.; writing—review and editing, J.H.; supervision, T.Z.; funding acquisition, J.H., T.Z., and H.W. All authors have read and agreed to the published version of the manuscript.

Funding

This research was funded by the National Natural Science Foundation of China (Grant Nos. 11772302, 11727803, 11672356, and 11802271) and Zhejiang Province Public Welfare Technology Application Research Project (2015C31074). The APC was funded by the National Natural Science Foundation of China (Grant No. 11727803).

Conflicts of Interest

The authors declare no conflict of interest.

References

  1. Fang, X.; Jin, G.; Cui, X.F.; Liu, J.N. Evolution characteristics of residual stress in metastable Ni-B alloy coatings identified by nanoindentation. Surf. Coat. Tech. 2016, 305, 208–214. [Google Scholar] [CrossRef]
  2. Jang, J.I. Estimation of residual stress by instrumented indentation: A review. J. Ceram. Process. Res. 2009, 10, 391–400. [Google Scholar]
  3. Wang, Y.K.; Dang, D.Y.; Wang, M.; Xiao, X.C.; Cheng, Y.S. Mechanical behavior of electroplated mossy lithium at room temperature studied by flat punch indentation. Appl. Phys. Lett. 2019, 115, 5. [Google Scholar] [CrossRef]
  4. Bolshakov, A.; Oliver, W.C.; Pharr, G.M. Influences of stress on the measurement of mechanical properties using nanoindentation. 2. Finite element simulations. J. Mater. Res. 1996, 11, 760–768. [Google Scholar] [CrossRef]
  5. Tsui, T.Y.; Oliver, W.C.; Pharr, G.M. Influences of stress on the measurement of mechanical properties using nanoindentation. 1. Experimental studies in an aluminum alloy. J. Mater. Res. 1996, 11, 752–759. [Google Scholar] [CrossRef]
  6. Xu, Z.H.; Li, X.D. Influence of equi-biaxial residual stress on unloading behaviour of nanoindentation. Acta Mater. 2005, 53, 1913–1919. [Google Scholar] [CrossRef]
  7. Larsson, P.-L. Influence from the inclined angle of the indenter for determination of residual stress and strain fields by sharp indentation testing. J. Mater. Process. Tech. 2007, 184, 372–378. [Google Scholar] [CrossRef]
  8. Huber, N.; Heerens, J. On the effect of a general residual stress state on indentation and hardness testing. Acta Mater. 2008, 56, 6205–6213. [Google Scholar] [CrossRef] [Green Version]
  9. Larsson, P.-L. On the Influence of Elastic Deformation for Residual Stress Determination by Sharp Indentation Testing. J. Mater. Eng. Perform. 2017, 26, 3854–3860. [Google Scholar] [CrossRef] [Green Version]
  10. Feng, B.; Levitas, V.I. Coupled elastoplasticity and plastic strain-induced phase transformation under high pressure and large strains: Formulation and application to BN sample compressed in a diamond anvil cell. Int. J. Plasticity 2017, 96, 156–181. [Google Scholar] [CrossRef]
  11. Ma, L.; Xing, H.; Ding, Q.; Han, Y.; Li, Q.; Qiu, W. Analysis of residual stress around a Berkovich nano-indentation by micro-Raman spectroscopy. AIP Adv. 2019, 9. [Google Scholar] [CrossRef] [Green Version]
  12. Zhang, T.; Cheng, W.; Peng, G.; Ma, Y.; Jiang, W.; Hu, J.; Chen, H. Numerical investigation of spherical indentation on elastic-power-law strain-hardening solids with non-equibiaxial residual stresses. MRS Commun. 2019, 9, 360–369. [Google Scholar] [CrossRef]
  13. Feng, B.; Liu, Z. Finite element modeling and simulations on indentation and scratch tests on thin films: Effects of prestress. MRS Commun. 2019, 9, 756–763. [Google Scholar] [CrossRef]
  14. Suresh, S.; Giannakopoulos, A.E. A new method for estimating residual stresses by instrumented sharp indentation. Acta Mater. 1998, 46, 5755–5767. [Google Scholar] [CrossRef]
  15. Taljat, B.; Pharr, G.M. Measurement of residual stress by load and depth sensing spherical indentation. Mat. Res. Soc. Symp. Proc. 2000, 594, 519–524. [Google Scholar] [CrossRef]
  16. Carlsson, S.; Larsson, P.L. On the determination of residual stress and strain fields by sharp indentation testing. Part I: Theoretical and numerical analysis. Acta Mater. 2001, 49, 2179–2191. [Google Scholar] [CrossRef]
  17. Swadener, J.G.; Taljat, B.; Pharr, G.M. Measurement of residual stress by load and depth sensing indentation with spherical indenters. J. Mater. Res. 2001, 16, 2091–2102. [Google Scholar] [CrossRef]
  18. Sakharova, N.A.; Prates, P.A.; Oliveira, M.C.; Fernandes, J.V.; Antunes, J.M. A Simple Method for Estimation of Residual Stresses by Depth-Sensing Indentation. Strain 2012, 48, 75–87. [Google Scholar] [CrossRef]
  19. Lu, Z.; Feng, Y.; Peng, G.; Yang, R.; Huan, Y.; Zhang, T. Estimation of surface equi-biaxial residual stress by using instrumented sharp indentation. Mater. Sci. Eng. A 2014, 614, 264–272. [Google Scholar] [CrossRef]
  20. Lee, J.H.; Lee, H.; Hyun, H.C.; Kim, M. Numerical approaches and experimental verification of the conical indentation techniques for residual stress evaluation. J. Mater. Res. 2010, 25, 2212–2223. [Google Scholar] [CrossRef]
  21. Mady, C.E.K.; Rodriguez, S.A.; Gomez, A.G.; Souza, R.M. Numerical analysis of different methods to calculate residual stresses in thin films based on instrumented indentation data. J. Mater. Res. 2012, 27, 1732–1741. [Google Scholar] [CrossRef]
  22. Xiao, L.; Ye, D.; Chen, C. A further study on representative models for calculating the residual stress based on the instrumented indentation technique. Comp. Mater. Sci. 2014, 82, 476–482. [Google Scholar] [CrossRef]
  23. Rickhey, F.; Lee, J.H.; Lee, H. A contact size-independent approach to the estimation of biaxial residual stresses by Knoop indentation. Mater. Design 2015, 84, 300–312. [Google Scholar] [CrossRef]
  24. Chen, J.; Liu, J.; Sun, C. Residual stress measurement via digital image correlation and sharp indentation testing. Opt. Eng. 2016, 55, 124102. [Google Scholar] [CrossRef]
  25. Peng, G.; Lu, Z.; Ma, Y.; Feng, Y.; Huan, Y.; Zhang, T. Spherical indentation method for estimating equibiaxial residual stress and elastic–plastic properties of metals simultaneously. J. Mater. Res. 2018, 33, 884–897. [Google Scholar] [CrossRef] [Green Version]
  26. Wang, Z.; Deng, L.; Zhao, J. A novel method to extract the equi-biaxial residual stress and mechanical properties of metal materials by continuous spherical indentation test. Mater. Res. Express 2018, 6, 3. [Google Scholar] [CrossRef]
  27. Kim, J.-h.; Choi, S.; Lee, J.; Ahn, H.-J.; Kim, Y.-C.; Choi, M.-J.; Kwon, D. An indentation method for evaluation of residual stress: Estimation of stress-free indentation curve using stress-independent indentation parameters. J. Mater. Res. 2019, 34, 1103–1111. [Google Scholar] [CrossRef]
  28. Lee, Y.H.; Kwon, D. Estimation of biaxial surface stress by instrumented indentation with sharp indenters. Acta Mater. 2004, 52, 1555–1563. [Google Scholar] [CrossRef]
  29. Larsson, P.-L. On the Determination of Biaxial Residual Stress Fields from Global Indentation Quantities. Tribol. Lett. 2014, 54, 89–97. [Google Scholar] [CrossRef]
  30. Shen, L.; He, Y.; Liu, D.; Gong, Q.; Zhang, B.; Lei, J. A novel method for determining surface residual stress components and their directions in spherical indentation. J. Mater. Res. 2015, 30, 1078–1089. [Google Scholar] [CrossRef]
  31. Kim, Y.-C.; Choi, M.-J.; Kwon, D.; Kim, J.-Y. Estimation of principal directions of Bi-axial residual stress using instrumented Knoop indentation testing. Met. Mater. Int. 2015, 21, 850–856. [Google Scholar] [CrossRef]
  32. Kim, Y.-C.; Ahn, H.-J.; Kwon, D.; Kim, J.-Y. Modeling and experimental verification for non-equibiaxial residual stress evaluated by Knoop indentations. Met. Mater. Int. 2016, 22, 12–19. [Google Scholar] [CrossRef]
  33. Ahn, H.-J.; Kim, J.-h.; Xu, H.; Lee, J.; Kim, J.-Y.; Kim, Y.-C.; Kwon, D. Directionality of residual stress evaluated by instrumented indentation testing using wedge indenter. Met. Mater. Int. 2017, 23, 465–472. [Google Scholar] [CrossRef]
  34. Han, J.H.; Lee, J.S.; Lee, Y.H.; Choi, M.J.; Lee, G.; Kim, K.H.; Kwon, D. Residual stress estimation with identification of stress directionality using instrumented indentation technique. In Mechanical Behavior of Materials X, Pts 1and 2; Nam, S.W., Chang, Y.W., Lee, S.B., Kim, N.J., Eds.; Trans Tech Publications Ltd.: Durnten-Zurich, Switzerland, 2007; Volume 345–346, pp. 1125–1128. [Google Scholar] [CrossRef]
  35. Choi, M.-J.; Kang, S.-K.; Kang, I.; Kwon, D. Evaluation of nonequibiaxial residual stress using Knoop indenter. J. Mater. Res. 2011, 27, 121–125. [Google Scholar] [CrossRef]
  36. Cao, Y.P.; Lu, J. A new method to extract the plastic properties of metal materials from an instrumented spherical indentation loading curve. Acta Mater. 2004, 52, 4023–4032. [Google Scholar] [CrossRef]
  37. Ni, W.Y.; Cheng, Y.T.; Cheng, C.M.; Grummon, D.S. An energy-based method for analyzing instrumented spherical indentation experiments. J. Mater. Res. 2004, 19, 149–157. [Google Scholar] [CrossRef]
  38. Zhang, T.H.; Yu, C.; Peng, G.J.; Feng, Y.H. Identification of the elastic-plastic constitutive model for measuring mechanical properties of metals by instrumented spherical indentation test. MRS Commun. 2017, 7, 221–228. [Google Scholar] [CrossRef] [Green Version]
  39. Patel, D.K.; Kalidindi, S.R. Correlation of spherical nanoindentation stress-strain curves to simple compression stress-strain curves for elastic-plastic isotropic materials using finite element models. Acta Mater. 2016, 112, 295–302. [Google Scholar] [CrossRef] [Green Version]
  40. Campbell, J.E.; Thompson, R.P.; Dean, J.; Clyne, T.W. Experimental and computational issues for automated extraction of plasticity parameters from spherical indentation. Mech. Mater. 2018, 124, 118–131. [Google Scholar] [CrossRef]
  41. Campbell, J.E.; Thompson, R.P.; Dean, J.; Clyne, T.W. Comparison between stress-strain plots obtained from indentation plastometry, based on residual indent profiles, and from uniaxial testing. Acta Mater. 2019, 168, 87–99. [Google Scholar] [CrossRef]
  42. Meng, L.; Breitkopf, P.; Raghavan, B.; Mauvoisin, G.; Bartier, O.; Hernot, X. On the study of mystical materials identified by indentation on power law and Voce hardening solids. Int. J. Mater. Form. 2019, 12, 587–602. [Google Scholar] [CrossRef]
  43. Johnson, K.L. Contact mechanics; Cambridge University Press: Cambridge, UK, 1985; pp. 171–179. [Google Scholar]
  44. Lostado, R.; Escribano García, R.; Fernandez Martinez, R. Optimization of operating conditions for a double-row tapered roller bearing. Int. J. Mech. Mater. Des. 2016, 12, 353–373. [Google Scholar] [CrossRef]
  45. Lostado Lorza, R.; Corral Bobadilla, M.; Martínez Calvo, M.Á.; Villanueva Roldán, P.M. Residual Stresses with Time-Independent Cyclic Plasticity in Finite Element Analysis of Welded Joints. Metals 2017, 7, 136–160. [Google Scholar] [CrossRef] [Green Version]
  46. Lostado, R.; Martinez, R.F.; Mac Donald, B.J. Determination of the contact stresses in double-row tapered roller bearings using the finite element method, experimental analysis and analytical models. J. Mech. Sci. Technol. 2018, 29, 4645–4656. [Google Scholar] [CrossRef]
Figure 1. Schematic illustration of (a) decomposition of non-equibiaxial residual stress, and (b) influences of residual stresses on load-depth curves and residual indentation imprint.
Metals 10 00440 g001
Figure 2. The residual indentation imprints and the corresponding asymmetry factor for (a) FE (finite element) simulated sample and (b) AA 2014 with fixed residual stress at different normalized indentation depths.
Metals 10 00440 g002
Figure 3. The loading segment of load-depth curves and the corresponding fitting curves for the representative FE simulated sample (elastic modulus, E = 100   GPa , Poisson’s ratio, ν = 0.3 , yield strain, ε y = 0.007 , strain-hardening exponent, n = 0.15 ) with various residual stresses.
Metals 10 00440 g003
Figure 4. The 3D finite element model of spherical indentation on the stressed sample.
Metals 10 00440 g004
Figure 5. The variation of the relative change in loading curvature with the normalized shear stress part for nine representative metals under various equibiaxial stress parts: (a) ε y = 0.005 , n = 0.05 , (b) ε y = 0.005 , n = 0.15 , (c) ε y = 0.005 , n = 0.3 , (d) ε y = 0.007 , n = 0.05 , (e) ε y = 0.007 , n = 0.15 , (f) ε y = 0.007 , n = 0.3 , (g) ε y = 0.009 , n = 0.05 , (h) ε y = 0.009 , n = 0.15 , (i) ε y = 0.009 , n = 0.3 .
Metals 10 00440 g005
Figure 6. The variation of the asymmetry factor of residual indentation imprint with the normalized equibiaxial stress part for nine representative metals under various shear stress parts: (a) ε y = 0.005 , n = 0.05 , (b) ε y = 0.005 , n = 0.15 , (c) ε y = 0.005 , n = 0.3 , (d) ε y = 0.007 , n = 0.05 , (e) ε y = 0.007 , n = 0.15 , (f) ε y = 0.007 , n = 0.3 , (g) ε y = 0.009 , n = 0.05 , (h) ε y = 0.009 , n = 0.15 , (i) ε y = 0.009 , n = 0.3 .
Metals 10 00440 g006
Figure 7. (a) The design diagram of the biaxial stress-generating jig; (b) the manufactured stress-generating jig and the distribution of indentation points in the central area of the cruciform specimen; (c) the Zwick ZHU2.5 universal hardness testing system employed to carry out indentation tests; and (d) the optical micrograph of the crown part of the spherical indenter used for indentation tests.
Metals 10 00440 g007
Figure 8. Comparison between the calculated residual stresses and input residual stresses: (a) ε y = 0.005 , n = 0.05 , (b) ε y = 0.005 , n = 0.15 , (c) ε y = 0.005 , n = 0.3 , (d) ε y = 0.007 , n = 0.05 , (e) ε y = 0.007 , n = 0.15 , (f) ε y = 0.007 , n = 0.3 , (g) ε y = 0.009 , n = 0.05 , (h) ε y = 0.009 , n = 0.15 , (i) ε y = 0.009 , n = 0.3 .
Metals 10 00440 g008
Figure 9. The average load-depth curves for spherical indentations on (a) AA 7075 and (b) AA 2014 with various residual stresses.
Metals 10 00440 g009
Figure 10. The typical top-view morphology of residual indentation imprint after spherical indentation for (a) AA 7075 and (b) AA 2014 with non-equibiaxial residual stresses, and (c) the micrograph of grain structures of AA 7075.
Metals 10 00440 g010
Figure 11. The true stress-strain curves for (a) AA 7075 and (b) AA 2014 determined by uniaxial tensile tests.
Metals 10 00440 g011
Table 1. Fitting parameters for the loading curves of the representative finite element (FE) simulated sample (elastic modulus, E = 100   GPa , Poisson’s ratio, ν = 0.3 , yield strain, ε y = 0.007 , strain-hardening exponent, n = 0.15 ) with various residual stresses.
σ x R / σ y σ z R / σ y C m R 2
−0.9−0.36.0291.3310.9999
−0.3−0.35.8591.3220.9999
005.5861.3120.9999
0.30.35.1101.3090.9999
0.60.64.4581.3140.9999
Table 2. The average plastic parameters, indentation characteristic parameters, and applied and calculated stresses for AA 7075 and AA 2014.
Materials σ y
(MPa)
ε y n ln ( λ ) C C 0 C 0
(%)
σ x _ cal R
(MPa)
σ z _ cal R
(MPa)
σ x _ app R
(MPa)
σ z _ app R
(MPa)
Δ σ x R
(MPa)
Δ σ z R
(MPa)
AA 7075436.00.0070.101−3.62−9.78235.7−36.9246.1−52.3−10.415.4
−3.98−8.53201.11.6191.551.99.6−50.3
−3.66−6.04197.6−113.2210.5−108.4−12.86−4.8
AA 2014271.00.0040.055−3.64−12.96171.315.8140.1−29.831.245.6
−4.15−10.97141.338.5117.034.824.33.7
−3.93−2.7091.7−67.6132.8−76.5−41.18.9

