Article

Effects of ATIG Welding on Weld Shape, Mechanical Properties, and Corrosion Resistance of 430 Ferritic Stainless Steel Alloy

1
Department of Mechanical Engineering, College of Engineering in Al-Kharj, Prince Sattam bin Abdulaziz University, P.O. Box 655, Al-Karj 11942, Saudi Arabia
2
National Engineering School (ENIT), University of Tunis El Manar, P.O. Box 37, Tunis 1002, Tunisia
3
Center of Excellence for Research in Engineering Materials (CEREM), King Saud University, P.O. Box 800, Al-Riyadh 11421, Saudi Arabia
4
Electrochemistry and Corrosion Laboratory, Department of Physical Chemistry, National Research Centre, El-Behoth St. 33, Dokki, Cairo 12622, Egypt
5
Mechanical Design and Materials Department, Faculty of Energy Engineering, Aswan University, Aswan 81521, Egypt
*
Author to whom correspondence should be addressed.
Metals 2020, 10(3), 404; https://doi.org/10.3390/met10030404
Submission received: 14 February 2020 / Revised: 15 March 2020 / Accepted: 16 March 2020 / Published: 22 March 2020

Abstract

:
Flux activated tungsten inert gas (ATIG) welding is a variant of tungsten inert gas (TIG) welding process with high production efficiency, high quality, low energy consumption, and low cost. The study of activating flux mechanism by increasing weld penetration has direct significance in developing flux and welding process. This study has been conducted on 430 ferritic stainless steel alloy. Design of experiment is used to get the best formulation of flux. Based on Minitab17 software, nineteen compositions of flux were prepared using the mixing method. Fluxes are combinations of three oxides (MoO3-TiO2-SiO2). Using the optimizer module available in Minitab 17 software, the best formulation was obtained to achieve the best weld depth. Hence, the obtained depth is twice greater than that achieved by conventional TIG welding. Moreover, mechanical properties and corrosion resistance have been investigated for TIG and ATIG welds respectively in tensile, impact, and hardness tests, and in potentiodynamic polarization measurement test.

1. Introduction

Tungsten inert gas (TIG) welding process is widely applied in the stainless-steel fabrication industry when weld quality is required. However, the productivity achieved by this process is low because of its shallow depth of penetration. On the other hand, TIG process can be performed with flux activated tungsten inert gas (ATIG) and it consists of depositing a thin layer of metallic oxides on the workpiece surface before welding. ATIG presents the possibility of increasing the penetration depth using the same conventional TIG welding parameters. The use of activating fluxes for TIG welding (ATIG) was invented by the E.O Paton Institute of Electric Welding in the sixties [1,2]. It was originally intended to be used with titanium and then with steels and copper-base alloys [3,4,5]. It has the advantages of eliminating the need of edge preparation, increasing the penetration depth, and reducing the number of weld pass. Consequently, the process resulted in narrow welds, small size of HAZ, low heat input, and decrease in residual welding distortions. The productivity of ATIG process could be increased up to 3 times compared to the conventional TIG process [6,7,8]. Two types of mechanism have been formulated to explain the high penetration of ATIG welds:
(1)
Marangoni convection mechanism: The molten metal behaves like pure metal and a centrifugal convection phenomenon is instigated in the welding joint. The molten metal moves from center of weld pool to the edges, leading to a wide and shallow weld bead, contrariwise ATIG weld metal has a centripetal movement related to oxygen liberated from oxides during the welding operation. Oxygen, tellurium, selenium, and sulfur as surfactant elements, even in small quantities, contribute to a centripetal convection, leading to a depth weld bead [9,10,11,12,13,14,15,16].
(2)
Arc constriction mechanism: During the ATIG welding process, fluorine or chlorine elements migrate towards the arc weld and react with the outer arc electrons. The latter phenomenon contributes to a constriction of the arc. Such constriction of the arc increases the temperature at the anode because of the increase in the current density at the anode (arc spot is constricted) and the arc force action on the weld pool (Lorentz force). Moreover, fluorine contributes to the increase in the associated arc voltage [17,18,19,20,21].
Literature shows that more than 32 different oxides were used for ATIG welding of stainless steel according to their weld specimen in order to increase the weld penetration [22]. Fluxes can be used in the form of single flux (oxide or halide type) to study their individual effect on the morphology and on the mechanical properties [23,24,25], or in the form of mixed fluxes. In general, the mixed fluxes can be either binary or ternary. The binary fluxes allow getting optimum percentages that can improve the aspect, and the shape, as well as the mechanical properties of welds [26,27,28,29,30,31]. However, in ternary fluxes, statistical programs are used to develop a formulation on the percentages of the flux components in the aim of enhancing depth and mechanical properties of the welds [32,33,34,35].
In this work three different kinds of oxide fluxes, namely MoO3-TiO2-SiO2, were used to investigate the effects of combinations of these oxides and the best composition of flux to improve the depth of weld with the best mechanical properties of 430 ferritic stainless steel comparing to the conventional TIG process.

2. Experimental Procedure

Test specimens were made from 430 ferritic stainless steel with dimensions 200 mm × 200 mm × 5.5 mm. Chemical composition was shown in Table 1. Figure 1 shows test samples for mechanical testing and weld morphology. Prior welding acetone was used to clean and remove dust and contaminations.
Three different kinds of oxide fluxes, SiO2, MoO3, and TiO2, were used. Products have been heated separately in furnace at 150 °C during 1 h to eliminate humidity. A flux in the form of powder has been mixed with acetone and made in the form of paste; brush was used to apply the mixture on plain surface to be welded. The TIG welding machine was used. A water-cooled torch with a standard 2% thoriated tungsten electrode rod having diameter of 3.2 mm has been used for the experiments. The end of the electrode was prepared by reducing the tip angle to 45° and the arc length was 2 mm. The shield gas flow rate was 8 L/min and 4 L/min on back side of weld. The torch was mounted on a motorized carriage as shown in Figure 2. The welding parameters selected for TIG welding are listed in Table 2.
After the welding process, the samples for mechanical testing (tensile, impact and hardness tests) were cut far from the welding starting point to be sure that at this location the arc welding was stabilized. The morphology of the welds was revealed by an etching operation of the samples in an acid bath consisting of one volume of water, 2 volumes of hydrochloric acid (HCl) and one volume of nitric acid (HNO3). Samples for hardness measurements underwent the same treatment mentioned above.
The tensile tests were carried out with a computer control electro-hydraulic servo universal testing machine model WAW-300E (Jinan testing equipment IE, Jinan, China). The specimens were cut according to ASTM E8M-04 as shown in Figure 3.
The impact tests were performed with the Charpy “V” notch impact testing machine model JBS-500 (Jinan testing equipment IE, Jinan, China). The specimens were cut according to ASTM E23 and broken in the impact test in the weld zone and in the heat affected zone (HAZ) as shown in Figure 4.
Vickers hardness measurements were obtained by a digital hardness tester model HVS-50 (SCTMC, Shanghai, China) and according to ASTM E92-82 with a standard load of 10 kgf. For each sample, the considered result was the average value of five indentations in the weld bead as shown in Figure 5.
In order to investigate the corrosion resistance, potentiodynamic polarization tests were used by a potentiostat system AUTOLAB-PGSTAT302N (Metrohm, Utrecht, Netherlands). The samples were cut to the dimensions of 20 × 20 mm2 and polished to 1200 grit with SiC Emri papers. The tests were conducted on parent material, TIG welded material and ATIG welded material. The potentiodynamic tests were carried out at room temperature in 3.5% NaCl and at a scan rate of 1 mV/s. Silver chloride (Ag/AgCl) was used as the reference electrode, platinum (Pt) as the auxiliary electrode, and the sample as the working electrode.

3. Results

3.1. Weld Morphology

Mixing method in mini tab 17 software (version 17, Minitab, Pennsylvania State University, State College, PA, USA), which is the more appropriate in our work, was applied and that reduce the number of experiments to be conducted. The obtained results are reported in Table 3.
The weld morphology is characterized by the penetration depth D and the bead width W giving the ratio R (D/W).

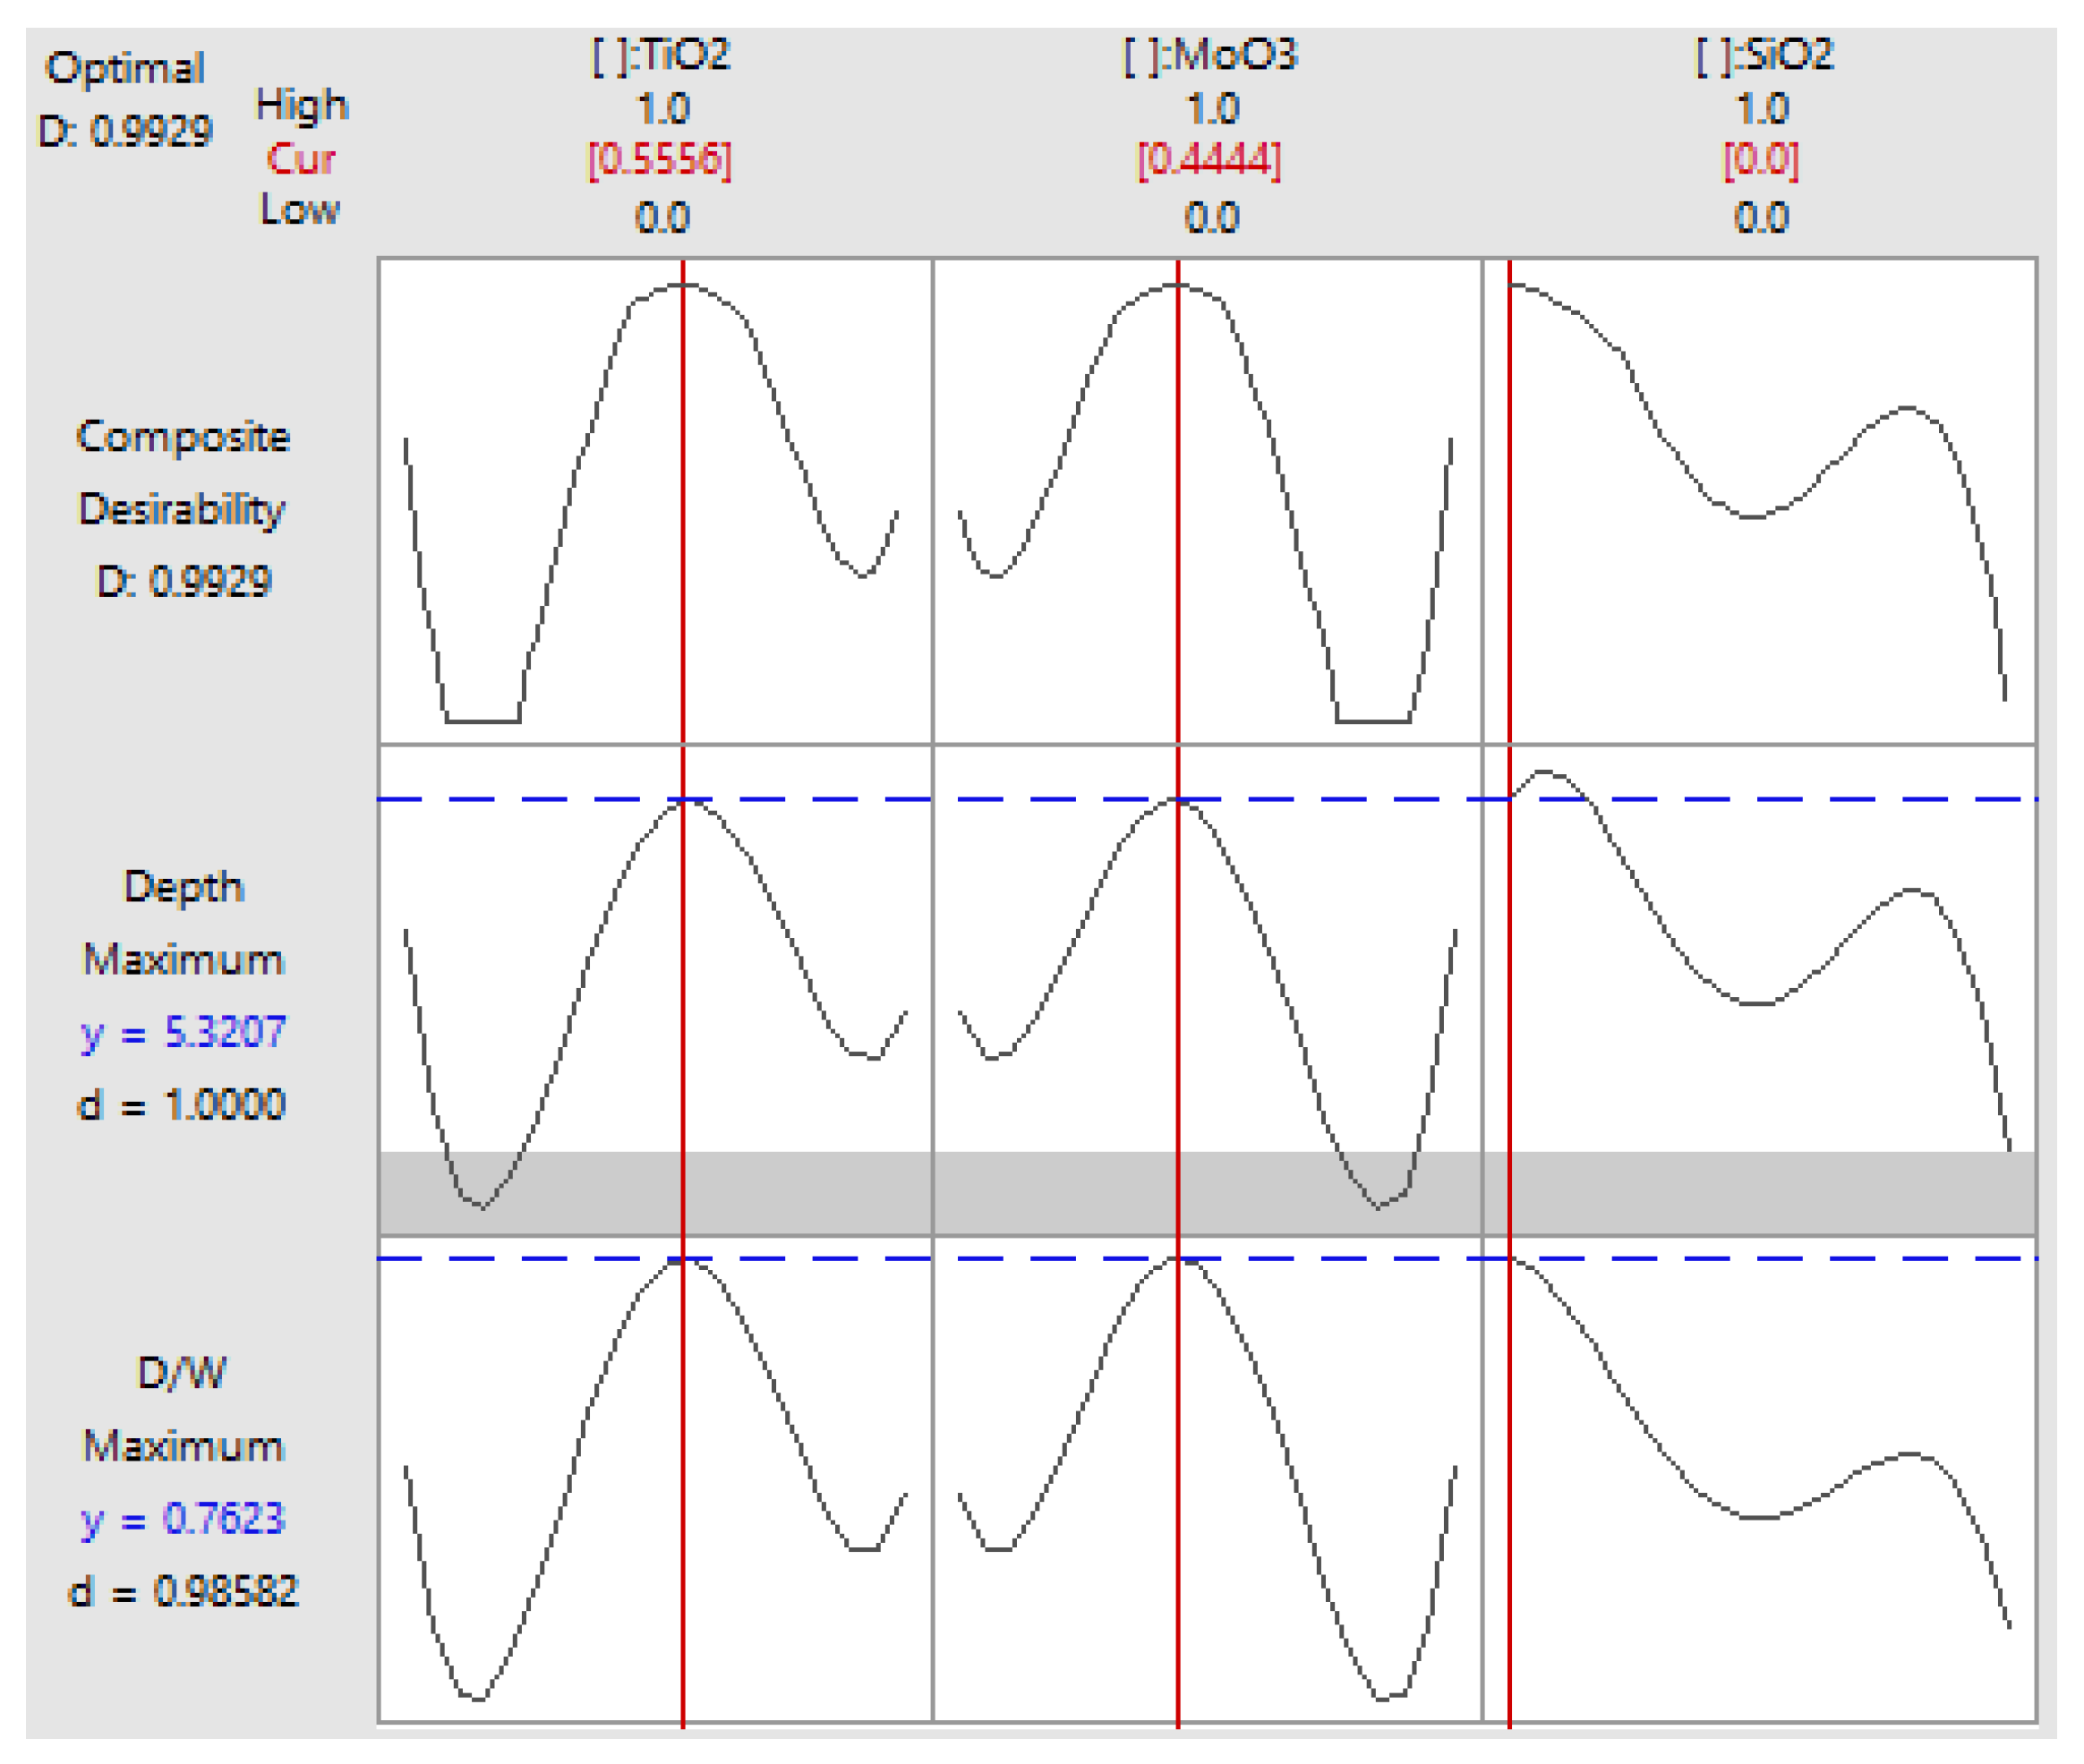
3.2. Mixture Contour Plot

In order to obtain a better depth of weld bead, an optimum combination of the fluxes for the maximum penetration was estimated using Minitab 17 software with the mixing method. The input data was the compositions of flux and the output response was the depth and the ratio (D/W). Triangular coordinate systems allow visualizing the relationships between the components in a three-component mixture. The mixture contour plots of the generated depth of penetration D using Minitab software is shown in Figure 6 and the contour plots of the ration R is shown in Figure 7. All the contour plots were generated based on the experimental results.
The mixture contour plot for depth shows a large region where the maximum depth can be attained.
The mixture contour plot of ratio R shows a very small confined region where a maximum ratio can be achieved. This region is poor on SiO2 and rich on TiO2 and MoO3. To get the best proportions of this three ingredients we used the optimizer module available in Minitab 17. Figure 7 displays the optimization plot for depth and ratio D/W.
The optimization plot in Figure 8 shows how the variables TiO2, MoO3, and SiO2 affect the predicted responses in terms of depth and ratio D/W. Numbers at the top of the columns that show the current variable settings and the high and low variable settings in the data. Two points for each cell represent the two levels of the categorial variable so the level for each variable is 1(high level) and level 0 is low level. The in between level represents the best mixing flux composition which is 56% TiO2 + 44% MoO3 + 0% SiO2.
The first column in Figure 8 contains, for the current variable settings, the predicted response “y”, and the individual desirability score “d”. So, the predicted response for depth is y = 5.32 mm and the corresponding desirability is 1. The predicted response for ratio D/W is y = 0.76, the corresponding desirability is 0.98. The overall composite desirability becomes 0.99. It indicates that the variables achieve favorable results for all responses, which means that both responses are within acceptable limits.

3.3. Confirmation Test

ATIG welding was performed using the flux having the optimum composition (optimal flux) under the same welding parameters. The cross-sections of the weld beads were photographed using an optical microscope CAROLINA (CAROLINA, Burlington, VT, USA). The obtained penetration depth D was 7.24 mm and the bead width W was 9.70 mm leading to an aspect ratio D/W of 0.75. Bead profile data of the weldments of ATIG with the optimal flux and of the conventional TIG are listed in Table 4 and displayed in Figure 9. Figure 10 presents micrographs showing the cross section of TIG welded bead and that of ATIG with optimal flux. It is clearly shown that the bead has a full penetration for ATIG. Table 4 and Table 5 show standard deviation (σ), which represents a measure of the amount of variation or dispersion of a set of values. For depth and width measurements, standard deviation is less than 0.3 mm.
From Table 6, it can be seen that the ATIG penetration depth was increased of about 99% comparatively to that one of the conventional TIG welding.

3.4. Effect of Optimal Flux on Mechanical Properties
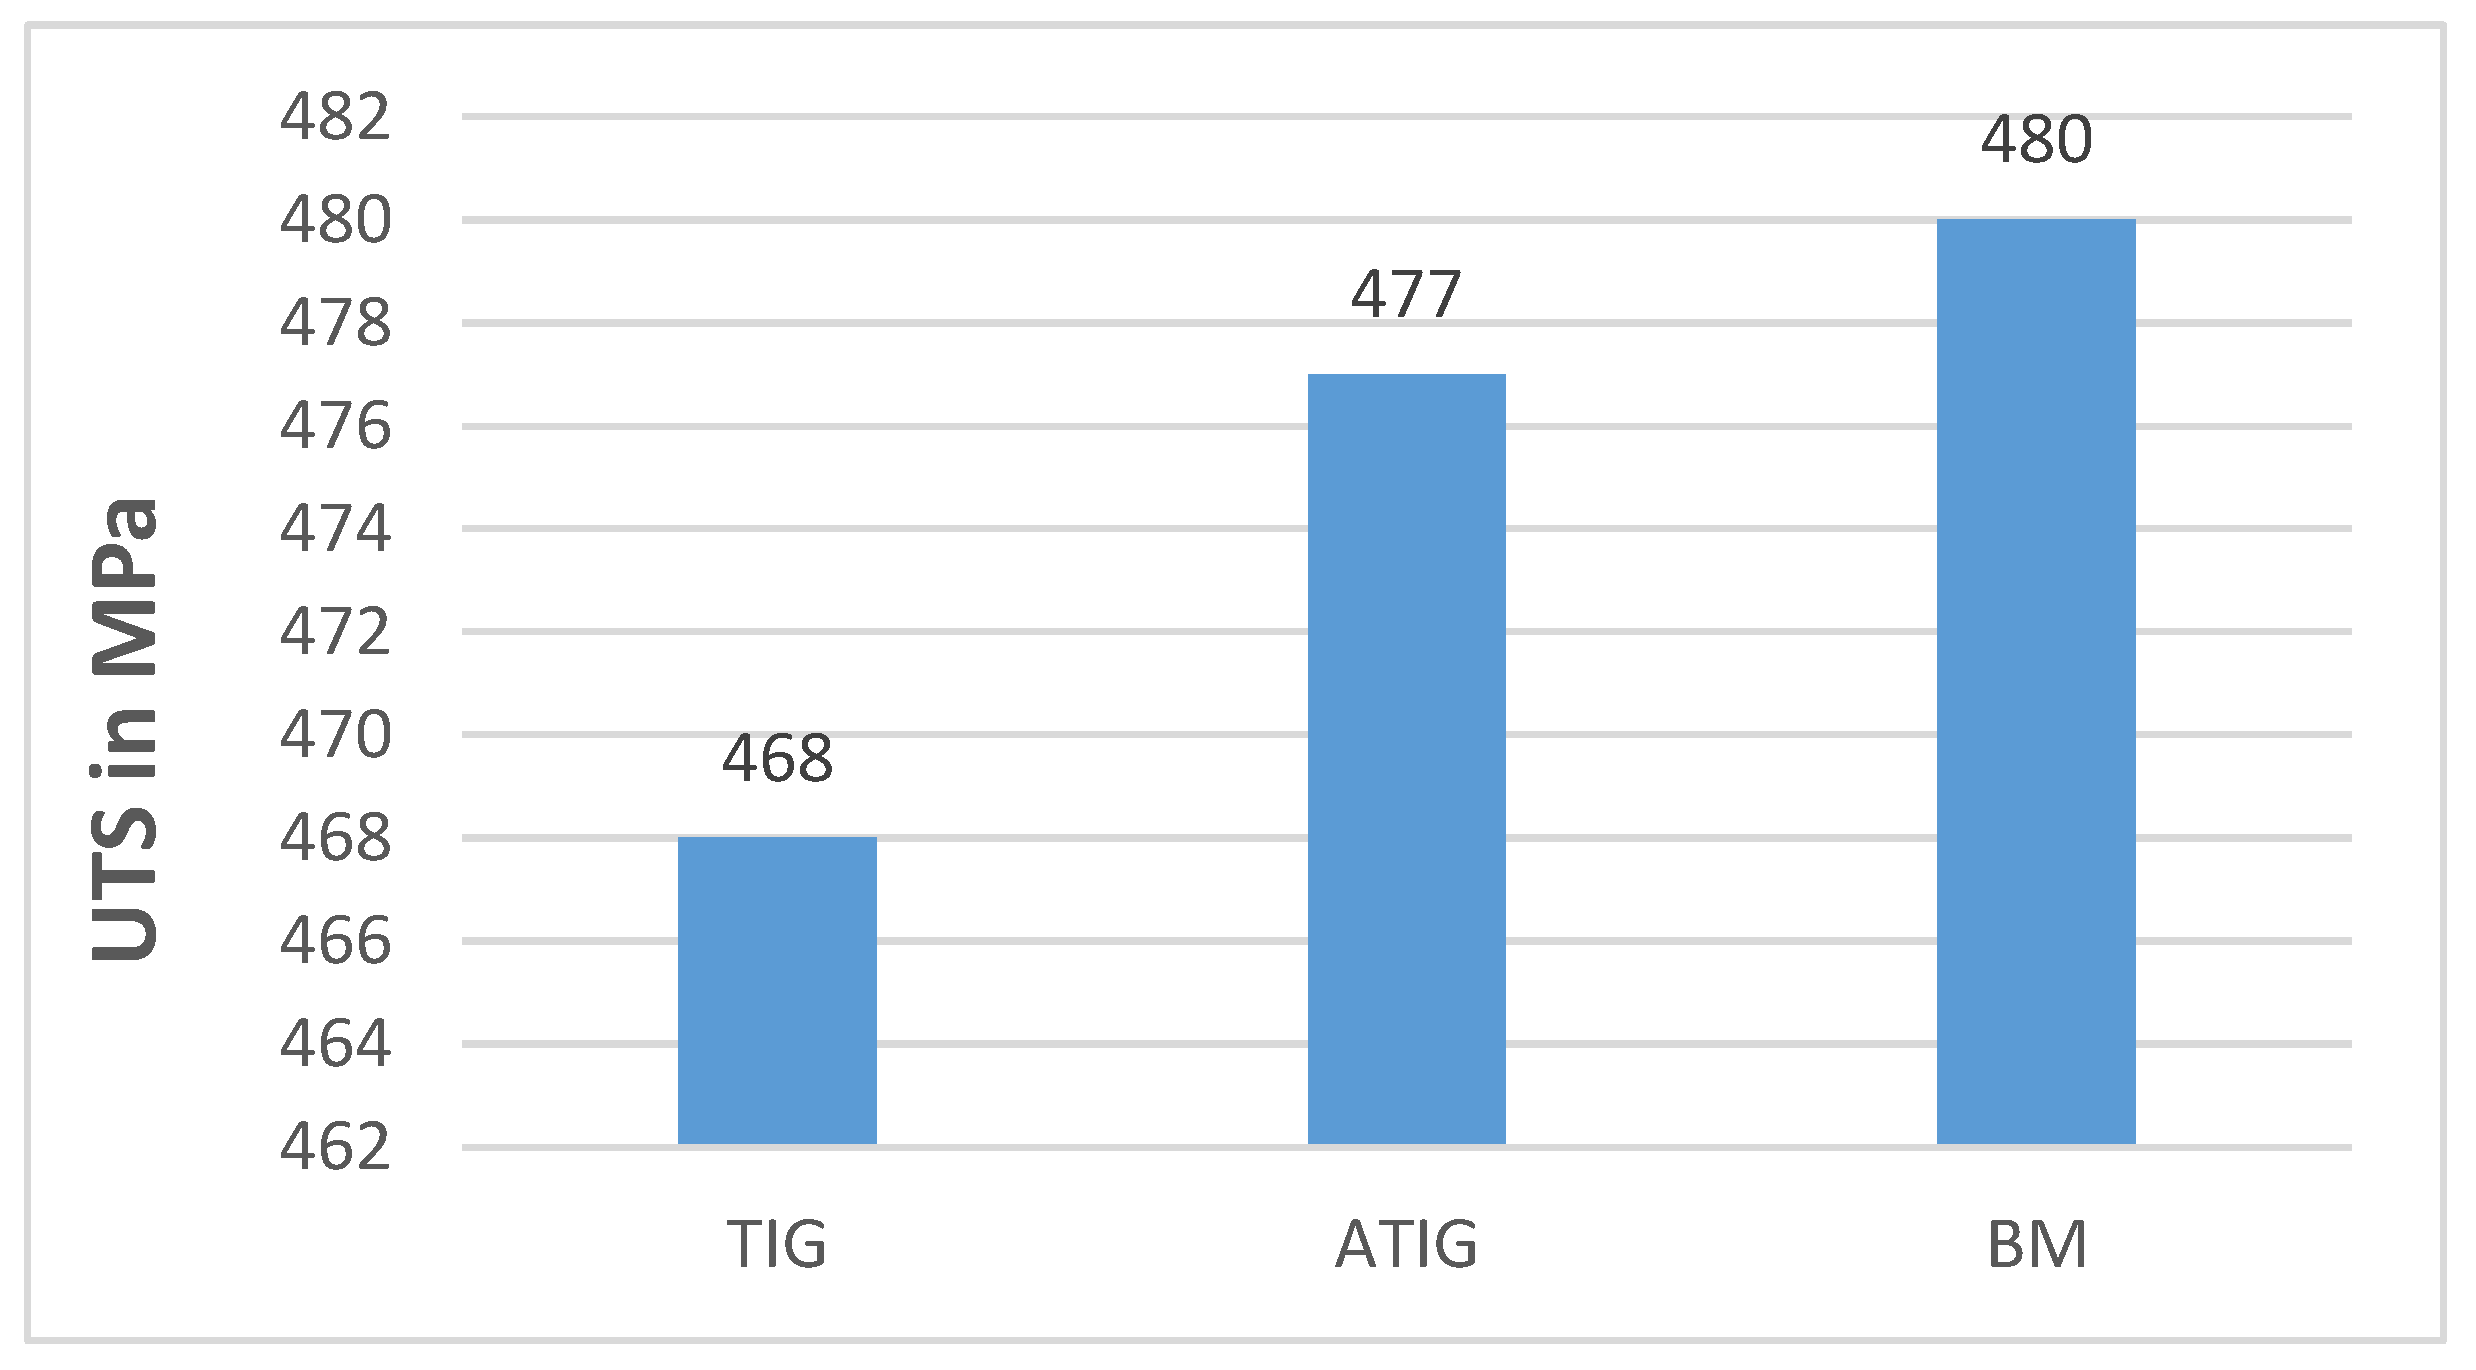
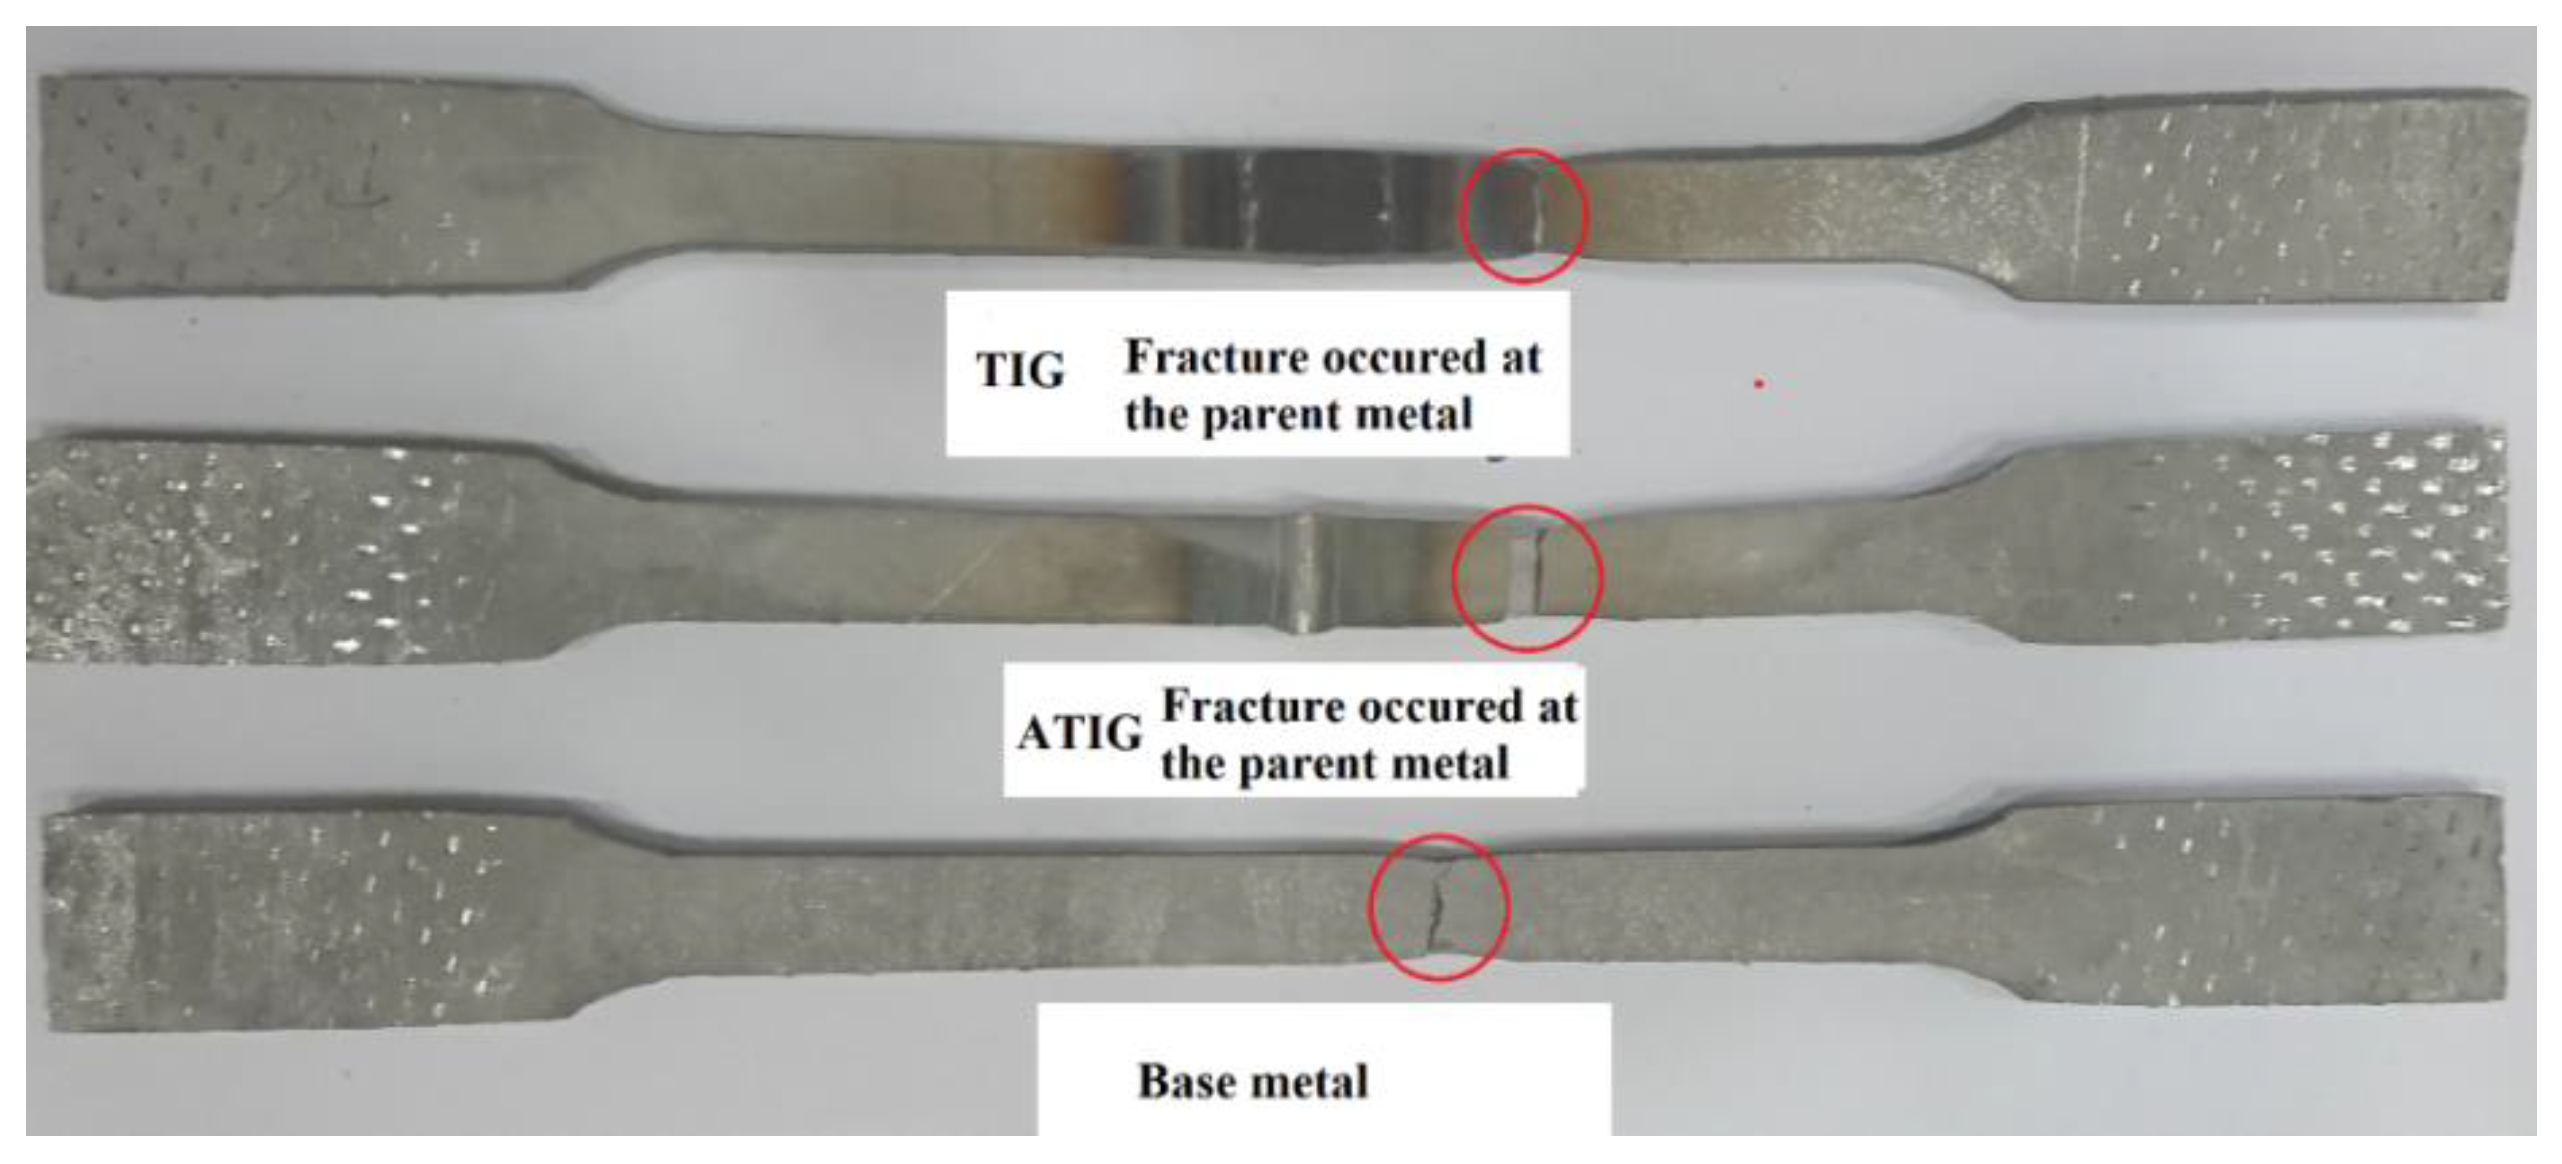
3.4.1. Tensile Test

Results of the tensile test show that the ultimate tensile strength UTS related to ATIG welding is bigger than that one of TIG welding of about 9 MPa. However, these values of UTS can be considered close, as shown in Figure 11. So, we conclude that the optimal flux used in ATIG welding had an impact on the strength resistance of the weld. We notice that the fractures for both TIG and ATIG occur far from the weld zone as shown in Figure 12. Table 7 shows the maximum, minimum, mean and standard deviation (σ) of tensile strength. Standard deviation is less than 19 MPa.

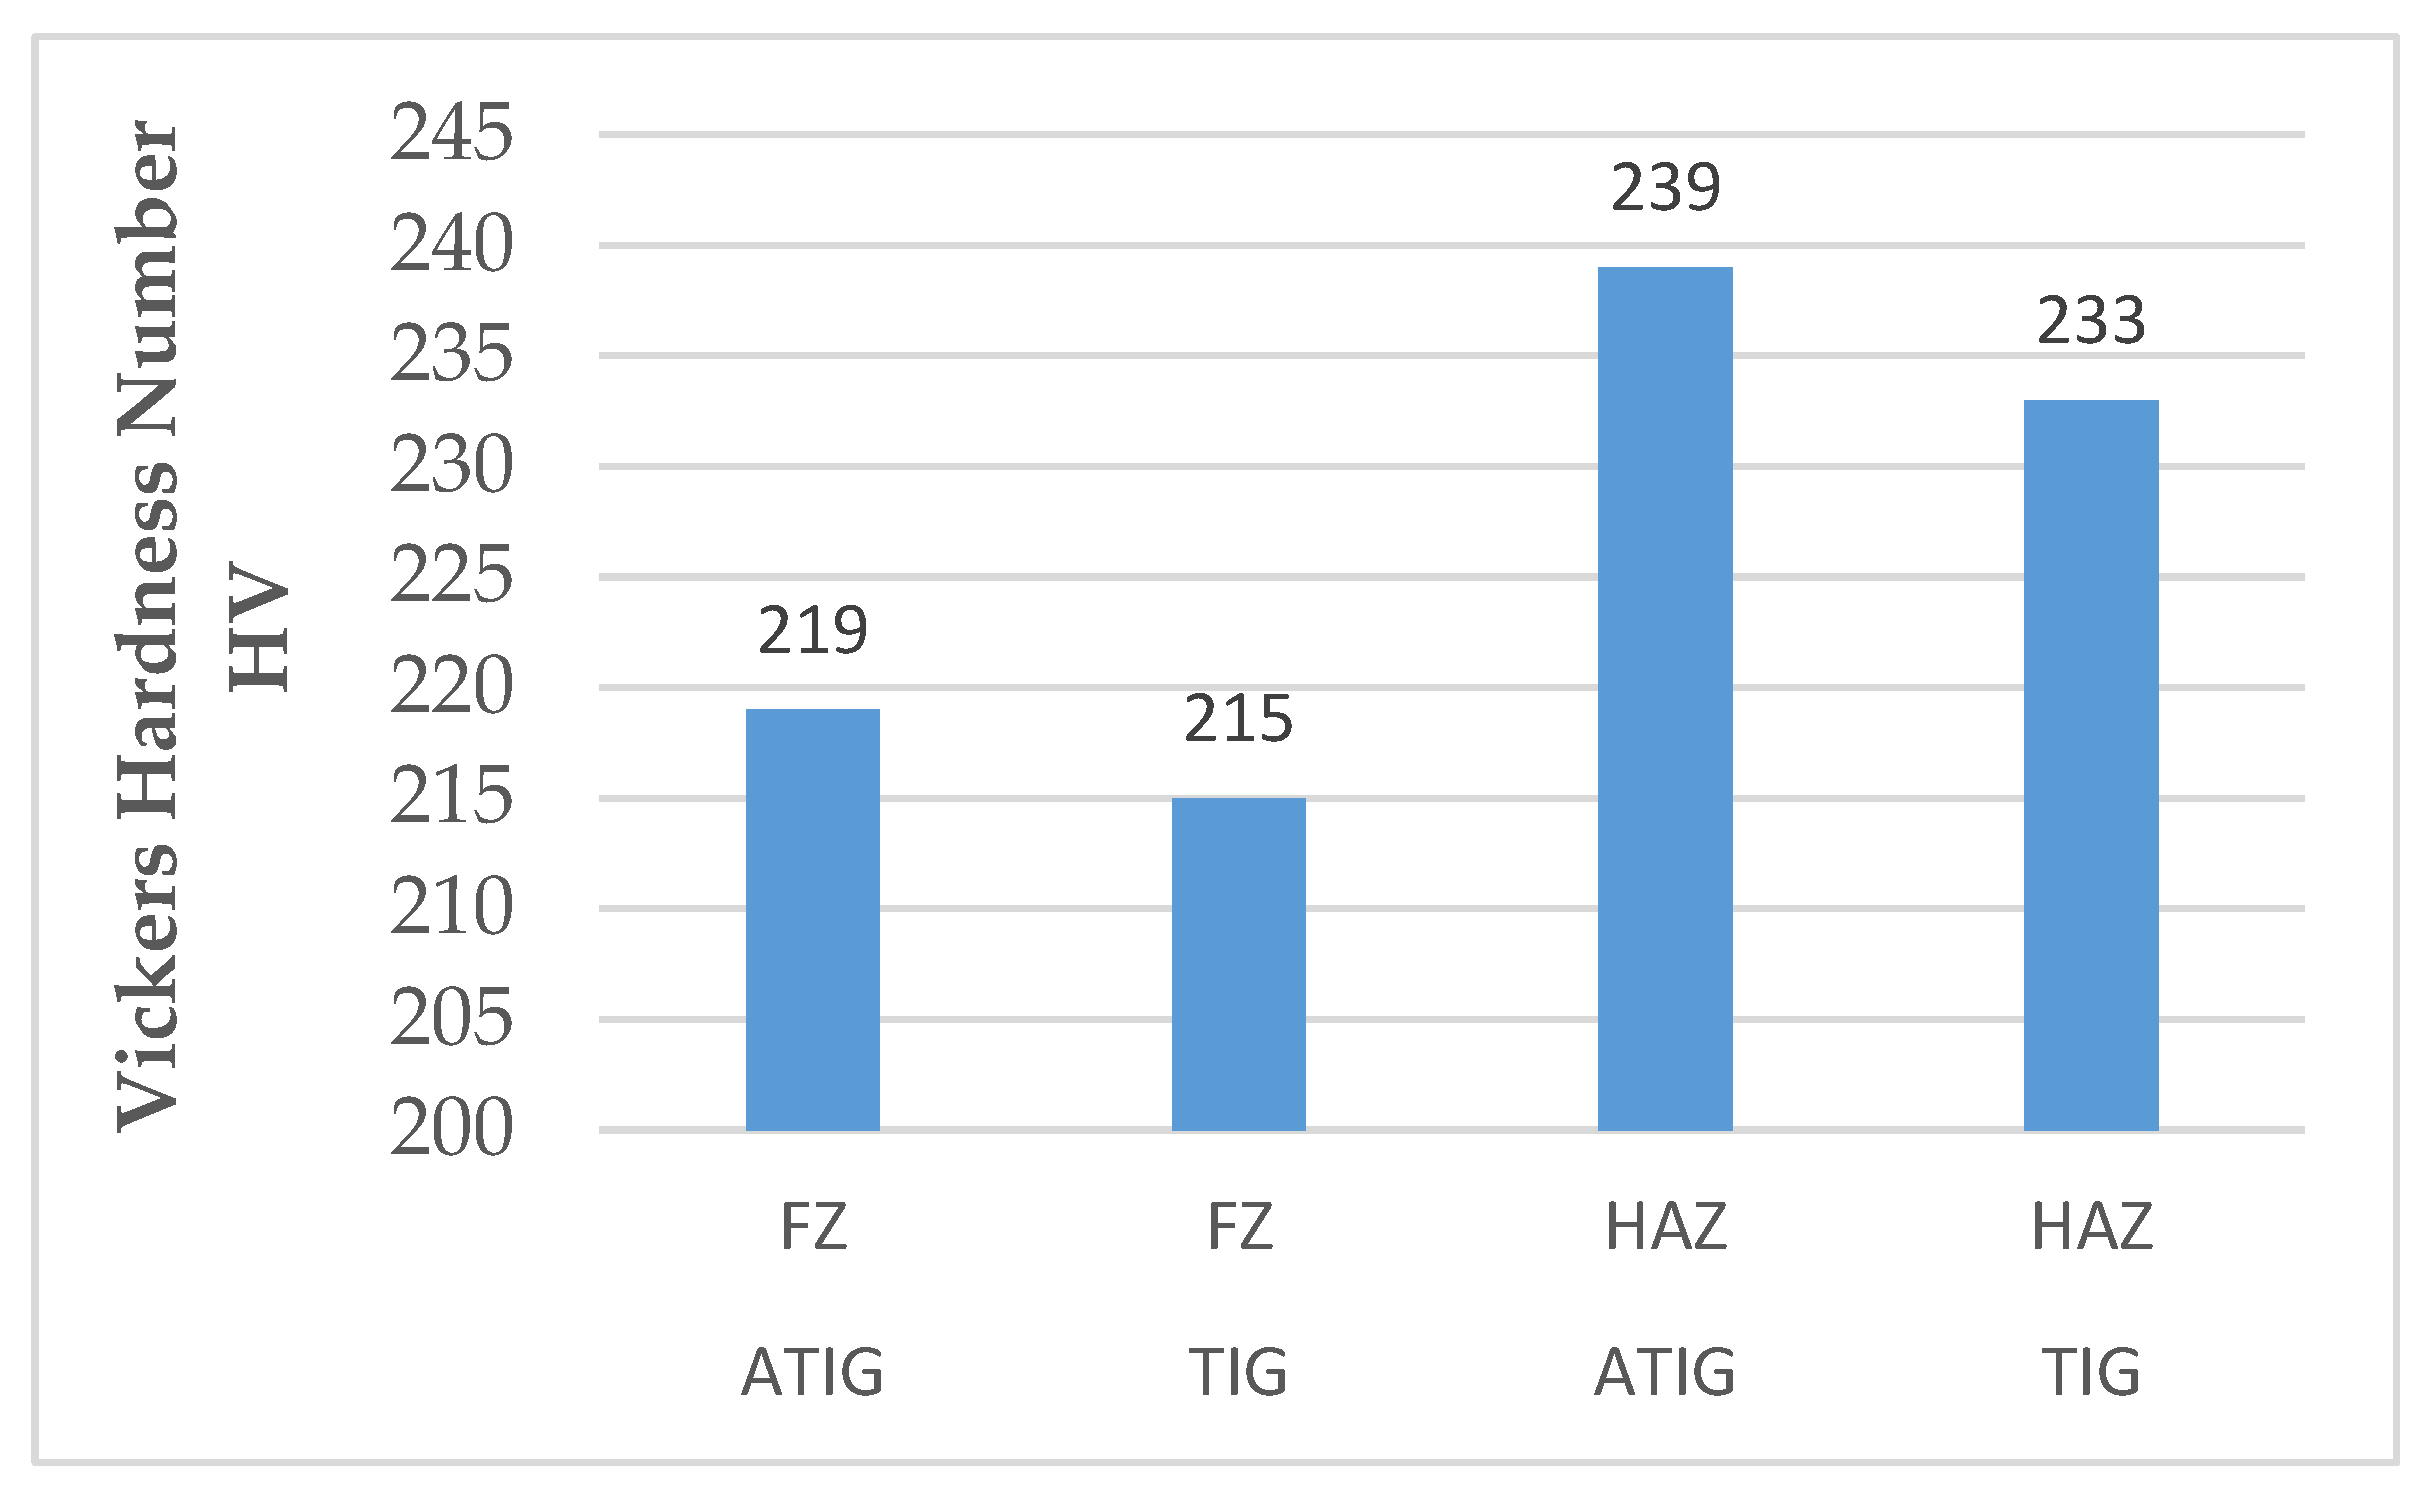
3.4.2. Hardness Test
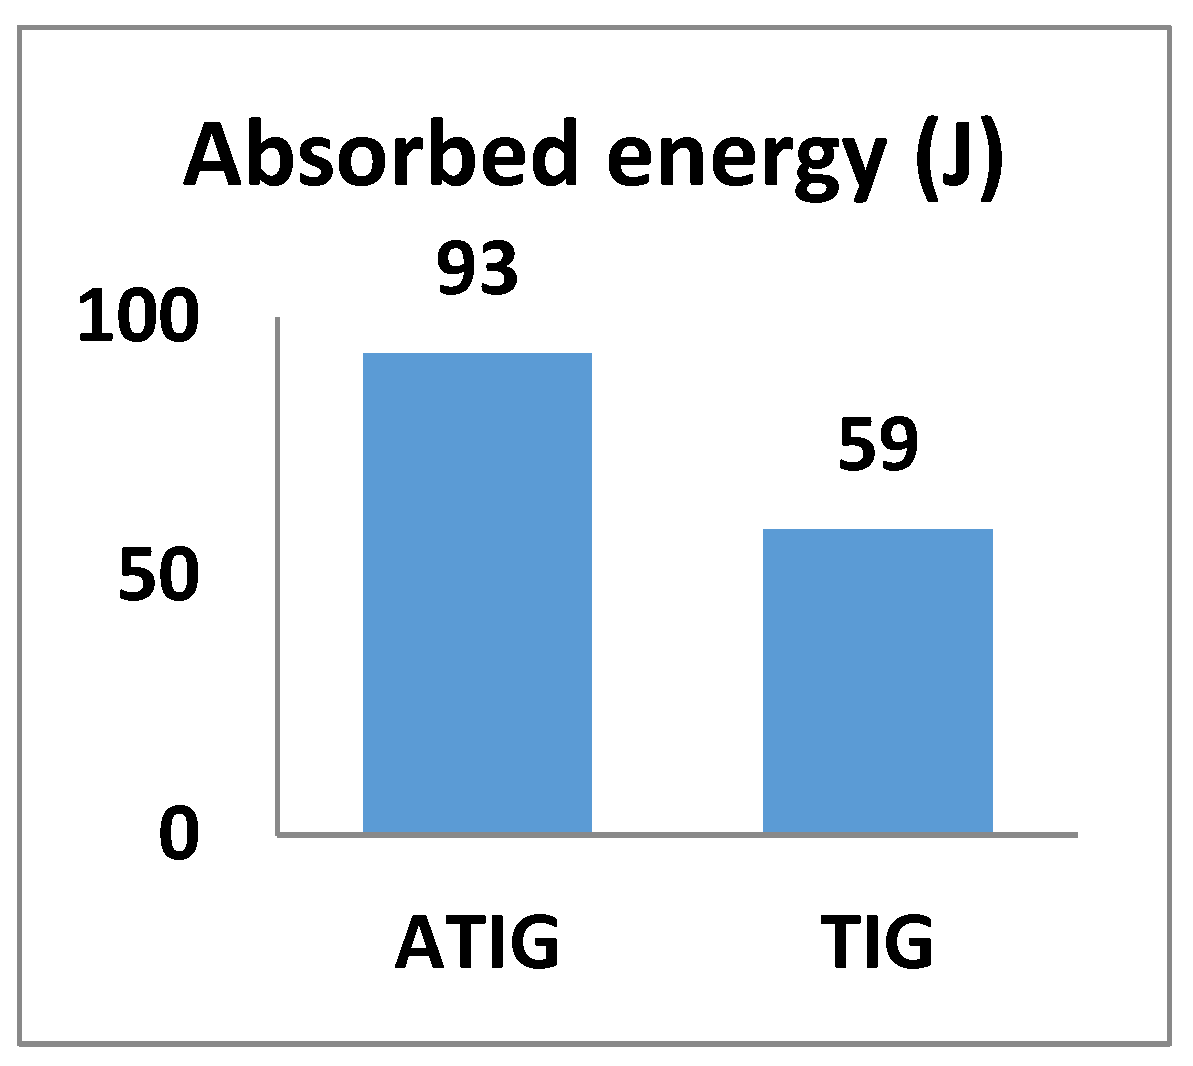
Five measurements of Vickers hardness were performed on the cross sectioned coupon in two regions, namely the fusion zone FZ and heat affected zone HAZ. The considered hardness measurement value is the average of these five measurements. Figure 13 shows the Vickers hardness results of TIG weldment without and with activating fluxes in FZ and HAZ. It can be clearly seen that the hardness of ATIG weld is slightly greater than those of TIG weld in both FZ and HAZ. Table 8 shows maximum, minimum, mean, and standard deviation (σ) of hardness HV. Standard deviation is less than 9 HV.

3.4.3. Impact Test

In order to accurately evaluate the breaking energy in the whole sample, two positions of the notch have been considered and fabricated on the sample, one notch in the fusion zone (FZ) and the other in the heat affected zone (HAZ). Figure 14 presents the obtained results of the impact test in FZ related to conventional TIG welding and ATIG welding with the optimal flux. The results show that the absorbed energy for ATIG weld was 93 J and fell to 59 J for TIG weld. Hence, the result confirms the benefits of using ATIG welding with the optimal flux. The Table 9 shows maximum, minimum, mean, and standard deviation (σ) of energy absorbed in fusion zone. Standard deviation is less than 1.5 J.
Figure 15 presents the obtained results of the impact test in HAZ of conventional TIG welding and ATIG welding with the optimal flux. The results show the same trend as above (notch at FZ). The absorbed energy in HAZ of ATIG weld rose to 93 J. In contrast, the absorbed energy of TIG welds was within limit of 52 J. Once again, the result confirms the advantage of ATIG welding regarding the impact test.
The Table 10 shows maximum, minimum, mean, and standard deviation (σ) of energy absorbed in HAZ. Standards deviation is less than 1.5 J.
The obtained impact test results for ATIG welding in FZ or in HAZ are similar. Moreover, almost the same tendency is obtained for TIG welding. As ATIG weld bead is too large, the heat is evacuated slowly; and the proportion of martensite is less than that of TIG welding. As TIG weld bead is relatively small and characterized by a fast cooling rate, martensite and sigma phases are very likely to be developed. Due to the fact that martensite and sigma phases are brittle, the ATIG weld has the property to withstand to sudden loads than TIG weld. On the other hand, the formation of carbide titanium, due to the presence of titanium in the optimal flux in ATIG weld, refines the weld zone grains and so improves the ductility of ATIG weld [36].

3.5. Microstructure

3.5.1. SEM Analysis

Fractographs of impact test conducted on JEOL JSM-7600F scanning electronic microscope (SEM, JEOL, Tokyo, Japan) are represented in Figure 16a–d. Micrograph in Figure 16b shows the formation of multiple dimples which demonstrate that the fracture is in ductile mode in the case of ATIG weld zone. In ATIG heat affected zone in Figure 16d, the fracture is also in ductile mode but with multiple dimples. Moreover, a phenomenon of coalescence of micro-voids leads to the formation of noticeable macro-voids. Combined ductile and brittle fracture mode characterizes the TIG weld zone as well as the TIG heat affected zone as shown in Figure 16a,c. The fracture surface is composed of thin ridges containing colonies of dimples scattered among regions containing cleavage facets. Hence and according to the fractography analyses, in ATIG welding the fracture is ductile and the breaking energy in impact test is relatively high. However, the combined ductile and brittle fracture mode lead to poor resistance for sudden impact loads, as in TIG welding. This analysis explains the obtained results in impact test.

3.5.2. EDS/SEM Analysis

Figure 17 and Figure 18 show spectrum analyses of fracture face of TIG and ATIG weld zones, respectively.
Table 11 shows a decrease of carbon in TIG weld zone compared to the result of ATIG displayed in Table 12. The cooling rate in TIG weld is also fast. Hence, there is a formation of martensite at ferrite grain boundaries. Consequently, carbon element is trapped at the grain boundaries and impedes the formation of high quantities of carbides (Cr,Fe)23C6 as reported by Lippold and Kotecki [37]. In contrast, in the ATIG weld, the cooling rate is relatively slow due to large size of the weld bead and the formation of martensite being less than that of TIG weld. Moreover, the presence of titanium and molybdenum in the optimal flux contribute to the decrease of the amount of carbides (Cr,Fe)23C6. Both elements are strong carbide formers (TiC, MoC) in grains and grain boundaries [38]. The formation of titanium and molybdenum carbides prevents the depletion of chromium in boundaries, which is a benefit to the corrosion resistance
Figure 19 and Figure 20 show spectrum analyses of fracture face of TIG and ATIG respectively in HAZ. The TIG weld is partially penetrated and the HAZ rapidly cools leading to the formation of high proportion of martensite phase. Consequently, the available quantity of carbon element is low as shown in Table 13. Regarding ATIG, the HAZ cools slowly and the quantity of martensite is relatively low. Hence, the carbon remaining in carbide precipitations is high as shown in Table 14.

3.6. Corrosion Behavior

Figure 21 shows the potentiodynamic curves of ferritic stainless steel base metal, TIG welded and ATIG welded.
The electrochemical parameters are listed in Table 15.
The corrosion potential is a static indicator of electrochemical corrosion resistance, which reveals the susceptibility of materials to corrosion. It is visible that the corrosion potential Ecorr for metal welded with flux ATIG was shifted to positive value with respect to both base metal and metal welded with TIG. The weld obtained from the optimal flux exhibit better corrosion resistance (−600 mV). On the other hand, the corrosion rate, which is a kinetic characteristic of surface material, of ATIG decreased to 0.094 mm/y when compared to the base metal where it was 0.102 mm/y, however it was increased compared to TIG.

4. Conclusions

The present work investigated the effects of three oxides (MoO3-TiO2-SiO2) on bead geometry and on mechanical behavior of weldment ferritic 430 stainless steel sheet produced by TIG welding. According to the obtained results, the following conclusions can be drawn:
(1)
Based on the simplex lattice degree four design, nineteen compositions have been prepared from three oxides (TiO2, MoO3 and SiO2), the best obtained formulation was 55% TiO2 + 45% MoO3. The depth weld of the optimized formula was doubled (7.24 mm) in comparison to conventional TIG weld bead (3.64 mm).
(2)
The mechanical properties (hardness, tensile strength, and breaking absorbed energy) were not decreased using ATIG welding.
(3)
The corrosion potential Ecor for metal welded with the ATIG flux was shifted to positive value.

Author Contributions

Conceptualization, K.T.; methodology, K.T. and R.D.; software, K.T.; validation, K.T., R.D., A.O. and A.C.H.; formal analysis, K.T.; investigation, K.T., R.D., A.O. and A.C.H.; resources, H.A.; data curation, K.T.; writing—original draft preparation, K.T.; writing—review and editing, K.T., R.D., A.O.; visualization, E.-S.M.S. and H.S.A.; supervision, K.T.; project administration, H.A., I.A., B.A.; funding acquisition, H.A. All authors have read and agreed to the published version of the manuscript.

Funding

This work is supported by the Deanship of Scientific Research in Prince Sattam Bin Abdulaziz University—KSA under the research project number 2019/01/10885

Conflicts of Interest

The authors declare no conflict of interest.

References

  1. Gurevich, S.M.; Zamkov, V.N.; Kushnirenko, N.A. Improving the penetration of titanium alloys when they are welded by argon tungsten arc process. Automat. Weld. 1965, 9, 1–4. [Google Scholar]
  2. Makara, A.M.; Kushnirenko, B.N.; Zamkov, V.N. High-tensile martensitic steels welded by argon tungsten arc process using flux. Automat. Weld. 1968, 7, 78–79. [Google Scholar]
  3. Nazarenko, O.K. Up-to-date equipment of the E.O.Paton electric welding institute for electron beam welding. Paton Welding J. 2008, 10, 21–35. [Google Scholar]
  4. Gurevich, S.M.; Zamkov, V.N.; Kushnirenko, N.A. Increase in the efficiency of penetration of titanium alloys in argon arc welding. Avtomatich Svarka 1965, 9, 1–5. [Google Scholar]
  5. Gurevich, S.M.; Zamkov, V.N. Some peculiarities of tungsten electrode welding of titanium using fluxes. Ibid. 1966, 12, 13–16. [Google Scholar]
  6. Marya, S. Theoretical and Experimental Assessment of Chloride Effects in the A-TIG Welding of Magnesium. Weld. World 2002, 46, 7–21. [Google Scholar] [CrossRef]
  7. Paskell, T.; Lundin, C.; Castner, H. GTAW flux increases weld joint penetration. Weld. J. 1997, 76, 57–62. [Google Scholar]
  8. Adams, A.E. NJC flux reduces distortion on turbine engine housing for defense contractor. Welding J. 2000, 1, 92. [Google Scholar]
  9. Fan, D.; Zhang, R.; Gu, Y.; Ushio, M. Effect of flux on A-TIG of mild steels. Trans. JWRI 2001, 30, 35–40. [Google Scholar]
  10. Saidov, R.; Mourton, H.; Le Gall, R.; Saindrenan, G. Le soudage A-TIG de l’acier inoxydable superduplex UR52N. Soudage et Techniques Connexes 1999, 53, 4–8. [Google Scholar]
  11. Marya, S.; Touileb, K.; Binard, J. Effect of Minor Chemistry variations on the Laser Melts Profiles of two stainless steels. In Proceedings of the 5th International Conference on Welding and Melting by Electron and Laser Beams “CISFEL”, Nantes, France, 14–18 June 1993; pp. 267–274. [Google Scholar]
  12. Marya, S.; Touileb, K.; Marya, M. Effect of surface tension on GTWA profiles in 316 Austenitic Stainless Steels. In Proceedings of the 6th International Symposium, JWS, Nagoya, Japan, 19–21 November 1996. [Google Scholar]
  13. Hdhibi, A.; Touileb, K.; Djoudjou, R.; Ouis, A.; Bouazizi, M.L.; Chakhari, J. Effect of single oxide fluxes on morphology and mechanical properties of ATIG on 316 L austenitic stainless steel welds. ETASR 2018, 8, 3064–3072. [Google Scholar]
  14. Touileb, K.; Hdhibi, A.; Djoudjou, R.; Mohamed, A.; Ouis, A.; Bouazizi, M.L. Mixing Design for ATIG Morphology and Microstructure Study of 316L Stainless Steel. ETASR 2019, 9, 3990–3997. [Google Scholar]
  15. Lu, S.P.; Fujii, H.; Sugiyama, H.; Tanaka, M.; Nogi, K. Marangoni convection and welding penetration in A-TIG welding. Trans. JWRI 2003, 32, 79–82. [Google Scholar]
  16. Heiple, C.R.; Roper, J.R. Mechanism for minor element effect on GTA fusion zone geometry. Weld. J. 1982, 61, 97–102. [Google Scholar]
  17. Howse, D.S.; Lucas, W. An investigation in to arc construction by active flux for TIG welding. Sci. Technol. Weld. Joining 2000, 5, 189–193. [Google Scholar] [CrossRef]
  18. Li, Q.M.; Wang, X.H.; Zou, Z.D.; Wu, J. Effect of activating flux on arc shape and arc voltage in tungsten inert gas welding. Trans. Nonferrous Met. Soc. China 2007, 17, 486–490. [Google Scholar] [CrossRef]
  19. Leconte, S.; Paillard, P.; Chapelle, P.; Henrion, G.; Saindrenan, J. Effects of flux containing fluorides on TIG welding process. Sci. Technol. Weld. Joining 2007, 12, 120–126. [Google Scholar] [CrossRef]
  20. Barroso, N.F.; Paes, R.F.; Lopes, C.P.; De oliveira, W.C. Effect of ZnCL2-acetone flux on atig welding of aluminum alloys. In Proceedings of the 8th Brazilian Congress of Manufacturing Engineering, Bahia, Brazil, 18–22 March 2015. [Google Scholar]
  21. Marya, M.; Edwards, G. Chloride contributions in flux assisted GTA welding of magnesium alloys. Weld. J. N. Y. 2002, 81, 291–298. [Google Scholar]
  22. Yushchenko, K.A.; Kovalenko, D.V.; Kovalenko, I.V. Peculiarities of A-TIG Welding of Stainless Steel. In Proceedings of the 7th International Conference on Trends in Welding Research, Callaway Gardens Resort, Pine Mountain, GA, USA, 12–16 May 2005; pp. 16–20. [Google Scholar]
  23. Tseng, K.; Chuang, K. Application of iron-based powders in tungsten inert gas welding for 17Cr-10Ni-2Mo alloys. Powder Technol. 2012, 228, 36–46. [Google Scholar] [CrossRef]
  24. Lu, S.P.; Fujii, H.; Sugiyama, H.; Tanaka, M.; Nogi, K. Welding penetration and marangoni convection with oxide fluxes in GTA welding. Mater. Trans. 2002, 43, 2926–2931. [Google Scholar] [CrossRef] [Green Version]
  25. Duhan, R.; Choudhary, S. Effect of different fluxes on hardness and microstructure of SS 304in GTAW welding. Int. J. Mech. Eng. 2014, 3, 1–8. [Google Scholar]
  26. Chern, T.S.; Tseng, K.H.; Tsai, H.L. Study of the characteristics of duplex stainless steel activated tungsten inert gas welds. Mater. Des. 2011, 32, 255–263. [Google Scholar] [CrossRef]
  27. Modenesi, P.J.; Apolinario, E.R.; Pereira, I.M. TIG welding with single-component fluxes. J. Mater. Process. Technol. 2000, 99, 260–265. [Google Scholar] [CrossRef]
  28. Vasantharaja, P.; Vasudevan, M. Studies on A-TIG welding of Low Activation Ferritic/Martensitic (LAFM) steel. J. Nucl. Mater. 2012, 421, 117–123. [Google Scholar] [CrossRef]
  29. Tseng, K.H.; Hsu, C.Y. Performance of activated TIG process in austenitic stainless steel welds. J. Mater. Process. Technol. 2011, 211, 503–512. [Google Scholar] [CrossRef]
  30. Yang, C.L.; Lin, S.B.; Liu, F.Y.; Lin, W.; Zhang, Q.T. Research on the mechanism of penetration increase by flux in ATIG welding. J. Mater. Sci. Technol. 2003, 19, 225–227. [Google Scholar]
  31. Duhan, R.; Choudhary, S. Effect of Activated Flux on Properties of SS 304 Using TIG Welding. Int. J. Eng. Trans. B Appl. 2015, 28, 290–295. [Google Scholar]
  32. Paul, B.G.; Ramesh Kumar, K.C. Effect of single component and binary fluxes on the depth of penetration in a-TIG welding of Inconel alloy 800H austenitic stainless steel. Int. J. Adv. Eng. Global Technol. 2017, 5, 1791–1795. [Google Scholar]
  33. Tseng, K.H.; Wang, W.C. Study of Silica-Titania Mixed Flux Assisted TIG Welding Process. Adv. Mat. Res. 2011, 291, 949–953. [Google Scholar] [CrossRef]
  34. Patel, A.B.; Patel, S.P. The effect of activating fluxes in TIG welding by using Anova for SS 321. Int. J. Eng. Res. Appl. 2014, 4, 41–48. [Google Scholar]
  35. Venkatesan, G.; George, J.; Sowmyasri, M.; Muthupandi, V. Effect of ternary fluxes on depth of penetration in A-TIG welding of AISI 409 ferritic stainless steel. Procedia Mater. Sci. 2014, 5, 2402–2410. [Google Scholar] [CrossRef] [Green Version]
  36. Mallaiaha, G.; Ravinder, P.; Kumar, A. Influence of titanium addition on mechanical properties, residual stresses and corrosion behaviour of AISI 430 grade ferritic stainless steel GTA welds. Procedia Mater. Sci. 2014, 6, 1740–1751. [Google Scholar] [CrossRef] [Green Version]
  37. Lippold, J.; Kotecki, D. Welding Metallurgy and Weldability of Stainless Steels; John Wiley & Sons: Hoboken, NJ, USA, 2005. [Google Scholar]
  38. Kuzucu, A.; Aksoy, M.; Korkut, C. The effect of strong carbide-forming elements such as Mo, Ti, V and Nb on the microstructure of ferritic stainless steel. J. Mater. Process. Technol. 1998, 82, 165–171. [Google Scholar] [CrossRef]
Figure 1. Test specimens for mechanical testing and weld morphology.
Metals 10 00404 g001
Figure 2. Experimental machine of TIG welding with flux paste: a motorized carriage, torch and workpiece.
Metals 10 00404 g002
Figure 3. Test specimen for the tensile test (units in mm).
Metals 10 00404 g003
Figure 4. Test specimens for the impact test (units in mm). The notch is in the weld zone (a) and in the heat affected zone HAZ (b).
Metals 10 00404 g004
Figure 5. Hardness test locations in the FZ and HAZ of ATIG (a) and TIG (b).
Metals 10 00404 g005
Figure 6. Mixture contour plot of depth D.
Metals 10 00404 g006
Figure 7. Mixture contour plot of ratio R (D/W).
Metals 10 00404 g007
Figure 8. The optimization plot for depth and ratio D/W.
Metals 10 00404 g008
Figure 9. ATIG (optimal flux) and TIG (conventional) welded beads morphology.
Metals 10 00404 g009
Figure 10. Widh (W) and depth (D) of welded beads of TIG (a) and ATIG (b).
Metals 10 00404 g010
Figure 11. Tensile test results.
Metals 10 00404 g011
Figure 12. Fracture zones in base metal, TIG weld and in ATIG weld.
Metals 10 00404 g012
Figure 13. Hardness test results.
Metals 10 00404 g013
Figure 14. Impact test results of ATIG and TIG in FZ.
Metals 10 00404 g014
Figure 15. Impact test results of ATIG and TIG in HAZ.
Metals 10 00404 g015
Figure 16. Fractographs of impact test in: (a) TIG weld zone; (b) ATIG weld zone; (c) TIG heat affected zone and (d) ATIG heat affected zone.
Metals 10 00404 g016
Figure 17. EDS/SEM spectrum analysis of fracture face of TIG weld zone.
Metals 10 00404 g017
Figure 18. EDS/SEM spectrum analysis of fracture face of ATIG weld zone.
Metals 10 00404 g018
Figure 19. EDS/SEM spectrum analysis of fracture face of TIG heat affected zone.
Metals 10 00404 g019
Figure 20. EDS/SEM spectrum analysis of fracture face of ATIG heat affected zone.
Metals 10 00404 g020
Figure 21. Potentiodynamic polarization curves obtained for (1) Base metal, (2) TIG, and (3) ATIG. after 1 h immersion in the 3.5% NaCl solutions.
Metals 10 00404 g021
Table 1. Chemical composition of 430 ferritic stainless steel.
ElementsCMnPSSiCrNiN
Weight %0.0250.250.0320.00150.03116.280.0170.0546
Table 2. Welding parameters.
ParametersRange
Welding speed15 cm/min
Welding current180 Amp
Arc Length2 mm
Electrode tip angle45°
Shield gas on work pieceArgon with flow rate 12 L/min
Shield gas on back sideArgon with flow rate 5 L/min
Welding modeNegative direct current electrode
Table 3. Weld bead dimensions and ratio R for the used nineteen fluxes.
Exp. No.TiO2 (weight %)MoO3 (weight %)SiO2 (weight %)W (mm)D (mm)R = D/W
11000.000.007.943.940.50
275250.007.744.530.59
350500.006.905.320.77
425750.008.563.060.36
50.001000.008.464.470.53
60.0075259.884.000.40
70.00505011.962.740.23
80.0025758.844.330.49
90.000.001008.803.060.35
10250.00758.585.030.59
11500.00507.963.970.50
12750.00258.843.980.45
1333.3333.3333.337.484.750.64
1466.6616.6616.667.984.810.60
1516.6666.6616.669.224.230.46
1616.6616.6666.668.963.700.41
1725502510.843.160.29
182525508.844.390.50
195025259.064.550.50
Table 4. Mesurments of depth and standards deviation of TIG and ATIG (optimal flux).
SampleNumber of TestsMax. Depth (mm)Min. Depth (mm)Mean Depth (mm)Standard Deviation σ
TIG33.93.43.630.251
ATIG37.437.17.240.169
Table 5. Mesurments of width and standards deviation of TIG and ATIG (optimal flux).
SampleNumber of TestsMax. Width (mm)Min. Width (mm)Mean Width (mm)Standard Deviation σ
TIG37.37.07.140.052
ATIG39.89.59.700.100
Table 6. Weldment bead profiles data of TIG (conventional) and ATIG (optimal flux).
TIGATIG
DWD/WDWD/W
3.637.140.517.249.700.75
Table 7. Mesurments of tensile strenght and standards deviation of TIG and ATIG (optimal flux).
SampleNumber of TestsUTS Max. (MPa)UTS Min. (MPa)UTS Mean (MPa)Standard Deviation σ
TIG348245746812.76
ATIG349846547718.2
Table 8. Mesurments of hardness and standards deviation of TIG and ATIG (optimal flux).
SampleNumber of TestsHV Max.HV Min.HV MeanStandard Deviation σ
TIGFZ52292072158.955
HAZ52372282333.701
ATIGFZ52292102196.719
HAZ52442342394.573
Table 9. Mesurments of energy absorbed and standards deviation of TIG and ATIG (optimal flux) at fusion zone.
SampleNumber of TestsAbsorbed Energy (J)
Min
Absorbed Energy (J)
Max
Absorbed Energy (J)Standard Deviation σ
TIG35660591.00
ATIG39295931.32
Table 10. Mesurments of energy absorbed and standards deviation of TIG and ATIG (optimal flux) at HAZ.
SampleNumber of TestsAbsorbed Energy (J)
Min.
Absorbed Energy (J)
Max.
Absorbed Energy (J)Standard Deviation σ
TIG35054521.32
ATIG39295931.32
Table 11. Elements present in fracture face of TIG weld zone.
ElementsCSiCrMnFe
Weight %11.120.6013.8110.3764.11
Table 12. Elements present in fracture face of ATIG weld zone.
ElementsCOSiCrMnFe
Weight %18.512.670.4612.259.2156.90
Table 13. Elements present in fracture face of TIG heat affected zone.
ElementsCCrMnFe
Weight %6.1315.239.4569.19
Table 14. Elements present in fracture face of ATIG heat affected zone.
ElementsCOSiCrMnFeNi
Weight %28.313.610.4510.037.4649.210.93
Table 15. Potentiodynamic polarization data obtained for the different materials after 1 h immersion in 3.5% NaCl solutions.
Alloyβc
mV·dec−1
ECorr
mV
βa
mV·dec−1
jCorr
A·cm2
Corrosion Rate
mm/y
Base metal210−6371159.50.102
TIG170−6401206.70.072
ATIG162−6001508.70.094

