Article

Influence of Friction Stir Processing on Mechanical Behavior of 2507 SDSS

1
Department of Mechanical Engineering, King Fahd University of Petroleum and Minerals, Dhahran 31261, Saudi Arabia
2
Center of Research Excellence in Corrosion, Research Institute, King Fahd University of Petroleum and Minerals, Dhahran 31261, Saudi Arabia
*
Author to whom correspondence should be addressed.
Metals 2020, 10(3), 369; https://doi.org/10.3390/met10030369
Submission received: 18 February 2020 / Revised: 4 March 2020 / Accepted: 10 March 2020 / Published: 12 March 2020

Abstract

:
Duplex stainless steel (DSS) is used for desalination equipment, pressure vessels, marine applications, offshore applications, and in oil/gas plants where a highly corrosive environment is present. Super duplex stainless steel (SDSS) 2507 has excellent mechanical properties, such as high strength, high toughness, high fatigue life, and high corrosion resistance. Friction stir processing (FSP) is used to refine the grain structure of the processed region such that properties like strength, hardness, fracture toughness, fatigue life, and corrosion resistance are enhanced. In this paper, an optimized friction stir process of 2507 SDSS is carried out to refine the microstructure of the material in order to improve its mechanical properties. Microstructure analysis revealed that grains were refined from a size of around 160 µm in the base material to 2–30 µm in the processed zone. This grain size reduction resulted in improved strength, hardness, and fracture toughness of the material by up to 14%, 11%, and 12%, respectively. However, FSP has reduced the fracture strain by about 30%.

1. Introduction

Duplex stainless steel (DSS) is composed of ferritic (α-phase) and austenitic (γ-phase). DSS belongs to the family of stainless steel and has austenite and ferrite in almost equal amounts. Super duplex stainless steels (SDSS) have around 25% chromium, higher nickel, and molybdenum content [1]. As a result, SDSS shows excellent mechanical behavior [1,2].
Friction stir processing (FSP) is a solid-state surface treatment technique in which the tool’s pin is inserted inside the material for processing. FSP is the modification of friction stir welding (FSW) and used to modify the behavior of the material, whereas FSW is used for the joining of metals. The side of the workpiece, where the processing direction and direction of rotational velocity are the same, is the advancing side (AS) and the other side, where the processing direction and direction of rotational speed are opposite, is the retreating side (RS) as shown in Figure 1 [3]. During FSP, severe plastic deformation takes place and a tool mechanically stirs the material to modify its microstructure by refinement of the microstructure through dynamic recrystallization [3]. Refinement of the microstructure affects properties like the strength, hardness, fatigue behavior, and corrosion resistance of the SDSS. Therefore, FSP has influence on the properties of the material [4] and, more specifically, strength and fracture toughness are expected to be enhanced.
A lot of research has been done with different advancing and rotational speeds, to examine the effect of FSP on the behavior of the material. Emami et al. [5,6] examined the effects of FSP on the microstructure and mechanical behavior of 2205 DSS. They performed FSP at an advancing speed of 50 mm/min and a rotational speed of 400 rpm using a tungsten carbide tool. Microstructural analysis showed that fine grains were formed in the stir zone (SZ) due to high frictional heat and dynamic recrystallization. Esmailzadeh et al. [7] performed a similar investigation with a tungsten carbide tool on lean DSS to study the effect of FSP on the microstructure of the material. They used a rotational speed of 800 rpm and three different advancing speeds: 50, 100, and 150 mm/min. They revealed that the grain size reduced with an increase in the advancing speed resulting in higher strength and hardness. A similar study was done by Saeid et al. [8] on 2205 SDSS using a tungsten carbide stir tool at an advancing speed of 50–250 mm/min and a rotational speed of 600 rpm. It was found that by increasing the advancing speed from 50 mm/min to 200 mm/min, grain structure became more refined in the processed zone. However, a groove like defect was produced at 250 mm/min of advancing speed. This was because, at this high processing speed, the peak temperature or input heat was lower. The authors observed that the SZ with small grain size had a higher hardness and tensile strength. Other research on 2205 SDSS [9] revealed that the grain sizes in the SZ were not of the same size and there was more grain refinement on the AS compared to that of RS of the processed zone. Mishra et al. [10] examined the effect of varying advancing speed (10–175 mm/min) on the microstructure of 2507 SDSS. They observed that with an increase of the advancing speed, grain size reduced until 100 mm/min and then increased again. It was also revealed that FSP produced a sharp boundary on the AS of the processed zone. On the other hand, a gradual reduction in grain size was noticed from the base metal (BM) to the SZ on the RS. Similar findings were reported by Sato et al. [11] for friction stir processed (FSPed) 2507 SDSS using a Polycrystalline Cubic Boron Nitride (PCBN) tool with an advancing speed of 60 mm/min and a rotational speed of 450 rpm. Grain refinement resulted in an improvement of strength and hardness of DSS in the SZ. Santos et al. [12] studied the effect of the rotational and processing speed on the microstructure and strength of DSS. They considered rotational speeds of 200–600 rpm and processing speeds of 50–150 mm/min using a PCBN stir tool. It was observed that the AS experienced higher strains than the RS resulting in more grain refinement. It was also revealed that the SZ had better tensile strength and hardness than BM.
Fracture toughness is the property of a material that describes how much energy will be absorbed by the material before fracture. As discussed earlier, FSP changes the microstructure of the material so a change in the fracture toughness of the material will occur. Different researches have been done to find out the influence of FSW and FSP on the fracture toughness of different metallic materials. While fracture toughness dependence on the FSP/FSW is still not clear, there is an agreement in the open literature that fracture toughness is affected by the processing parameters and material of the tool and the specimen. Meinhardt et al. [13] found that the fracture toughness of SZ of UNS S32760 SDSS was reduced by about 19% compared with BM. Fairchild et al. [14] found that friction stir welded pipeline steel (grade X65 to X120) had significantly lower fracture toughness than the BM. The work of Santos et al. [15] on ISO 3183 X80M steel revealed that by using higher spindle speed (around 500 rpm), the fracture toughness of the processed metal was reduced but for lower spindle speeds (around 300 rpm) fracture toughness of the processed metal was comparable to the BM. Tribe and Nelson [16] found that for API X80 the fracture toughness of the SZ was lower than that of the BM. Their findings revealed that the fracture toughness was dependent on the heat input, the rotational speed, and the position with respect to the weld centerline. They explained the latter by microstructure heterogeneity in the SZ. Avila et al. [17] showed that the SZ produced by two FSW passes of API-5L-X80 at 300 rpm and 100 mm/min had higher toughness values than that of single pass weld and BM. Additionally, single pass weld showed lower fracture toughness than the BM. All of the above research works have considered the influence of FSW on the fracture toughness of different steels, including SDSS. To the authors’ knowledge, the only research that dealt with friction stir processing and fracture toughness is that of Sharma and Mishra [18] on A356 aluminum alloy. They performed FSP at a spindle speed of 900 rpm and an advancing speed of 203.2 mm/min and found that fracture toughness values in the processed zone showed a 30% increase from that of the BM.
The influence of FSP on mechanical behavior, especially on the fracture toughness, of SDSS is not available in the open literature. Thus, the aim of this research is to study the influence of FSP on the mechanical behavior including the tensile, hardness, and fracture toughness behavior of 2507 SDSS.

2. Material and Experimental Procedure

2.1. Material

The material used for this research was 2507 SDSS (UNS S32750). The chemical composition of this material is listed in Table 1. This material was provided by ArcelorMittal in the form of a 20 mm thick plate manufactured by hot rolling. The plate used for this study was sliced into plates of 6.5 mm thickness for sample manufacturing and processing.

2.2. Friction Stir Processing

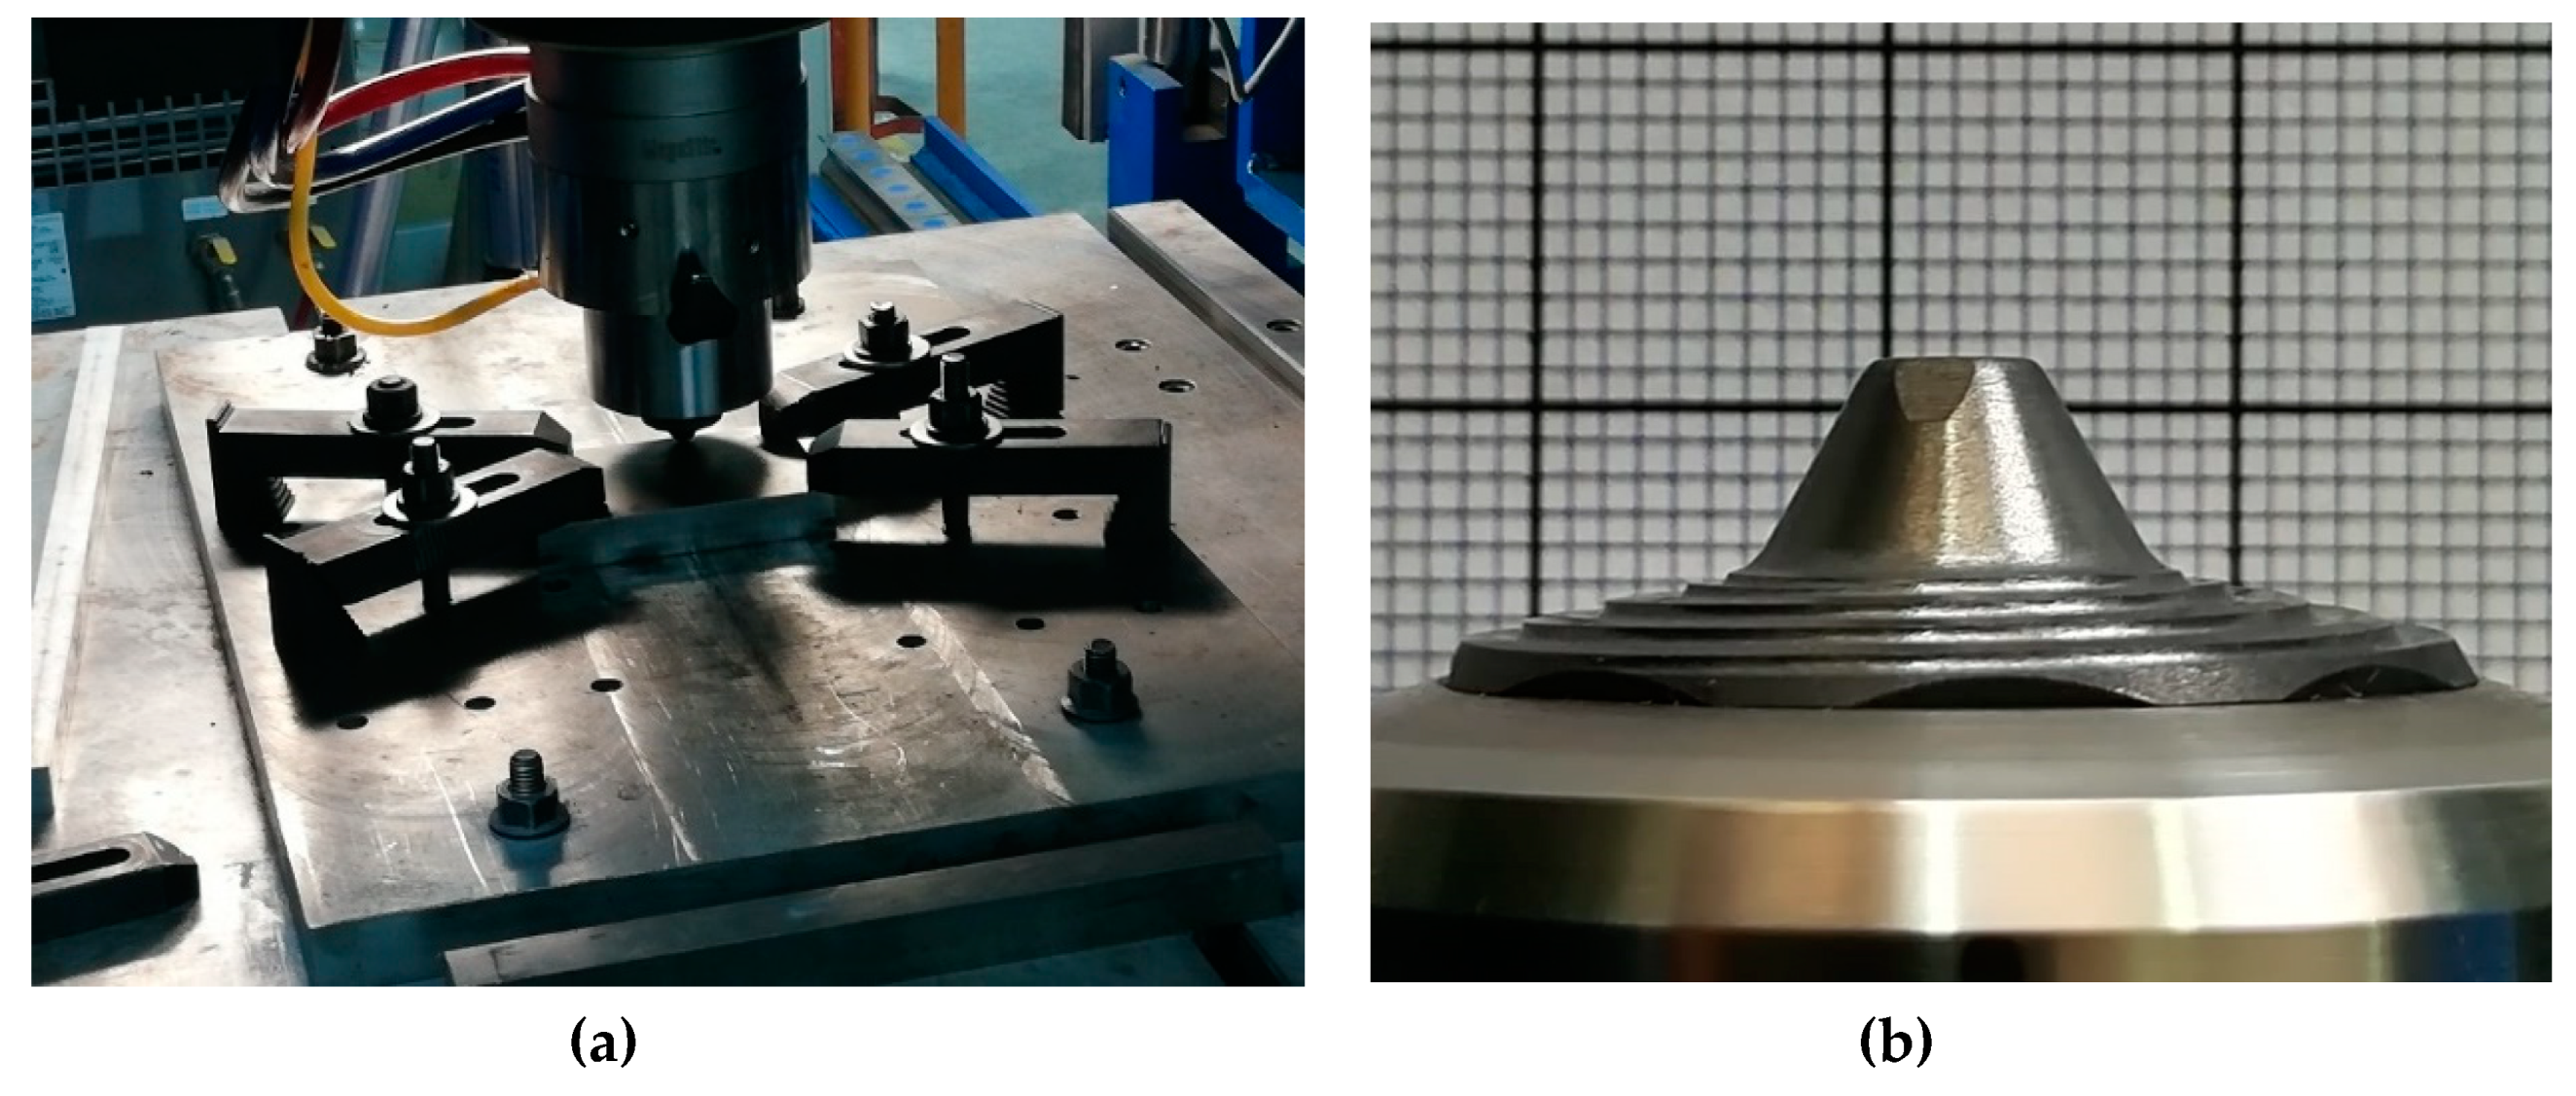
FSP was performed using a research base friction stir welder RM-1 ((Manufacturing Technology. Inc., Indianapolis, IN, USA), which was equipped with the necessary sensors and a data acquisition system for measuring tool reaction loads and other parameters including, but not limited to, rotational and welding speeds, plunging depth, etc. The machine was computer numerical controlled (CNC) and had the capability to perform FSW under position and force control. The machine forging capacity was limited to 65 kN, which is applicable for processing steel and stainless steel. A water-cooled tool holder (Megastir, Provo, UT, USA), shown in Figure 2a, was used to hold and drive the PCBN tool Q70 (Megastir, Provo, UT, USA), shown in Figure 2b, having a 25 mm shoulder diameter and 5.2 mm tapered pin length.
There are various ways to optimize FSP, such as focused on surface quality (the presence of defects and smoothness), grain refinement, etc. In this research work, the optimization was based on the surface quality. FSP was performed on a 2507 SDSS plate of 6.5 mm thickness using three different parameters, as listed in Table 2. These processes were performed under position control. All FSPs were performed with an argon shield (see Figure 2a) and along the rolling direction of the plate. Rotational speed and tilt angle were kept constant at 400 rpm and 2°, respectively. The parameters of FSP No. 2 that resulted in the best surface quality (see Table 2) were selected for further processing.

2.3. Microstructural Analysis

After FSP, plates were sectioned across the processing direction to investigate the changes in the microstructure within the processed zone and the adjacent ones. Standard metallographic sample preparations were applied, such as mounting, grinding, and etching. A FSPed 2507 SDSS plate was cut across the cross section, and then grinding was done by silicon carbide grit papers (240, 320, 400, 600, and 800). After this, the surface of the specimen was polished using an alumina solution. Then, the sample was etched by a solution of 2 g picric acid and 10 mL HCL. An advanced optical microscope (DSX510 Upright Microscope, Olympus, Japan) was used to examine the etched samples and study the developed microstructure. X-Ray Diffraction (XRD) of the base and processed samples was also performed using a Rigaku Miniflex (Rigaku Corporation, Tokyo, Japan) to study the formation of the sigma phase during FSP. XRD was performed using Cu-Kα radiation (30 kV and 15 mA) with a scan rate of 2°/min.

2.4. Tensile Testing

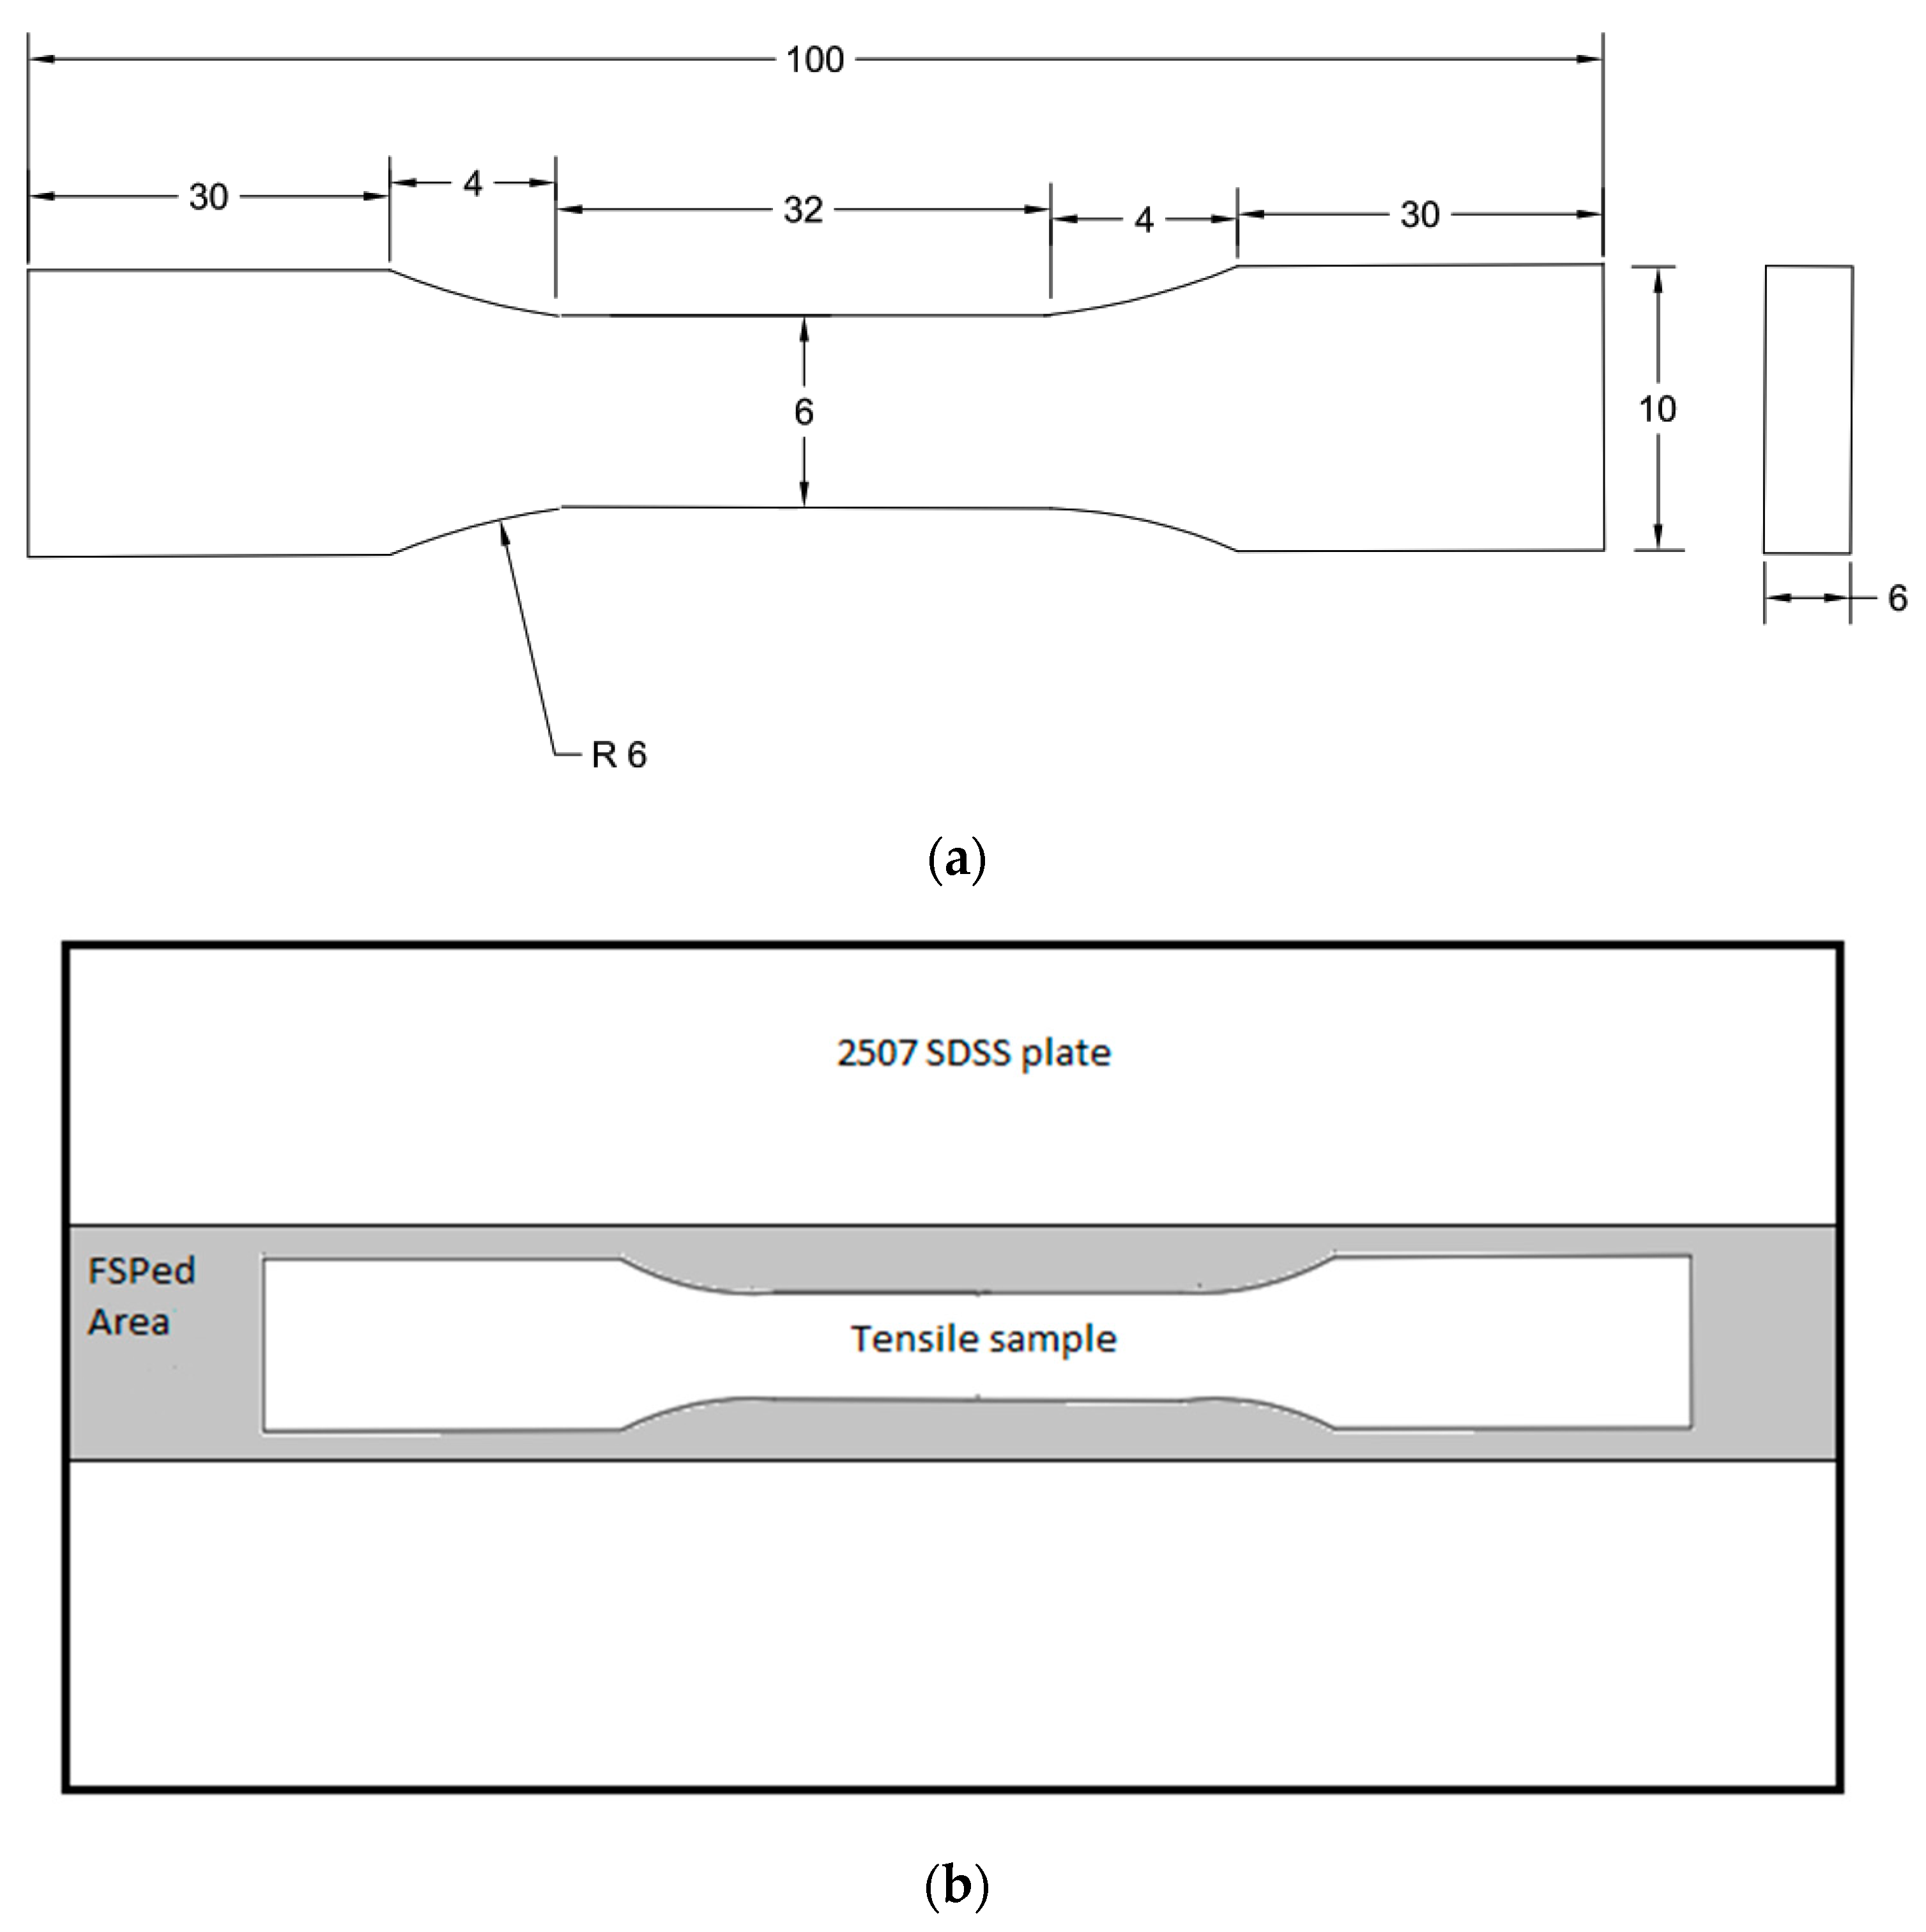
Tensile testing of the base and FSPed samples was carried out on an Instron Machine 8801 (INSTRON, Norwood, MA, USA), that is used for dynamic and static testing, having a load capacity of 100 kN according to ASTM standard E8/E8M-16a [20]. Sub-size tensile sample dimensions, shown in Figure 3a, were cut along the processing direction, where the whole length of the specimen was in the processed region to exclude the effect of Heat Affected Zone (HAZ) on the processed material strength. Figure 3b illustrates the way samples were extracted from the process zone. Three tensile tests were performed on each BM and FSPed samples at a loading rate of 1 mm/min. Strain was measured using an axial extensometer until a strain value of 20% was reached.

2.5. Microhardness Measurements

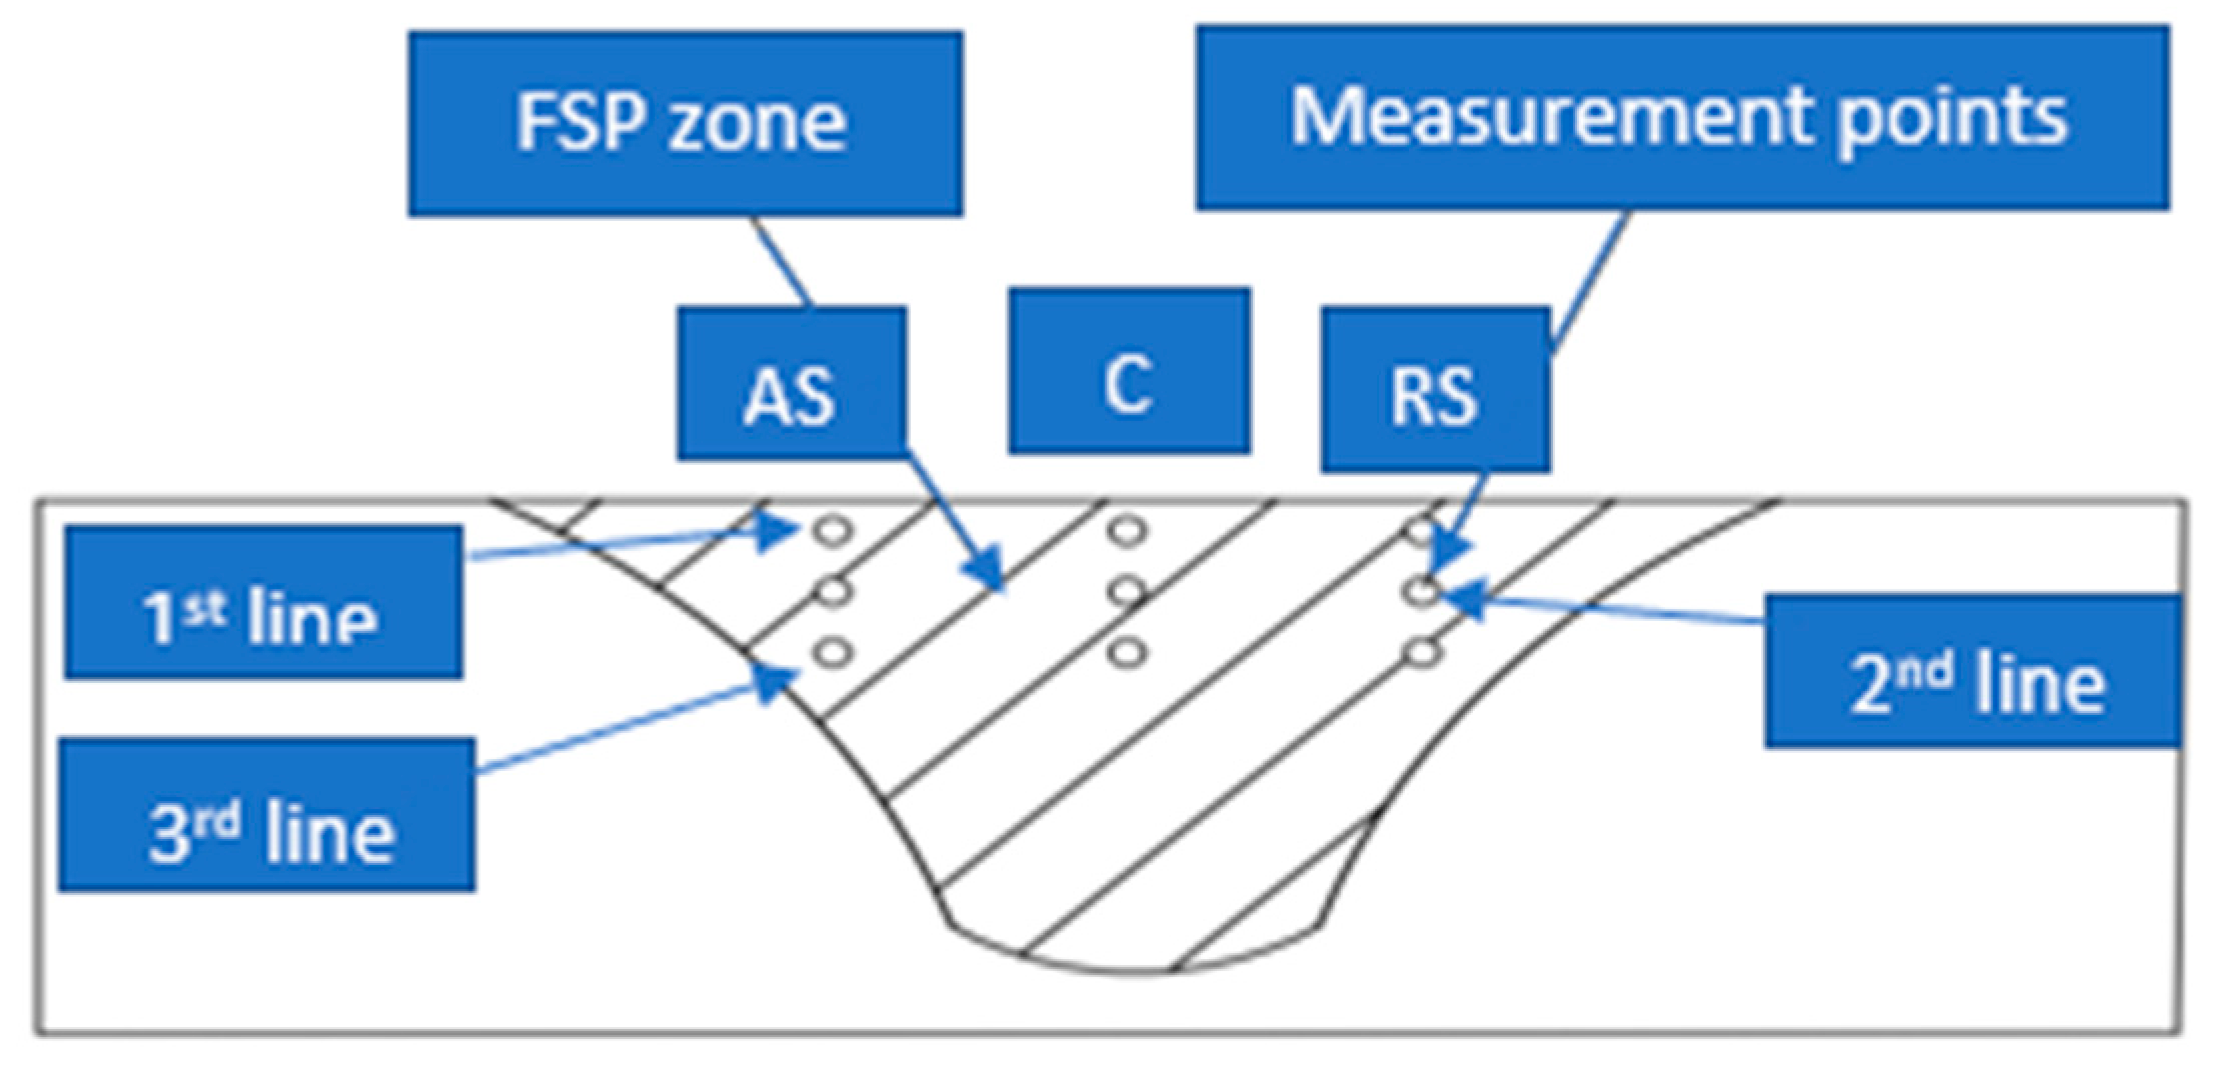
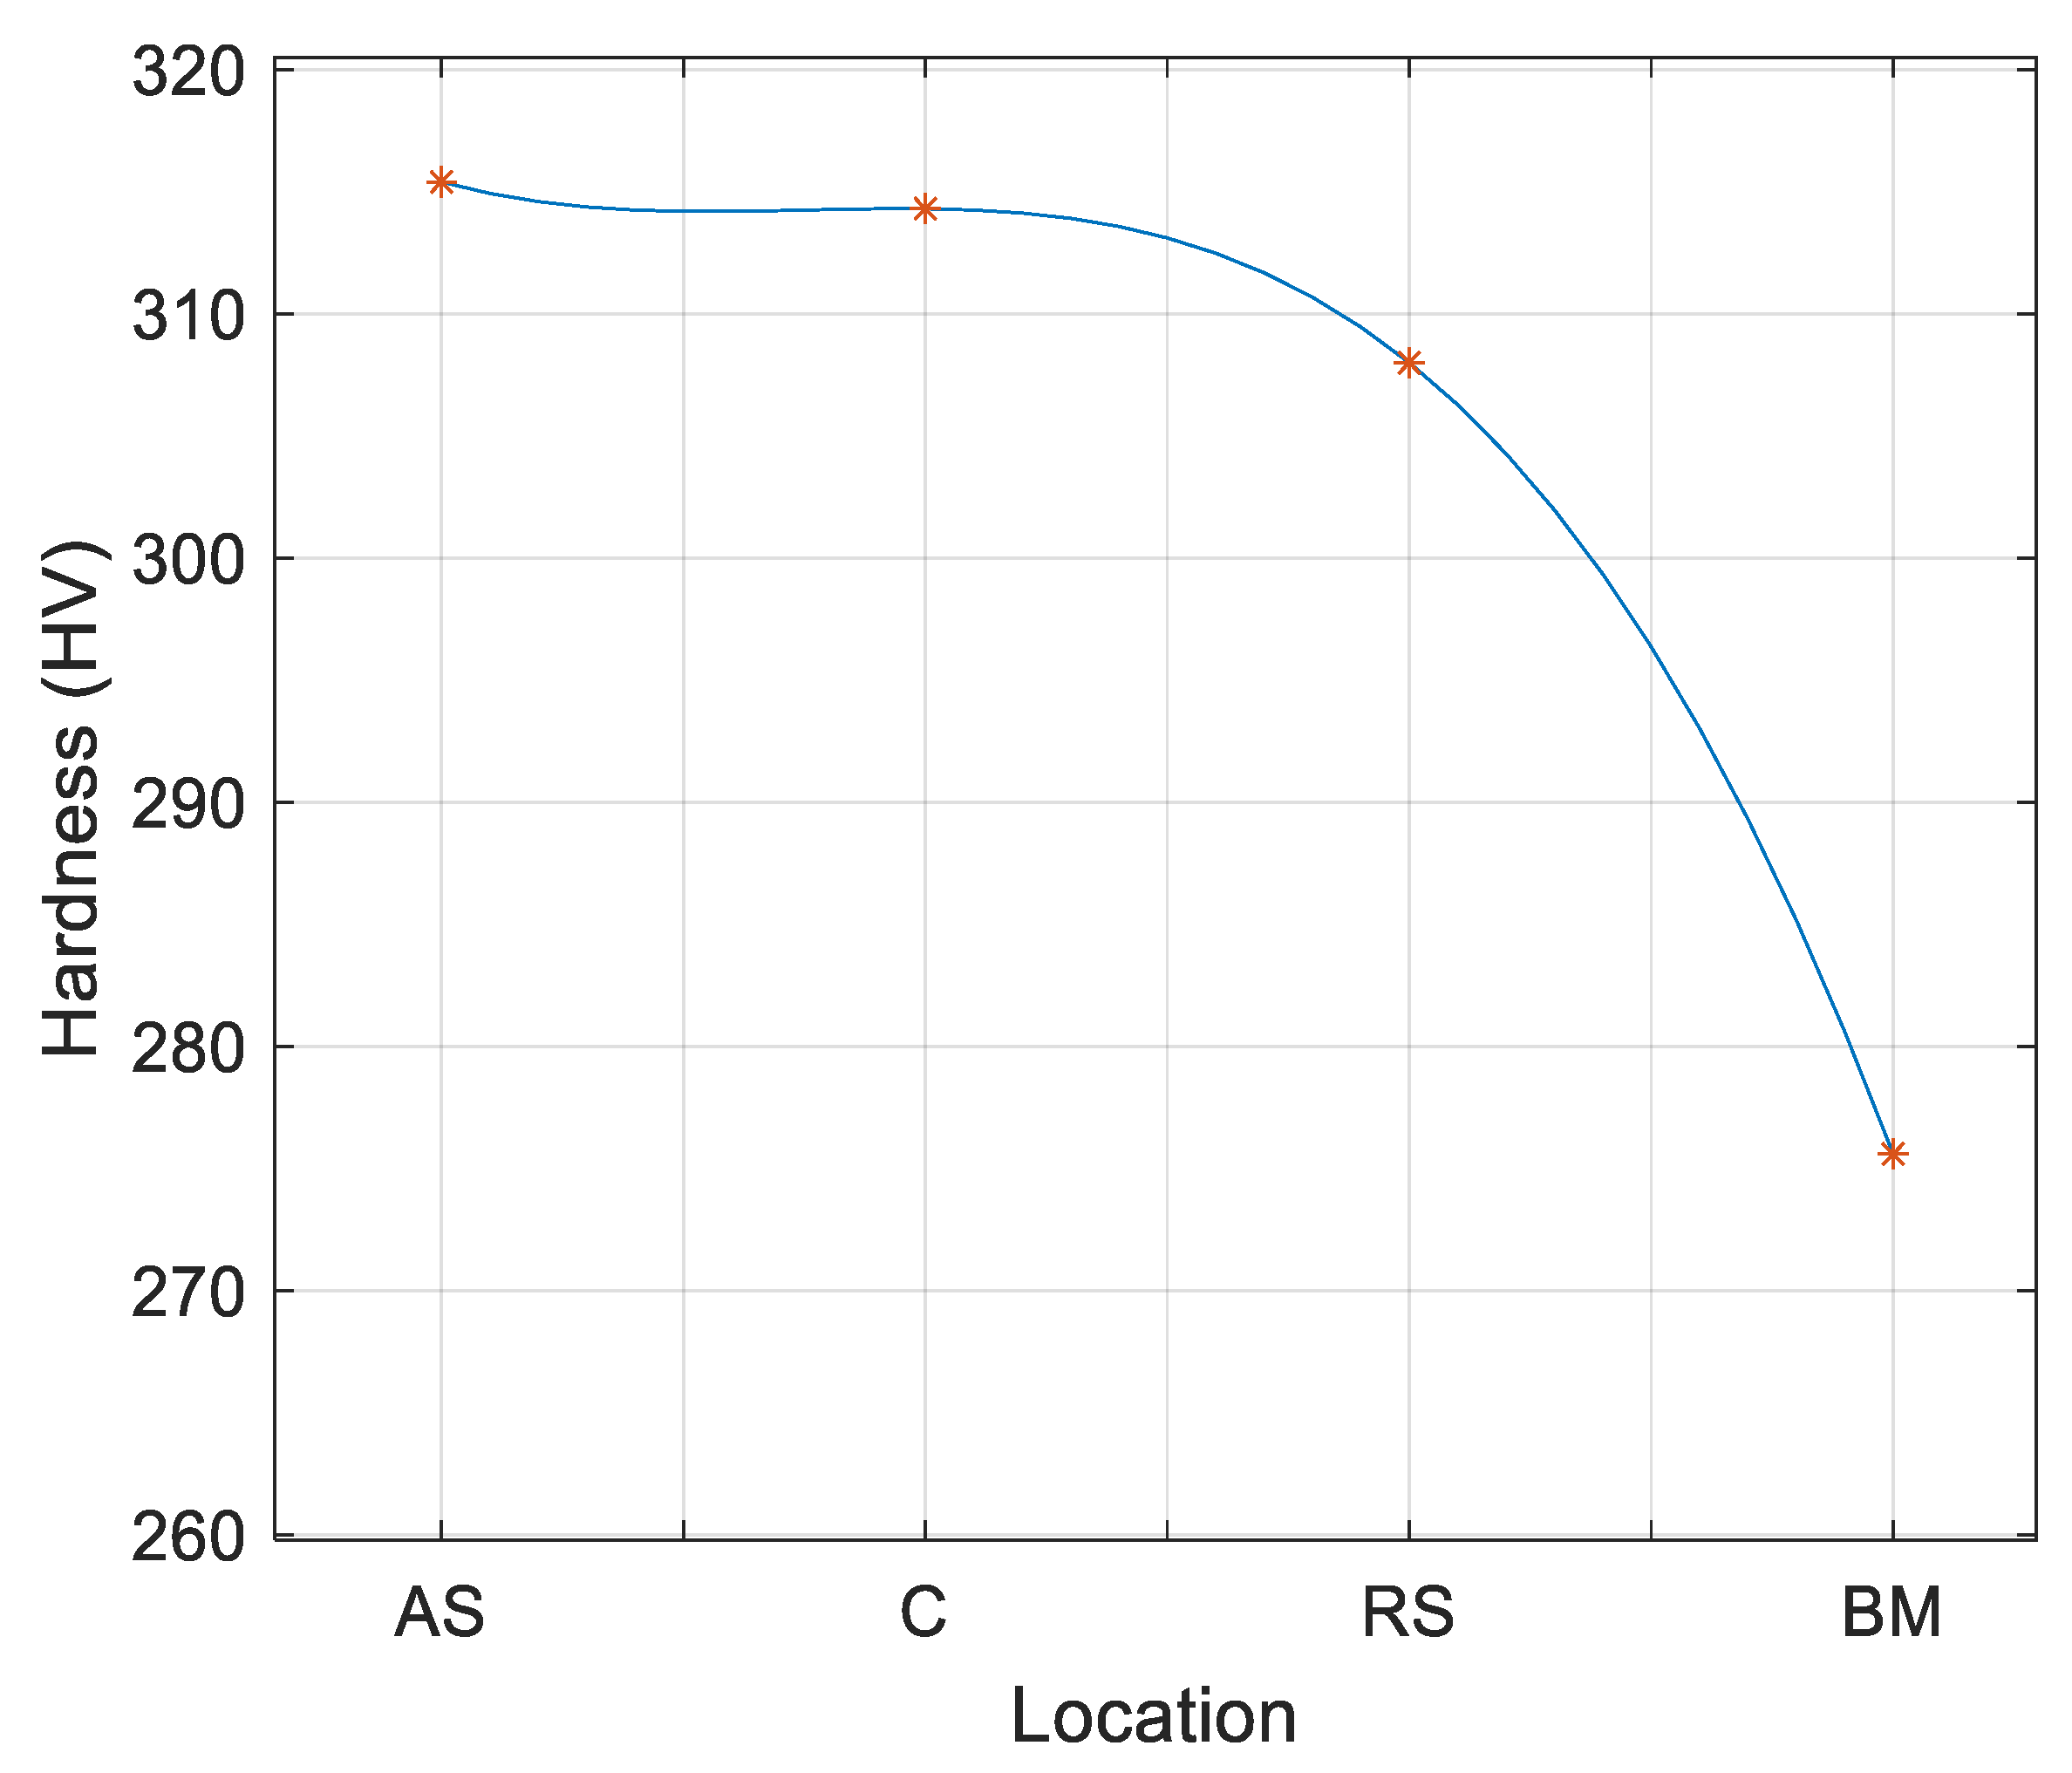
Vickers microhardness measurements were performed across the processed zone and base material at 500 gf. First, the samples were grinded by silicon carbide grit papers and then polished by alumina solution. For the FSPed sample, hardness measurements were taken at nine different locations from the AS to the center of the processed zone (C) to the RS in the SZ, as illustrated in Figure 4.

2.6. Fracture Toughness Testing

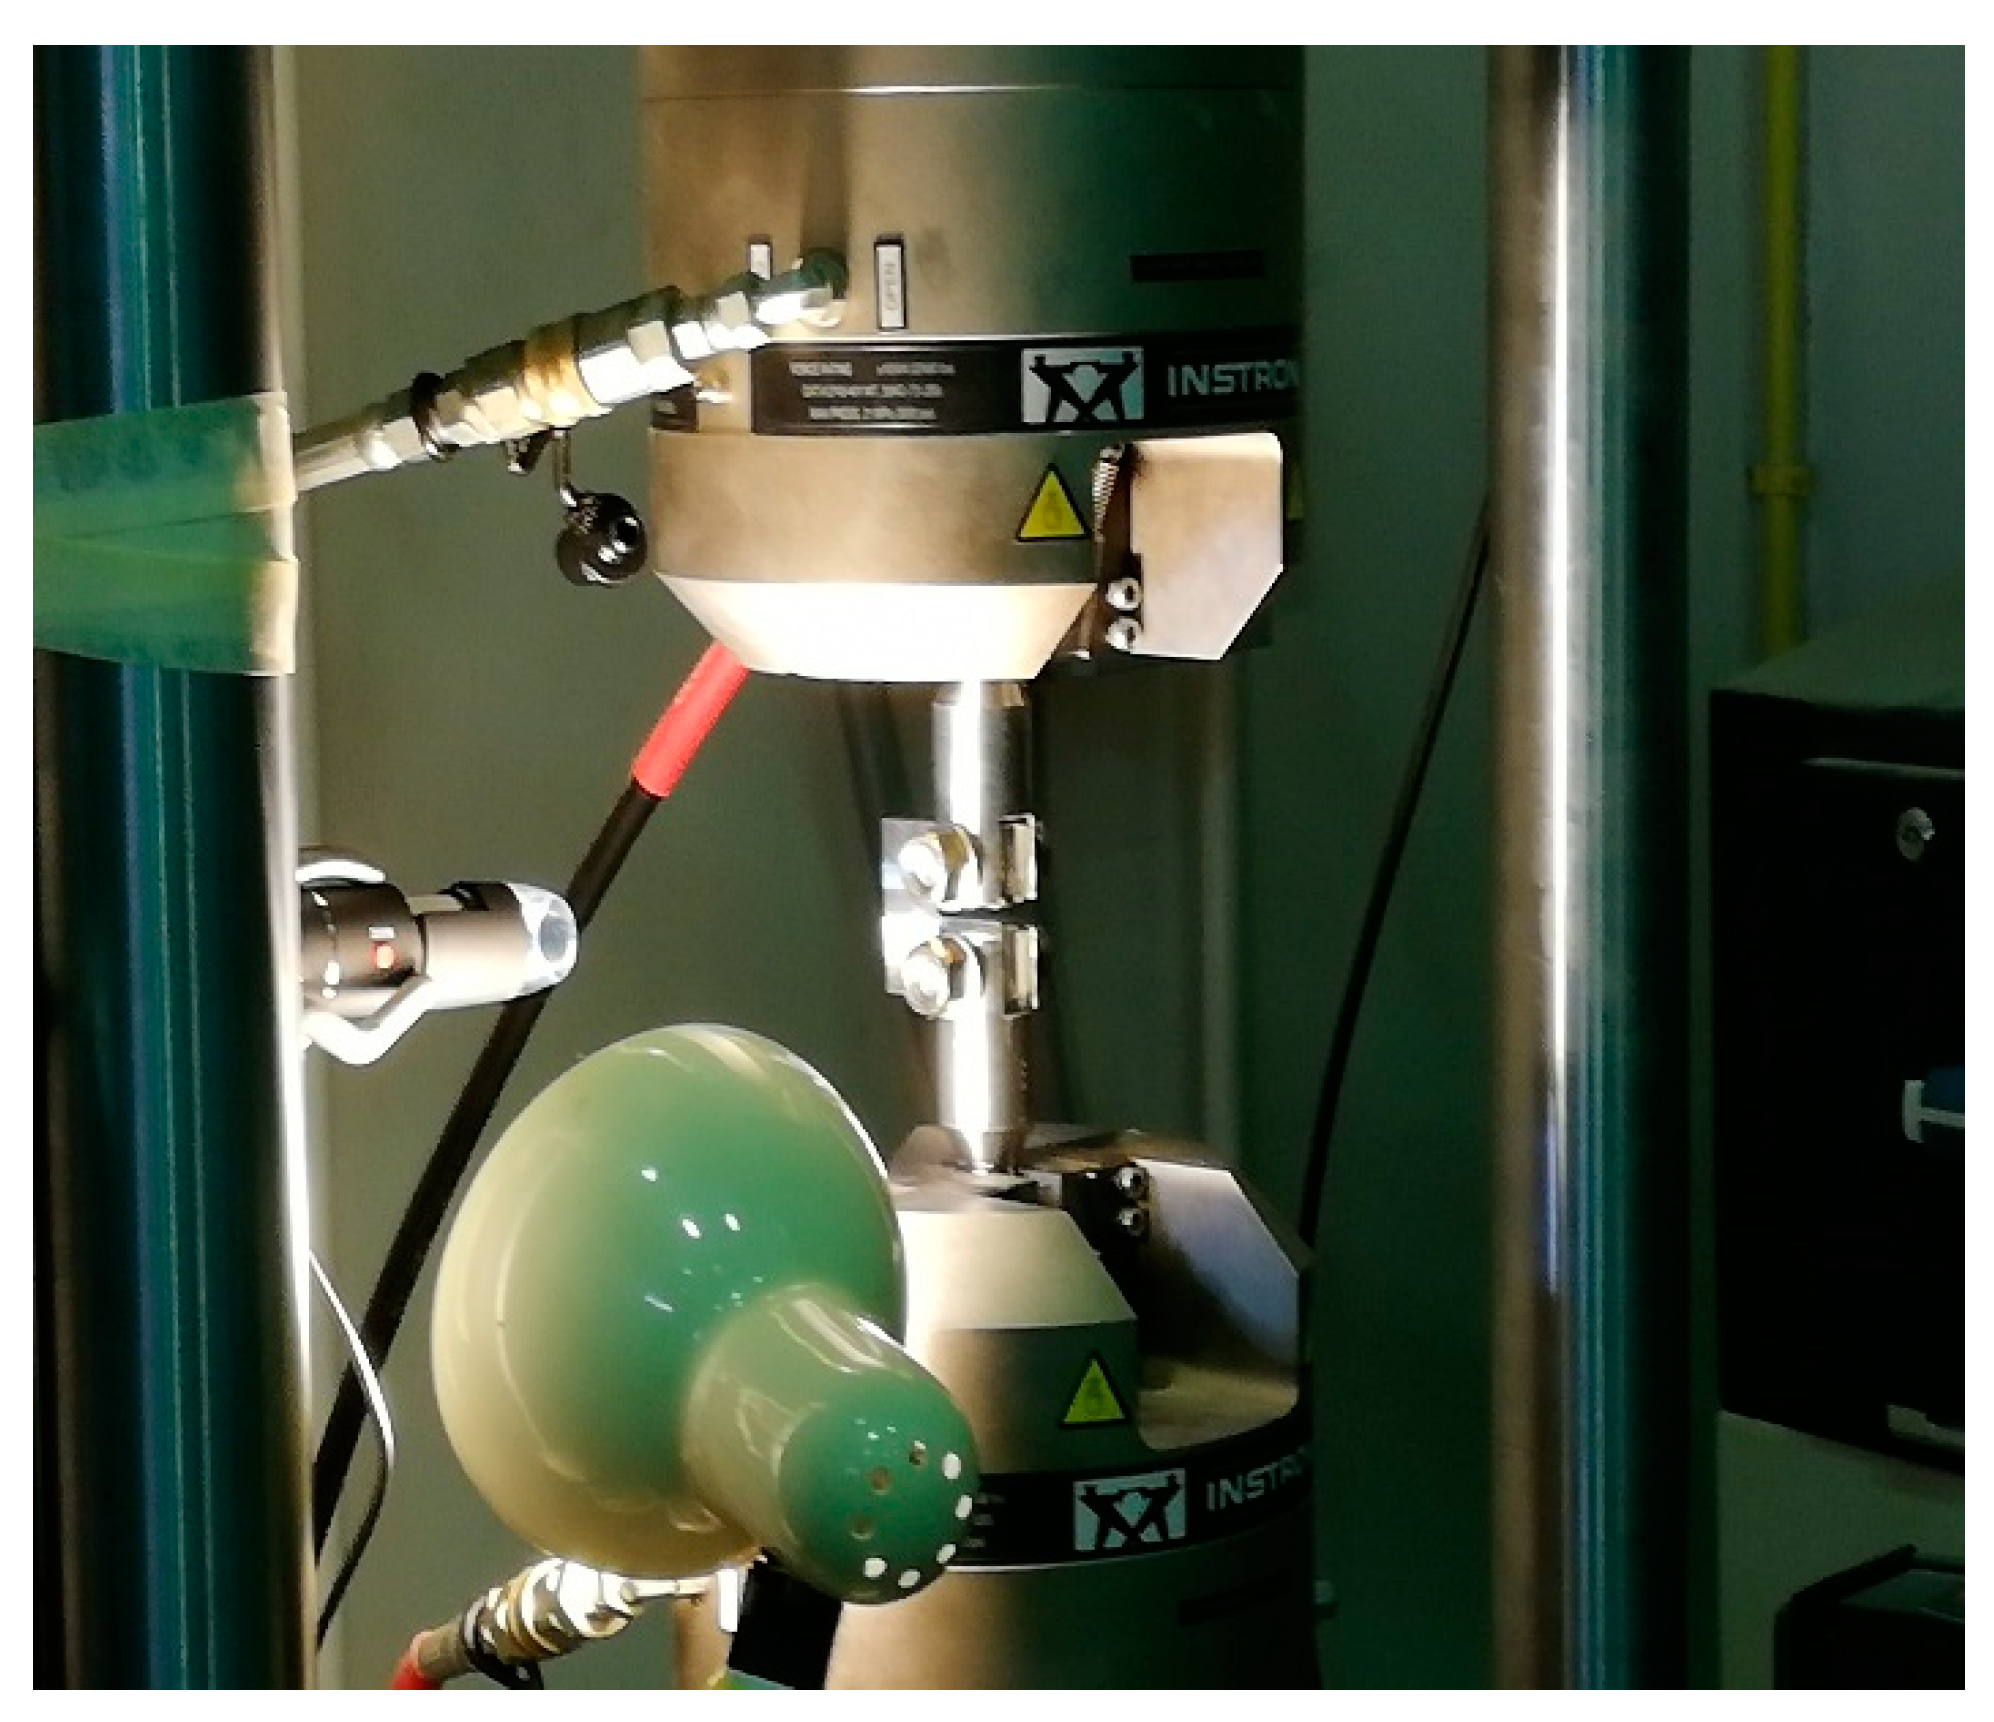
Fracture toughness testing of the base and the FSPed samples was carried out using an Instron 8801, as shown in Figure 5 and according to the ASTM standard E1820-20 [21]. Fracture toughness testing was done on compact tension (C(T)) samples (Figure 6) using the basic J-integral method described in ASTM E1820-20 [21]. The J-integral was chosen over the stress intensity factor ( K I ) because of the large plastic zone that made linear elastic fracture mechanics (LEFM) not applicable.
The dimensions and geometry of the C(T) specimen are illustrated in Figure 6a. C(T) samples from the FSPed plate were cut so that the notch and crack tip were along the processing direction, as shown in Figure 6b. Electrical Discharge Machining (EDM) was used to generate the grove and notch in the C(T) specimens. The C(T) samples were fatigue pre-cracked and a high-resolution camera was used to monitor the fatigue crack growth. The fatigue pre-cracking was done under load control using a maximum load of 6 kN and a stress ratio of 0.1, for all samples. The fatigue pre-crack length was kept at around 2 mm. After fatigue pre-cracking, fracture toughness testing was carried out under position control at a loading rate of 1 mm/min and 60 loading/unloading sequences for all samples.
The load-crack opening displacement (P-COD) curves and Equations (1)–(5) [21] were used to calculate fracture toughness (J-integral) using the basic method described in ASTM E1820-20 [21].
J = J e l + J p l
J e l = K 2 ( 1 ν 2 ) E
K = P k ( B B N W ) 1 2 f ( a 0 W )
J p l = η p l   A p l B N b o
η p l = 2 + 0.522 b o W
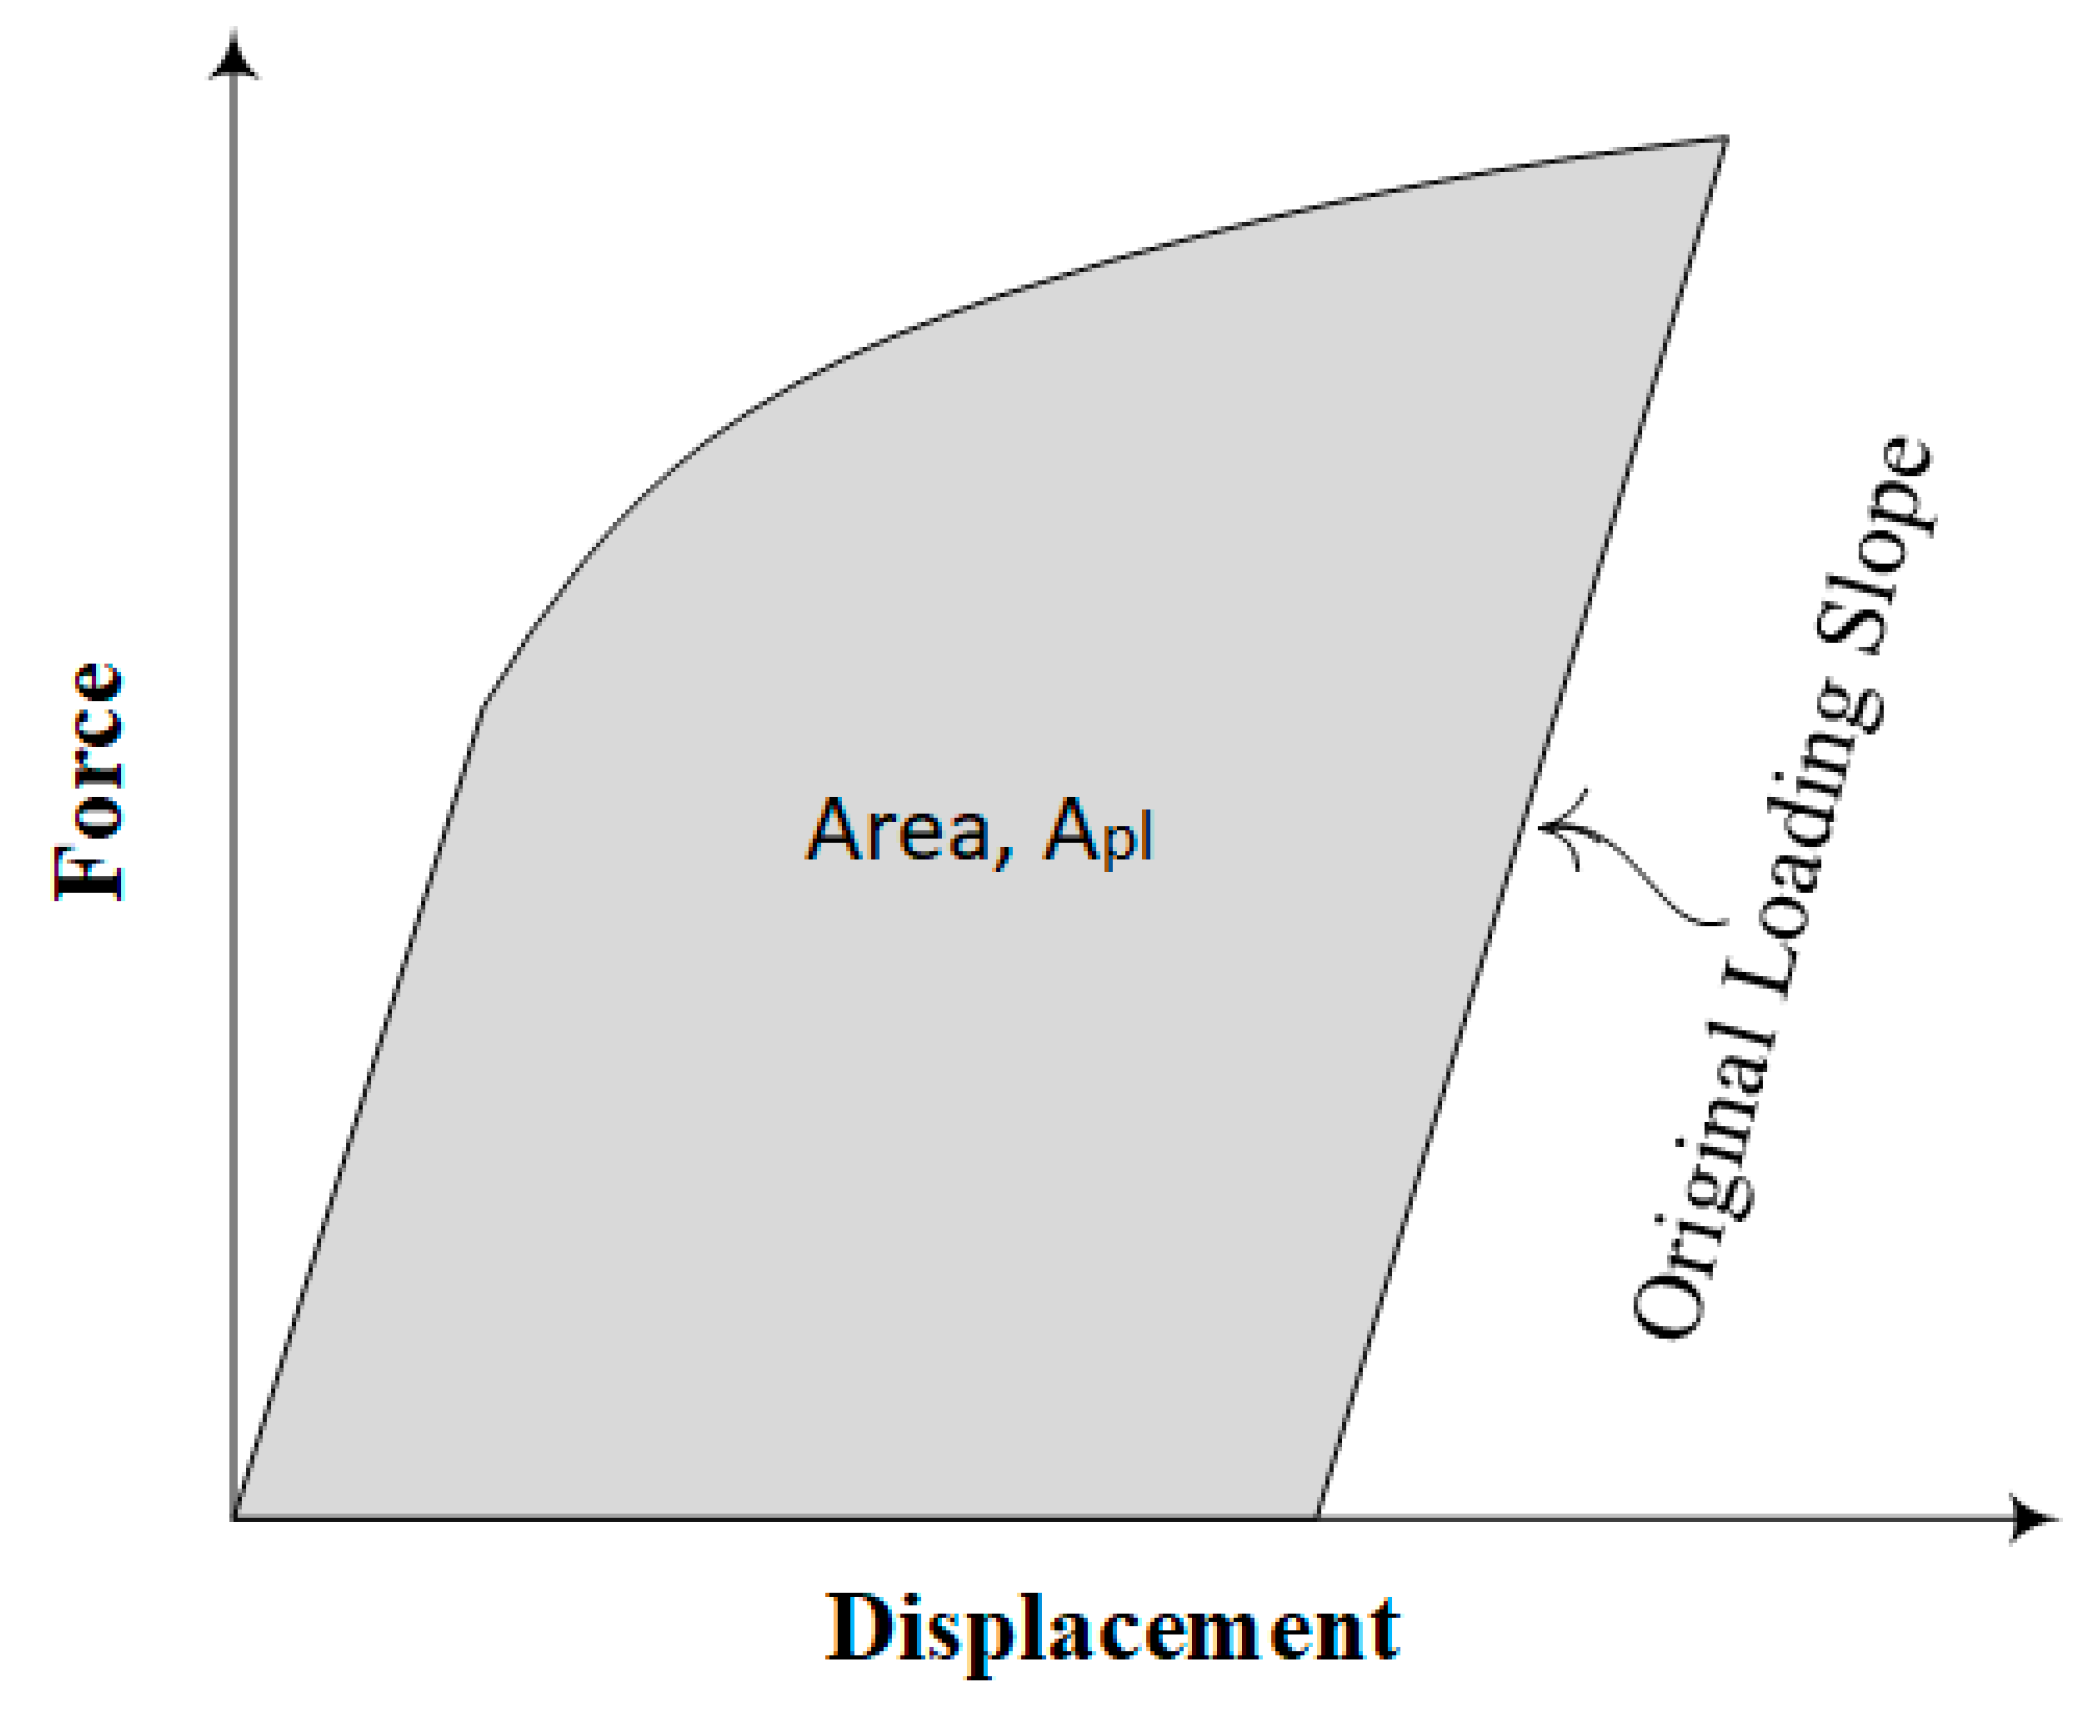
where J p l and J e l are the plastic and elastic components of fracture toughness (   J   ), respectively.   K , ν , E ,   P k ,   B ,   a 0 ,   B N , and b o are the stress intensity factor, poison’s ratio, modulus of elasticity, peak load, thickness, initial crack length, net specimen thickness, and uncracked ligament, respectively. A p l is the area under the load-displacement curve shown in Figure 7.

3. Results and Discussion

3.1. Microstructural Analysis

Figure 8 shows the microstructure of the processed region and Figure 9a,b details the changes in the microstructure at different points (a, b, c, d) from the base material to the processed zone. The images shown in Figure 9 were taken at the same magnification of 277x throughout the processing section along the cross section of the FSPed region. It can be seen in Figure 8 and Figure 9b that there was a sharp boundary created by a sudden decrease in both austenite and ferrite grain sizes from the BM to the SZ on the AS., whereas on the RS the grain size reduced gradually from the BM to the SZ, as shown in Figure 9d. On the AS the direction of the rotational velocity vector and advancing velocity vector are in the same direction but on the RS, they are in opposite directions [22], resulting in higher net force on the AS. Thus, the grains on the AS experienced more plastic deformation/strain compared to the grains on the RS. This caused a sharp boundary on the AS and the gradual increase in grain size from the AS to the RS in the SZ. Additionally, peak temperature were different due to a difference in the plastic strain in the SZ [23]. The observed asymmetry in grain size, with respect to processing weld size, was mainly due to this difference in plastic strains and temperatures from the AS to the RS. This observation is in agreement with the findings of Seidel and Reynolds [24]. Mishra et al. [10], who also concluded that the asymmetry of the SZ can be attributed to the variation in plastic strain and temperature.
The line intercept procedure was used to determine the average grain size in the BM and SZ, which was found to be 160 µm in the BM while it varied between 2 and 30 µm in the SZ. As discussed earlier, the refinement of the grains in the SZ was caused mainly by nucleation of dynamically recrystallized grains due to the heat produced by friction [5,6]. Grain size variation in the SZ can also be observed in Figure 8 and Figure 9. These findings are similar to those reported by Mishra et al [10] and Santos et al [12] for FSW of the same type of material.
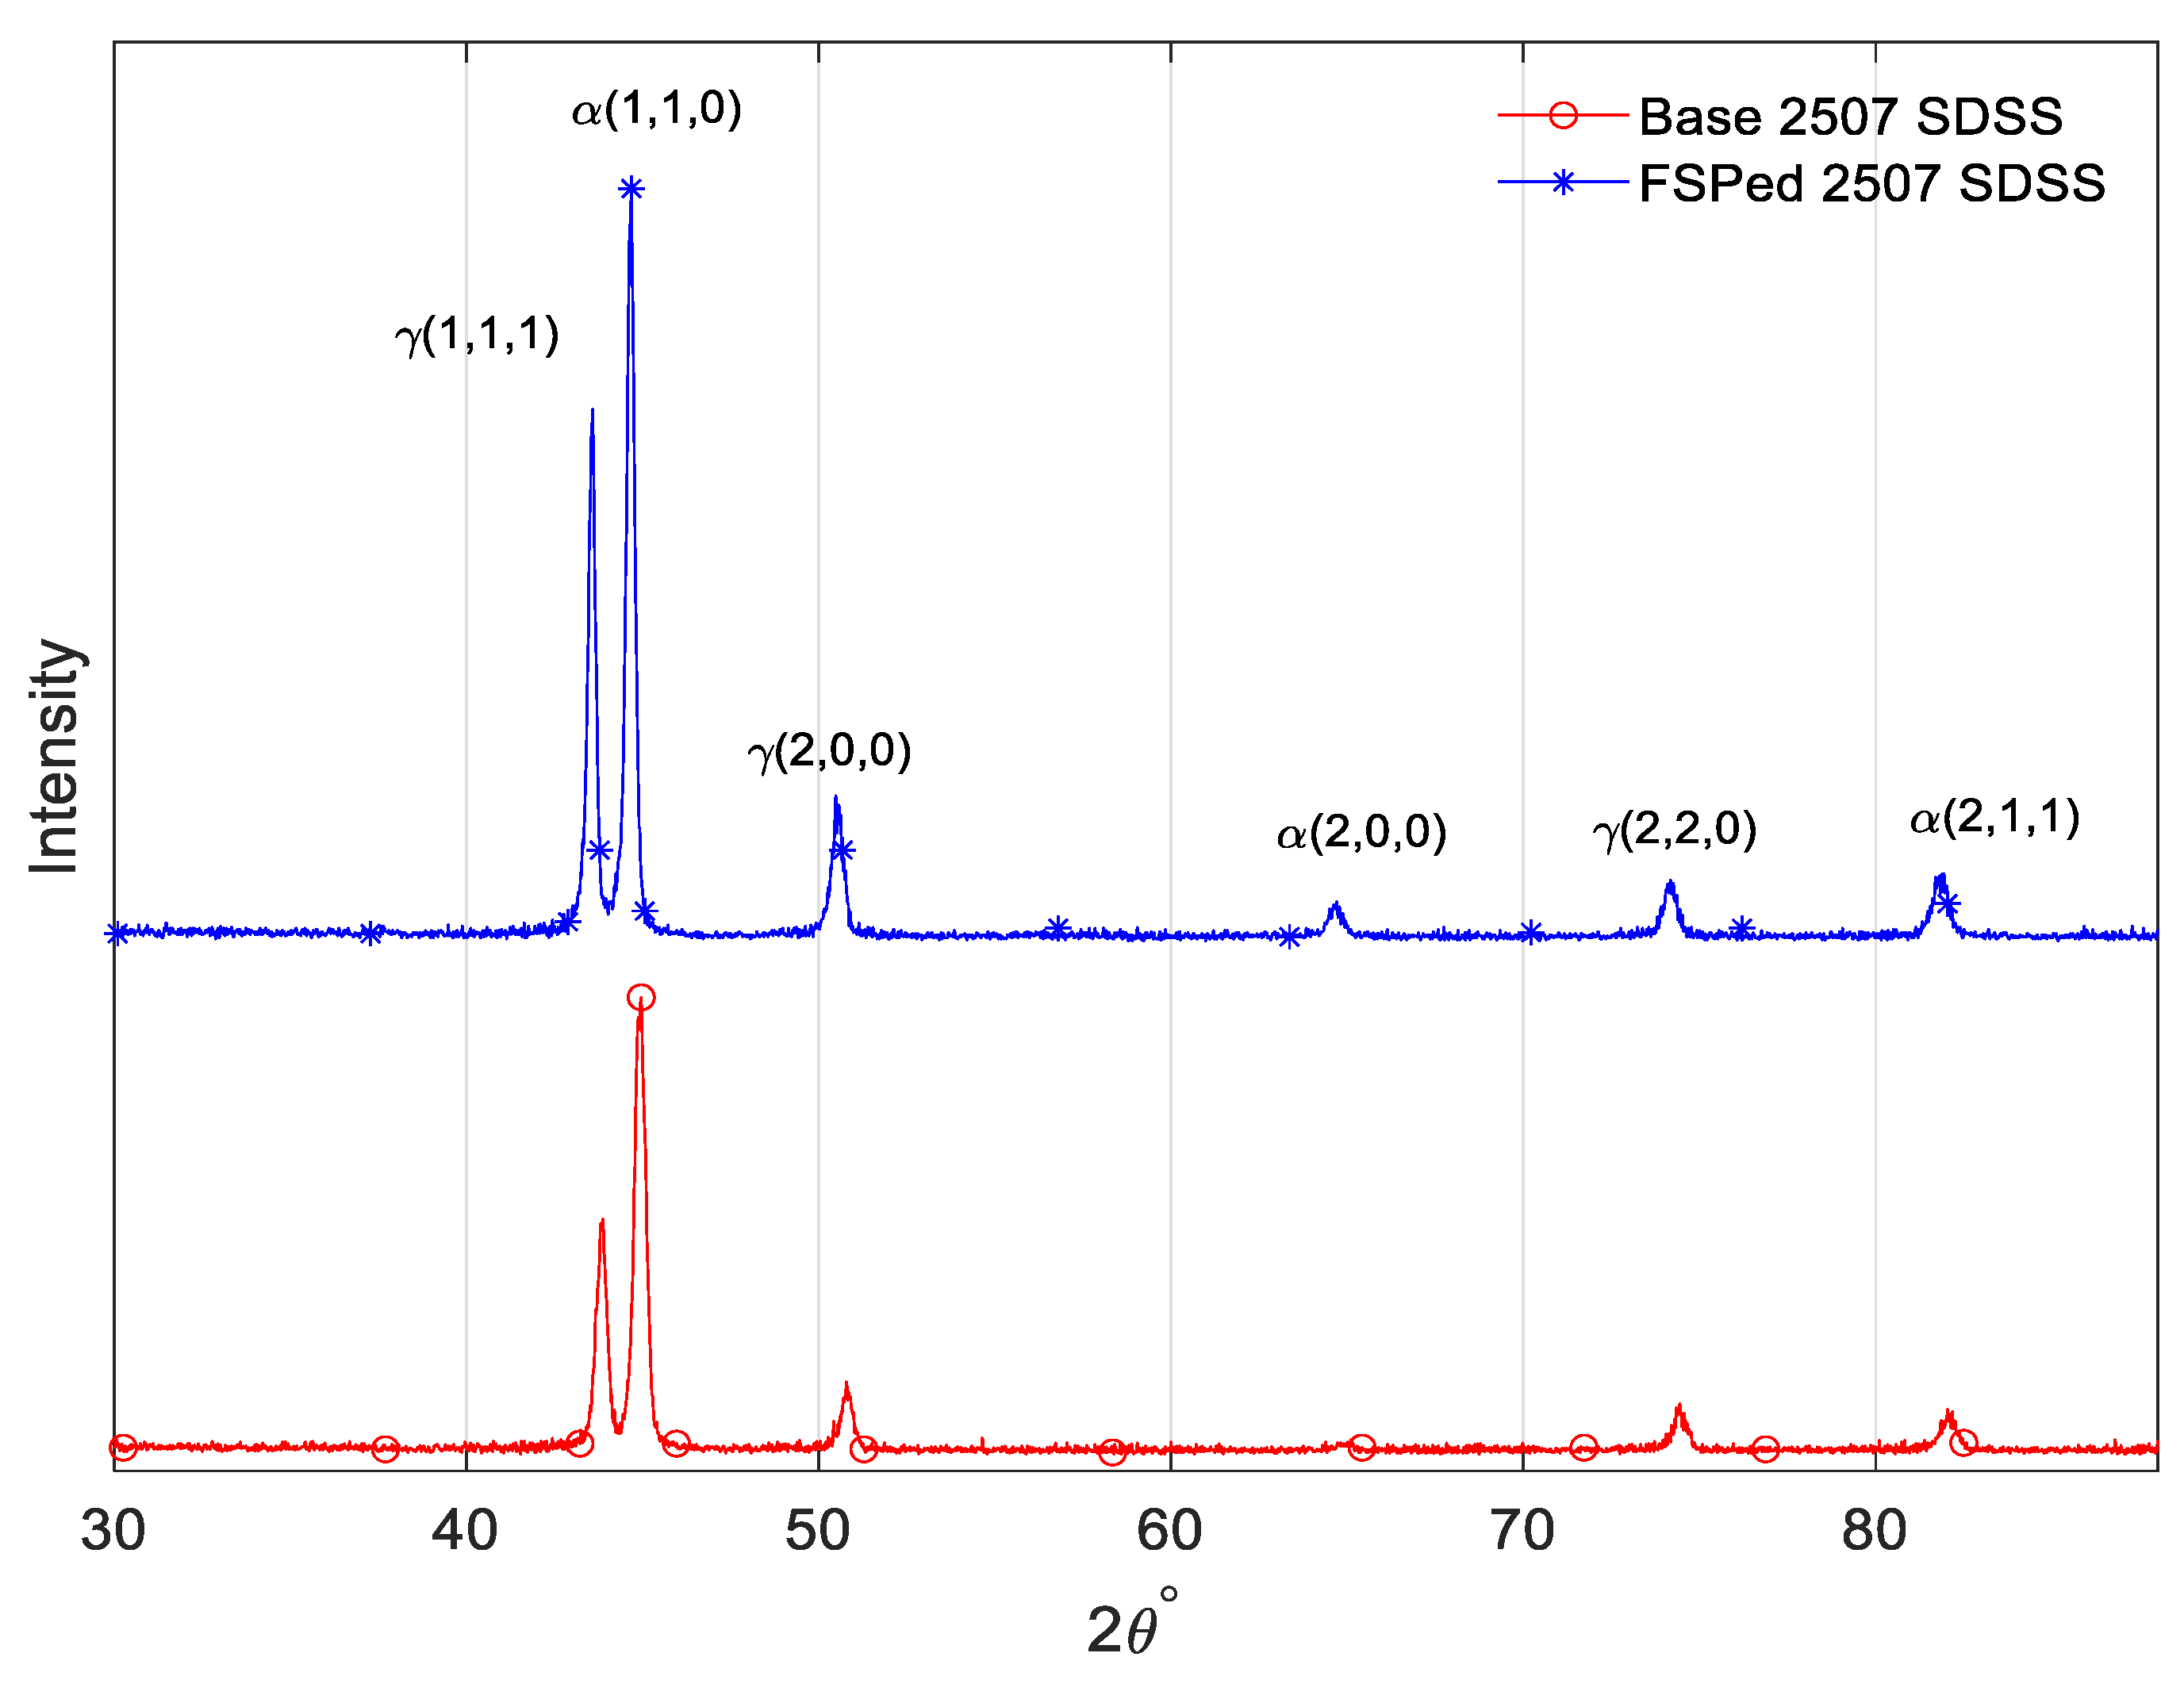
During FSP, the peak temperature was measured by an infrared camera to be between 800 and 1000 °C. The sigma phase usually forms between temperature range of 700–900 °C in DSS [25]. The sigma phase is a brittle and hard phase that affects the mechanical behavior of the material [26]. XRD was performed to observe the possible formation of the sigma phase (Figure 10). The XRD pattern of FSPed sample did not show any new peaks, thus the sigma phase was not produced during FSP. Similar findings were obtained by Li et al. [27] for FSPed hyper DSS, who explained that the sigma phase was not formed because it needs more time to form at a temperature range of 700–900 °C. Sato et al. [28] revealed that around 52 min were required at a temperature of 827 °C for sigma phase formation in FSW of DSS, while Elmer et al. [29] found that 3.0 min were required at a temperature of 850 °C for formation of around 1% sigma phase during FSW of 2205 SDSS. Cui et al. [30] showed that the cooling rate was around 75 °C/s for the carbon steels that were processed at a 100 mm/min of welding speed. It may be concluded that the absence of the sigma phase in the present process was due to the high cooling rate.

3.2. Effects of FSP on Tensile Properties and Microhardness

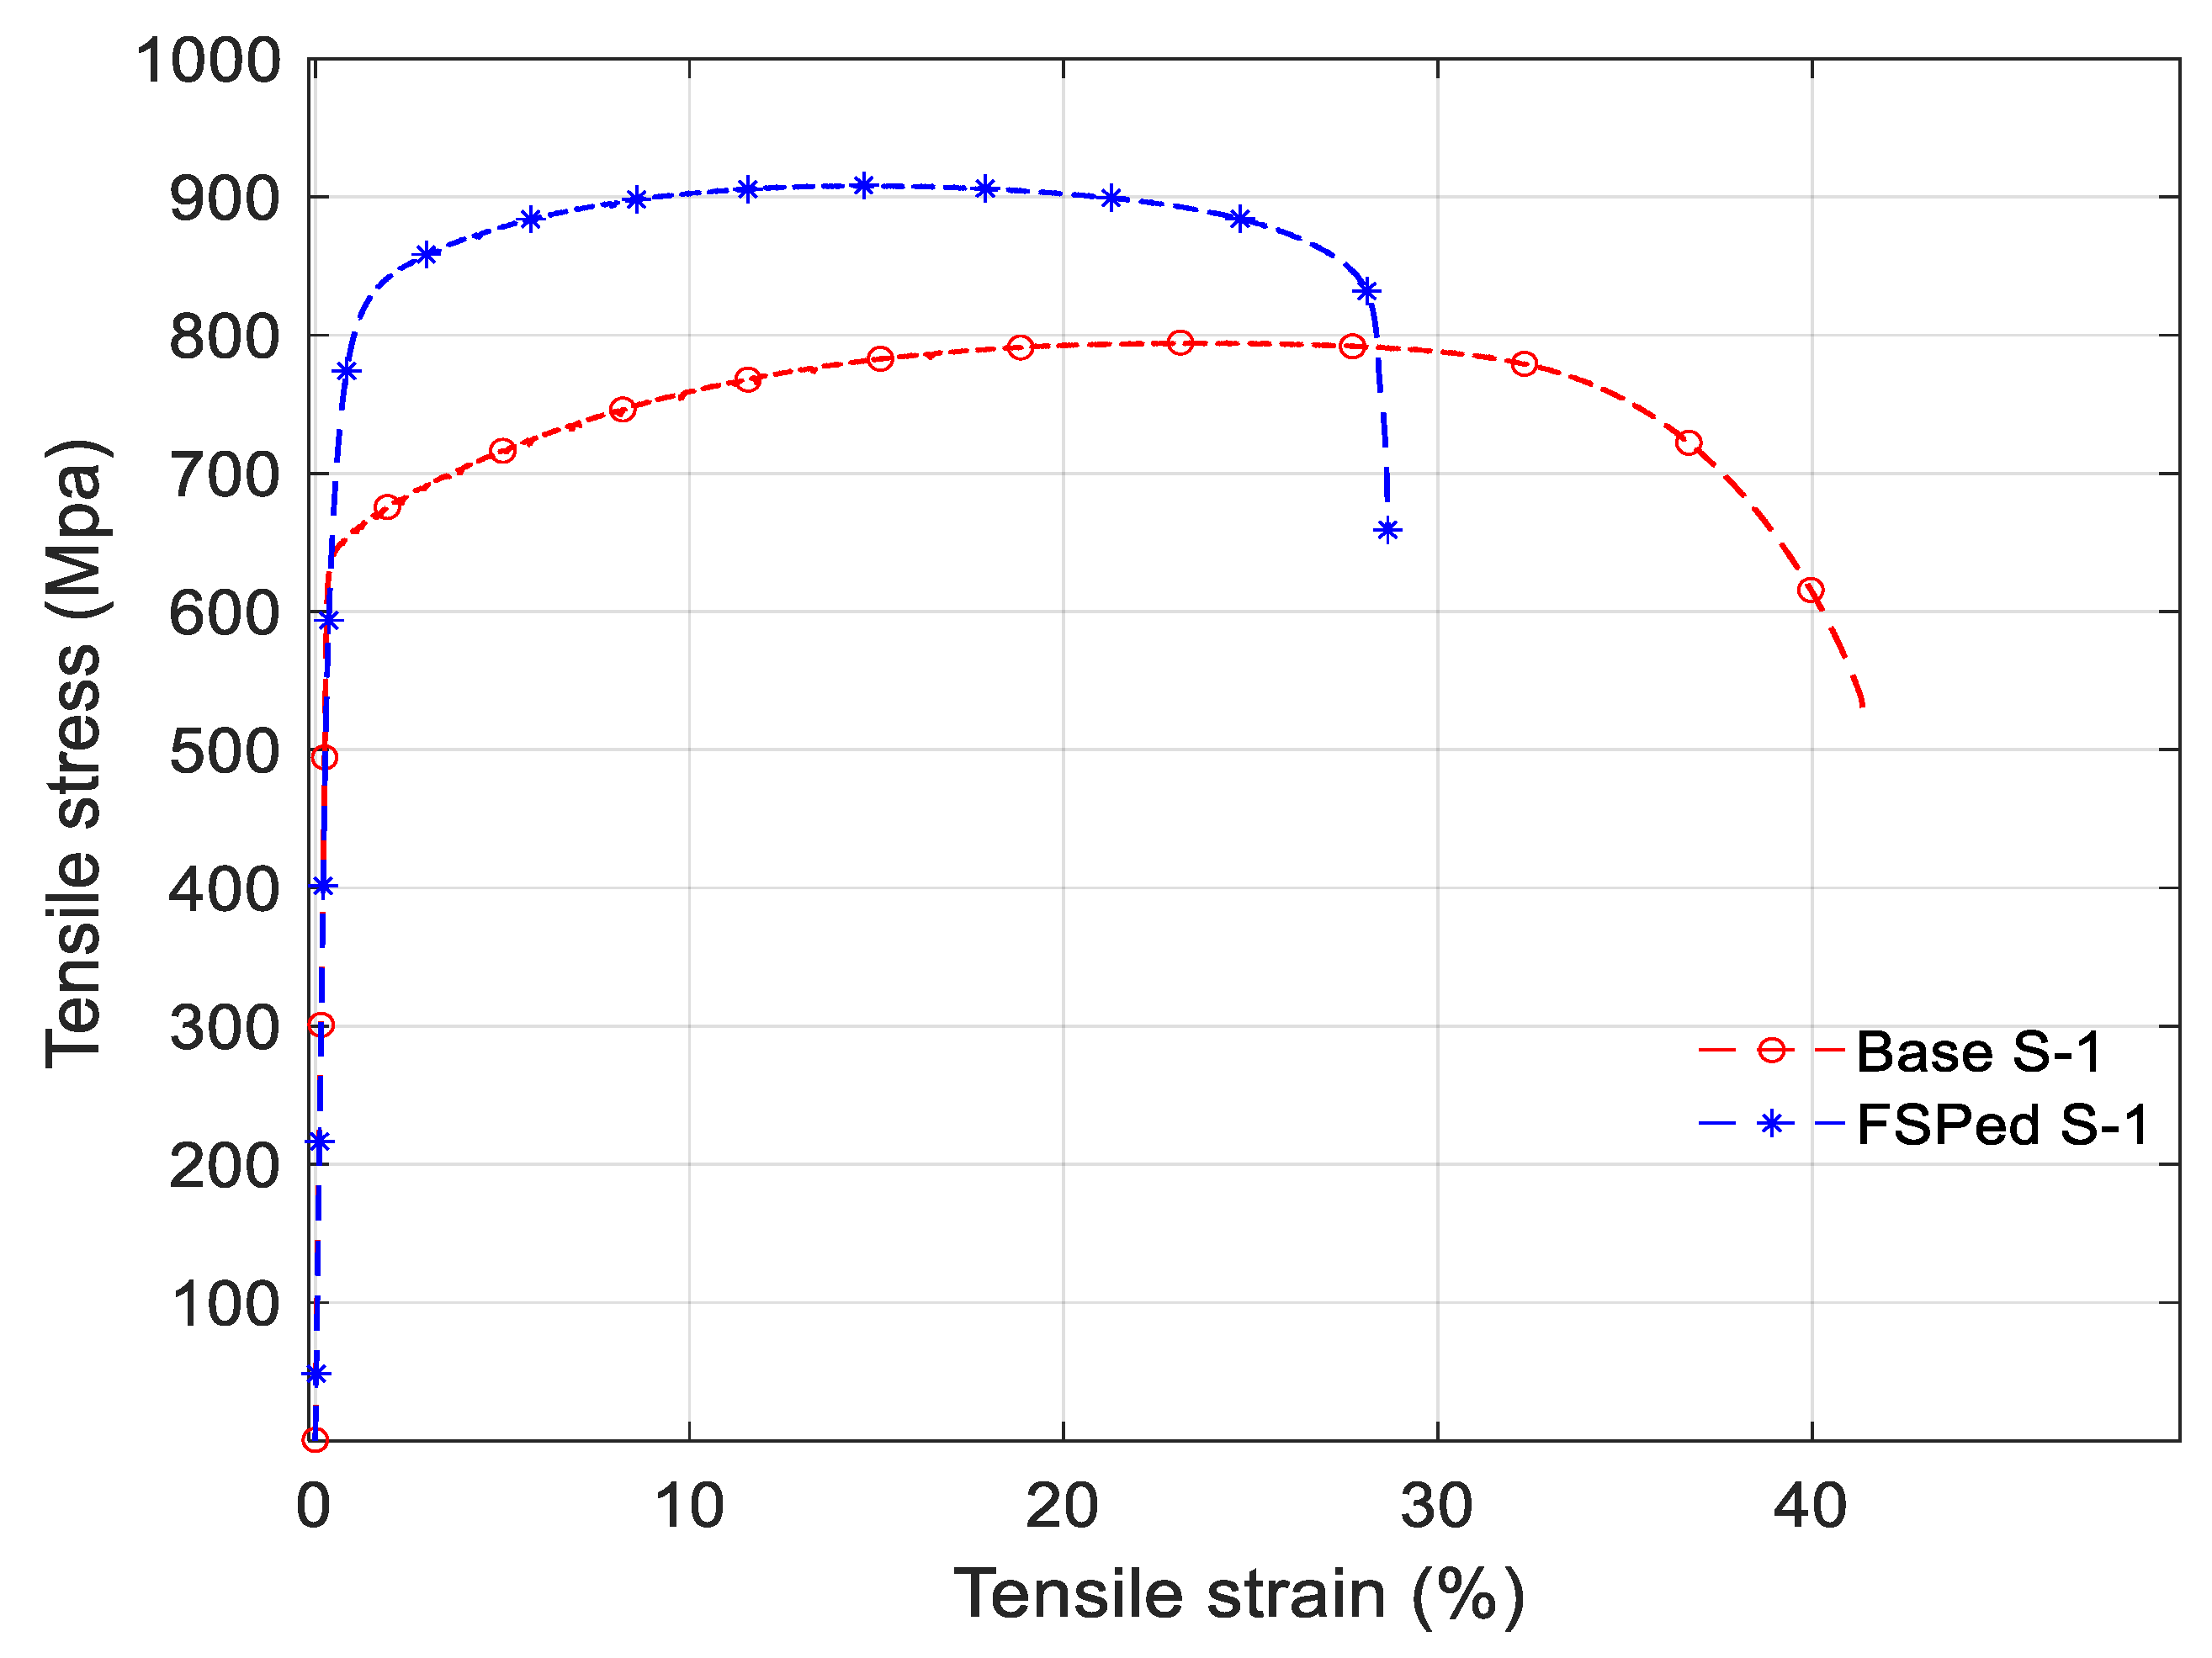
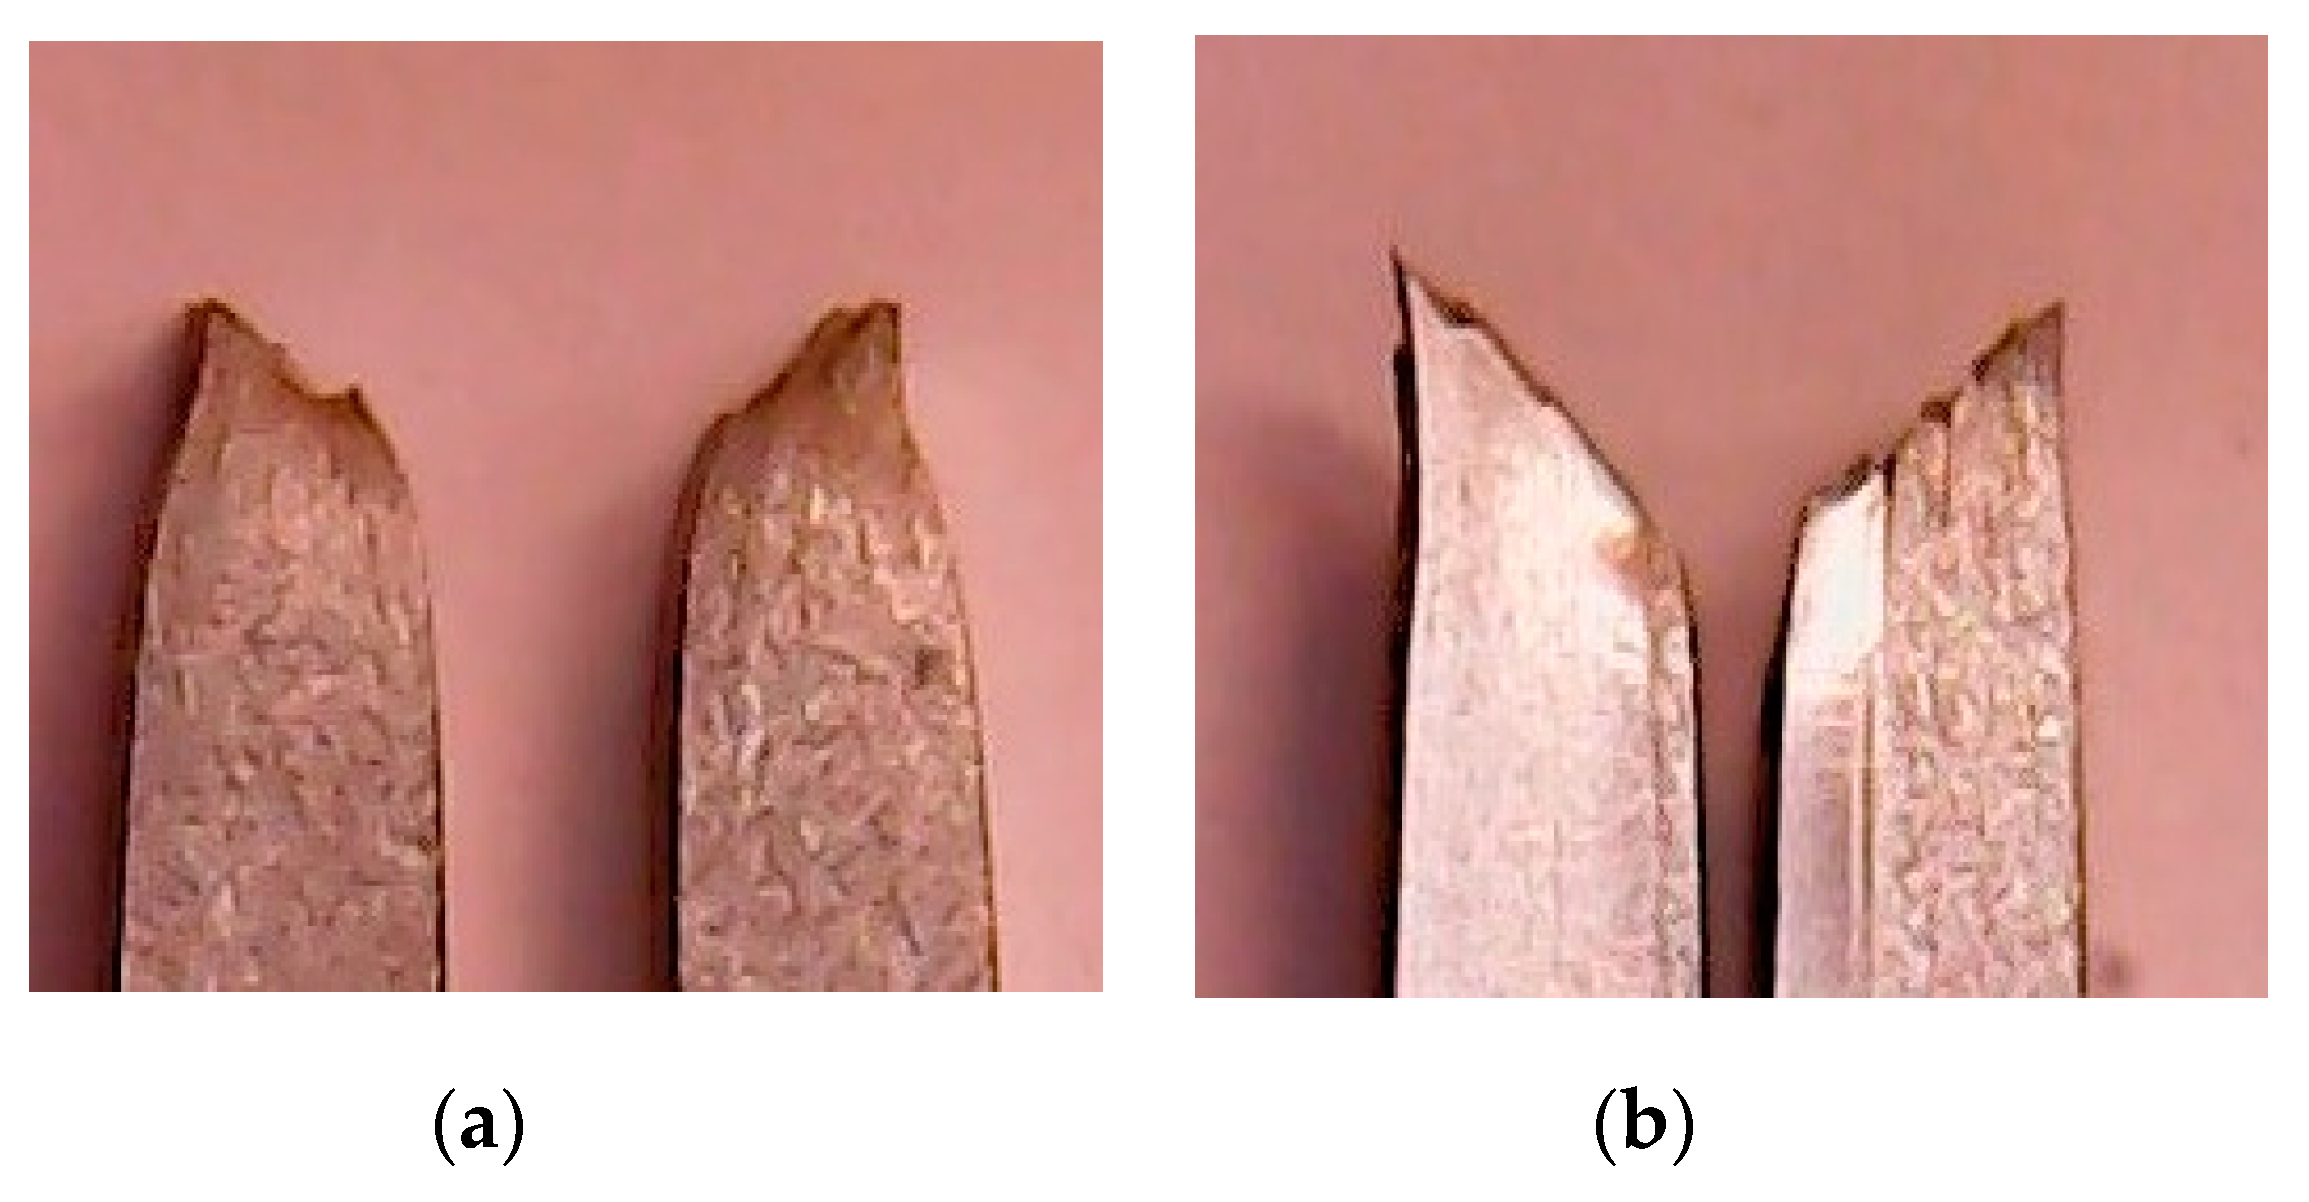
Figure 11 shows the typical engineering stress-strain curves of tensile samples for BM and FSPed 2507 SDSS. It is clear that the FSPed material displays higher strength and lower ductility than the BM. Table 3 illustrates the values of tensile and yield strengths for the six tensile specimens with the averages for base and processed samples. It is found that the yield and tensile strengths of the processed material have improved by 14.3 and 12.2%, respectively. It is worth mentioning that while the material strength increased due to FSP its ductility decreased by an average of 30%. This is expected because the improvement in strength is mainly due to the grain refinement by FSP, the existence of more grain boundaries in the SZ has diminished the dislocation motion and therefore the ductility of the FSPed material [31]. It can be seen in Figure 12 that the larger necking has occurred in the base material than FSPed material and the FSPed sample showed brittle fracture. This was due to the decrease in the ductility of material after FSP. FSP has increased the grain boundaries and these hinder the movement of dislocations resulting in dislocation pile-up [32]. Dislocation pile-up causes brittle fracture of the material [33]. Similar finding was obtained by Mishra et al. [10].
The microhardness measurement results are reported in Table 4 and the variation of the average values of the microhardness is illustrated in Figure 13. It can be observed in Figure 13 that the hardness increased in the SZ from RS to AS because grain size reduced from RS to AS. The increase in the hardness in the SZ was not uniform and this behavior was because of the non-uniformity of grain size in the SZ. The average hardness improvement in RS is about 12% while that in AS is more than 14%.
It is known that the material having larger size grains has low number of grain boundaries and is weaker compared with material of lower size grains and significant number of grain boundaries. Because dislocation motion has to go through a lesser number of grain boundaries in larger size grain material [34,35]. There are various models like Hall-Petch relation available in the literature, which describe that grain size has inverse relation with the hardness and strength of the material and this increase in strength and hardness is compensated with decrease in ductility of the material [31,36]. The findings of the present research concerning the tensile and hardness behavior of the 2507 SDSS after FSP, are similar to those found by a number of researchers [7], [8], [11] and [12].

3.3. Influence of FSP on Fracture Toughness

The fracture toughness is the amount of energy absorbed by the material before failure in the presence of a crack. The fracture toughness shows anisotropic behavior because of the change in microstructure in different directions [37]. As FSP changes the microstructure of the material, there will be a change in the fracture toughness of the material.
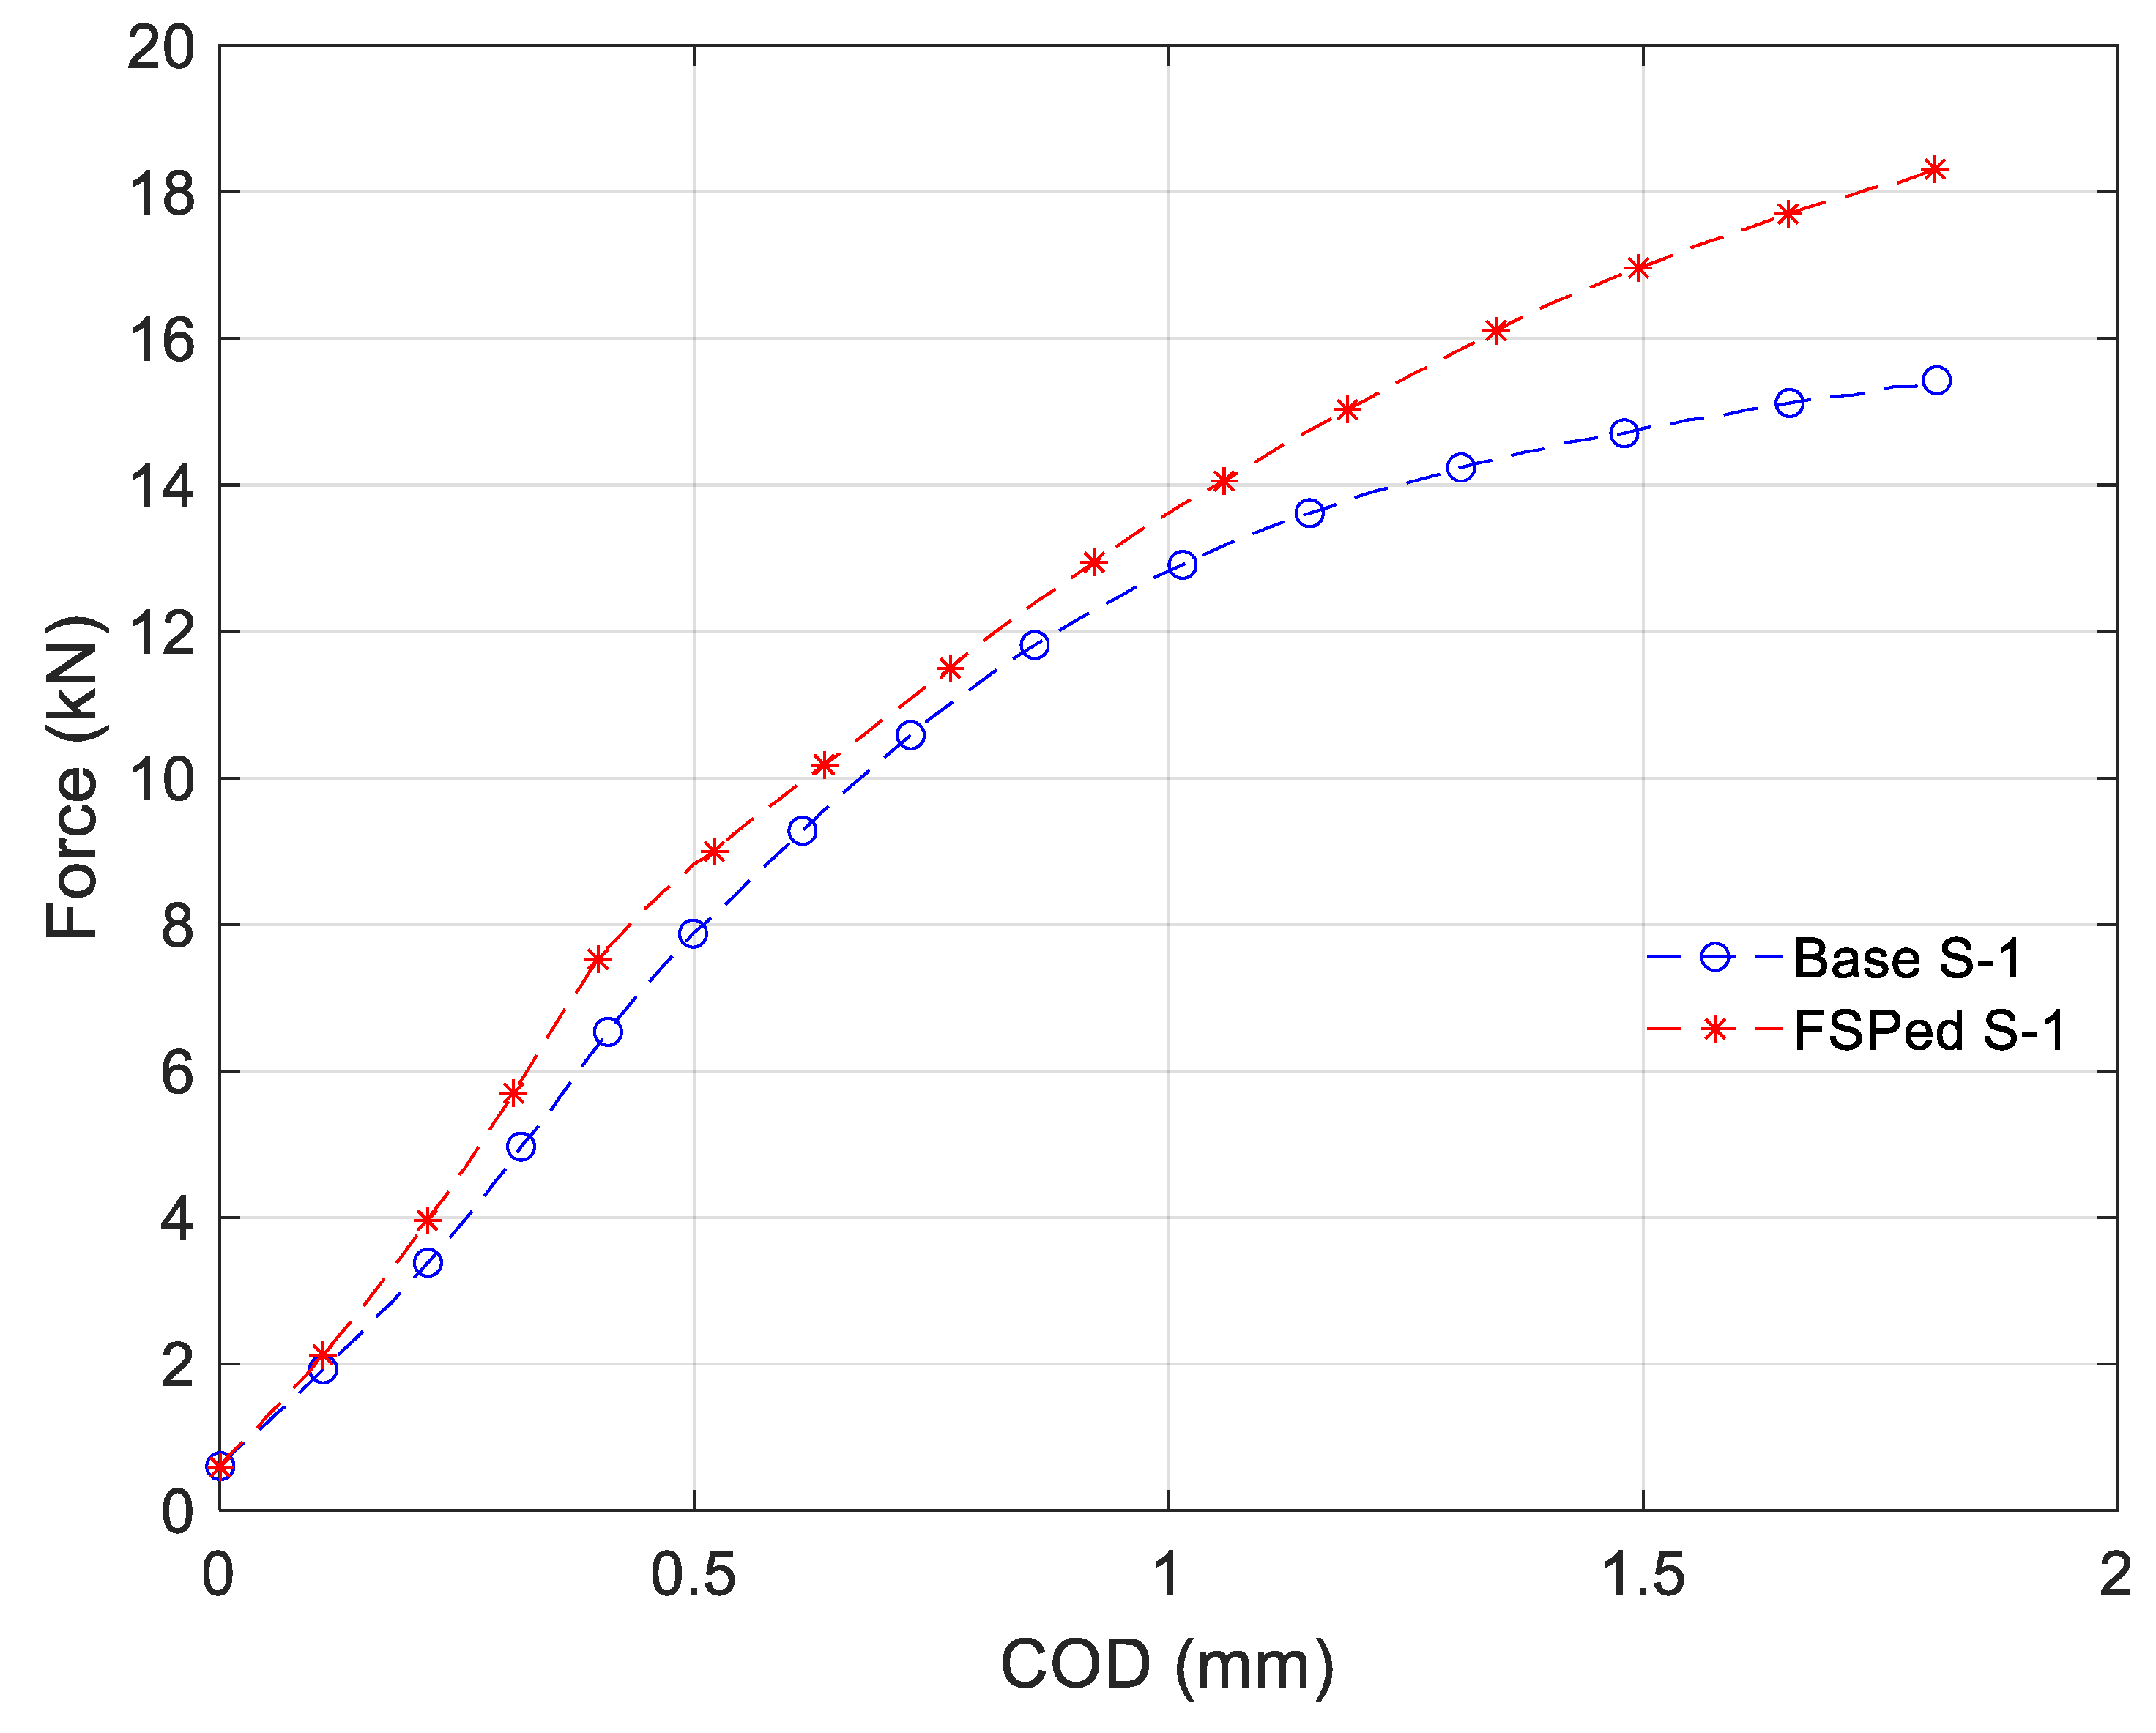
Figure 14 shows the typical variation of the load with crack opening displacement for base and FSPed materials. These load-displacement curves were used with Equations (1)–(5) to estimate the fracture toughness of base and FSPed 2507 SDSS, and the results are shown in Table 5.
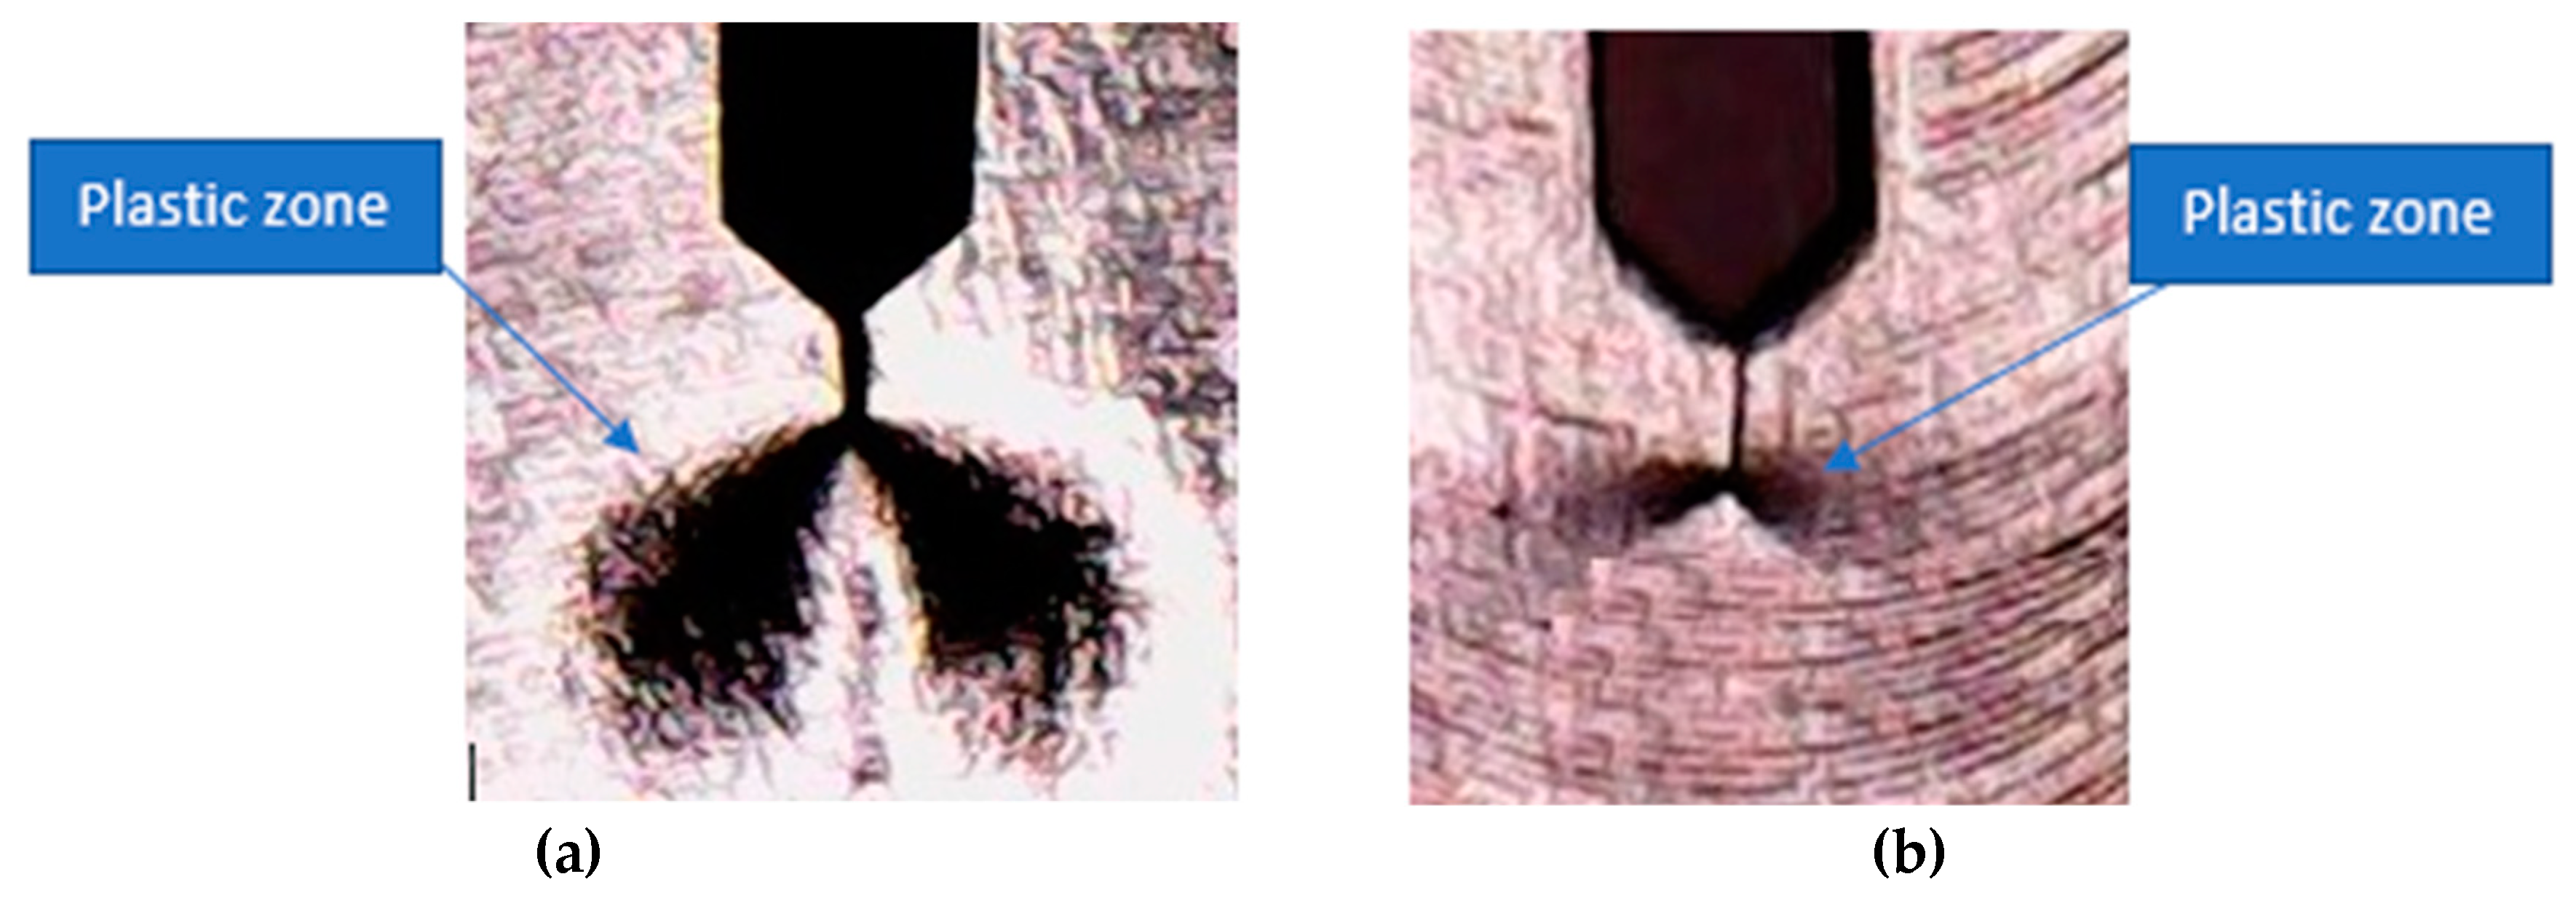
It can be seen from Figure 14 and the results of Table 5 that the fracture toughness of FSPed samples improved to that of the BM by an average close to 12%. This was mainly due to the presence of a larger number of grain boundaries and a smaller plastic zone size which increased the resistance against crack growth. It can be seen in Figure 15 that FSPed material had a smaller plastic zone than the BM. The plastic zone is the region where plastic deformation occurs [38]. FSP reduced the plasticity of the material because a significant number of grain boundaries hindered the dislocation motion more, as discussed in [32], and also the BM had a lower yield stress, and a lower yield stress material has a larger plastic zone than the material of high yield stress [38,39]. This caused a smaller plastic zone in the FSPed material. Therefore, a smaller plastic zone and a significant number of grain boundaries improved the fracture toughness of 2507 SDSS. It can also be noted in Figure 15b that, for the friction stir processed specimen, the crack initiated at the sharp V-notch and propagated in the middle of the stir zone.
Residual stresses may have a negative effect on the strength, hardness, and fracture toughness of metallic materials, especially when they are tensile in nature. The effects of these stresses that develop in the material by FSW/FSP can be compensated by different techniques, such as laser shock processing [40,41].

4. Conclusions

The results of this study proved that the mechanical properties such as the strength, hardness, and fracture toughness of super duplex stainless steel (2507 SDSS) can be improved by optimized friction stir processing (FSP). FSP helped refine the microstructure of the material, which led to the modification of the material properties.
The main conclusions from this investigation are:
  • Microstructure refinement is asymmetric with respect to processed centerline;
  • Grains are finer on the advancing side (AS) in the stir zone because grains on the AS experienced more plastic deformation/strain;
  • FSP increased the yield strength, ultimate strength, and hardness of 2507 SDSS because of grain refinement;
  • FSP increased the fracture toughness of 2507 SDSS because grain refinement increased the grain boundaries, which enhanced the resistance against the crack growth.

Author Contributions

Conceptualization, N.M. and H.M.A.; methodology, N.M., F.A.A.-B., J.A., A.A.S. and H.M.A.; validation, N.M. and H.M.A.; formal analysis, N.M. and H.M.A.; investigation, H.M.A., N.M and; data curation, H.M.A.; writing—original draft preparation, H.M.A.; writing—review and editing, H.M.A., N.M., F.A.A.-B., J.A. and A.A.S.; supervision, N.M. All authors have read and agreed to the published version of the manuscript.

Funding

The authors deeply acknowledge the support provided by King Fahd University of Petroleum and Minerals (KFUPM) for funding this work through internal grant Project No. DF181009.

Conflicts of Interest

The authors declare no conflict of interest.

References

  1. Nirosta, K. Practical Guidelines for the Fabrication of Duplex Stainless Steels. Available online: https://www.imoa.info/download_files/stainless-steel/Duplex_Stainless_Steel_3rd_Edition.pdf (accessed on 18 May 2019).
  2. Wallén, B. Corrosion of duplex stainless steels in seawater. In Avesta Corrosion Management and Application Engineering; Avesta Sheffield AB: Avesta, Sweden, 1998. [Google Scholar]
  3. Mishra, R.S.; Ma, Z.Y. Friction stir welding and processing. Mater. Sci. Eng. R 2005, 50, 1–78. [Google Scholar] [CrossRef]
  4. Sharma, V.; Prakash, U.; Kumar, B.V.M. Surface composites by friction stir processing: A review. J. Mater. Process. Technol. 2015, 224, 117–134. [Google Scholar] [CrossRef]
  5. Emami, S.; Saeid, T.; Khosroshahi, R.A. Microstructural evolution of friction stir welded SAF 2205 duplex stainless steel. J. Alloys Compd. 2018, 739, 678–689. [Google Scholar] [CrossRef]
  6. Emami, S.; Saeid, T.; Azari Khosroshahi, R. Microstructural refining during friction stir processing of SAF 2205 duplex stainless steel. J. Ultrafine Grained Nanostruct. Mater. 2018, 51, 20–25. [Google Scholar]
  7. Esmailzadeh, M.; Shamanian, M.; Kermanpur, A.; Saeid, T. Microstructure and mechanical properties of friction stir welded lean duplex stainless steel. Mater. Sci. Eng. A 2013, 561, 486–491. [Google Scholar] [CrossRef]
  8. Saeid, T.; Abdollah-Zadeh, A.; Assadi, H.; Ghaini, F.M. Effect of friction stir welding speed on the microstructure and mechanical properties of a duplex stainless steel. Mater. Sci. Eng. A 2008, 496, 262–268. [Google Scholar] [CrossRef]
  9. Saeid, T.; Abdollah-zadeh, A.; Shibayanagi, T.; Ikeuchi, K.; Assadi, H. On the formation of grain structure during friction stir welding of duplex stainless steel. Mater. Sci. Eng. A 2010, 527, 6484–6488. [Google Scholar] [CrossRef]
  10. Mishra, M.K.; Rao, A.G.; Balasundar, I.; Kashyap, B.P.; Prabhu, N. On the microstructure evolution in friction stir processed 2507 super duplex stainless steel and its effect on tensile behaviour at ambient and elevated temperatures. Mater. Sci. Eng. A 2018, 719, 82–92. [Google Scholar] [CrossRef]
  11. Sato, Y.S.; Nelson, T.W.; Sterling, C.J.; Steel, R.J.; Pettersson, C.O. Microstructure and mechanical properties of friction stir welded SAF 2507 super duplex stainless steel. Mater. Sci. Eng. A 2005, 397, 376–384. [Google Scholar] [CrossRef]
  12. Santos, T.F.d.A.; Torres, E.A.; Ramirez, A.J. Friction stir welding of duplex stainless steels. Weld. Int. 2018, 32, 103–111. [Google Scholar] [CrossRef]
  13. Meinhardt, C.P.; Scheid, A.; dos Santos, J.F.L.; Bergmann, A.; Favaro, M.B.; Kwietniewski, C.E.F. Hydrogen embrittlement under cathodic protection of friction stir welded UNS S32760 super duplex stainless steel. Mater. Sci. Eng. A 2017, 706, 48–56. [Google Scholar] [CrossRef]
  14. Fairchild, D.; Kumar, A.; Ford, S.; Nissley, N.; Ayer, R.; Jin, H.; Ozekcin, A. Research concerning the friction stir welding of linepipe steels. In Proceedings of the Trends in Welding Research, 8th International Conference, Pine Mountain, GA, USA, 1–6 June 2008; pp. 371–380. [Google Scholar]
  15. Santos, T.; Hermenegildo, T.; Afonso, C.; Marinho, R.; Paes, M.; Ramirez, A. Fracture toughness of ISO 3183 X80M (API 5L X80) steel friction stir welds. Eng. Fract. Mech. 2010, 77, 2937–2945. [Google Scholar] [CrossRef]
  16. Tribe, A.; Nelson, T.W. Study on the fracture toughness of friction stir welded API X80. Eng. Fract. Mech. 2015, 150, 58–69. [Google Scholar] [CrossRef] [Green Version]
  17. Avila, J.A.; Rodriguez, J.; Mei, P.R.; Ramirez, A.J. Microstructure and fracture toughness of multipass friction stir welded joints of API-5L-X80 steel plates. Mater. Sci. Eng. A 2016, 673, 257–265. [Google Scholar] [CrossRef]
  18. Sharma, S.; Mishra, R. Fatigue crack growth behavior of friction stir processed aluminum alloy. Scr. Mater. 2008, 59, 395–398. [Google Scholar] [CrossRef]
  19. ArcelorMittal: Steel Manufacturing. Available online: https://corporate.arcelormittal.com/ (accessed on 1 October 2019).
  20. E8/E8M-16a Standard Test Methods for Tension Testing of Metallic Materials; ASTM International: West Conshohocken, PA, USA, 2016. [CrossRef]
  21. E1820-20 Standard Test Method for Measurement of Fracture Toughness; ASTM International: West Conshohocken, PA, USA, 2020. [CrossRef]
  22. Da Fonseca, E.B.; Santos, T.F.A.; Button, S.T.; Ramirez, A.J. Physical Simulation of a Duplex Stainless Steel Friction Stir Welding by the Numerical and Experimental Analysis of Hot Torsion Tests. Metall. Mater. Trans. A 2016, 47, 4543–4552. [Google Scholar] [CrossRef]
  23. Yuqing, M.; Liming, K.; Fencheng, L.; Yuhua, C.; Li, X. Investigations on temperature distribution, microstructure evolution, and property variations along thickness in friction stir welded joints for thick AA7075-T6 plates. Int. J. Adv. Manuf. Technol. 2016, 86, 141–154. [Google Scholar] [CrossRef]
  24. Seidel, T.; Reynolds, A.P. Visualization of the material flow in AA2195 friction-stir welds using a marker insert technique. Metall. Mater. Trans. A 2001, 32, 2879–2884. [Google Scholar] [CrossRef]
  25. Magnabosco, R. Kinetics of sigma phase formation in a duplex stainless steel. Mater. Res. 2009, 12, 321–327. [Google Scholar] [CrossRef] [Green Version]
  26. Tsai, M.-H.; Tsai, K.-Y.; Tsai, C.-W.; Lee, C.; Juan, C.-C.; Yeh, J.-W. Criterion for sigma phase formation in Cr-and V-containing high-entropy alloys. Mater. Res. Lett. 2013, 1, 207–212. [Google Scholar] [CrossRef] [Green Version]
  27. Li, J.; Liu, X.; Li, G.; Han, P.; Liang, W. Characterization of the microstructure, mechanical properties, and corrosion resistance of a friction-stir-welded joint of hyper duplex stainless steel. Metals 2017, 7, 138. [Google Scholar] [CrossRef]
  28. Sato, Y.S.; Kokawa, H. Preferential precipitation site of sigma phase in duplex stainless steel weld metal. Scr. Mater. 1999, 40, 659–663. [Google Scholar] [CrossRef]
  29. Elmer, J.W.; Palmer, T.A.; Specht, E.D. Direct Observations of Sigma Phase Formation in Duplex Stainless Steels Using In-Situ Synchrotron X-Ray Diffraction. Metall. Mater. Trans. A 2007, 38, 464–475. [Google Scholar] [CrossRef] [Green Version]
  30. Cui, L.; Fujii, H.; Tsuji, N.; Nakata, K.; Nogi, K.; Ikeda, R.; Matsushita, M. Transformation in stir zone of friction stir welded carbon steels with different carbon contents. ISIJ Int. 2007, 47, 299–306. [Google Scholar] [CrossRef] [Green Version]
  31. Morris Jr, J. The Influence of Grain Size on the Mechanical Properties of Steel; Technical Report for Lawrence Berkeley National Lab.: Berkeley, CA, USA, 1 May 2001. [Google Scholar] [CrossRef] [Green Version]
  32. Van Swygenhoven, H. Grain Boundaries and Dislocations. Science 2002, 296, 66–67. [Google Scholar] [CrossRef]
  33. Zhang, M.; Yang, S.; Wan, F. Competition mechanism of brittle–ductile transition of metals under tensile condition. Mech. Mater. 2019, 137, 103138. [Google Scholar] [CrossRef]
  34. Whang, S.-H. Nanostructured Metals and Alloys: Processing, Microstructure, Mechanical properties and Applications; Elsevier: Amsterdam, The Netherlands, 2011. [Google Scholar]
  35. Grain Size and Material Strength. Available online: https://materion.com/-/media/files/alloy/newsletters/technical-tidbits/issue-no-15---grain-size-and-material-strength.pdf (accessed on 10 November 2019).
  36. Sato, Y.S.; Urata, M.; Kokawa, H.; Ikeda, K. Hall–Petch relationship in friction stir welds of equal channel angular-pressed aluminium alloys. Mater. Sci. Eng. A 2003, 354, 298–305. [Google Scholar] [CrossRef]
  37. İriç, S.; Ayhan, A. Dependence of Fracture Toughness on Rolling Direction in Aluminium 7075 Alloys. Acta Phys. Pol. A 2017, 132, 892–895. [Google Scholar] [CrossRef]
  38. Broek, D. The crack tip plastic zone. In Elementary Engineering Fracture Mechanics; Springer: Dordrecht, The Netherlands, 1982; pp. 91–114. [Google Scholar]
  39. Lewinsohn, C. Mechanical Behavior of Materials by Norman E. Dowling. Mater. Manuf. Processes 2000, 15, 775–776. [Google Scholar] [CrossRef]
  40. Moghadam, D.G.; Farhangdoost, K. Influence of welding parameters on fracture toughness and fatigue crack growth rate in friction stir welded nugget of 2024-T351 aluminum alloy joints. Trans. Nonferrous Met. Soc. China 2016, 26, 2567–2585. [Google Scholar] [CrossRef]
  41. Rubio-González, C.; Ocaña, J.L.; Gomez-Rosas, G.; Molpeceres, C.; Paredes, M.; Banderas, A.P.; Morales, M. Effect of laser shock processing on fatigue crack growth and fracture toughness of 6061-T6 aluminum alloy. Mater. Sci. Eng. A 2004, 386, 291–295. [Google Scholar] [CrossRef]
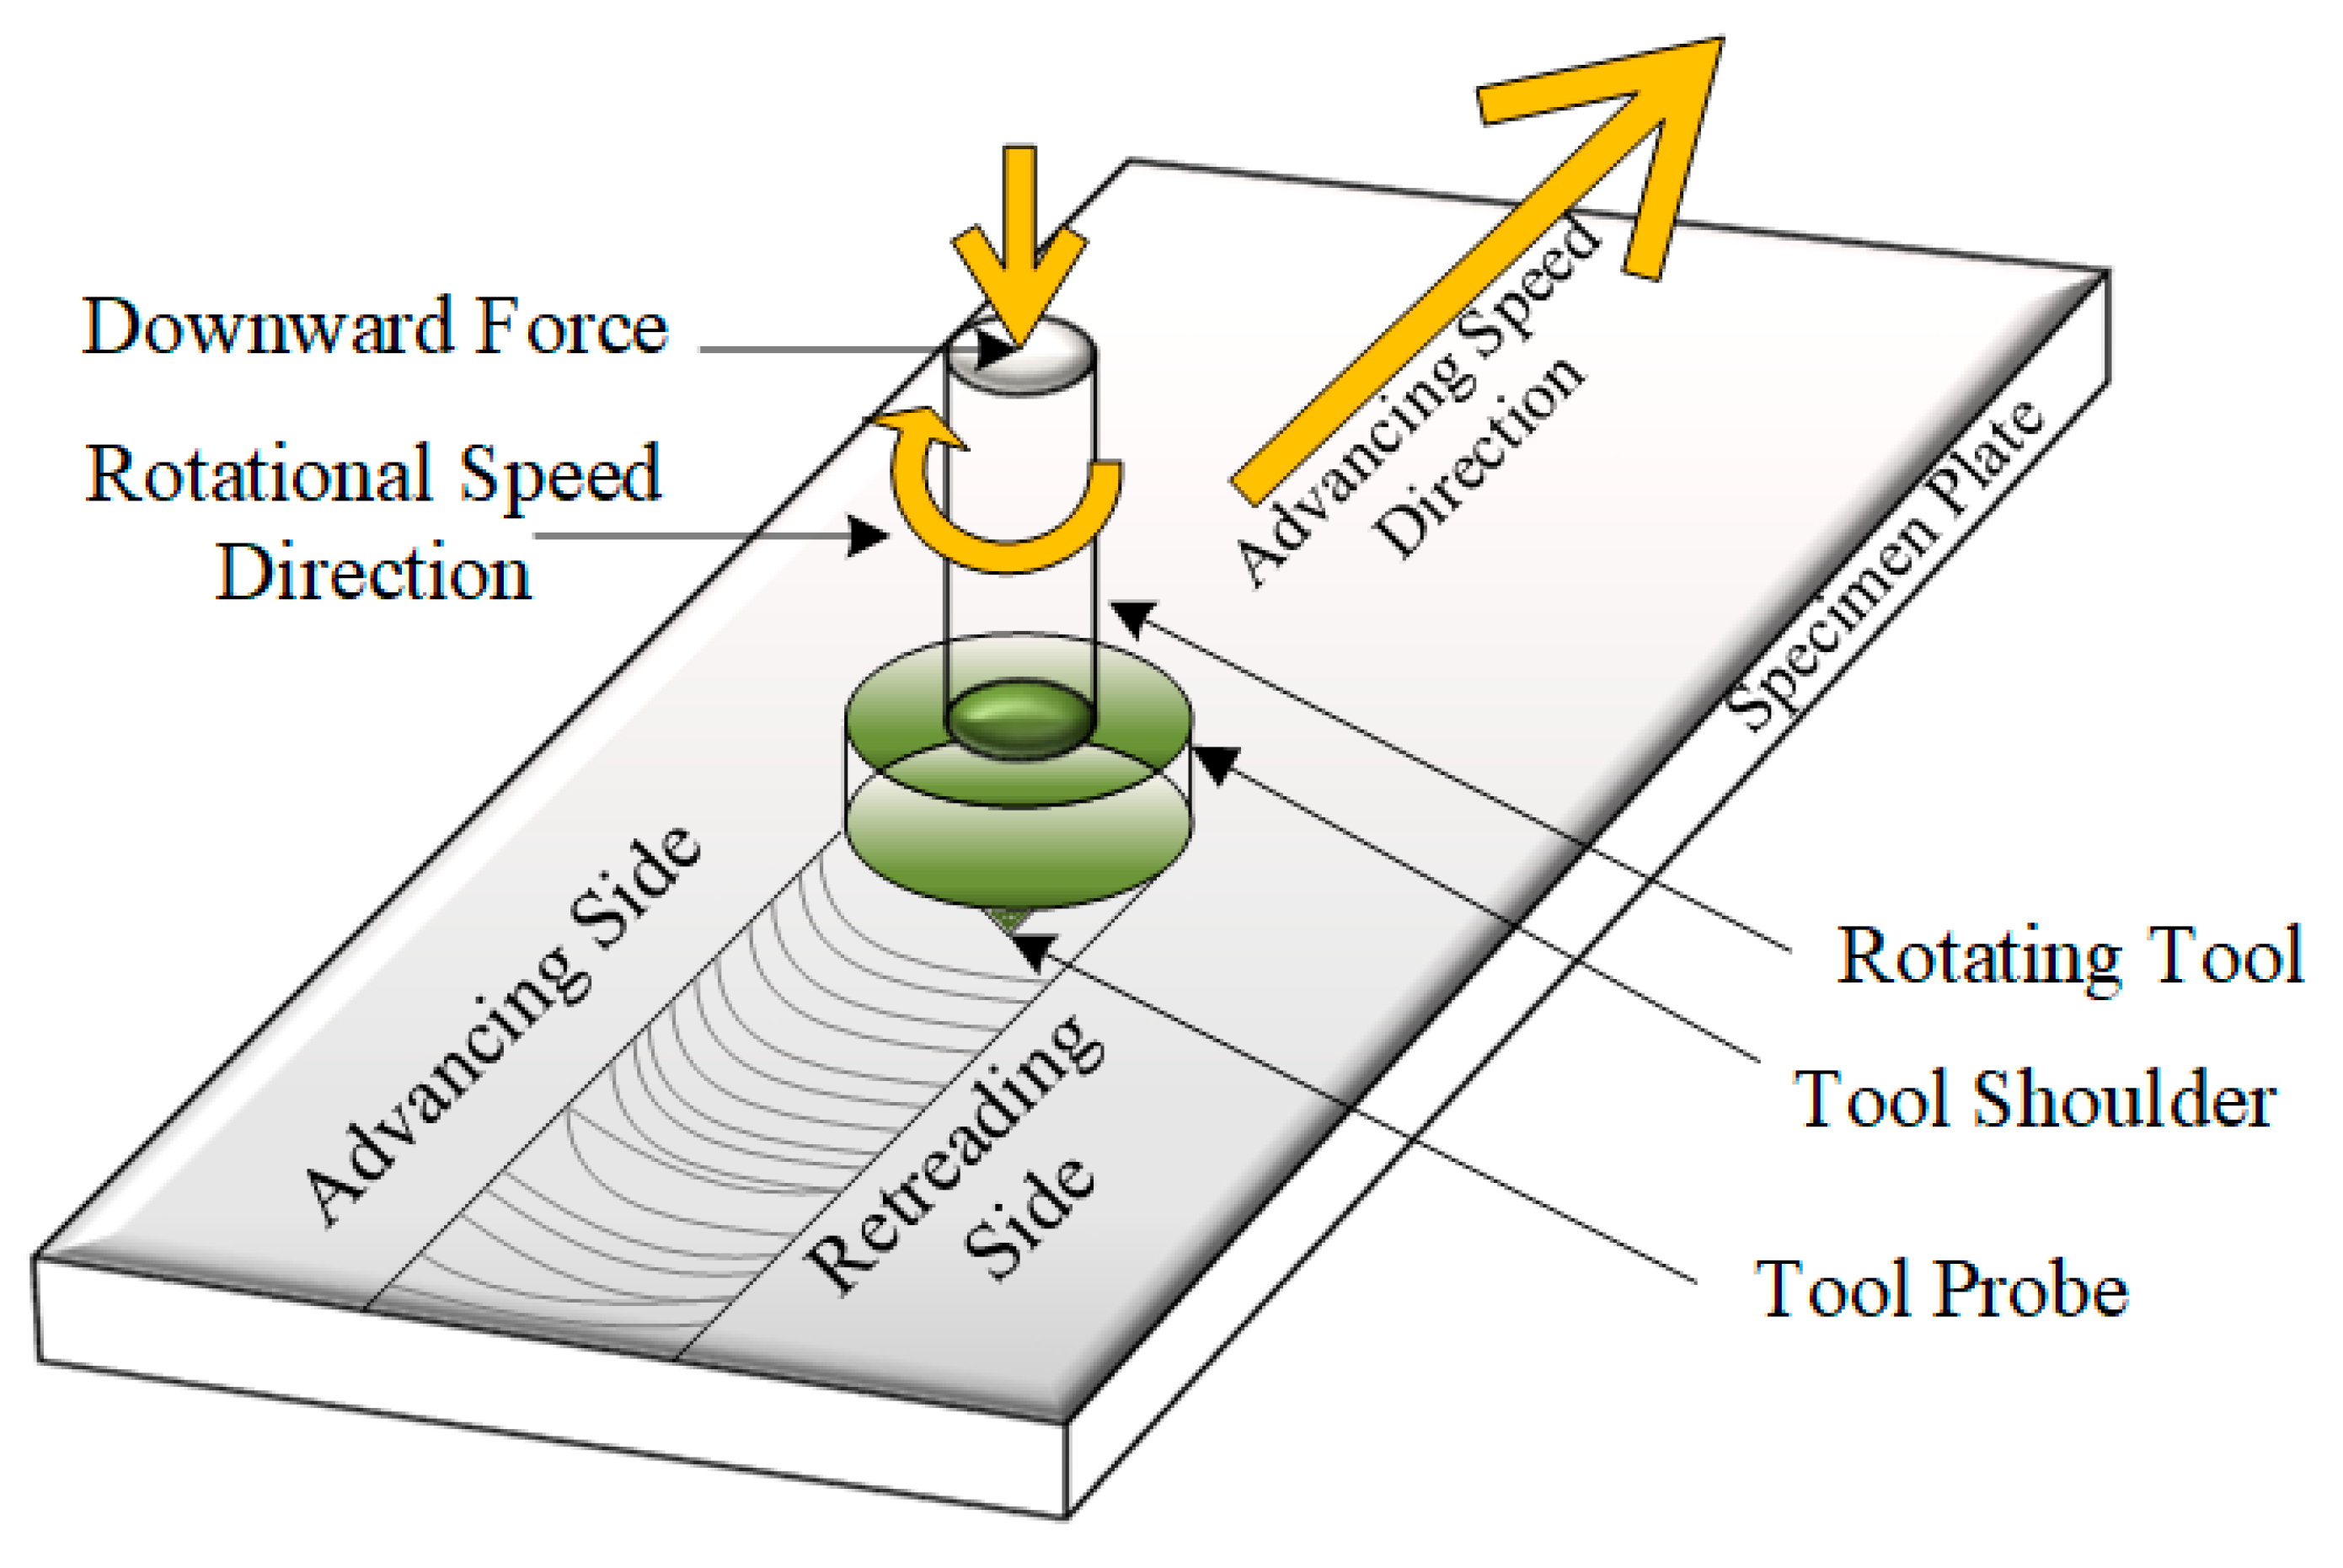
Figure 1. Friction stir processing (FSP) Representation.
Metals 10 00369 g001
Figure 2. RM-1 friction stir welder and FSP tool: (a) friction stir welder, (b) tool profile.
Metals 10 00369 g002
Figure 3. Tensile sample: (a) geometry and dimensions in mm, (b) sample location in the processed area.
Metals 10 00369 g003
Figure 4. Microhardness measurement points in the stir zone (SZ).
Metals 10 00369 g004
Figure 5. Fracture toughness testing setup on an Instron 8801.
Metals 10 00369 g005
Figure 6. Compact tension (C(T)) sample: (a) geometry and dimensions in mm, (b) location in processed area.
Metals 10 00369 g006
Figure 7. A p l area definition from load-displacement curve.
Metals 10 00369 g007
Figure 8. Microstructural image of 2507 SDSS after FSP, from the base metal (BM) (a), to the thermo-mechanically affected zone (TMAZ) on the advancing side (AS) (b), to the SZ (c), and to TMAZ on the retreating side (RS) (d).
Metals 10 00369 g008
Figure 9. Microstructure of processed material (a) BM, (b) boundary of TMAZ-AS, (c) SZ, and (d) boundary of TMAZ-RS.
Metals 10 00369 g009
Figure 10. XRD of BM and FSPed 2507 SDSS.
Metals 10 00369 g010
Figure 11. Typical tensile stress‒strain curves of BM and friction stir processed (FSPed) 2507 SDSS.
Metals 10 00369 g011
Figure 12. Fractured tensile sample: (a) BM, (b) FSPed metal.
Metals 10 00369 g012
Figure 13. Hardness profile for SZ and BM 2507 SDSS.
Metals 10 00369 g013
Figure 14. Load--crack opening displacement (COD) curves of BM and FSPed 2507 SDSS.
Metals 10 00369 g014
Figure 15. C(T) sample plastic zone after fracture toughness test: (a) BM, (b) FSPed metal.
Metals 10 00369 g015
Table 1. Composition of 2507 super duplex stainless steel (SDSS) [19].
CMnPSSiCuNiCrMoNFePRE-N
0.0260.8470.0270.00020.3560.1146.68125.2993.7290.2758Bal.42
Table 2. FSP parameters and images for optimization of the process.
FSP No.Advancing Speed (mm/min)Plunging Depth (mm)Images
1505.2 Metals 10 00369 i001
21005.8 Metals 10 00369 i002
31506.2 Metals 10 00369 i003
Table 3. Tensile behavior of BM and FSPed 2507 SDSS.
Sample No.Yield Strength
(MPa)
Tensile Strength
(MPa)
Base S-1651.7794.4
Base S-2665.0784.3
Base S-3650.0802.2
Average655.6793.6
FSPed S-1767.4908.4
FSPed S-2769.9904.0
FSPed S-3710.0858.1
Average749.1890.2
% Increase w.r.t* BM14.312.2
* with respect to.
Table 4. Hardness of BM and FSPed 2507 SDSS.
Vickers Hardness (HV)
LocationASCRSBM
1st line327.6310.4326.9276.0
2nd line313.3313.3309.3279.0
3rd line305.4319.1287.7271.8
Average315.4314.3308.0275.6
Table 5. Influence of FSP on the fracture toughness of 2507 SDSS.
Sample No. a 0
(mm)
Peak Load
(N)
J e l   ( KJ / m 2 ) J p l   ( KJ / m 2 ) J
(KJ/m2)
J
Avg.
(KJ/m2)
Base S-120.415429.865.1212.9276.3272.9
Base S-220.514573.559.1214.2269.5
FSPed S-120.118312.986.9220.2306.9304.7
FSPed S-219.119646.386.2216.5302.5
Improvement11.7%